Scolaris Content Display Scolaris Content Display

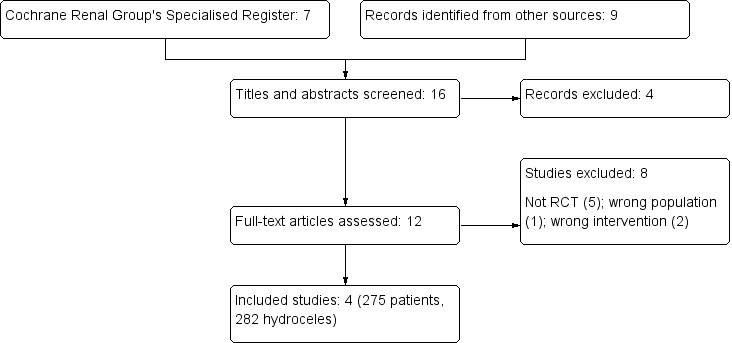
Study selection flow diagram.
Figuras y tablas -
Figure 1

Study selection flow diagram.

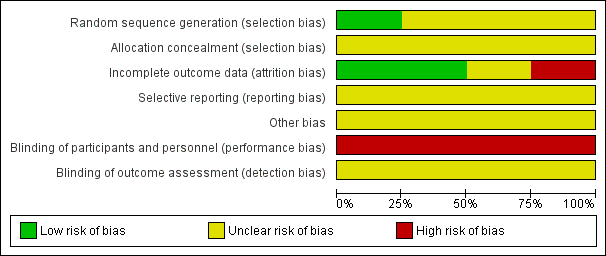
Risk of bias graph: review authors' judgements about each risk of bias item presented as percentages across all included studies.
Figuras y tablas -
Figure 2

Risk of bias graph: review authors' judgements about each risk of bias item presented as percentages across all included studies.

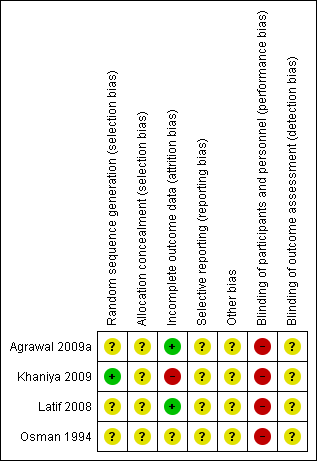
Risk of bias summary: review authors' judgements about each risk of bias item for each included study.
Figuras y tablas -
Figure 3

Risk of bias summary: review authors' judgements about each risk of bias item for each included study.

Comparison 1 Aspiration and sclerotherapy versus hydrocoelectomy, Outcome 1 Clinical cure.
Figuras y tablas -
Analysis 1.1

Comparison 1 Aspiration and sclerotherapy versus hydrocoelectomy, Outcome 1 Clinical cure.

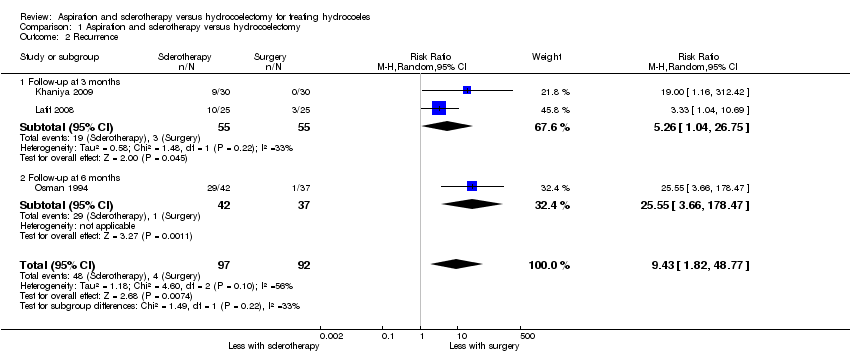
Comparison 1 Aspiration and sclerotherapy versus hydrocoelectomy, Outcome 2 Recurrence.
Figuras y tablas -
Analysis 1.2

Comparison 1 Aspiration and sclerotherapy versus hydrocoelectomy, Outcome 2 Recurrence.

Comparison 1 Aspiration and sclerotherapy versus hydrocoelectomy, Outcome 3 Fever.
Figuras y tablas -
Analysis 1.3

Comparison 1 Aspiration and sclerotherapy versus hydrocoelectomy, Outcome 3 Fever.

Comparison 1 Aspiration and sclerotherapy versus hydrocoelectomy, Outcome 4 Infection.
Figuras y tablas -
Analysis 1.4

Comparison 1 Aspiration and sclerotherapy versus hydrocoelectomy, Outcome 4 Infection.

Comparison 1 Aspiration and sclerotherapy versus hydrocoelectomy, Outcome 5 Haematoma.
Figuras y tablas -
Analysis 1.5

Comparison 1 Aspiration and sclerotherapy versus hydrocoelectomy, Outcome 5 Haematoma.

Comparison 1 Aspiration and sclerotherapy versus hydrocoelectomy, Outcome 6 Time to work resumption.
Figuras y tablas -
Analysis 1.6

Comparison 1 Aspiration and sclerotherapy versus hydrocoelectomy, Outcome 6 Time to work resumption.

Comparison 1 Aspiration and sclerotherapy versus hydrocoelectomy, Outcome 7 Satisfaction.
Figuras y tablas -
Analysis 1.7

Comparison 1 Aspiration and sclerotherapy versus hydrocoelectomy, Outcome 7 Satisfaction.

Comparison 1. Aspiration and sclerotherapy versus hydrocoelectomy

Outcome or subgroup title

No. of studies

No. of participants

Statistical method

Effect size

1 Clinical cure Show forest plot

3

Risk Ratio (M‐H, Random, 95% CI)

Subtotals only

1.1 One round of sclerotherapy

3

215

Risk Ratio (M‐H, Random, 95% CI)

0.45 [0.18, 1.10]

1.2 Two rounds of sclerotherapy

2

129

Risk Ratio (M‐H, Random, 95% CI)

0.58 [0.21, 1.65]

1.3 Osman 1994 removed (one round of sclerotherapy)

2

136

Risk Ratio (M‐H, Random, 95% CI)

0.74 [0.64, 0.85]

2 Recurrence Show forest plot

3

189

Risk Ratio (M‐H, Random, 95% CI)

9.43 [1.82, 48.77]

2.1 Follow‐up at 3 months

2

110

Risk Ratio (M‐H, Random, 95% CI)

5.26 [1.04, 26.75]

2.2 Follow‐up at 6 months

1

79

Risk Ratio (M‐H, Random, 95% CI)

25.55 [3.66, 178.47]

3 Fever Show forest plot

1

Risk Ratio (M‐H, Random, 95% CI)

Totals not selected

4 Infection Show forest plot

4

275

Risk Ratio (M‐H, Random, 95% CI)

0.31 [0.09, 1.06]

5 Haematoma Show forest plot

3

189

Risk Ratio (M‐H, Random, 95% CI)

0.57 [0.17, 1.90]

6 Time to work resumption Show forest plot

1

Mean Difference (IV, Random, 95% CI)

Totals not selected

7 Satisfaction Show forest plot

1

Risk Ratio (M‐H, Random, 95% CI)

Totals not selected

7.1 At 3 months

1

Risk Ratio (M‐H, Random, 95% CI)

0.0 [0.0, 0.0]

7.2 At 6 months

1

Risk Ratio (M‐H, Random, 95% CI)

0.0 [0.0, 0.0]

Figuras y tablas -
Comparison 1. Aspiration and sclerotherapy versus hydrocoelectomy