Actividad física, dieta y otras intervenciones conductuales para mejorar la cognición y el rendimiento escolar en niños y adolescentes con obesidad o sobrepeso
Información
- DOI:
- https://doi.org/10.1002/14651858.CD009728.pub4Copiar DOI

- Base de datos:
-
- Cochrane Database of Systematic Reviews
- Versión publicada:
-
- 02 marzo 2018see what's new
- Tipo:
-
- Intervention
- Etapa:
-
- Review
- Grupo Editorial Cochrane:
-
Grupo Cochrane de Problemas de desarrollo, psicosociales y de aprendizaje
- Copyright:
-
- Copyright © 2018 The Authors. Cochrane Database of Systematic Reviews published by John Wiley & Sons, Ltd. on behalf of The Cochrane Collaboration.
- This is an open access article under the terms of the Creative Commons Attribution Licence, which permits use, distribution and reproduction in any medium, provided the original work is properly cited.
Cifras del artículo
Altmetric:
Citado por:
Autores
Contributions of authors
AM, DHS and JS drafted the review protocol.
AM and YL screened the titles and abstracts of potentially eligible studies and reports.
AM, YL, JNB, DHS and JS assessed the full report of potentially relevant studies for eligibility, in consensus, with JJR when necessary.
AM, JS and DHS obtained full‐text translations of non‐English language reports.
AM, YL and DHS extracted the data.
AM performed the data analysis with substantial input from DHS and JNB.
JNB provided expert input on the cognitive outcomes and classifications.
AM and DHS assessed the risk of bias of included studies.
AM drafted the full review with regular input from all review authors.
AM is the guarantor for the review.
Sources of support
Internal sources
-
The University of Edinburgh, UK.
Provided support in the form of salaries for JNB, DHS and JS.
-
The University of Strathclyde, UK.
Provided support in the form of a salary for JJR.
External sources
-
Medical Research Council, UK.
Provided support in the form of a salary for AM (grant number MC UU 12017/14).
-
Chief Scientist Office, UK.
Provided support in the form of a salary for AM (grant number SPHSU14).
-
Cochrane, UK.
This review was completed, in part, through a grant of £5000 from the Cochrane Review Support Programme.
Declarations of interest
Anne Martin ‐ none known.
Josephine N Booth ‐ none known.
Yvonne Laird ‐ none known.
John Sproule ‐ none known.
John J Reilly ‐ none known.
David H Saunders ‐ none known.
Acknowledgements
We are very grateful to the trial authors who provided unpublished outcome data and additional study details. We would like to thank Dr Jung Woo (Jay) Lee, Caterina Fazzi Gómez, Cristina Matthews, Aseman Omidi, Ana Miguel Fonseca Pego, and Maggie Sproule for their help in translating non‐English language publications. We thank Joanne Wilson, Prof Geraldine MacDonald and the other members of the editorial base of the Cochrane Developmental, Psychosocial and Learning Problems Group for their guidance and comments. We are grateful for the assistance of Margaret Anderson in developing the search strategy and conducting the literature search.
Version history
| Published | Title | Stage | Authors | Version |
| 2018 Mar 02 | Physical activity, diet and other behavioural interventions for improving cognition and school achievement in children and adolescents with obesity or overweight | Review | Anne Martin, Josephine N Booth, Yvonne Laird, John Sproule, John J Reilly, David H Saunders | |
| 2018 Jan 29 | Physical activity, diet and other behavioural interventions for improving cognition and school achievement in children and adolescents with obesity or overweight | Review | Anne Martin, Josephine N Booth, Yvonne Laird, John Sproule, John J Reilly, David H Saunders | |
| 2014 Mar 14 | Lifestyle intervention for improving school achievement in overweight or obese children and adolescents | Review | Anne Martin, David H Saunders, Susan D. Shenkin, John Sproule | |
| 2012 Mar 14 | Lifestyle intervention for improving school achievement in overweight or obese children and adolescents | Protocol | Anne Martin, David H Saunders, Susan D. Shenkin, John Sproule | |
Differences between protocol and review
The review title changed to specify the intervention types more precisely, and we used person‐first language to remove stigma.
The author team changed from the protocol to this version of the systematic review. Three new authors joined as co‐authors: Josephine N Booth, Yvonne Laird and John J Reilly. Susan Shenkin was not involved in the update of this review.
We revised the wording in the review objectives in the abstract and main text by providing an example of what we mean by cognitive function in brackets. The wording changed from "cognitive function" to "cognitive function (e.g. executive functions)".
We intended from the outset to select studies based on inclusion criteria; however, we did not state this explicitly in the protocol. The intervention criterion for inclusion was that the study aimed to prevent or treat childhood and adolescent obesity as a primary or secondary outcome through lifestyle interventions. The outcome criterion for inclusion was that studies measured school achievement, cognitive function and future success as defined in Types of outcome measures. We clarified that we restricted the review to the aforementioned outcome measures because the same interventions were studied in the same population for different purposes, e.g. change in body mass index, and were published recently in three other Cochrane Reviews.
We stated in the protocol that studies that included some children and adolescents with overweight would be included in the review only when outcomes for children with obesity or overweight were reported separately. Only a few studies investigated the effects of lifestyle interventions on school achievement or cognitive function or both in a paediatric population with overweight; we therefore did not exclude those studies if results for this population group were not reported separately. We made every effort to contact the authors of those studies to obtain data for the subgroup with obesity or overweight, or both.
In the protocol, we stated that we would include controlled trials. We removed this inclusion criterion and considered only randomised controlled trials, as is was recommended by our Cochrane group.
We provided effect sizes for studies that were inappropriate for inclusion in a meta‐analysis. The protocol stated that we would provide a narrative description of study results derived from those studies.
We intended from the outset to consider the 'Risk of bias' item ‘Comparability of groups at baseline’ to assess the extent of the limitation of unclear risk of bias on randomisation on our confidence in the evidence when using GRADE. We did not state this explicitly in the protocol. We did not consider an unclear risk of selection bias as a serious limitation where we rated the 'Risk of bias' item ‘Comparability of groups at baseline’ as low risk of bias. A low risk of bias in ‘Comparability of groups at baseline’ may suggest adequate randomisation, so we have confidence in the evidence. However, where we rated ‘Comparability of groups at baseline’ as being at unclear or high risk of bias, we considered an unclear risk of bias in randomisation as a serious limitation, and therefore downgraded the quality of evidence to reflect our limited confidence in the evidence.
We have added 'Adverse outcomes' as a primary outcome, and classed 'Cognitive outcomes' as an additional primary outcome.
We added a section on 'Summary of findings' to the Methods.
We removed different intervention types from the subgroup analysis and conducted separate comparisons for each intervention type. The increased number of identified studies allowed us to classify 'multicomponent' interventions in more detail.
At the request of the editorial base, we reported Tau2 as an indicator of statistical heterogeneity in random‐effect models in additional to the I2 statistic.
We did not search Open Grey (previously Open Sigle) and MIT CogNet, as they did not yield any records previously. We did not search the database on Obesity and Sedentary Behaviour Studies (EPPI) because the content had not been updated since the previous searches. We searched Dissertation and Thesis Global instead of the Networked Digital Library of Theses and Dissertations.
We extracted change‐from‐baseline data and entered them in the meta‐analysis, instead of post‐intervention data, where possible.
Keywords
MeSH
Medical Subject Headings (MeSH) Keywords
Medical Subject Headings Check Words
Adolescent; Child; Humans;
PICO

Potential causal links between obesity and impaired cognitive function, school achievement and future success. Reverse causation may also occur when cognitive function, school achievement and future success can impact the 'mediating factors', and both in turn may cause worsening of obesity.

Study flow diagram.

Risk of bias graph: review authors' judgements about each risk of bias item presented as percentages across all included studies.
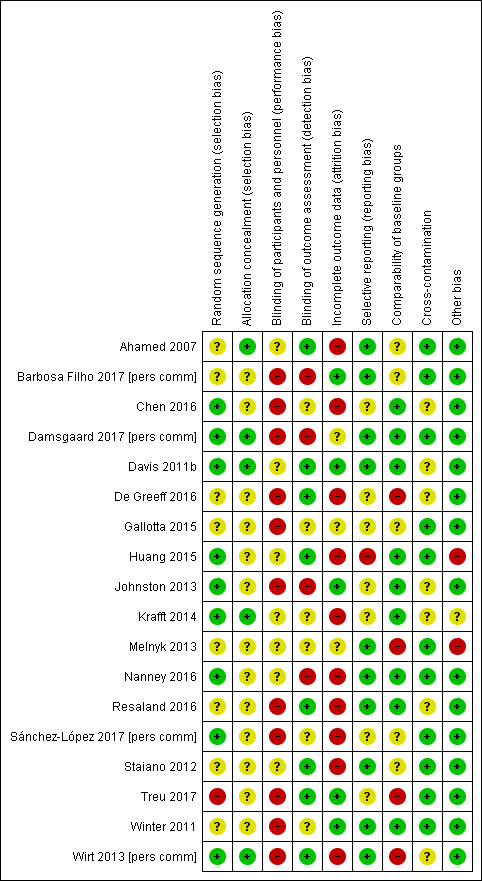
Risk of bias summary: review authors' judgements about each risk of bias item for each included study.
Forest plot of comparison: 4 Lifestyle intervention versus control, outcome: 4.1 BMI z‐score.

Forest plot of comparison: 4 Lifestyle intervention versus control, outcome: 4.2 Total body fat (%).
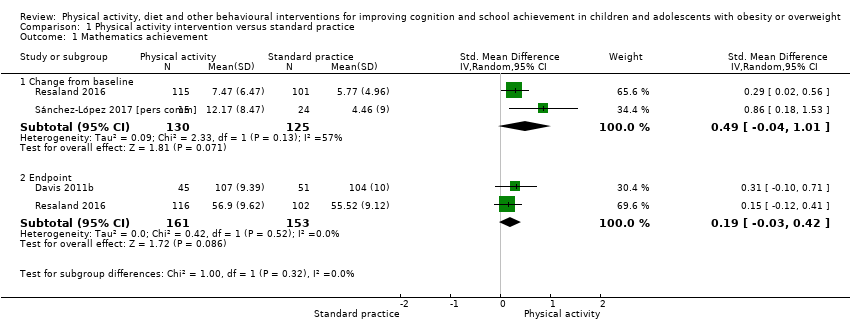
Comparison 1 Physical activity intervention versus standard practice, Outcome 1 Mathematics achievement.

Comparison 1 Physical activity intervention versus standard practice, Outcome 2 Reading achievement.

Comparison 1 Physical activity intervention versus standard practice, Outcome 3 Language achievement.
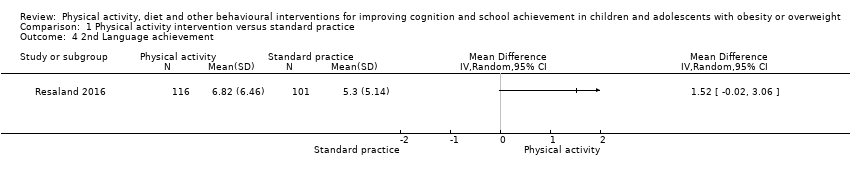
Comparison 1 Physical activity intervention versus standard practice, Outcome 4 2nd Language achievement.

Comparison 1 Physical activity intervention versus standard practice, Outcome 5 Composite executive functions.
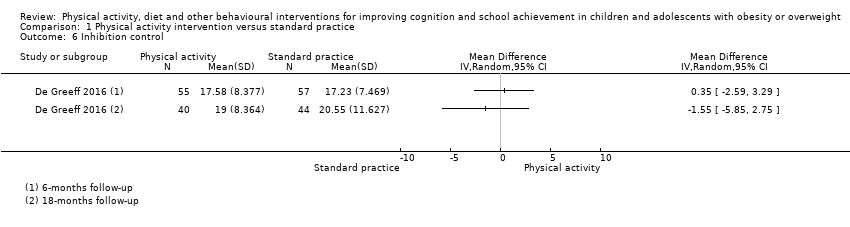
Comparison 1 Physical activity intervention versus standard practice, Outcome 6 Inhibition control.

Comparison 1 Physical activity intervention versus standard practice, Outcome 7 Attention.

Comparison 1 Physical activity intervention versus standard practice, Outcome 8 Verbal working memory.

Comparison 1 Physical activity intervention versus standard practice, Outcome 9 Non‐verbal working memory.

Comparison 1 Physical activity intervention versus standard practice, Outcome 10 Visuo‐spatial abilities.

Comparison 1 Physical activity intervention versus standard practice, Outcome 11 Cognitive flexibility.

Comparison 1 Physical activity intervention versus standard practice, Outcome 12 Non‐verbal memory.

Comparison 1 Physical activity intervention versus standard practice, Outcome 13 General intelligence.
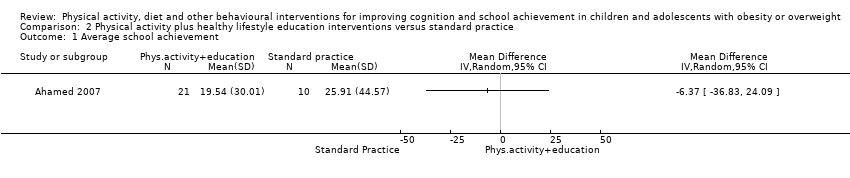
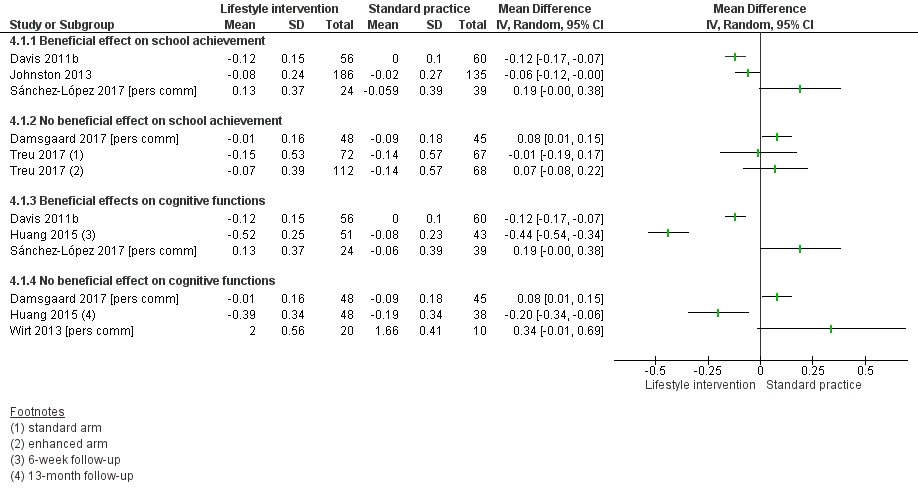
Comparison 2 Physical activity plus healthy lifestyle education interventions versus standard practice, Outcome 1 Average school achievement.

Comparison 2 Physical activity plus healthy lifestyle education interventions versus standard practice, Outcome 2 Mathematics achievement.

Comparison 2 Physical activity plus healthy lifestyle education interventions versus standard practice, Outcome 3 Reading achievement.
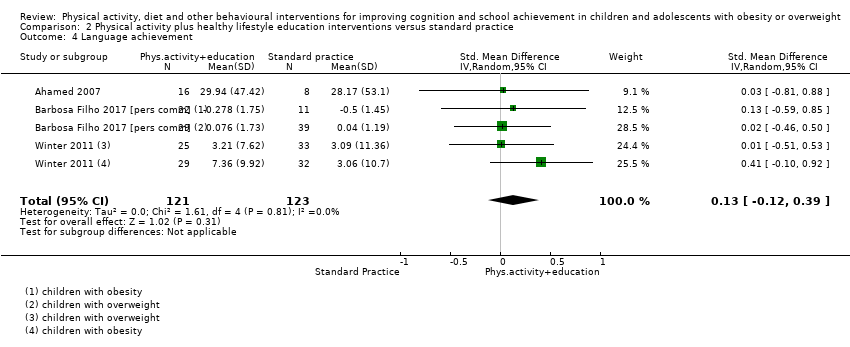
Comparison 2 Physical activity plus healthy lifestyle education interventions versus standard practice, Outcome 4 Language achievement.

Comparison 2 Physical activity plus healthy lifestyle education interventions versus standard practice, Outcome 5 Health class achievement.
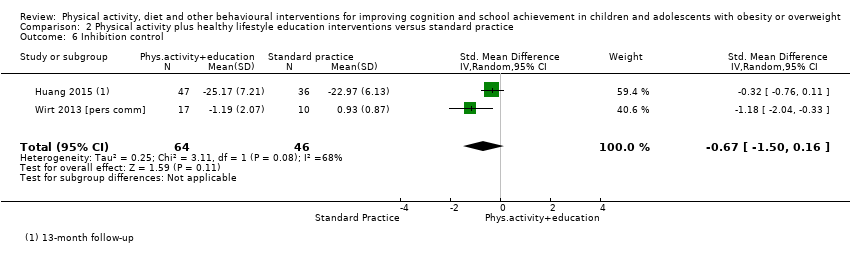
Comparison 2 Physical activity plus healthy lifestyle education interventions versus standard practice, Outcome 6 Inhibition control.
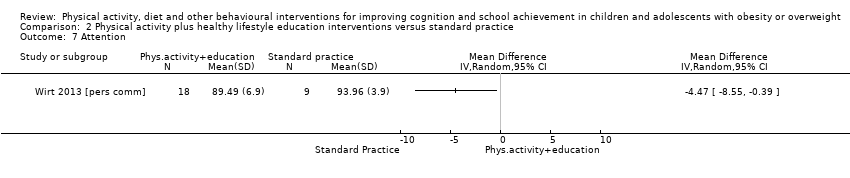
Comparison 2 Physical activity plus healthy lifestyle education interventions versus standard practice, Outcome 7 Attention.

Comparison 2 Physical activity plus healthy lifestyle education interventions versus standard practice, Outcome 8 Visuo‐spatial abilities.
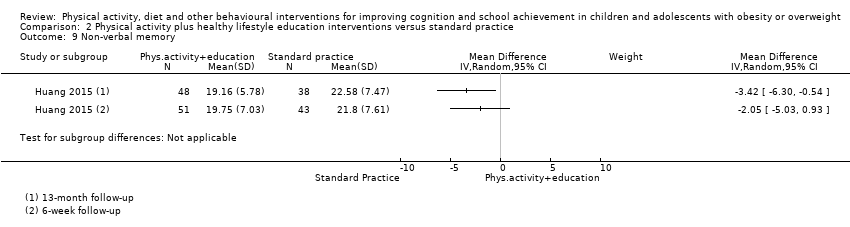
Comparison 2 Physical activity plus healthy lifestyle education interventions versus standard practice, Outcome 9 Non‐verbal memory.
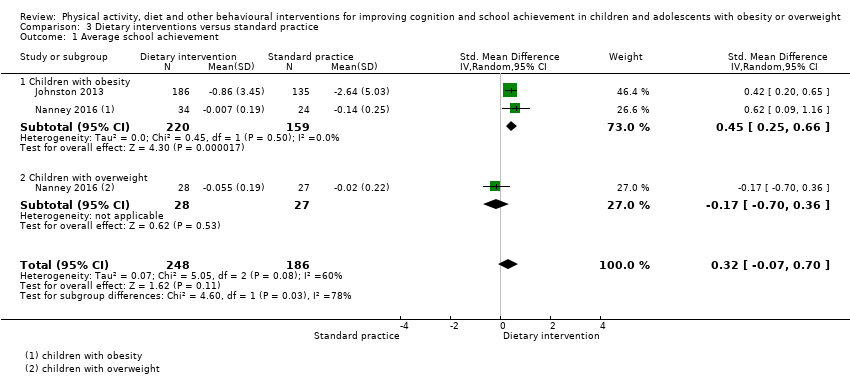
Comparison 3 Dietary interventions versus standard practice, Outcome 1 Average school achievement.
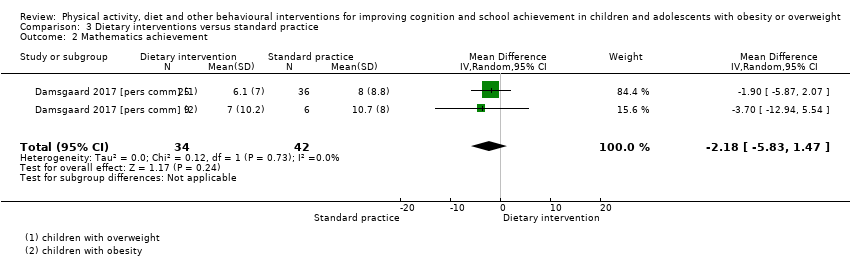
Comparison 3 Dietary interventions versus standard practice, Outcome 2 Mathematics achievement.

Comparison 3 Dietary interventions versus standard practice, Outcome 3 Reading achievement.
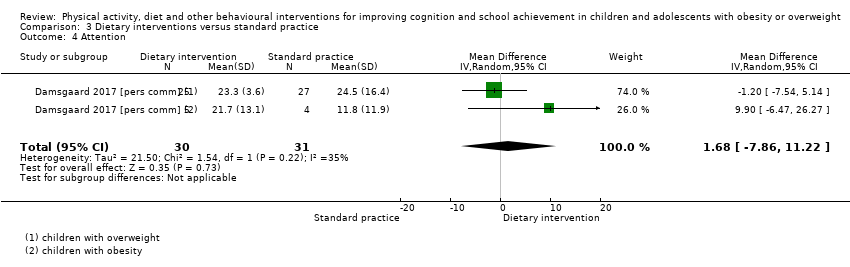
Comparison 3 Dietary interventions versus standard practice, Outcome 4 Attention.

Comparison 4 Lifestyle intervention versus control, Outcome 1 BMI z‐score.

Comparison 4 Lifestyle intervention versus control, Outcome 2 Total body fat (%).
| Physical activity interventions compared to standard practice for improving cognition and school achievement in children and adolescents with obesity or overweight | ||||||
| Patient or population: Children and adolescents with obesity or overweight | ||||||
| Outcomes | Illustrative comparative risks* (95% CI) | Relative effect | № of participants | Quality of the evidence | Comments | |
| Assumed risk Standard practice | Corresponding risk Physical activity | |||||
| School achievement: Average achievement across subjects taught at school | ‐ | ‐ | ‐ | (0 studies) | ‐ | No data available |
| School achievement: Mathematics Assessed with: standardised national tests, BADyG‐I (numerical quantitative concepts) Follow‐up: range 13 weeks to 1 year immediately post‐intervention | ‐ | Compared to the control group, the mean mathematics achievement score in the intervention group was0.49 standard deviations higher (0.04 lower to 1.01 higher) | ‐ | 255 | ⊕⊕⊕⊝ | A standard deviation of 0.49 represents a moderate difference between groups |
| School achievement: Reading Assessed with: WJ‐II test of achievement, standardised national tests Follow‐up: range 13 weeks to 7 months immediately post‐intervention | ‐ | Compared to the control group, the mean reading achievement score in the intervention group was 0.10 standard deviations higher (0.30 lower to 0.49 higher) | ‐ | 308 | ⊕⊕⊕⊝ | A standard deviation of 0.10 represents a small difference between groups |
| School achievement: Additional educational support needs | ‐ | ‐ | ‐ | (0 studies) | ‐ | No data available |
| Cognitive function: Composite executive functions Assessed with: CAS Follow‐up: 13 weeks immediately post‐intervention | The mean composite executive functions score in the control group was 102 scale points | The mean composite executive functions score in the intervention group was 5.00 points higher (0.68 higher to 9.32 higher) | ‐ | 116 | ⊕⊕⊕⊕ | ‐ |
| Cognitive function: Inhibition control Assessed with: SCWT, scale range: 0 to 100 Follow‐up: mean 18 months immediately post‐intervention | The mean inhibition control score in the control group was 20.55 scale points | The mean inhibition control score in the intervention group was 1.55 points lower (5.85 lower to 2.75 higher) | ‐ | 84 | ⊕⊝⊝⊝ | ‐ |
| Adverse events | ‐ | ‐ | ‐ | (0 studies) | ‐ | No data available |
| *The effect sizes are differences in standard deviations. To facilitate interpretation we have used rules of thumb in interpretation of effect size (section 12.6.2 in Higgins 2011), where a standard deviation of 0.2 represents a small difference between groups, 0.5 represents a moderate difference, and 0.8 represents a large difference. ** Different assessment tools were used to assess school and cognitive outcomes. We therefore calculated standardised mean differences to assess the effect size between intervention and control groups. WJ: Woodcock‐Johnson; SCWT: Stroop test (colour and words); CAS: Das‐Naglieri‐Cognitive Assessment System; D–KEFS: Delis‐Kaplan Executive Function System; BADyG‐I: [Batería de aptitudes diferenciales y generals] Differential Aptitude Battery‐ General scale. MD: Mean difference, SMD: Standardised mean difference CI: Confidence interval | ||||||
| GRADE Working Group grades of evidence | ||||||
| 1Downgraded one level due to high risk of attrition bias. | ||||||
| Physical activity plus healthy lifestyle education interventions compared to standard practice for improving cognition and school achievement in children and adolescents with obesity or overweight | ||||||
| Patient or population: Children and adolescents with obesity or overweight | ||||||
| Outcomes | Illustrative comparative risks* (95% CI) | Relative effect | № of participants | Quality of the evidence | Comments | |
| Assumed risk Standard practice | Corresponding risk Physical activity plus healthy lifestyle education | |||||
| School achievement: Average achievement across subjects taught at school Assessed with: CAT‐3, scale mean 500, SD 70 Follow‐up: 12 months immediately post‐intervention | The mean score for average achievement across subjects taught at school in the control group was 19.50 grade points | The mean score for average achievement across subjects taught at school in the intervention group was 6.37 grade points lower (36.83 lower to 24.09 higher) | ‐ | 31 (1 RCT) | ⊕⊕⊝⊝ | ‐ |
| School achievement: Mathematics Assessed with: CAT‐3, standardised national tests, M‐CAT Follow‐up: range 4 months to 12 months immediately post‐intervention | ‐ | Compared to the control group, the mean mathematics achievement score in the intervention group was 0.02 standard deviations higher (0.19 lower to 0.22 higher) | ‐ | 384 | ⊕⊝⊝⊝ | A standard deviation of 0.02 represents a small difference between groups |
| School achievement: Reading Assessed with: CAT‐3, R‐CBM Follow‐up: mean 1 year immediately post‐intervention | ‐ | Compared to the control group, the mean reading achievement score in the intervention group was 0 standard deviations higher (0.24 lower to 0.24 higher) | ‐ | 284 | ⊕⊕⊝⊝ | A standard deviation of zero represents no difference between groups |
| School achievement: Additional educational support needs | ‐ | ‐ | ‐ | (0 studies) | ‐ | No data available |
| Cognitive function: Composite executive functions | ‐ | ‐ | ‐ | (0 studies) | ‐ | No data available |
| Cognitive function: Inhibition control Assessed with: SCWT, KiTAP (Go/No‐go) Follow‐up: range 12 months to 13 months immediately post‐intervention | ‐ | Compared to the control group, the mean inhibition control score in the intervention group was0.67 standard deviations lower (1.50 lower to 0.16 higher) | ‐ | 110 | ⊕⊕⊝⊝ | A standard deviation of 0.67 represents a moderate difference between groups |
| Adverse events | ‐ | ‐ | ‐ | (0 studies) | ‐ | No data available |
| *The effect sizes are differences in standard deviations. To facilitate interpretation we have used rules of thumb in interpretation of effect size (section 12.6.2 in Higgins 2011), where a standard deviation of 0.2 represents a small difference between groups, 0.5 represents a moderate difference, and 0.8 represents a large difference. ** Different assessment tools were used to assess school and cognitive outcomes. We therefore calculated standardised mean differences to assess the effect size between intervention and control groups. CAT‐3: Canadian Achievement Test, version 3; M‐CAT: Mathematics Concepts and Applications Test; R‐CBM: Reading–Curriculum‐Based Measurement; PPVT III: Peabody Picture Vocabulary Test, version 3; SCWT: Stroop test (colour and words); KiTAP: [Kinderversion der Testbatterie zur Aufmerksamkeitsprüfung] Attention test battery for children; RCFT: Rey Complex Figure Test; CI: Confidence interval; SMD: Standardised mean difference | ||||||
| GRADE Working Group grades of evidence | ||||||
| 1Downgraded two levels due high risk of bias in attrition and unclear risk of bias for randomisation. | ||||||
| Dietary interventions compared to control for improving cognition and school achievement in children and adolescents with overweight and obesity | ||||||
| Patient or population: Children and adolescents with obesity or overweight | ||||||
| Outcomes | Illustrative comparative risks* (95% CI) | Relative effect | № of participants | Quality of the evidence | Comments | |
| Assumed risk Standard practice | Corresponding risk Dietary intervention | |||||
| School achievement: Average achievement across subjects taught at school Assessed with: teacher‐assessed grades Follow‐up: range 1 year to 2 years immediately post‐intervention | ‐ | Compared to the control group, the mean score for average achievement across subjects taught at school was 0.46 standard deviations higher (0.25 higher to 0.66 higher) in the intervention group | ‐ | 382 | ⊕⊕⊝⊝ | A standard deviation of 0.46 represents a moderate difference between groups |
| School achievement: Mathematics Assessed with: standard national test, scale range 0 to 69 Follow‐up: mean 3 months immediately post‐intervention | The mean change in mathematics achievement score ranged across control groups from 8.00 to 10.70 scale points | The mean change in mathematics achievement score in the intervention group was 2.18 scale points lower (5.83 lower to 1.47 higher) | ‐ | 76 | ⊕⊕⊝⊝ | ‐ |
| School achievement: Reading Assessed with: standard national test, scale range 0 to 108 Follow‐up: mean 3 months immediately post‐intervention | The mean change in reading achievement score ranged across control groups from 7.40 to 9.20 scale points | The mean change in reading achievement score in the intervention group was 1.17 scale points higher (4.40 lower to 6.73 higher) | ‐ | 67 | ⊕⊕⊝⊝ | ‐ |
| School achievement: Additional educational support needs | ‐ | ‐ | ‐ | (0 studies) | ‐ | No data available |
| Cognitive function: Composite executive function | ‐ | ‐ | ‐ | (0 studies) | ‐ | No data available |
| Cognitive function: Inhibition control | ‐ | ‐ | ‐ | (0 studies) | ‐ | No data available |
| Adverse events | ‐ | ‐ | ‐ | (0 studies) | ‐ | No data available |
| *The effect sizes are differences in standard deviations. To facilitate interpretation we have used rules of thumb in interpretation of effect size (section 12.6.2 in Higgins 2011), where a standard deviation of 0.2 represents a small difference between groups, 0.5 represents a moderate difference, and 0.8 represents a large difference. ** Different assessment tools were used to assess school and cognitive outcomes. We therefore calculated standardised mean differences to assess the effect size between intervention and control groups. SMD: Standardised mean difference; MD: mean difference; CI: Confidence interval | ||||||
| GRADE Working Group grades of evidence | ||||||
| 1Downgraded two levels due to high risk of detection and attrition bias. | ||||||
| STUDY | INTERVENTION CONTENT |
| Physical activity only interventions | |
| Group physical activity programme including multiple types of moderate‐intensity exercises performed 4 times/week for 40 minutes per session (5 minutes each for warm‐up and cool‐down, 30 minutes for the main exercise). The participants were free to choose one of the provided exercise types (e.g. fast walking, stair climbing, jumping rope, or aerobic dancing), with an emphasis on maintaining a moderate intensity of 60% to 70% of the maximal heart rate. Intervention was offered during the school day in the morning, during lunch break, or after school for 3 months | |
| Aerobic group exercise for 40 minutes 5 times/week, over a mean total of 13 weeks. Five‐minute warm‐up phase consisted of brisk walking and static and dynamic stretching. Children were encouraged to maintain a heart rate > 150 beats/minute during running games, tag games, jump rope, modified basketball and football. The intervention involved no competition or skill enhancement and was delivered in an after‐school setting | |
| Fit en Vaardig op school (Fit and academically proficient at school) involved physically active academic lessons which ran over 44 weeks in total over 2 school years with 3 lessons/week. The lessons had a duration of 20 – 30 minutes, with 10 – 15 minutes spent on solving mathematical problems and 10 – 15 minutes spent on language. During the lessons all children started with performing a basic exercise, such as jogging, hopping in place or marching. A specific exercise was performed when the children solved an academic task. The physical activities were aimed to be of moderate‐to‐vigorous intensity | |
| The 2 intervention conditions had the same structure and took place in the school. They included 15 minutes of warm‐up, 30 minutes of moderate‐to‐vigorous physical activities, and 15 minutes of cool‐down and stretching. The traditional physical activity intervention consisted of continuous aerobic circuit training followed by a sub‐maximal shuttle run exercise. This intervention focused on the improvement of cardiovascular endurance by performing different types of gaits (e.g. fast walking, running, skipping) without any specific co‐ordinative request. The co‐ordinative physical activity intervention focused on the development of psychomotor competences and expertise in movement‐based problem‐solving through functional use of a common tool (e.g. basketball), and considering various tasks that involved decision‐making motor tasks and manipulative ball‐handling skills | |
| See Davis 2011b. The intervention duration was extended to 8 months. | |
| MOVI‐KIDS is a multidimensional intervention that consisted of a standardised extra‐curricular non‐competitive physical activity programme of 4½ hours/week; informative sessions to parents and teachers about how schoolchildren can become more active, and interventions in the playground (environmental changes: equipment, facilities, painting, etc.) aimed to promote physical activity during recess (MOVI‐Playground) | |
| Nintendo Wii EA Sports Active exergame played in competitive condition individually or in co‐operative condition in pairs for 30 to 60 minutes, 5 days/week, over a period of 10 weeks in total. The fitness video game included cardio activities (e.g. inline skating), sports games (basketball, volleyball, tennis, baseball) and strength training | |
| The Active Smarter Kids (ASK) programme comprised 3 components: i) physically active lessons for 90 minutes/week, conducted in the playground; physically active educational lessons were delivered in 3 core subjects – Norwegian (30 minutes/ week), mathematics (30 minutes/week) and English (30 minutes/week); ii) physical activity breaks (5 minutes/day) implemented in the classroom during academic lessons; and iii) physical activity homework (10 minutes/day) | |
| Physical activity plus healthy lifestyle education | |
| Action Schools! BC was a comprehensive, multicomponent intervention providing tools for schools and teachers to use in promoting physical activity and healthy eating in different settings. These include the school environment (healthy eating posters), scheduled Physical Education, classroom action, family and community (e.g. walking school bus), extracurricular activities (e.g. dance club) and school spirit (e.g. Hike across Canada challenge) | |
| Fortaleça sua Saúde ('Strengthen your health') focused on teachers' training and activities on health in the curriculum (including a specific training to Physical Education teachers), active opportunities in the school environment (availability of spaces and materials for physical activity) and health education (production and exhibition of health material at school, and distributing pamphlets to students and parents) | |
| The day‐camp intervention comprised 2 parts: an intensive six‐week day camp intervention and a subsequent 46‐week family‐based intervention programme (13‐month [52 weeks] in total). Children were engaged in physical activity and sports for at least 3 hours a day, achieving about 90 minutes of moderate‐to‐vigorous physical activity per day measured by accelerometry. After the day camp, one physical activity day was offered as part of the family‐based intervention programme. Healthy lifestyle education topics during the 6‐week day camp included nutrition, physical activity and health, and goal‐setting. The family‐based intervention programme comprised 4 parents‐involved meetings targeting daily physical activity and dietary behaviour. In the day camp, 3 meals and 3 snacks were prepared and served according to the national dietary recommendations with no caloric restrictions | |
| COPE (Creating Opportunities for Personal Empowerment) programme was a manualised 15‐session educational and cognitive–behavioural skills‐building programme. Each session of COPE contains 15 – 20 minutes of physical activity (e.g. walking, dancing, kick‐boxing movements), not intended as an exercise training programme, but rather to build beliefs in the participants that they can engage in and sustain some level of physical activity on a regular basis. Pedometers were used throughout the intervention. Participants were asked to increase their step counts by 10% each week, regardless of baseline levels, and to keep track of their daily steps. The COPE Healthy Lifestyles TEEN (Thinking, Emotions, Exercise, Nutrition) Programme was delivered once a week as part of a school health curriculum. Participants received a COPE manual with homework activities for each of the 15 sessions that reinforced the content and skills in the programme: cognitive‐behavioural skill building (e.g. problem‐solving and emotional and behavioural regulation), nutrition (e.g. food groups, portion sizes, food labelling), and physical activity (e.g. ways to increase physical activity and associated benefits) | |
| The standard intervention arm of the ASCEND intervention consisted of the Nutrition Detectives (ND) programme and the ABC for Fitness (ABC) programme. ND was a 90‐minute programme that aimed to convey the link between food choices and health, convince students of the need to become "supermarket spies" to learn the truth about the foods that they eat. ABC for Fitness offered brief bursts of physical activity in the classroom, spread over the school day. Classroom teachers offered 30 daily minutes of activity bursts. The activity bursts were designed to include a brief warm‐up and cool‐down (e.g. stretching or low‐intensity activity) along with one or more core activities of higher intensity (e.g. hopping, running in place, jumping jacks, or dancing to music). The enhanced intervention arm included the ND and ABC programmes plus reinforcements of their messages to participants and their families in the school, home, and a supermarket. Family‐focused kits were send home including pedometers, walking tips to increase daily steps, a family log for recording steps, local walking trail guides, walking maps for local grocery stores, physical activity tips sheet, suggestions for activity bursts, family activity challenge cards, a 3‐ minute sand timer to be used for activity challenges, and a log to record the number of activities and repetitions completed, Nutrition Detectives DVD, a reminder card with the programme’s "five clues" to make healthful food choices, grocery store coupons, and a family "homework assignment" to watch the DVD, review the ND clues together, complete an activity applying the clues to foods in the family kitchen. Family nights were held at a) the local supermarket, with stations set up to teach families about healthful food choices with games, demonstrations, and taste tests; b) schools offering stations throughout the building to try out different kinds of exercises, including Frisbee golf and Zumba, and received information or coupons from local fitness‐related businesses | |
| The Healthy & Ready to Learn intervention involved parents and teachers reading children's books on health‐related themes including nutrition and obesity prevention to the participants. Teachers and parents were trained to increase children's time spent physically active in moderate‐to‐vigorous activity for 60 minutes/day. Activities were play‐based and targeted specific gross motor skills. Physical activity equipment was provided | |
| Komm mit in das gesunde Boot (‘Join the healthy boat') comprised healthy lifestyle education of 20 teaching sessions a year focusing on increased physical activity, reduced consumption of sugar‐sweetened beverages and reduced screen time. It included 2 physically‐active breaks per school day of 5 to 7 minutes, and a physical activity task to be performed at home involving parents | |
| Dietary interventions (including health education) | |
| In the OPUS School Meal intervention children received the New Nordic Diet (NND) containing seasonal, health‐promoting ingredients, for example, berries, root vegetables, whole grains, fish, shellfish, seaweed and rapeseed oil. Children received daily servings of a mid‐morning snack, ad libitum hot lunch meal and afternoon snack (fruit dessert twice/week). The children were encouraged to taste everything and to keep a reasonable plate distribution with vegetables and starchy foods filling most of the plate. Each child spent 3 – 5 school half‐days in the kitchen cooking, presenting, and serving the menu of the day to the other children. The teachers were encouraged to participate in the lunch meals. Class teachers were given a box of teaching materials about the human body, the clinical measurements, and taste sensorics, including background information about NND and suggestions for related educational activities and games | |
| The whole‐school lifestyle education programme involved curriculum material taught by trained teachers, school meal modification towards nutrient‐dense food and nutrition counselling. Teachers were provided with 50 integrated lessons‐worth of curriculum material aiming to improve healthy diet (increased fruit and vegetable, breakfast, healthy snack, water consumption) and increase physical activity. Teachers were encouraged to teach lifestyle‐integrated lessons once a week, to conduct health‐related activities every 2 weeks and to hold a school‐wide health event once a semester | |
| The Project breakFAST (Fuelling Academics and Strengthening Teens) aimed to improve students’ school breakfast programme (SBP) participation by implementing a grab‐and‐go‐style cart or breakfast line located outside the cafeteria in a high‐traffic hallway, atrium or common area. School‐wide marketing campaigns were developed by a community partner which worked with a group of students to design the marketing campaign at each school. Positive interactions and social support were created by developing school policies, to allow students to eat breakfast in the hallway. Schools were also encouraged to allow eating breakfast in some classrooms when appropriate | |
| Outcome or subgroup title | No. of studies | No. of participants | Statistical method | Effect size |
| 1 Mathematics achievement Show forest plot | 3 | Std. Mean Difference (IV, Random, 95% CI) | Subtotals only | |
| 1.1 Change from baseline | 2 | 255 | Std. Mean Difference (IV, Random, 95% CI) | 0.49 [‐0.04, 1.01] |
| 1.2 Endpoint | 2 | 314 | Std. Mean Difference (IV, Random, 95% CI) | 0.19 [‐0.03, 0.42] |
| 2 Reading achievement Show forest plot | 2 | 308 | Std. Mean Difference (IV, Random, 95% CI) | 0.10 [‐0.30, 0.49] |
| 3 Language achievement Show forest plot | 1 | Mean Difference (IV, Random, 95% CI) | Totals not selected | |
| 4 2nd Language achievement Show forest plot | 1 | Mean Difference (IV, Random, 95% CI) | Totals not selected | |
| 5 Composite executive functions Show forest plot | 2 | Mean Difference (IV, Random, 95% CI) | Subtotals only | |
| 5.1 Change from baseline | 1 | 54 | Mean Difference (IV, Random, 95% CI) | 8.45 [‐1.67, 18.56] |
| 5.2 Endpoint | 1 | 116 | Mean Difference (IV, Random, 95% CI) | 5.0 [0.68, 9.32] |
| 6 Inhibition control Show forest plot | 1 | Mean Difference (IV, Random, 95% CI) | Totals not selected | |
| 7 Attention Show forest plot | 2 | 157 | Std. Mean Difference (IV, Random, 95% CI) | 0.46 [‐0.16, 1.08] |
| 8 Verbal working memory Show forest plot | 1 | Mean Difference (IV, Random, 95% CI) | Totals not selected | |
| 9 Non‐verbal working memory Show forest plot | 1 | Mean Difference (IV, Random, 95% CI) | Totals not selected | |
| 10 Visuo‐spatial abilities Show forest plot | 2 | Mean Difference (IV, Random, 95% CI) | Totals not selected | |
| 10.1 Change from baseline | 1 | Mean Difference (IV, Random, 95% CI) | 0.0 [0.0, 0.0] | |
| 10.2 Endpoint | 1 | Mean Difference (IV, Random, 95% CI) | 0.0 [0.0, 0.0] | |
| 11 Cognitive flexibility Show forest plot | 2 | 162 | Std. Mean Difference (IV, Random, 95% CI) | ‐0.06 [‐0.37, 0.25] |
| 12 Non‐verbal memory Show forest plot | 1 | Mean Difference (IV, Random, 95% CI) | Totals not selected | |
| 13 General intelligence Show forest plot | 1 | Mean Difference (IV, Random, 95% CI) | Totals not selected | |
| Outcome or subgroup title | No. of studies | No. of participants | Statistical method | Effect size |
| 1 Average school achievement Show forest plot | 1 | Mean Difference (IV, Random, 95% CI) | Totals not selected | |
| 2 Mathematics achievement Show forest plot | 3 | 384 | Std. Mean Difference (IV, Random, 95% CI) | 0.02 [‐0.19, 0.22] |
| 3 Reading achievement Show forest plot | 2 | 284 | Std. Mean Difference (IV, Random, 95% CI) | ‐0.00 [‐0.24, 0.24] |
| 4 Language achievement Show forest plot | 3 | 244 | Std. Mean Difference (IV, Random, 95% CI) | 0.13 [‐0.12, 0.39] |
| 5 Health class achievement Show forest plot | 1 | 263 | Mean Difference (IV, Random, 95% CI) | ‐0.05 [‐0.38, 0.29] |
| 6 Inhibition control Show forest plot | 2 | 110 | Std. Mean Difference (IV, Random, 95% CI) | ‐0.67 [‐1.50, 0.16] |
| 7 Attention Show forest plot | 1 | Mean Difference (IV, Random, 95% CI) | Totals not selected | |
| 8 Visuo‐spatial abilities Show forest plot | 1 | Mean Difference (IV, Random, 95% CI) | Subtotals only | |
| 9 Non‐verbal memory Show forest plot | 1 | Mean Difference (IV, Random, 95% CI) | Subtotals only | |
| Outcome or subgroup title | No. of studies | No. of participants | Statistical method | Effect size |
| 1 Average school achievement Show forest plot | 2 | 434 | Std. Mean Difference (IV, Random, 95% CI) | 0.32 [‐0.07, 0.70] |
| 1.1 Children with obesity | 2 | 379 | Std. Mean Difference (IV, Random, 95% CI) | 0.45 [0.25, 0.66] |
| 1.2 Children with overweight | 1 | 55 | Std. Mean Difference (IV, Random, 95% CI) | ‐0.17 [‐0.70, 0.36] |
| 2 Mathematics achievement Show forest plot | 1 | 76 | Mean Difference (IV, Random, 95% CI) | ‐2.18 [‐5.83, 1.47] |
| 3 Reading achievement Show forest plot | 1 | 67 | Mean Difference (IV, Random, 95% CI) | 1.17 [‐4.40, 6.73] |
| 4 Attention Show forest plot | 1 | 61 | Mean Difference (IV, Random, 95% CI) | 1.68 [‐7.86, 11.22] |
| Outcome or subgroup title | No. of studies | No. of participants | Statistical method | Effect size |
| 1 BMI z‐score Show forest plot | 7 | Mean Difference (IV, Random, 95% CI) | Totals not selected | |
| 1.1 Beneficial effect on school achievement | 3 | Mean Difference (IV, Random, 95% CI) | 0.0 [0.0, 0.0] | |
| 1.2 No beneficial effect on school achievement | 2 | Mean Difference (IV, Random, 95% CI) | 0.0 [0.0, 0.0] | |
| 1.3 Beneficial effects on cognitive functions | 3 | Mean Difference (IV, Random, 95% CI) | 0.0 [0.0, 0.0] | |
| 1.4 No beneficial effect on cognitive functions | 3 | Mean Difference (IV, Random, 95% CI) | 0.0 [0.0, 0.0] | |
| 2 Total body fat (%) Show forest plot | 3 | Mean Difference (IV, Random, 95% CI) | Totals not selected | |
| 2.1 Beneficial effect on cognitive functions | 1 | Mean Difference (IV, Random, 95% CI) | 0.0 [0.0, 0.0] | |
| 2.2 No beneficial effect on cognitive functions | 3 | Mean Difference (IV, Random, 95% CI) | 0.0 [0.0, 0.0] | |