托吡酯治疗原发性震颤
Appendices
Appendix 1. MEDLINE search strategy
1. exp Essential Tremor/ (1183)
2. (essential adj3 tremor*).ab,ti. (2473)
3. (familia* adj3 tremor*).ab,ti. (132)
4. 1 or 2 or 3 (2654)
5. topiramate.ab,ti. (3113)
6. topamax.ab,ti. (75)
7. epitomax.ab,ti. (4)
8. 5 or 6 or 7 (3134)
9. randomized controlled trial.pt. (367656)
10. controlled clinical trial.pt. (87895)
11. randomized.ab. (287683)
12. placebo.ab. (151722)
13. drug therapy.fs. (1677138)
14. randomly.ab. (208754)
15. trial.ab. (298006)
16. groups.ab. (1332158)
17. 5 or 6 or 7 or 8 or 9 or 10 or 11 or 12 (3287589)
18. exp animals/ not humans.sh. (3903063)
19. 17 not 18 (2818660)
20. 4 and 8 and 19 (31)
Appendix 2. CENTRAL search strategy
1. MeSH descriptor: [Essential Tremor] explode all trees (62)
2. essential tremor*:ti,ab,kw (Word variations have been searched) (202)
3. familia* tremor:ti,ab,kw (Word variations have been searched) (7)
4. 1 or 2 or 3 (208)
5. "topiramate":ti,ab,kw (Word variations have been searched) (620)
6. "Topamax":ti,ab,kw (Word variations have been searched) (8)
7. epitomax:ti,ab,kw (Word variations have been searched) (0)
8. 5 or 6 or 7 (621)
9. 4 and 8 (6)

Study flow diagram.
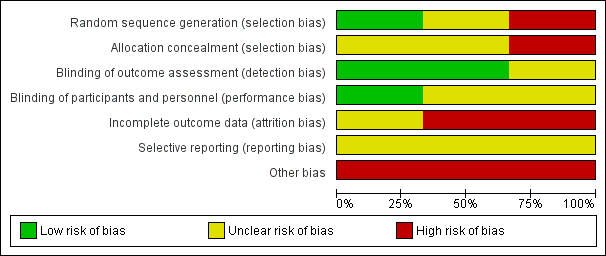
Risk of bias graph: review authors' judgements about each risk of bias item presented as percentages across all included studies.

Risk of bias summary: review authors' judgements about each risk of bias item for each included study.

Forest plot of comparison: 1 Topiramate versus placebo/open control, outcome: 1.1 Functional disability component related to tremor.

Forest plot of comparison: 1 Topiramate versus placebo/open control, outcome: 1.2 Withdrawals.

Comparison 1 Topiramate versus placebo/open control, Outcome 1 Functional disability component related to tremor.

Comparison 1 Topiramate versus placebo/open control, Outcome 2 Withdrawals.
| Topiramate for essential tremor | ||||||
| Patient or population: people with essential tremor Settings: outpatients Intervention: topiramate Comparison: placebo | ||||||
| Outcomes | Illustrative comparative risks* (95% CI) | Relative effect | No of Participants | Quality of the evidence | Comments | |
| Assumed risk | Corresponding risk | |||||
| Placebo | Topiramate | |||||
| Functional disability (follow‐up duration 24 weeks) TRS subscale B score (motor tasks) TRS subscale C score (functional disability) | The mean improvement in the control group was | The mean improvement in the intervention groups was | ‐ | 223 | ⊕⊝⊝⊝ | ‐ |
| Study withdrawal (follow‐up duration 10 to 24 weeks) Number of participants withdrawn from the study | Study population | RR 1.78 | 285 | ⊕⊕⊝⊝ | ‐ | |
| 217 per 1000 | 347 per 1000 | |||||
| Moderate | ||||||
| ‐ | ‐ | |||||
| Adverse events (follow‐up duration 24 weeks) Number of AEs | Study population | ‐ | 221 | ⊕⊕⊝⊝ | ‐ | |
| 71 AEs per 105 participants | 195 AEs per 116 participants | |||||
| Moderate | ||||||
| ‐ | ‐ | |||||
| *The basis for the assumed risk (e.g. the median control group risk across studies) is provided in footnotes. The corresponding risk (and its 95% confidence interval) is based on the assumed risk in the comparison group and the relative effect of the intervention (and its 95% CI). AE: adverse event; CI: confidence interval; RR: risk ratio; TRS: Tremor Rating Scale. | ||||||
| GRADE Working Group grades of evidence | ||||||
| 1 Downgraded due to serious risk of bias: high number of study withdrawals (attrition bias); blinding of outcome assessment probably revealed by the presence of serious AEs in the topiramate group: trials should be regarded as single blind (detection bias); potential conflicts of interest due to the presence of authors sponsored by pharmaceutical companies. 3 Downgraded due to imprecision: small sample size (< 300 participants) and small number of included studies (three). | ||||||
| Outcome or subgroup title | No. of studies | No. of participants | Statistical method | Effect size |
| 1 Functional disability component related to tremor Show forest plot | 3 | Mean Difference (IV, Fixed, 95% CI) | Subtotals only | |
| 1.1 Change in TRS subscale B score | 1 | 208 | Mean Difference (IV, Fixed, 95% CI) | ‐5.4 [‐8.42, ‐2.38] |
| 1.2 Change in TRS subscale C score | 1 | 208 | Mean Difference (IV, Fixed, 95% CI) | ‐5.7 [‐8.74, ‐2.66] |
| 1.3 Change in TRS total score | 3 | 273 | Mean Difference (IV, Fixed, 95% CI) | ‐8.91 [‐10.50, ‐7.33] |
| 2 Withdrawals Show forest plot | 2 | Risk Ratio (M‐H, Fixed, 95% CI) | Subtotals only | |
| 2.1 Withdrawals: lack of efficacy | 2 | 285 | Risk Ratio (M‐H, Fixed, 95% CI) | 0.18 [0.02, 1.53] |
| 2.2 Withdrawals: AEs | 2 | 285 | Risk Ratio (M‐H, Fixed, 95% CI) | 3.17 [1.79, 5.63] |
| 2.3 Withdrawals: other reasons | 2 | 285 | Risk Ratio (M‐H, Fixed, 95% CI) | 0.96 [0.45, 2.05] |
| 2.4 Withdrawals: total | 2 | 285 | Risk Ratio (M‐H, Fixed, 95% CI) | 1.78 [1.23, 2.60] |