Nahrungsanreicherung mit eisenhaltigen Mikronährstoffpulvern vor der Einnahme bei Kindern im Vorschul‐ und Schulalter
Referencias
References to studies included in this review
References to studies excluded from this review
References to ongoing studies
Additional references
References to other published versions of this review
Characteristics of studies
Characteristics of included studies [ordered by study ID]
| Methods | Study design: randomised cluster trial; 4‐arm design. Only groups 1 and 2 were randomised. Unit of allocation: villages (n = 29). | |
| Participants | Location of the study: the archipelago of Nias in North Sumatra, Indonesia. Selection of participants: in project area from all children who attended the monthly growth monitoring activities implemented by the Church World Service or the Government of Indonesia, or both. Selection criteria: mildly wasted children (< ‐1.0 to ≥ ‐1.5 SD, according to NCHS reference data). Children were individually discharged when they reached WHZ ≥ ‐1.0 or when intervention period ended if they did not achieve WHZ ≥ ‐1.0 during study. Sample size: 215 children. Age: ≥ 6 to < 60 months (mean age about 35 months). Sex: both (approximately 43% girls). SES: 90% of children belonged to families with low SES. Baseline prevalence of anaemia: 61%. Baseline prevalence of soil helminths: not reported. Refugee status: no. Malaria endemicity: yes: malaria control programme was implemented in project area, and therefore provision of impregnated bed‐nets and artemisinin‐based combination therapy for the treatment of malaria was provided. At time of the study, endemic malaria situation on Nias Island was stable. Several activities performed to minimise risks of iron supplementation. Continuous collection of classic symptoms of malaria (cyclical occurrence of sudden coldness and then fever occurring every 2 or 3 days) via morbidity record. Conducted culturally appropriate information, education and communication programme with regard to malaria prevention, its signs and symptoms, and its appropriate treatment. However, there were no index children with malaria during study period (information provided by author). | |
| Interventions | Villages were assigned to 1 of the following groups (only groups 1 and 2 were randomly allocated).
Iron dose: 10 mg of elemental iron. Type of iron compound: microencapsulated ferrous fumarate (information provided by author). Other nutrients: vitamin A 375 µg RE (1250 IU), zinc 5 mg, folic acid 150 μg (0.15 mg), iodine 50 µg, vitamin C (ascorbic acid) 35 mg, thiamine 0.5 mg, riboflavin 0.5 mg, niacin 6 mg, vitamin B12 0.9 mg, vitamin B6 0.5 mg, vitamin D 5 µg (200 IU), vitamin E 4 mg, copper 0.6 mg. Provision of MNP regimen: daily (7 sachets provided weekly). Duration of intervention: varied as children were individually discharged when they reached WHZ ≥ ‐1.0 or failed to achieve WHZ ≥ ‐1.0 at the end of intervention period. Length of stay of eligible children 55 ± 34 days in group 1, 35 ± 14 days in group 2, 85 ± 19 days in group 3 and 83 ± 19 days in group 4. Final values adjusted by duration of stay in programme. Co‐intervention: intensive nutrition education. For the purposes of this review, only groups 1 and 2 were compared. Groups 3 and 4 were not randomly allocated (information provided by author). | |
| Outcomes | Weight, weight gain, height/length, WHZ, HAZ, MUAC, Hb, anaemia, reached discharge criterion, did not reach discharge criterion and adherence. Information on adverse effects (mortality, diarrhoea, acute respiratory infections, fever and all‐cause morbidity) were provided by author. | |
| Notes | Analysis took into account the clustering effect. Used mixed model to analyse data; villages were fitted as random effect. Following variables that were not normally distributed were log‐transformed: age of mother, number of children, income per capita, HAZ, weight gain per kg bodyweight per day, height gain per day, MUAC gain per day, weight gain per day. Mixed model included fixed and random effects. Type of programme (groups 1‐4) used as fixed effect and village as random factor. Source of funding: Neys‐van Hoogstraten Foundation (Netherlands), Eiselen Foundation (Germany), DSM Nutritional Products, and CWS (Church World Service) Indonesia. | |
| Risk of bias | ||
| Bias | Authors' judgement | Support for judgement |
| Random sequence generation (selection bias) | Low risk | Manually by random tables, only groups 1 and 2 were randomised (information provided by author). For groups 3 and 4, the agency co‐ordinating study opened new project sites which were distanced out of daily communication range with the first 2 groups' villages to avoid spread of nutrition‐related knowledge. These groups were not included in this analysis. |
| Allocation concealment (selection bias) | Low risk | Villages in existing project areas randomly allocated to groups 1 and 2. Since intervention was allocated at village level, it was unlikely there was a selection bias at the individual level. |
| Blinding of participants and personnel (performance bias) | High risk | Participants and personnel aware of intervention and no placebo used. |
| Blinding of outcome assessment (detection bias) | High risk | Outcome assessors aware of intervention (information provided by author). |
| Incomplete outcome data (attrition bias) | Low risk | Since Hb was measured at discharge, 16.3% of participants had no data, balanced across groups. |
| Selective reporting (reporting bias) | Low risk | Data for adverse effects not reported in publication but were provided by author. |
| Other bias | Unclear risk | Data not adjusted by length of intervention (information confirmed by author). |
| Methods | Study design: randomised controlled trial; 2‐arm design. Unit of allocation: households. | |
| Participants | Location of the study: rural Honduras. Selection of participants: using immunisation records at local health clinics, at least 10% of the children 6‐60 months of age in each health clinic were identified and randomised at household level. Immunisation records at health clinic used because 98% of 1‐year‐old children were immunised in Honduras against hepatitis B; measles; diphtheria, pertussis and tetanus; and tuberculosis. Selection criteria: children were excluded if anaemic (Hb < 110 g/L). Sample size: 199 children. Age: 6‐60 months of age (mean (SD) age 34.66 ± 15.31 months). Sex: both (45% girls). SES: not reported, rural Honduras. Baseline prevalence of anaemia: 0%. Baseline prevalence of soil helminths: not reported. Refugee status: no. Malaria endemicity: not reported. | |
| Interventions | Participants were randomly assigned to 1 of 2 groups.
Iron dose: 12.5 mg of elemental iron. Type of iron compound: microencapsulated ferrous fumarate. Other nutrients: zinc 5 mg, folic acid 150 µg (0.15 mg), vitamin A 480 µg RE (1600 IU) , vitamin C 50 mg, vitamin D 7.5 µg (300 IU). Provision of MNP regimen: daily (120 sachets). Duration of intervention: 4 months with follow‐up assessment at 4 and 8 months after initiating intervention. Co‐intervention: albendazole for helminths infestation every 4 months at each visit. | |
| Outcomes | Anaemia, Hb, iron deficiency, serum TfRs, iron deficiency anaemia, HAZ, WHZ, WAZ, adherence and acceptability. | |
| Notes | Cost per sachet: USD 0.025. 4‐month supply of 120 MNP sachets and pictorial and verbal instructions for use provided for each child assigned to group 1. Children withdrawn from study if anaemic after 4 months of follow‐up. Based on parental responses and counting of returned empty MNP packets, children who received MNP used a mean 108/120 (90%) packets. Number of packets consumed ranged from 24 to 120. Of children who received MNP, 55% used all 120 packets, and 86% used > 100 packets. Parents reported that only 3 children (2.75%) disliked food with MNP added, 1 child had diarrhoea, and 1 had difficulty in administering the MNP. Rice, beans and soup were the foods most commonly mixed with the MNP. 54.1% of children did not notice MNP in food, 32.1% liked food better with MNP and 13.8% did not like food with them. Impossible to account for the clustering because cluster size was not available. Source of funding: Wilford Hall Medical Center, San Antonio (USA); South Dakota State University Agricultural Experiment Station, Brookings (USA); and the Center for Disaster and Humanitarian Assistance Medicine, Uniformed Services University of the Health Sciences, Bethesda (USA). Micronutrient sprinkles were provided by Heinz Company, Canada. | |
| Risk of bias | ||
| Bias | Authors' judgement | Support for judgement |
| Random sequence generation (selection bias) | Unclear risk | Households of non‐anaemic children randomly assigned to group 1 or 2. Method of sequence generation not described. |
| Allocation concealment (selection bias) | Low risk | Households randomly selected at health clinic level. Although a selection bias at individual level was unlikely, number of children allocated to each group randomised differed for group 1 (n = 114) and group 2 (n = 85). Minimum of 10% of children within each health centre were randomly selected for participation. |
| Blinding of participants and personnel (performance bias) | High risk | Participants and personnel aware of intervention as there was no placebo. |
| Blinding of outcome assessment (detection bias) | Unclear risk | Insufficient information to permit judgement. |
| Incomplete outcome data (attrition bias) | High risk | At 4‐month assessment, only 3.5% (n = 7) loss to follow‐up or refused Hb measurement. 35.5% were anaemic at either the 4‐month assessment (20.3%) or the 8‐month assessment (15.2%); those who were anaemic were removed from study and given iron treatment. Reported that 31% of participants do not have Hb measurements. Unclear whether losses were balanced between groups. |
| Selective reporting (reporting bias) | Unclear risk | Insufficient information to permit judgement. |
| Other bias | Unclear risk | Study did not adjust for household clustering (unclear whether there was only 1 eligible child per house). Children in group 1 were at a higher mean altitude (5134 feet) than children in group 2 (4876 feet). |
| Methods | Study design: randomised controlled trial; 3‐arm design. Unit of allocation: households. | |
| Participants | Location of the study: Lahanam zone, Songkhone District, Savannakheth Province, 600 km south of the capital city, Vientiane, Lao People's Democratic Republic. Selection of participants: in 2004, entire population in study area was registered in HDSS of the National Institute of Public Health. From the HDSS database, 367 eligible preschool‐age children were identified and invited to participate if they fitted all inclusion criteria. All eligible children in each household were enrolled and followed same intervention randomly assigned to household. Selection criteria: apparently healthy infants and children 6‐53 months of age at time of recruitment; willing to participate and receive complementary food in addition to breast milk. Exclusion criteria: fever or any illnesses on the day of enrolment; baseline Hb < 70 g/L; currently taking iron supplements. Of the 367 children who met criteria, 17 were absent day of enrolment and 14 excluded for fever/illness. Sample size: 336 children. Age: 6‐52 months (mean 32 months). Sex: both (58% girls). SES: each household was categorised into 1 of 2 SES groups: high (with electricity, improved water source and latrine) and low (lacking 1 or all these). Baseline prevalence of anaemia: 48.9%. Baseline prevalence of soil helminths: not reported. Refugee status: no. Malaria endemicity: not reported but a malaria control programme was successfully executed in all villages in 10 years prior. | |
| Interventions | Participants randomly assigned to 1 of 3 groups.
Iron dose: 10 mg of elemental iron. Type of iron compound: microencapsulated ferrous fumarate (information provided by manufacturer). Other nutrients: vitamin A 400 μg RE (1330 IU), zinc 4.1 mg, vitamin D3 5 μg (200 IU), TE vitamin E 5 mg, vitamin B1 0.5 mg, vitamin B2 0.5 mg, vitamin B6 0.5 mg, folic acid 150 μg (0.15 mg), niacin 6 mg, vitamin B12 0.9 μg, vitamin C 30 mg, selenium 17 μg, copper 0.56 mg, iodine 90 μg. Provision of MNP regimen: daily (total 168 MNP sachets) and twice weekly (total 48 MNP sachets). Duration of intervention: 24 weeks. Co‐intervention: single high‐dose vitamin A every 6 months, and children aged ≥ 24 months received single dose of mebendazole for deworming in 2 months prior to study. Children who had not received mebendazole received it during baseline survey. For the purposes of this review, the results from groups 1 and 2 were combined and only reported separately in the subgroup assessing the scheme. | |
| Outcomes | Hb, anaemia (measured at baseline, week 12 and week 24). HAZ, WAZ, WHZ (taken every 4 weeks). | |
| Notes | Analyses in this review included the estimated effective sample size only, after adjusting data to account for clustering effect. Authors provided mean cluster size and intra cluster correlation coefficient for anaemia. All children in group 2 consumed 2 sachets of MNP per week, giving 100% compliance for this group. In group 1, 72.7% of children consumed ≥ 5 sachets of MNP per week and 43.6% of the children consumed all 7 sachets per week for all 24 weeks. Most common reason for not taking powder in group 1 was illness, such as diarrhoea (n = 20), cough (n = 10) and forgetting to take supplements (n = 32). About 42% (93/221) of mothers reported that MNP changed colour of food and 97/221 reported an unpleasant smell or taste. Some mothers mixed MNP in liquids such as juice or milk. Many mothers felt the MNP had increased their child's appetite (31.7%) and playfulness (48.4%). Source of funding: Eco‐Health Project of the Research Institute for Humanity and Nature, Kyoto (Japan), in collaboration with the National Institute of Public Health, Ministry of Health (MOH) (Lao People’s Democratic Republic (PDR)). MNP supplements were provided by UNICEF through Hygiene and Prevention Department of Ministry of Health, Lao PDR. One author received funding from the Asian Health & Education Fund, Tokyo (Japan), and partial funding through the Institute of Tropical Medicine, Nagasaki University (NEKKEN) Fellowship (Japan). | |
| Risk of bias | ||
| Bias | Authors' judgement | Support for judgement |
| Random sequence generation (selection bias) | Low risk | Computer‐generated random number. |
| Allocation concealment (selection bias) | High risk | No method to conceal allocation (confirmed by author). |
| Blinding of participants and personnel (performance bias) | High risk | Participants and personnel aware of intervention and there was no placebo. |
| Blinding of outcome assessment (detection bias) | Low risk | Anthropometrists and trained technicians who collected Hb data unaware of participant group allocation. |
| Incomplete outcome data (attrition bias) | Low risk | 98.5% of participants completed study without imbalance between groups. |
| Selective reporting (reporting bias) | Unclear risk | Insufficient information to permit judgement. |
| Other bias | High risk | Although it was unintended, Hb concentrations were significantly different at baseline between control compared with the 2 intervention groups. Children in control group had, on average, a higher mean Hb concentration and thus a lower incidence of anaemia compared with the children in the 2 supplementation groups. Baseline anaemia prevalence varied by group: daily MNP (53.6%), twice weekly MNP (58.6%) and control (34.5%). Village health volunteers monitored adherence and were aware of allocation of participants. They visited households every week and recorded the number of sachets consumed by children in the 2 intervention groups, any adverse effects and any illnesses that occurred during the study period. |
| Methods | Study design: cluster‐randomised, community‐based effectiveness trial; 2 arm design. Unit of allocation: villages (24). | |
| Participants | Location of the study: Kyrgyz Republic. Selection of participants: study took place in 2 rural areas of the Kyrgyz Republic, the Ak‐Talaa District (rayon) of the Naryn Region (oblast) and the Karabura District of the Talas Region, and in Ak‐Bosogo, on the outskirts of Bishkek, the nation’s capital. In all 3 areas, there was an intervention and a control group. In each of 3 study areas, local primary healthcare clinics provided lists of all children 6‐36 months of age. Selection criteria: residents from 1 of the above areas. Age‐eligible children required parental consent, to be consuming semi‐solid food, not currently taking iron supplements, baseline Hb ≥ 70 g/L and no severe illnesses. Sample size: 2193 children (695 children aged ≥ 24 months). Age: 6‐36 months (only data for children aged ≥ 24 months used in this review, mean 30 months). Sex: both. SES: low. Baseline prevalence of anaemia: 73%. Baseline prevalence of soil helminths: hookworm infestations were not prevalent. Refugee status: no. Malaria endemicity: no. | |
| Interventions | Villages with children aged ≥ 24 months randomly assigned to 1 of 2 groups.
Iron dose: 12.5 mg of elemental iron. Type of iron compound: microencapsulated ferrous fumarate. Other nutrients: vitamin A (retinol acetate) 300 μg RE, zinc (zinc gluconate) 5 mg, vitamin C (ascorbic acid) 30 mg, folic acid 160 μg (0.16 mg). Provision of MNP regimen: daily. Duration of intervention: 2 months. Co‐intervention: not reported. | |
| Outcomes | Hb, anaemia morbidity, adherence and adverse effects. | |
| Notes | Results included in this review corresponded only to children aged ≥ 24 months. Data set provided by author. Analysis adjusted by clustering effect. Source of funding: Kyrgyz‐Swiss‐Swedish Health Project, which is financed by the Swiss Agency for Development and Cooperation (SDC) and the Swedish International Development Cooperation Agency (Sida) and implemented by the Swiss Red Cross. The study was conducted through an academic collaboration between the Sprinkles Group at Sick Kids, the Research Institute of the Hospital for Sick Children in Toronto, and the Kyrgyz‐Swiss‐Swedish Health Project in Kyrgyzstan. One author, Dr. Stanley Zlotkin owns the intellectual property rights to micronutrient Sprinkles. Any profit from the licensing of Sprinkles production, after expenses, is donated to the Hospital for Sick Children Foundation. | |
| Risk of bias | ||
| Bias | Authors' judgement | Support for judgement |
| Random sequence generation (selection bias) | Low risk | Villages and district centre parts randomly allocated to intervention and control groups using stratified randomisation to balance size of clusters. Sequence generated by shuffling cards (in envelopes) (information provided by author). |
| Allocation concealment (selection bias) | Low risk | Not described. Since intervention was allocated at village level, unlikely there was selection bias at individual level. |
| Blinding of participants and personnel (performance bias) | High risk | Participants and personnel aware of intervention and there was no placebo. |
| Blinding of outcome assessment (detection bias) | High risk | Outcome assessors aware of intervention. |
| Incomplete outcome data (attrition bias) | Low risk | 156/1103 (14%) children lost to follow‐up in MNP group and 168/1090 (14.4%) children in control group, mainly because they could not be located or contacted to participate in follow‐up. |
| Selective reporting (reporting bias) | Unclear risk | Insufficient information to permit judgement. |
| Other bias | Low risk | Study appeared free of other sources of bias. |
| Methods | Study design: randomised, partially blinded, controlled trial; 2‐arm design. Unit of allocation: individual. | |
| Participants | Location of the study: Migwani and Nzauni administrative locations within the Migwani Division, Mwingi District, Kenya. Migwani and Nzauni were 2 of 6 possible administrative locations in Migwani Division that were randomly selected. Selection of participants: random walk method. Selection criteria: aged 12‐59 months, apparently healthy, and lived in village for ≥ 6 months prior to intervention and continuing to live there for next year. Sample size: 279 children. Age: 12‐59 months (mean 37 months). Sex: both (52% girls). SES: not reported but study location was in agro‐ecological zone in a semi‐arid area that experienced food shortage for most of year. Baseline prevalence of anaemia: 35.5%. Baseline prevalence of soil helminths: not reported. Refugee status: no. Malaria endemicity: yes. | |
| Interventions | Participants were randomly assigned to 1 of 3 groups and were fed at feeding centres.
Iron dose: 2.5 mg of elemental iron. Type of iron compound: NaFeEDTA. Other nutrients: vitamin A (retinyl palmitate) 100 µg RE, zinc 2.5 mg, folic acid 90 µg (0.09 mg), vitamin C 60 mg, vitamin D3 (cholecalciferol) 5 µg, TE vitamin E (1‐a tocopheryl acetate) 5 mg, niacin 6 mg, copper 0.34 mg, iodine 30 µg, thiamine 0.5 mg, riboflavin 0.5 mg, vitamin B6 0.5 mg, vitamin B12 0.9 µg, calcium 200 µg; pantothenic 2 mg, vitamin K (phylloquinone) 30 mg, selenium 17 µg. Provision of MNP regimen: daily. Duration of intervention: 16 weeks. Co‐intervention: children who had not been dewormed in 3 months prior to start of study were dewormed. Children aged ≥ 2 years received albendazole 400 mg, whereas children aged < 2 years received albendazole 200 mg. For the purpose of this review, only groups 2 and 3 were compared. | |
| Outcomes | Stunting, underweight or wasting (defined by Z‐score < 2 SD for anthropometric indices WHO growth standards as reference), Hb, malaria parasitaemia, ferritin, serum TfR, CRP. | |
| Notes | Target daily intake 350 mL of porridge for all children, considered an amount that they could comfortably consume in 1 session. Food prepared and MNP added prior to serving. Porridge served between 8.00 a.m. and 11.00 a.m. No malaria at baseline, whereas at endpoint, microscopy showed that 3.8% of children had malaria, which did not differ across groups. Attendance and leftovers recorded daily. Elevated acute phase protein defined as CRP > 5 mg/L and a correction factor of 0.67 for children with elevated CRP used to adjust plasma ferritin concentration. Source of funding: Nevin Scrimshaw International Nutrition Foundation/Ellison Medical Foundation (USA), the Nutricia Research Foundation (Netherlands), and the Foundation Van Dam Nutrition Plan (Netherlands). One author received support for this research from the Nestle Foundation. DSM Nutritional Products (Switzerland) provided the multiple micronutrient powders. One author also received a study fellowship from Wageningen University (Netherlands). | |
| Risk of bias | ||
| Bias | Authors' judgement | Support for judgement |
| Random sequence generation (selection bias) | Low risk | Block randomisation by age and sex generated with Excel (Microsoft) by 1 investigator not involved in recruitment and data collection. |
| Allocation concealment (selection bias) | Low risk | All serving bowls labelled with child's name and identification number. Similar serving cups equivalent to 350 mL of porridge used to serve in all centres. |
| Blinding of participants and personnel (performance bias) | High risk | Participants fed at feeding centres and participants were unaware of intervention. The 2 types of porridge were cooked at 3 different cooking centres from where they were distributed in thermo flasks to 7 additional centres for feeding. All serving bowls were labelled with child's name and identification number at cooking centres before distribution to feeding centres. Feeding personnel aware of intervention because amaranth porridge was slightly darker in colour and thinner in consistency compared to the maize porridge (information provided by author). |
| Blinding of outcome assessment (detection bias) | High risk | Outcome assessors aware of intervention (information provided by author). |
| Incomplete outcome data (attrition bias) | Low risk | 239 children completed study, equivalent to 86% of children randomised at baseline. Endpoint measurement for biochemical indicators not done for 19 children, because either their veins could not be detected (n = 5) or their caretakers declined (n = 14). 9 children were absent for end measurement. |
| Selective reporting (reporting bias) | Unclear risk | Insufficient information to permit judgement. |
| Other bias | Unclear risk | Missing data values of Hb, ferritin, and TfR imputed before primary analysis using multiple imputations. Data imputed 5 times using fully conditional specification method with default PASW Statistics initialisation value. Treatment group, number of days attended, sex, age, baseline, and postintervention weight, height, Hb, plasma ferritin and TfR concentrations used as predictors in imputation model. Pooled estimates from imputed data reported. |
| Methods | Study design: randomised, parallel‐controlled single‐blind intervention; 2‐arm design. Unit of allocation: children. | |
| Participants | Location of the study: North West Province, South Africa. Selection of participants: attending 1 of 8 privately owned preschools serving a low SES community. Selection criteria: age eligible participants attended 1 of 8 schools; parental consent, Hb ≥ 125 g/L; no major chronic illnesses; no recent consumption of micronutrient supplements. Sample size: 151 children. Age: 36‐79 months (mean 58 months). Sex: both (50% girls). SES: low. Baseline prevalence of anaemia: 29%. Baseline prevalence of soil helminths: not reported. Refugee status: no. Malaria endemicity: no. | |
| Interventions | Participants randomly assigned to 1 of 2 groups.
Iron dose: 2.86 mg of elemental iron. Type of iron compound: NaFeEDTA. Other nutrients: zinc 2.86 mg, vitamin A 457 μg RE, iodine 34.3 μg, calcium 457 mg, vitamin C 68.6 mg, vitamin E 5.71 mg, vitamin B12 1.03 μg, thiamine 0.57 mg, niacin 6.86 mg, riboflavin 0.57 mg, folic acid 103 μg (0.10 mg), vitamin B6 0.57 mg. Provision of MNP regimen: daily (5 days per week). Duration of intervention: 52 school days (11 weeks). Co‐intervention: mebendazole 500 mg (antihelminthic) before start of intervention. | |
| Outcomes | Hb, height, weight, MUAC, triceps‐skinfold thickness, cognitive function, dietary intake. recruitment, dose delivered, dose received, context and fidelity, early childhood development, adherence. | |
| Notes | Authors provided data set. Pilot study assessing feasibility of implementing a point‐of‐use micronutrient fortification. 6‐21 kg (depending on the school population) of raw maize‐meal flour provided to preschools per week to ensure that all children received standard portion sizes of porridge. Porridge for intervention group had to be stiff before addition of amylase‐rich MNP. Study assistants prepared separate breakfast meals containing 2 types of porridge daily. Source of funding: National Research Foundation (South Africa). DSM Nutritional Products South Africa (Pty) Ltd provided the micronutrient powders. | |
| Risk of bias | ||
| Bias | Authors' judgement | Support for judgement |
| Random sequence generation (selection bias) | Low risk | Computer‐generated random numbers (information provided by author). |
| Allocation concealment (selection bias) | Low risk | Authors paired groups of 2 children per school based on Hb level and randomly allocated 1 in each pair to treatment or placebo. Code was only broken when data analysis was completed (information provided by author). |
| Blinding of participants and personnel (performance bias) | Low risk | Participants and schools were blinded to intervention. Maize porridge breakfast meals served in colour‐coded plastic plates. Supplement caused the porridge to become more fluid so it was not possible to conceal it to the children or caretakers; they were able to observe a difference but did not know which was treatment and which placebo (information provided by author). Quote: 'The intervention group (n = 76) received stiff maize meal porridge with added micronutrient powder (<8 g) (containing amylase‐rich light malted barley flour), while those in the control group (n = 75) received soft maize‐meal porridge with added placebo powder (<8 g) containing only maize maltodextrin. |
| Blinding of outcome assessment (detection bias) | Low risk | Cognitive assessors and research team did not know which child was allocated to which treatment and code was only broken once analysis of data was completed (information provided by author). |
| Incomplete outcome data (attrition bias) | High risk | Overall attrition of 13.2%. Attrition of 17.1% in intervention group and 9.3% in control group. 12 children who completed follow‐up were excluded from final analyses because of recurrent absenteeism (< 60% adherence to study regimen). |
| Selective reporting (reporting bias) | High risk | 12 children excluded from analysis due to low adherence to study regimen (< 60%). |
| Other bias | Low risk | Study appeared free of other sources of bias. |
| Methods | Study design: cluster‐randomised, triple‐blind, placebo‐controlled trial; 2 arms. Unit and method of allocation: children's centres (cluster) using random blocks of variable length. | |
| Participants | Location of the study: Fundación de Atención a la Niñez in Medellín, Colombia during 2013. Selection of participants: children with full attendance (8 hours). Selection criteria: no anaemia or severe acute malnutrition, registered in 2 children's centres of a non‐governmental organisation. Sample size: 90 children. Age: 2‐5 years (inclusive), mean (SD) age: 4.8 ± 0.3 years. Sex: both (47.8% girls). SES: most resided in houses classified as stratum 1, 2 and 3; mainly extended or joint families who lived with people of different generations in same residence and with a majority proportion of parents with high‐school studies. Baseline prevalence of anaemia: non‐anaemic. Baseline prevalence of soil helminths: not encountered. However, 51.1% of participants presented intestinal parasitic infestations such as Blastocystis Hominis, cysts of Endolimax Nana, Giardia Duodenalis, Entamoeba Coli, Entamoeba Histolytica and Iodamoeba Büstschlii. Refugee status: no. Malaria endemicity: not reported. | |
| Interventions | Participants from the 2 different centres randomly assigned to 1 of 2 groups.
Iron dose: 12.5 mg of elemental iron. Type of iron compound: microencapsulated ferrous fumarate. Other nutrients: vitamin A (retinyl acetate) 400 µg RE, zinc (zinc gluconate) 4.1 mg, folic acid 150 μg, iodine (potassium iodide) 90 µg, vitamin C (ascorbic acid) 30 mg, thiamine 0.5 mg, riboflavin 0.5 mg, niacin (as nicotinamide) 6 mg, vitamin B12 0.9 µg, vitamin B6 0.5 mg, vitamin D (ergocalciferol) 5 µg, vitamin E (all‐rac‐α‐tocopherol) 5 mg, copper 0.56 mg. Provision of MNP regimen: daily (5 days per week). Duration of intervention: 9 weeks. Co‐intervention: children in placebo group received powder matrix with maltodextrins, corresponding to vehicle used in children of intervention group. All children received 10 mL of albendazole in syrup at beginning of study. | |
| Outcomes | Anaemia, Hb, serum ferritin, serum transferrin, serum folate, weight, height, body mass index, adverse effects (nausea, abdominal pain, other). | |
| Notes | Source of funding: Universidad CES, Medellín, Colombia and Nutreo SAS (private food company). | |
| Risk of bias | ||
| Bias | Authors' judgement | Support for judgement |
| Random sequence generation (selection bias) | Low risk | Reported as randomly allocated using random blocks of variable length. |
| Allocation concealment (selection bias) | Low risk | As children were assigned by centres with placebo and blinded, it was unlikely that intervention allocations could have been foreseen. |
| Blinding of participants and personnel (performance bias) | Unclear risk | Participants and personnel blinded to intervention and placebo. |
| Blinding of outcome assessment (detection bias) | Low risk | Assessor blinded to intervention and placebo. |
| Incomplete outcome data (attrition bias) | Low risk | 4 participants lost to follow‐up, 2 in each group. Authors indicated that losses were not related to variables of interest of study, but to social and economic situation of preschool‐age children's families. |
| Selective reporting (reporting bias) | Unclear risk | Insufficient information to assess as there was no report of registration of a protocol. |
| Other bias | High risk | At start of study, mean (SD) age of preschool children was 4.8 ± 0.3 years, with a minimum age of 3.8 years and a maximum of 5.2 years, with statistical differences between the 2 groups. In addition, 71.1% of participants presented an adequate nutritional status, compared to 25.6% who had malnutrition due to excess (15.6% were overweight and 10% were obese). Significant differences in nutritional status between groups at beginning of study. |
| Methods | Study design: single‐blind, placebo‐controlled, cluster‐randomised; 2‐arm design. Unit of allocation: public primary schools (20). | |
| Participants | Location of the study: Tehri Garhwal, a hilly agrarian community located in mid‐Himalayan ranges of Uttarakhand State, 250 km from New Delhi, India. Selection of participants: children in grades 1‐4 in public primary schools. 20 schools selected for study from across 9 blocks (sub districts) in Tehri Garhwal district using a stratified random sampling procedure. 2 schools picked randomly from each stratum to participate and 1 school was randomly assigned to intervention and other to control arm. Within each selected school, names of all children were obtained and 25 were randomly selected for anthropometric, biochemical, and parasitological assessments. Selection criteria: parental consent; not severely anaemic (Hb < 70 g/L); no sickle cell disease, HIV or tuberculosis. Sample size: 499 children. Age: 6‐10 years (mean (SD) age 7.0 ± 1.0 years). Sex: both (52.1% girls). SES: not reported, but local population engaged primarily in subsistence agriculture. Baseline prevalence of anaemia: 36.7%. Baseline prevalence of soil helminths: 7.6%. Refugee status: no. Malaria endemicity: malaria is not endemic in the Tehri Garhwal district. | |
| Interventions | 2 schools from each strata randomly assigned to 1 of 2 groups.
Iron dose: 10 mg of elemental iron. Type of iron compound: NaFeEDTA. Other nutrients: vitamin A (retinyl acetate) 375 µg RE, zinc (zinc gluconate) 4.2 mg, folic acid 225 μg, iodine (potassium iodide) 90 µg, vitamin C (ascorbic acid) 26.25 mg, thiamine (thiamine mononitrate) 0.68 mg, riboflavin (as riboflavin 5‐phosphate sodium) 0.68 mg, niacin (as nicotinamide) 9 mg, vitamin B12 (1% on mannitol, as carrier) 1.35 µg, vitamin B6 (pyridoxine hydrochloride) 0.75 mg, vitamin D (ergocalciferol) 3.75 µg, vitamin E (all‐rac‐α‐tocopherol) 5.25 mg, copper 0.45 mg. Provision of MNP regimen: daily (6 days per week). Duration of intervention: 8 months (1 school year). Co‐intervention: all children involved in anthropometric, biochemical and parasitological assessments (n = 25/school) given sweets or fruit juice (or both) after assessments and administered albendazole 500 mg orally before beginning fortification. | |
| Outcomes | Anaemia, Hb, serum ferritin, serum retinol, zinc, folate, vitamin B12, serum TfR, total body iron, prevalence of anaemia, iron deficiency anaemia, adherence, HAZ, WAZ, WHZ, weight, height, diarrhoea, fever, cough, runny nose, vomiting, intestinal helminth infections. | |
| Notes | Analyses in this review included the estimated effective sample size only, after adjusting data to account for clustering effect. Premix provided as 500‐g packs accompanied by 2 sets of standardised plastic spoons that measured 0.5 g (for 2 children) and 2.5 g (for 10 children) of premix. Schools provided with 1 monthly supply of premix and dark brown plastic containers for storage after opening packet to prevent breakdown of light‐sensitive micronutrients. After meal preparation, school cook measured appropriate number of spoons of premix (based on number of children present), which was mixed thoroughly with small quantity of water and then added to food at room temperature. At baseline, children in the 2 groups did not differ in age; gender; anthropometric indices; intestinal parasite infection; recent morbidities; and circulating concentrations of Hb, ferritin, retinol, zinc, folate and vitamin B12. Study enumerators visited twice weekly to study schools to assess registers to ensure correct procedures were followed. On such visits, enumerators observed premix addition to meals, provided schools with additional premix if needed and collected packaging material for used premix. Blood spots made on filter paper cards for laboratory determination of serum retinol. Source of funding: Micronutrient Initiative (Canada), World Food Programme (Italy), Tufts University (USA), and International Nutrition Foundation (USA). | |
| Risk of bias | ||
| Bias | Authors' judgement | Support for judgement |
| Random sequence generation (selection bias) | Low risk | Names of schools were written on identical pieces of paper that were folded and shuffled and used to allocate intervention. |
| Allocation concealment (selection bias) | Low risk | Only study co‐ordinator and senior World Food Program officials in Delhi had access to codes to premix assignment. In addition, as this was a cluster trial, it was unlikely that there was selection bias at individual level. |
| Blinding of participants and personnel (performance bias) | Low risk | Participants and personnel were unaware of intervention. Micronutrient and placebo premix were in identical packets, which had no information easily identifying the contents. Only study co‐ordinator and senior World Food Program officials in Delhi had access to codes to premix assignment. |
| Blinding of outcome assessment (detection bias) | Unclear risk | Study co‐ordinator had access to codes to premix assignment; unclear whether they assessed outcomes. |
| Incomplete outcome data (attrition bias) | Low risk | After intervention, 9% (n = 44) of participants were lost to follow‐up (11.6% in intervention group and 6% in control group). |
| Selective reporting (reporting bias) | Unclear risk | Insufficient information to allow judgement. |
| Other bias | Unclear risk | 2 selected schools were replaced using the same sampling procedure because the paths to these schools considered dangerous due to risk of wild animal attack. Data not adjusted for clustering. |
| Methods | Study design: cluster randomised clinical trial; 3‐arm design. Unit of allocation: classrooms (16). | |
| Participants | Location of the study: Baotou City, Neimenggu Autonomous Region, Northern China. Selection of participants: children attending Xin‐shi‐dai kindergarten (16 classroom clusters) in Baotou City. 4 classrooms for each group of 3‐year olds, 4‐year olds, 5‐year olds and 6‐year olds. Total 16 classrooms to select from, 6 assigned to daily MNP, 5 assigned to weekly MNP and 5 assigned to control. Selection criteria: enrolled in the school. Written parental consent. Sample size: 415 children. Age: 36‐60 months old (mean 57 months). Sex: both (approximately 45% girls). SES: parents had to pay a fee to admit their children to school; thus this was a relatively wealthy subgroup of the regional population. Baseline prevalence of anaemia: not reported. Baseline prevalence of soil helminths: not reported. Refugee status: not reported. Malaria endemicity: not reported. | |
| Interventions | 1 classroom (cluster) in each age group randomly assigned to 1 of 3 groups.
Iron dose: 30 mg of elemental iron. Type of iron compound: microencapsulated ferrous fumarate. Other nutrients: zinc (gluconate) 5 mg, vitamin A 300 μg RE, vitamin C 50 mg, vitamin D3 7.5 μg, folic acid 150 μg. Provision of MNP regimen: daily (65 sachets) (group 1) and weekly (13 sachets) (group 2). Duration of intervention: 13 weeks. Co‐intervention: not described. For the purposes of this review groups 1 and 2 were combined and compared with group 3. They were only split for the subgroup analysis by scheme. | |
| Outcomes | Number of MNP sachets consumed per child over the 13‐week period, serum ferritin concentration, free erythrocyte protoporphyrin and Hb concentration at end of study, HAZ, WAZ (data not reported), WHZ (data not reported), staining of teeth, metallic taste, stomach upset or any other adverse effects, compliance. | |
| Notes | Analyses in this review included the estimated effective sample size only, after adjusting data to account for clustering effect. Supplement mixed with standardised semi‐solid meal of rice porridge or congee. Control group received same meal but without MNP. Children added MNP sachet to their food under supervision by school teachers. Mean MNP consumption rate per child was 86% (daily group; SD 12%) and 87% (weekly group; SD 16%) adherence. On measures of anthropometric indices, we did not observe any significant differences among groups (data not shown). There were no reported adverse effects such as staining of teeth, metallic taste or stomach upset. Direct observations by research staff suggested that children did not comment on any change in taste of MNP‐served congee and accepted it well. Source of funding: Canadian Institutes of Health Research (Canada) and the HJ Heinz Foundation (USA). One of the authors owns the intellectual property rights to micronutrient Sprinkles®. | |
| Risk of bias | ||
| Bias | Authors' judgement | Support for judgement |
| Random sequence generation (selection bias) | Unclear risk | Method used for generation of random sequence not described. For each of the 4 age groups (3, 4, 5 and 6 year olds), 1 classroom randomly assigned to each of 3 arms (total 12 classrooms/clusters); no description of how remaining 4 of original 16 classrooms assigned to the 3 arms. |
| Allocation concealment (selection bias) | Unclear risk | Not mentioned. Since interventions were allocated at classroom level selection bias at individual level was unlikely. |
| Blinding of participants and personnel (performance bias) | High risk | Participants and students aware of intervention. After some acclimatisation period, children added MNP sachet contents to their congee (under supervision of the teachers). |
| Blinding of outcome assessment (detection bias) | High risk | Outcome assessors aware of intervention. |
| Incomplete outcome data (attrition bias) | Low risk | Participants enrolled in each group completed study but venous blood samples were available for 86% of participants in group 1 (daily), 84% in group 2 (weekly) and 85% in control group. |
| Selective reporting (reporting bias) | Unclear risk | Insufficient information to permit judgement. |
| Other bias | Unclear risk | Analyses in this review included the estimated effective sample size only, after adjusting data to account for clustering effect. No Hb samples taken at baseline for control group (group 3) for ethical reasons. At baseline, except for sex, the demographic characteristics were similar across groups (daily 39% boys, weekly 63% boys and control 62% boys). |
| Methods | Study design: randomised double‐blind placebo‐control trial; 2‐arm design. Unit of allocation: individual. | |
| Participants | Location of the study: Kimberley, Northern Cape, South Africa. Selection of participants: children attending preschool through grade 5 in either of 2 participating schools. Selection criteria: serum ferritin < 20 μg/L or serum TfR > 8.2 pg/L; Hb > 90 g/L; age 5‐11 years; no serious chronic medical problems; not taking nutritional supplements containing iron; parental consent. Sample size: 200 children. Age: 5‐11 years. Sex: both (45% girls). SES: low. Baseline prevalence of anaemia: 7.25% (6.3% intervention and 8.2% control). Baseline prevalence of soil helminths: not reported. Refugee status: no. Malaria endemicity: region free of malaria. | |
| Interventions | Participants randomly assigned to 1 of 2 groups.
Iron dose: 2.5 mg of elemental iron. Type of iron compound: NaFeEDTA. Other nutrients: zinc (as zinc oxide) 2.5 mg, ascorbic acid 60 mg, vitamin A (retinyl palmitate) 400 µg RE, folic acid 90 µg (0.09 mg), vitamin D3 5 µg, vitamin E 5 mg, niacin 6 mg, copper 340 µg, iodine 30 µg, thiamine 0.5 mg, riboflavin 0.5 mg, vitamin B6 (pyridoxine) 0.5 mg, vitamin B12 0.9 µg, calcium 200 µg; vitamin B5 (pantothenic acid) 2 mg, selenium 17 µg, phytase. Provision of MNP regimen: daily (5 days per week) (total 113 days). Duration of intervention: 23 weeks. Co‐intervention: all participating children received antihelminthic treatment at baseline with mebendazole 500 mg orally. | |
| Outcomes | Primary outcomes: iron and zinc status. Other outcomes: height, weight, HAZ, WAZ, WHZ, triceps skin fold, subscapular skin fold, MUAC and adherence. | |
| Notes | All participants consumed a bowl of 250 g of sweetened high‐phytate maize porridge prepared by trained field workers each morning with partially degermed, unfortified maize flour, water and a small quantity of sucrose. Porridge provided in addition to lunch meal of existing lunch feeding programme. No differences in the prevalence of elevated CRP (inflammation) between groups at baseline or 6 months, so because of low prevalence, children with elevated values were included in analysis, which had no substantial effect on results. Source of funding: Foundation Nutrition Industry (Switzerland), established by DSM Nutritional Products Ltd, ETH (Eidgenössische Technische Hochschule) Zurich (Switzerland); Medical Research Council, (South Africa); and North‐West University, Potchefstroom, (South Africa). | |
| Risk of bias | ||
| Bias | Authors' judgement | Support for judgement |
| Random sequence generation (selection bias) | Unclear risk | Method used to generate random sequence unclear. |
| Allocation concealment (selection bias) | Low risk | Cooked porridge was served in colour‐coded bowls. |
| Blinding of participants and personnel (performance bias) | Low risk | Participants and caretakers blinded to interventions. Control group received an identical‐appearing powder consisting of unfortified carrier. |
| Blinding of outcome assessment (detection bias) | Unclear risk | Insufficient information to permit judgement. |
| Incomplete outcome data (attrition bias) | Low risk | 4% did not complete study (5 participants in intervention group and 3 participants in control group). |
| Selective reporting (reporting bias) | Unclear risk | Data on adverse effects not reported. |
| Other bias | Low risk | Sex ratio varied at baseline between groups but was not different statistically P > 0.05 (boy:girl ratio: intervention 61:39; control 50:50). Analyses were adjusted for sex. |
| Methods | Study design: cluster randomised double‐blind trial; 2‐arm design. Unit of allocation: Anganwandi (daycare) centres (30). | |
| Participants | Location of the study: Mahestala block in South 24 Parganas, West Bengal, India. Selection of participants: 1 Anganwadi centre per 1000 people in general population and a mean of 20‐30 children per centre. To be eligible, a centre had to have 20 regularly attending children and a regular supply of rice and lentils from Integrated Child Development Service, and Anganwadi personnel needed to be willing to participate. Selection criteria: attending village‐based Integrated Child Development Service Anganwadi (daycare centres). Excluded if they had severe anaemia (Hb 80 g/L) and history of not attending the Anganwadi centre 5 times/week during the past 6 months. Sample size: 684 children. Age: 36‐66 months (mean 3.9 years). Sex: both. SES: not explicitly reported but likely low as children participating in the Integrated Child Development Service and attending the Anganwadi (daycare) centres received food supplements to improve health and nutritional status and relieve short‐term hunger. Baseline prevalence of anaemia: 25%. Baseline prevalence of soil helminths: prevalence of hookworm and other intestinal parasites low in this section of West Bengal. Refugee status: no. Malaria endemicity: low. | |
| Interventions | Participating centres randomly assigned to 1 of 2 groups.
Iron dose: 14 mg of elemental iron. Type of iron compound: microencapsulated ferrous fumarate. Other nutrients: vitamin A (retinyl acetate) 150 µg RE (500 IU), folic acid 50 μg (0.05 mg). Provision of MNP regimen: daily (6 times/week). Duration of intervention: 24 weeks. Co‐intervention: none. | |
| Outcomes | Hb, serum ferritin, serum retinol, prevalence rates of anaemia, iron deficiency, vitamin A deficiency, low vitamin A status, fever, abdominal pain, blood in stools, coughing. | |
| Notes | Analyses in this review included the estimated effective sample size only, after adjusting data to account for clustering effect. All attending children received a single 200 g portion of the khichdi treatment assigned to their Anganwadi centre. Anganwadi workers were taught proper storage procedures for the fortified premix to ensure that the premix was not exposed to excessive light or high humidity. Anganwadi workers were also taught proper preparation techniques (i.e. they were instructed to thoroughly mix the premix with the khichdi after the khichdi had cooled for 10 minutes to ensure a homogeneous mixture). Both premixes packed in resealable polyethylene bags in 500‐g increments. Each selected Anganwadi centre received 500‐g premix at baseline and after 3 months of intervention. Source of funding: Molecular Diagnostics (India) and the Child in Need Institute (India), Micronutrient Initiative (Canada) and Tufts University Friedman School of Nutrition Science and Policy (USA). | |
| Risk of bias | ||
| Bias | Authors' judgement | Support for judgement |
| Random sequence generation (selection bias) | Low risk | Random sequence generated with a random number table. |
| Allocation concealment (selection bias) | Low risk | Since interventions were allocated at Agarwandi level, selection bias at individual level unlikely. |
| Blinding of participants and personnel (performance bias) | Low risk | Participants and personnel blinded to interventions. |
| Blinding of outcome assessment (detection bias) | Unclear risk | Unclear. |
| Incomplete outcome data (attrition bias) | High risk | Of the children enrolled, 168 (24.5%) were lost to follow‐up before the 24‐week assessment, with some imbalance between groups. 98/342 (28.6%) participants withdrew or were lost to follow‐up in the fortified khichdi, while 73/342 (21.3%) participants withdrew or were lost to follow‐up in the non‐fortified khichdi. |
| Selective reporting (reporting bias) | Unclear risk | Insufficient information to allow judgement. |
| Other bias | Low risk | None apparent. |
| Methods | Study design: pre‐ and post‐test with intervention and control schools randomly selected. Unit of allocation: school (5). | |
| Participants | Location of study: Chennai, Tamilnadu, South India. Selection of participants: from a survey of residential schools, study schools were selected prior to randomisation because these children had the lowest intake of outside (unfortified) cooked foods and schools had fewest holidays where children were allowed to go home, which would cause less disruption in study. Selection criteria: children in control group (might also be intervention children but not written clearly) with severe anaemia and vitamin A deficiency were treated and excluded. Intervention and control group children were selected after establishing their homogeneity in terms of age and SES. Sample size: 413 children. Age: 5‐15 years. Sex: both (57% girls, information provided by author). SES: low, families of all children had a monthly income < INR 1500 (USD 30). Baseline prevalence of anaemia: not reported. Baseline prevalence of soil helminths: likely high prevalence as all children were dewormed at baseline, after 4 months and after 9 months. Refugee status: no. Malaria endemicity: not reported. | |
| Interventions | In intervention schools, there was a dosage of 1 g per child per day so that every month the required quantity for all children was pre measured, packed, sealed and delivered to the central kitchen at the schools so that 1 packet could be cut open every day and added to food during cooking. Supplement was dissolved in water and added to liquid food in the final stages of cooking, and it was sprinkles onto solid foods. All children ate in a central dining room.
Iron dose: 10 mg of elemental iron. Type of iron compound: chelated ferrous sulphate (along with malic acid as a biopromoter). Other nutrients: (per 1 g) vitamin A 900 µg RE (3000 IU), vitamin B2 1 mg, calcium pantothenate 1 mg, niacin 15 mg, vitamin B6 1 mg, vitamin E 30 IU, vitamin C 30 mg, lysine 250 mg, 13.75% of weight calcium. Provision of MNP regimen: daily. Duration of intervention: 9 months. Co‐intervention: deworming at baseline, after 4 months, and at endpoint (9 months). | |
| Outcomes | Hb, anaemia, serum vitamin A, vitamin E, vitamin B12, folate, clinical signs of vitamin A deficiency (Bitot's spots, xerosis), angular stomatitis, height, weight. | |
| Notes | Analyses in this review included the estimated effective sample size only, after adjusting data to account for clustering effect. Vitamin A, folic acid, vitamin B12 and vitamin E were only analysed in certain participants, such as those with clinical signs of vitamin A deficiency or low Hb values. Generally observed that no waste of food prepared in schools and all prepared food was consumed. Children served themselves desired quantities and usually no food was left over on plate. No adverse effects reported (information provided by author). Source of funding: Sundar Serendipity Foundation (India) and MS Swaminathan Research Foundation (India). | |
| Risk of bias | ||
| Bias | Authors' judgement | Support for judgement |
| Random sequence generation (selection bias) | Low risk | Study schools chosen prior to randomisation, which was done by computer‐generated random table (latter information provided by author). |
| Allocation concealment (selection bias) | Low risk | Since interventions were allocated at school level, selection bias at individual level unlikely. |
| Blinding of participants and personnel (performance bias) | High risk | Participants and personnel aware of treatment and used no placebo. |
| Blinding of outcome assessment (detection bias) | High risk | School aware of intervention (information provided by author). |
| Incomplete outcome data (attrition bias) | Low risk | All children completed study. |
| Selective reporting (reporting bias) | Unclear risk | Insufficient information to allow judgement. |
| Other bias | Low risk | None apparent. |
| Methods | Study design: pre‐ and post‐test design with randomly selected intervention and control groups. Unit of allocation: schools (2). | |
| Participants | Location of the study: Chennai, Tamilnadu, India. Selection of participants: randomly selected an intervention and control school from a list of schools in Chennai that provide a noon meal. All parents gave informed consent. Selection criteria: children with severe anaemia (Hb < 8 g/dL) treated and excluded from both intervention and control schools. Sample size: 136 children. Age: 5‐9 years of age. Sex: both. SES: low. Families had monthly income < INR 2000 (USD 50). Baseline prevalence of anaemia: 60% intervention and 92.1% control groups. Baseline prevalence of soil helminths: not reported. Refugee status: no. Malaria endemicity: not reported. | |
| Interventions | Intervention school provided with powder to add to school lunches. Participants randomly assigned to 1 of 2 groups.
Iron dose: 28 mg of elemental iron. Type of iron compound: ferrous glycine phosphate. Other nutrients: riboflavin 1 mg. Provision of MNP regimen: daily (5 times/week) (total 144 days). Duration of intervention: 6 months (July to December). Co‐intervention: children in both groups were de wormed with albendazole (400 mg) at baseline and end of study. | |
| Outcomes | Hb, anaemia, clinical assessment of angular stomatitis. | |
| Notes | Analyses in this review include the estimated effective sample size only, after adjusting data to account for clustering effect. Children were homogenous in terms of age and SES. Mean attendance during the 6 months of study was > 90%. Source of funding: Sundar Serendipity Foundation (India) and MS Swaminathan Research Foundation (India). | |
| Risk of bias | ||
| Bias | Authors' judgement | Support for judgement |
| Random sequence generation (selection bias) | Unclear risk | The 2 schools were randomly selected. Method used to allocate intervention not described. |
| Allocation concealment (selection bias) | Low risk | Since interventions were allocated at school level selection bias at individual level unlikely. |
| Blinding of participants and personnel (performance bias) | High risk | Participants and personnel aware of intervention and used no placebo. |
| Blinding of outcome assessment (detection bias) | Unclear risk | Not described. |
| Incomplete outcome data (attrition bias) | Low risk | All children completed study. |
| Selective reporting (reporting bias) | Unclear risk | Insufficient information to allow judgement. |
| Other bias | High risk | Serious imbalance between groups for baseline Hb and anaemia. |
CRP: C‐reactive protein; HAZ: height‐for‐age Z‐score; Hb: haemoglobin; HDSS: Health and Demographic Surveillance System; MNP: micronutrient powder; MUAC: mid‐upper arm circumference; n: number of children; NaFeEDTA: sodium iron ethylenediaminetetraacetic acid; NCHS: National Center for Health Statistics; RE: retinol equivalent; SD: standard deviation; SES: socioeconomic status; TE: tocopherol equivalent; TfR: transferrin receptor; UNICEF: The United Nations Children's Fund; WAZ: weight‐for‐age Z‐score; WHO: World Health Organization; WHZ: weight‐for‐height Z‐score.
Characteristics of excluded studies [ordered by study ID]
| Study | Reason for exclusion |
| 302 mothers and children aged 8‐20 months from 45 rural villages of Khansama sub district of northern Bangladesh randomly assigned according to village (cluster) to 1 of 3 groups: group 1 (16 villages): participating mothers received 12 informational sessions on health and nutrition; group 2 (15 villages): participants received an additional 6 sessions delivered by peer educators who included modelling and coached practice in self‐feeding and verbal responsiveness with the child during play; group 3 (14 villages): along with the sessions, 6 months of a food powder fortified with minerals and vitamins. Sachets contained 12.5 mg of elemental iron, vitamin A 300 μg, folic acid 150 μg, vitamin C 50 mg, zinc 5 mg. Developmental outcomes included Home Observation for Measurement of the Environment Inventory, mother‐child responsive talk and language development. Nutritional outcomes included weight, height, self‐feeding and mouthfuls eaten. Age of children outside scope of review. | |
| Consecutive 200 children aged 12‐59 months with diagnosis of iron deficiency anaemia based on history, physical examination, CBC and serum ferritin levels attending the Combined Military Hospital, Multan, Punjab Province of Pakistan for any health problem and their healthy siblings randomly assigned to 1 of 2 groups: group 1: iron in syrup at 6 mg/kg of elemental iron per day divided into 3 doses; group 2: equivalent doses of iron powder sprinkled over food. Iron powder obtained by crushing ferrous sulphate tablets. Tablet divided into 4 fractions and subsequently crushed and dispensed in plastic sachet of 0.25 tablet. Iron powder was sprinkled over rice, potatoes and porridge. Participants were followed up with Hb estimation and reticulocyte response at 2, 4 and 6 weeks. CBC and serum ferritin repeated at 6 weeks. 51% of participants were 12‐24 months of age. Type of participants did not meet the inclusion criteria for this review. | |
| Cross‐sectional study carried out in Saturia Upazilla (sub district) of Manikganj District in rural Bangladesh among mothers of children aged 6‐59 months who received multiple MNP (Pushtikona) containing per sachet: vitamin A 0.4 mg, vitamin C 30 mg, vitamin D 0.005 mg, vitamin E 5 mg, vitamin B1 0.5 mg, vitamin B2 0.5 mg, niacin 6 mg, pyridoxine 0.5 mg, vitamin B12 0.0009 mg, folic acid 0.15 mg, elemental iron 10 mg, zinc 4.1 mg, copper 0.56 mg, selenium, iodine 0.09 mg sprinkled onto any semi‐solid food supplied by BRAC South Sudan in the past 60 days to assess adherence to MNP and associated factors. Study design outside scope of review. | |
| 360 children aged 12‐60 months attending 4 public daycare centres in Rio de Janeiro, Brazil, were randomly assigned to 1 of 2 groups: group 1 (n = 180): daily meal prepared with iron‐fortified rice (with iron bisglicinate); group 2 (n = 174): non‐fortified placebo rice. Rice fortified once a week for 16 weeks with iron 4.2 mg for every 100 g of food ready in supplemented group. On days of fortification, solution added as iron drops to rice by researcher during assembly of the dishes from lunch. If the child requested an additional portion, the fortification solution (iron drops) was also administered to that additional portion, in a similar proportion to the amount of rice offered previously. Type of intervention is point‐of‐use fortification with iron drops and was outside the scope of this review. | |
| 226 apparently healthy preschool children (24‐60 years old) from 15 nurseries or kindergartens in the Banan District of Chongqing, China, were randomly assigned to 1 of 3 groups for 6 months: group 1 (n = 61): fortified powder containing vitamin A (as acetate) 500 μg; group 2 (n = 71): fortified powder containing vitamin A (as acetate) 500 μg + 12 mg of elemental iron (as ferric sodium edentate); group 3 (n = 94): fortified powder containing vitamin A (as acetate) 500 μg + 12 mg of elemental iron (as ferric sodium edentate) + zinc (as zinc oxide) 12 mg, thiamine (as thiamine mononitrate) 0.7 mg, riboflavin 0.7 mg, folic acid 200 μg, niacinamide 7 mg, calcium (as calcium carbonate) 800 mg. Powders were sprinkled over porridge, soy milk, soup or noodles after cooking and were indistinguishable in taste, colour and packaging. Foods prepared with powders were delivered to each child at lunchtime or afternoon snack time 5 days a week. Type of intervention involved a fortified condiment or seasoning in powder form and not an MNP for point‐of‐use fortification. | |
| Cluster‐randomised controlled trial conducted in 60 rural communities with community‐based preschools in southern Mali. Children aged < 5 years living in 30 intervention communities received 2 rounds of seasonal malaria chemoprevention in October and November 2013, followed by home fortification with MNP for 4 months from January to April 2014. Delivery of interventions at community‐level organised by preschool management committees. Combined impact of interventions evaluated in May 2014 through cross‐sectional surveys to compare malaria infection, nutritional indices and cognitive performance. This was a before‐and‐after study without control assessing the combination of 2 interventions. The abstract contained limited additional information. | |
| Post‐tsunami experience with distribution of Vitalita sprinkles in Aceh and Nias, Indonesia and analysis data on knowledge, recognition of package, consumption and acceptability by mothers and children. Intervention did not have control group and was a descriptive article. | |
| 150 healthy 5‐ to 7‐month‐old infants randomly assigned to 1 of 2 groups: group 1 (n = 74): daily packet of MNP (Supplefer®) sprinkles (Sprinkles Global Health Initiative, Toronto, Ontario) containing 12.5 mg of elemental iron (as encapsulated iron) + vitamin A 480 µg RE (1600 IU), vitamin C 30 mg, folic acid 160 μg (0.16 mg), zinc 5 mg; group 2 (n = 76): multiple micronutrient drops (Tri‐Vi‐Sol with Iron®) (Mead Johnson and Company, Evansville, Indiana) containing 10 mg of elemental iron (as sulphate heptahydrate), vitamin A 450 µg RE (1500 IU), vitamin D 400 IU, and vitamin C 35 mg. Follow‐up included alternating telephone and home visits twice weekly for 3 months. Adherence was primary outcome and adverse effects and caretaker's attitude about supplements were secondary outcomes. Use of ferrous fumarate powder rather than traditional ferrous sulphate drops did not improve adherence with daily iron supplementation in low‐income infants. The study compares provision of micronutrients in powders to be added to food versus the provision of micronutrient in drops. Participants outside age range defined for inclusion in this review. Type of participants and type of comparisons are outside scope of this review. | |
| Trial aimed to find out whether adding a small quantity of powdered beef liver to daycare meals of Brazilian preschool children from Salvador for 12 months could prevent anaemia and micronutrient deficiencies, improve growth, health and development in the same way or better than adding a small quantity of micronutrients in powder form (Sprinkles). Trial not conducted because baseline micronutrient survey data showed no evidence of micronutrient deficiencies among the preschool children (personal communication). | |
| 432 anaemic (Hb 70‐100 g/L) children aged 6‐18 months, both sexes, living in Maharashtra, India, during 2004 and 2005, taking semi‐solid or solid weaning foods, not taking hematitic, likely to remain within study area for 2 months, with no major illness and non‐severe anaemia (Hb < 70 g/L). The 21 villages (n = 432) were randomised into 5 groups: group 1 (n = 84): daily MNP containing 12.5 mg of elemental iron (as microencapsulated ferrous fumarate), zinc (as gluconate) 5 mg, vitamin A 300 μg RE, and ascorbic acid 30 mg, folic acid 160 μg; group 2 (n = 83): daily MNP with 20 mg of elemental iron (as microencapsulated ferrous fumarate), zinc (as gluconate) 5 mg, vitamin A (as acetate) 300 μg RE, ascorbic acid 30 mg, folic acid 160 μg (0.16 mg); group 3 (n = 101): daily MNP with 30 mg of elemental iron (as microencapsulated ferrous fumarate), zinc (as gluconate) 5 mg, vitamin A 300 μg RE and ascorbic acid (as acetate) 30 mg, folic acid 160 μg; group 4 (n = 82): MNP daily containing 20 mg of elemental iron (as micronized ferric pyrophosphate), zinc (as gluconate) 5 mg, vitamin A (as acetate) 300 μg RE, ascorbic acid 30 mg, folic acid 160 μg; group 5 (n = 83): iron drops containing 20 mg of elemental iron (as ferrous glycine sulphate drops) daily. Type participants outside age range defined for inclusion in this review. | |
| 714 infants and young children 6‐35 months of age participating in a pilot project carried out between December 2009 and August 2010 in regions of Apurimac, Ayacucho and Huancavelica, Peru. Intervention provided to all infants and young children in these communities. Protocol indicated that infants and children should be provided with at least 15 sachets of multiple MNP per month during 6‐month period. Multiple MNP provided contained 12.5 mg of elemental iron (as ferrous fumarate), zinc 5 mg, ascorbic acid 30 mg, vitamin A ˜300 µg RE (999 IU), folic acid 0.16 mg. MNP sachets were distributed as part of a grant from the World Food Programme to the Government of Peru. Cross‐sectional study conducted between October and November 2010 in 6 of 7 provinces in the Apurimac region to assess implementation of the universal "Chispitas®" multiple micronutrient supplement programme by determining the quantity and quality of sachets consumed and their connection with anaemia. Type of study design and comparisons outside scope defined for inclusion in this review. | |
| 362 children (Hb ≥ 70 g/L) aged 6‐24 months living in 16 villages in Kaliganj sub district of Gazipur district in Bangladesh in this cluster‐randomised design were assigned to 1 of 3 groups: group 1 (5 villages, n = 120): 60 sachets of MNP daily over 2 months; group 2 (6 villages, n = 120): MNP flexibly over 3 months; group 3 (5 villages, n = 122): MNP flexibly over 4 months. Content of Sprinkles sachets was identical for all groups and included 12.5 mg of elemental iron (as microencapsulated ferrous fumarate), zinc (as zinc gluconate) 5 mg, vitamin A as retinol acetate 300 µg RE, folic acid 160 μg (0.16 mg), vitamin C 50 mg. Study conducted from May to September 2004. With a flexible regimen, mothers/caretakers decided how frequently to use MNP without exceeding 1 sachet per day. Outcomes postintervention included adherence, acceptability and haematological status, which also was evaluated at 6 months postintervention. The adherence, acceptability and haematological response to flexible administration over 4 months were preferable to daily. Participants outside age range defined for inclusion in this review. | |
| 3112 infants aged 6‐7 months residing in Svay Rieng Operational Health District, Cambodia who were identified through listings of infants at health centre and village levels. This district was representative of rural Cambodia with a reasonably well‐functioning government health system and a low malaria incidence rate (< 1 case/1000 population). Cluster‐randomised trial with health centre catchment area as unit of randomisation. Clusters randomly assigned to 1 of 2 interventions: group 1 (10 centres, n = 1579): infant and young child feeding education only; group 2 (10 centres, n = 1533): infant and young child feeding education and daily Sprinkles in single‐dose sachets, delivered monthly to their homes by government village health workers. Sprinkles were mixed with the infant's meal immediately before serving. MNPs contained 12.5 mg of elemental iron (as microencapsulated ferrous fumarate), zinc (as gluconate) 10 mg, vitamin A (as retinol acetate) 300 μg RE, iodine 90 μg, vitamin B1 0.5 mg, vitamin B2 0.5 mg, vitamin B6 0.5 mg, vitamin B12 0.9 μg, niacin 6 mg, folic acid 160 μg (0.16 mg), ascorbic acid 30 mg, copper 0.3 mg, vitamin D 5 μg and vitamin E 6 IU. Adherence assessed monthly by count of unused sachets from each household. The infant and young child feeding education provided to caretakers of both groups in verbal, written and pictorial form together with cooking demonstrations, focusing on frequency, quantity, consistency and an increased consumption of animal‐source foods. Immunisations, biannual vitamin A capsules and mebendazole tablets (for deworming) provided to all children according to Cambodia Ministry of Health guidelines. Infants followed up to 24 months of age and outcomes measured at 6, 12, 18 and 24 months of age. Participants outside age range defined for inclusion in this review. | |
| 115 Kenyan infants aged 6 months in Msambweni County, in southern coastal Kenya, a malaria‐endemic area, consumed home‐fortified maize porridge daily for 4 months. 2 studies conducted. In study 1 (n = 80), infants randomly assigned to receive MNP containing 2.5 mg of elemental iron (as NaFeEDTA) (NaFeEDTA ± 2.5 mg of FeMNP, MixMe, DSM Nutritional Products Europe, Basel, Switzerland) or MNP without iron. In study 2 (n=80), they received a different MNP containing 12.5 mg of elemental iron (as ferrous fumarate) (± 12.5 mg of FeMNP, Sprinkles, Hexagon Nutrition, Mumbai) or MNP without iron. For 4 months, 7 MNP sachets and 2 kg of maize flour (Dola, Kitui Flour Mills, Mombasa, Kenya) were provided directly to participating mothers from 6 distribution points. Primary outcome was gut microbiome composition analysed by 16S pyro‐sequencing and targeted real‐time polymer chain reaction. Secondary outcomes included faecal calprotectin (marker of intestinal inflammation) and incidence of diarrhoea. Participants outside age range defined for inclusion in this review. | |
| 100 infants aged 6‐11 months living in 26 rural villages in the Kaliganj sub district of Gazipur, Bangladesh randomised to 1 of 2 groups containing MNP with or without calcium for 2 months. Group 1: MNP contained 12.5 mg of elemental iron (as ferrous fumarate), zinc 5 mg, folic acid 160 μg, vitamin A 300 μg RE, vitamin C 30 mg. Group 2: MNP formulation + calcium 400 mg. Primary outcomes were Hb concentrations, adherence and adverse effects. Type of comparisons and participants outside scope of this review. | |
| 153 children mean age (± SD) 55.8 ± 11.2 months from 3 randomly selected nursery schools of medium, low and very low socioeconomic status in a suburb of Kampala, Uganda. Participants received either Zn (as zinc sulphate) 10 mg (n = 79) or placebo (n = 76) daily in freshly prepared fruit juice, Monday to Friday inclusive for 6 months. Type of intervention outside scope of this review. | |
| 569 children aged 5.5‐13.4 years from 10 schools in sub district of Trakan Phutphon, Ubon Ratchathani province, in northeast Thailand, were randomly assigned to receive a seasoning powder (monosodium glutamate, salt, sugar, hydrolysed vegetable protein and dried meat powder) fortified with zinc 5 mg, 5 mg of elemental iron, vitamin A 270 μg RE and iodine 50 μg (per serving) or an unfortified seasoning powder with no micronutrients. Seasoning incorporated into a school lunch prepared centrally and delivered 5 days per week for 31 weeks. Type of intervention involved a fortified condiment or seasoning in powder form and not an MNP for home fortification. | |
| 415 children of both sexes aged 9‐24 months at start of 2 months' intervention, with no severe anaemia (Hb < 70 g/L), not receiving wheat‐soy‐blend, living in rural Haiti and who were accompanied by their mother. Prevalence of anaemia at start was 46%. Randomisation was into 2 groups at food distribution point: group 1 (6 food distribution points, n = 254): daily MNP with 12.5 mg of elemental iron (as fumarate), zinc (as gluconate) 5 mg, vitamin A 400 μg RE, folic acid 160 μg (0.16 mg), vitamin C 30 mg; group 2 (4 food distribution points, n = 161): control group. Both groups received 8 kg of wheat‐soy‐blend, 2.5 kg oil (vitamin A fortified) and indirect ration of 10 kg soy‐fortified bulgur, and 2.5 kg brown lentils. The MNP were distributed once a month with the fortified wheat‐soy‐blend, each time 30 sachets with pictorial instructions were given to intervention group. Control group received the wheat‐soy‐blend. Type of participants outside age range defined for inclusion in this review. | |
| Cluster‐randomised, non‐blinded evaluation with uncontrolled before‐and‐after cross‐sectional surveys to assess the impact of providing intensified interpersonal counselling + mass media + community mobilisation (intensive) compared with standard nutrition counselling + less intensive mass media + community mobilisation (non‐intensive) on complementary feeding practices and anthropometric measurements. In half the sample, randomly allocated in both the intensive and non‐intensive areas, the Shasthya Sebika offered MNP sachets containing iron, folic acid, zinc, and vitamins A and C for sale to mothers and received a small commission from the sales. Type of intervention and study design outside scope of this review. | |
| 927 children aged 6‐12 months, beneficiaries of the Oportunidades programme, a conditional cash transfer programme implemented in rural areas in 1997 and urban areas in 2002 with authorisation of Oportunidades officials at the federal, state and local level, National Institute of Public Health Ethics Commission, in Mexico from communities (18 per supplement) randomly assigned to receive a fortified food, syrup or multiple MNP Sprinkles. Supplements delivered daily (6 months). Communities were randomly assigned (18 communities per supplement) to 1 of 3 interventions: group 1 (n = 265): 44 g of daily supplement Nutrisano (fortified food) containing 10 mg of elemental iron (as ferrous gluconate), vitamin A 400 μg RE, zinc 10 mg, vitamin C 50 mg, folic acid 50 μg (0.05 mg), vitamin E 6 mg, vitamin B2 0.8 mg and vitamin B12 0.7 μg and also provided energy, protein, lipids, carbohydrates and sodium; group 2 (n = 323): 5 mL of syrup daily containing 10 mg of elemental iron (as ferrous gluconate), vitamin A 400 μg RE, zinc 10 mg, vitamin C 50 mg, folic acid 50 μg (0.05 mg), vitamin E 6 mg, vitamin B2 0.8 mg, vitamin B12 0.7 μg; group 3 (n = 339): MNP 1 g (Sprinkles) containing 10 mg of elemental iron (as ferrous fumarate), vitamin A 400 μg RE, zinc 10 mg, vitamin C 50 mg, folic acid 50 μg (0.05 mg), vitamin E 6 mg, vitamin B2 0.8 mg, vitamin B12 0.7 μg. Child growth, development and micronutrient status measured at baseline. Hb concentration, anaemia after 4 and 10 months of supplementation and at 24 and 30 months of age. Preliminary results indicated that after 4 months' supplementation, the prevalence of anaemia was significantly (P < 0.05) higher in children receiving the Nutrisano (fortified food) in comparison with the multiple MNP and syrup. At 24 months of age, anaemia had decreased in all 3 groups (P < 0.001), but remained slightly higher in the Nutrisano (fortified food) group (fortified food: 12.3%, syrup: 8.8%, multiple MNP: 9.2%). The large decrease and the low prevalence at 24 months suggested that all supplements were similarly efficacious to prevent and cure anaemia; with the effect observed slower in children who received fortified food. Attrition was 20%, no difference between groups, no differences in characteristics of children lost to follow‐up and those who completed trial. Main reasons for attrition were: dislike or perceived reacted to supplements (43%) and migrated out of community (18%); but were not different between groups. The type of participants outside age range defined for inclusion in this review. | |
| 396 children aged 6‐10 years home‐based in Adelaide, South Australia, and 384 children at 6 primary schools in Jakarta, Indonesia randomly allocated to 1 of 4 groups: group 1 (n = 106): drink containing 10 mg of elemental iron (as NaFeEDTA), zinc (as zinc sulphate) 5 mg, RE vitamin A (as retinol acetate) 400 µg, folic acid 150 µg, vitamin B6 1 mg, vitamin B12 1.5 µg, vitamin C 45 mg; group 2 (n = 96): docosahexanoic acid 88 mg + eicosapentaenoic acid 22 mg; group 3 (n = 92): 10 mg of elemental iron (as NaFeEDTA), zinc (as zinc sulphate) 5 mg, vitamin A (as retinol acetate) 400 µg RE, folic acid 150 µg (0.15 mg), vitamin B6 1 mg, vitamin B12 1.5 µg, vitamin C 45 mg, docosahexanoic acid 88 mg and eicosapentaenoic acid 22 mg; group 4 (n = 102): placebo. Fruit‐flavoured drinks (soy 0.6%) used 6 days a week for 12 months as vehicle for all treatments, which were added as powders. Trials conducted from August 2003 to April 2005. Intervention products used consisted of 4 powdered fortificants that were added to a base powder containing protein 8 g, sugar 12 g and maltodextrin 4 g to be dissolved in 100 mL of a soy‐based fruit drink in a plastic shaker with a screw top and then shaken for ≥ 20 seconds. Type of intervention outside scope of this review. | |
| Review on studies assessing the effects of iron‐fortified foods on the gut microbiome, gut inflammation and diarrhoea for infants and children. Not an intervention study. | |
| Summary of the projects implemented as part of the World Food Programme and DSM partnership that have been implemented with the United Nations High Commissioner for Refugees either in context of refugee camps or emergency response. Several studies have been nested in these projects to assess potential impact of MNP on nutrition and health status of beneficiaries. MNP programmes in Bangladesh have been conducted as part of the Cyclone Sidr response targeting 101,000 children aged under 5 years and 59,000 pregnant and lactating women, food‐ and cash‐for‐work activities implemented in response to high food prices (targeting 14,500 children aged 6‐24 months and 6000 pregnant and lactating women, and programming in the Rohinga refugee camps. 2 projects providing multiple MNP are being carried out in Nepal: 1 in Bhutanese refugee camps (targeting 8500 children aged 6‐59 months) and another as part of high‐food price emergency response (targeting > 114,000 children aged 6‐59 months). In Kenya, one project at the Kakuma camp targeted 55,000 refugees of all ages. Study design varied from a cohort of children followed prospectively to pre‐ and postintervention population‐based representative cross‐sectional surveys to assess the impact of MNP. Main outcome assessed was Hb concentration as a proxy indicator of micronutrient deficiencies. Type of study design outside scope of this review. | |
| 234 infants aged 6‐12 months recruited from 36 nurseries in the Democratic People's Republic of Korea and randomly divided into 1 of 2 groups: group 1: rice porridge fortified with 10 mg of iron (as ferrous sulphate) per day, added to the water in which rice was cooked; group 2: non‐fortified cereal for 6 months. Types of intervention outside scope of this review. | |
| 362 eligible children aged 6‐18 months with Hb ≥ 70 g/L, with no clinical signs of acute or chronic illness who were receiving at least 1 complementary food and whose mothers were permanent residents of Hashtgerd, Iran were randomly assigned to 1 of 3 groups: group 1 (n = 120): Sprinkles, containing iron (as ferrous fumarate) 10 mg, zinc (as gluconate) 5 mg, vitamin A 375 µg, vitamin D 5 µg, vitamin E 6 mg, vitamin C 35 mg, vitamin B1 0.5 mg, vitamin B2 0.5 mg, vitamin B6 0.5 mg, vitamin B12 0.9 µg, niacin 6 mg, folic acid 150 µg, copper (as gluconate) 0.6 mg, iodine 59 µg; group 2 (n = 121): FoodLETS containing iron (as ferrous fumarate) 12.5 mg, zinc (as gluconate) 5 mg, vitamin A 300 µg, vitamin D 5 µg, vitamin E 6 mg, vitamin C 30 mg, vitamin B1 0.5 mg, vitamin B2 0.5 mg, vitamin B6 0.5 mg, vitamin B12 0.9 µg, niacin 6 mg, folic acid 160 µg, copper (as gluconate) 0.3 mg, iodine 590 µg; group 3 (n = 121): multiple micronutrients drops containing 9 micronutrients including iron (as ferrous sulphate) 10 mg, vitamin A 450 µg, vitamin D 10 µg, vitamin E, vitamin C 35 mg, vitamin B1 0.5 mg, vitamin B2 0.6 mg, vitamin B6 0.4 mg and niacin 8 mg. Intervention lasted 4 months. Assessed Hb, serum ferritin, serum retinol, serum zinc, 25(OH) D concentration and anthropometry at baseline and 4 months. Participants outside age range defined for inclusion in this review. | |
| 143 healthy institutionalised infants and children aged 6‐48 months of both sexes living in Salvador, Bahia, Brazil in 2009 randomly assigned to 1 of 2 groups: group 1 (n = 75): daily sachet of sprinkles containing iron (as ferrous fumarate) 12.5 mg, zinc (as gluconate) 5 mg, vitamin A 375 µg RE, vitamin E 6 mg, vitamin C 35 mg, vitamin B1 0.5 mg, vitamin B2 0.5 mg, vitamin B6 0.5 mg, vitamin B12 0.9 µg, vitamin C 30 mg, vitamin D3 5 µg, niacin 6 mg, copper (as gluconate) 0.6 mg, and iodine (as potassium iodate) 50 µg; group 2 (n = 68): iron (as ferrous fumarate) 12.5 mg, vitamin A 375 µg RE, vitamin E 6 mg, vitamin C 35 mg, vitamin B1 0.5 mg, vitamin B2 0.5 mg, vitamin B6 0.5 mg, vitamin B12 0.9 µg, vitamin C 30 mg, vitamin D3 5 µg, niacin 6 mg, copper (as gluconate) 0.6 mg, iodine (as potassium iodate) 50 µg with no zinc. Both groups received multiple MNP for point‐of‐use fortification of foods for 90 days. MNPs were mixed with different foods by trained nutritionists who were not blinded to intervention provided as sachets were identified as having or not having zinc. Outcomes assessed were diarrhoea and acute respiratory infection. Type of comparisons outside scope of this review. | |
| Paper summarises 3 projects with social marketing approach that were jointly carried out by Cuban government and United Nations agencies, aiming to reduce anaemia in boys and girls aged up to 5 years. Quantitative and qualitative methods and the triangulation of their results were used. All projects included training of key actors in healthy child feeding, nutrition and prevention of anaemia as well as extensive education to the families. 2 projects delivered an iron‐fortified foodstuff and the other 1 distributed multiple micronutrients powders for anaemia control and prevention among young children 12‐24 months of age living at "Calixto García" municipality Holguín province, 2009‐2011. No data available. Type of comparisons, study design and type of participants outside scope of this review. | |
| 290 term infants aged 6‐12 months recruited through health posts of Valley of a Thousand Hills, Durban in the KwaZulu‐Natal Province, South Africa and enrolled in study and randomly assigned to 1 of 4 groups: group 1: daily supplement containing 1 daily allowance of multiple micronutrients for young children; group 2: daily placebo supplement containing no micronutrients; group 3: weekly supplement containing 2 daily allowances of multiple micronutrients for young children and a placebo supplement on the other days of the week; group 4: daily supplement containing 10 mg of elemental iron. Micronutrient supplements provided were large chewable tablets or foodLETS. Type of participants outside age range defined for inclusion in this review. | |
| 2746 children aged 6‐18 months from urban and rural sites in Sindh, Pakistan from 256 clusters determined by a baseline census (111 clusters in Bilal colony and 145 clusters in Matiari), were randomly assigned to 1 of 3 groups: group 1 (n = 889): 14‐day supply of MNP in individual sachets to be given daily containing iron (as microencapsulated ferrous fumarate) 12.5 mg, vitamin C (as ascorbic acid) 50 mg, vitamin A (as retinol acetate) 300 μg, vitamin D (as vitamin D3) 5 μg, folic acid 150 μg, zinc (as zinc gluconate) 10 mg; group 2 (n = 910): 14‐day supply of MNP in individual sachets to be given daily containing iron (as microencapsulated ferrous fumarate) 12.5 mg, vitamin C (as ascorbic acid) 50 mg, vitamin A (as retinol acetate) 300 μg, vitamin D (as vitamin D3) 5 μg, folic acid 150 μg, no zinc; group 3 (n = 947): no sachets. All groups received basic infant and young child feeding messages based on UNICEF/WHO recommendations, namely promotion of exclusive breastfeeding up to 6 months of age and continued breastfeeding with appropriate complementary feeding with locally available foods thereafter. Type of participants and type of comparisons outside scope of this review. | |
| 703 children aged 6‐23 months at time of enrolment living in rural western Kenya, Nyando Division. 575 children followed for duration of intervention and follow‐up period. Exclusion criteria: unavailable for enrolment on 3 separate household visits and parental refusal to give informed consent. Children with Hb < 70 g/L referred for treatment, but still included in analysis. Type of participants outside scope of this review. | |
| Children aged 12‐36 months living in Kisumu West District, Kenya expected to remain resident in study area for duration of intervention and follow‐up; no known or reported allergy to premedication drugs; not severely malnourished (weight‐for‐height Z‐score, with no fever or reported or suspected systemic disorders (e.g. HIV infection, tuberculosis, sickle cell disease) and Hb ≥ 70 g/L randomly assigned to receive 1 of 3 interventions: group 1 (n = 112): daily home fortification for 30 days with sachets containing 3 mg of elemental iron (as NaFeEDTA); group 2 (n = 114): daily home fortification for 30 days with sachets containing 12.5 mg of elemental iron (as encapsulated ferrous fumarate); group 3 (n = 112): daily home fortification for 30 days with sachets containing no iron (placebo). All powders contained vitamin A 300 μg RE, zinc 5 mg, vitamin D 5 µg, vitamin E 5 mg, vitamin C 30 mg, thiamine (vitamin B1) 0.5 mg, riboflavin (vitamin B2) 0.5 mg, niacin (vitamin B3) 6 mg, vitamin B6 (pyridoxine) 0.5 mg, vitamin B12 (cobalamin) 0.9 µg, copper 0.56 mg, selenium 17 µg and iodine 90 µg. All participants received treatment 3 days before randomisation. The medications received under supervision included: 1. dihydroartemisinin‐piperaquine (SigmaTau, Rome, Italy; tablets of dihydroartemisinin 40 mg and piperaquine 320 mg), for 3 days at daily target dose of 4 mg/kg bodyweight; 2. albendazole (Indoco Remedies, Mumbai, India), for 3 days at daily target dose of 200 mg for children aged 12‐24 months or 400 mg for children aged > 24 to 36 months; 3. praziquantel 600 mg tablets (Cosmos, Nairobi, Kenya), as single dose at a target dose of 40 mg/kg bodyweight. Age of children was 12‐36 months (mean 23.6 months) with 54.5% being younger than 2 years. Type of participants outside scope of this review. | |
| 101 apparently healthy, non‐pregnant, non‐lactating young women studying or working at Institute of Food Science and Nutrition, Swiss Federal Institute of Technology in Zurich, Switzerland and the University of Zurich between January and April 2008 were randomly assigned to 1 of 6 groups receiving a maize porridge fortified with an MNP‐containing stable isotope‐labelled elemental iron as either ferrous sulphate or iron EDTA (NaFeEDTA) and different combinations of inhibitors and enhancers (ascorbic acid, calcium, phytase, l‐alpha‐glycerophosphocholine). They each consumed 2 meals in a cross‐over design for determination of iron absorption. Objective was to maximise iron absorption from a low‐iron MNPs by testing combinations of iron as NaFeEDTA, ascorbic acid and a microbial phytase active at gut pH, as well as the role of L‐α‐glycerophosphocholine. Types of participants and types of interventions not within scope of this review. | |
| 185 preschool‐age children aged 31‐70 months with low Hb concentrations from 2 communes in Thanh‐Mien district, Hai‐Hung province of northern Vietnam were assigned to 1 of 3 groups: group 1: xoi gac (fruit) that contained β‐carotene 3.5 mg per serving; group 2: rice mixed with synthetic β‐carotene 5.0 mg powder; group 3: rice without fortification. Each participant received about 110‐120 g cooked rice per day. No other foods or beverages provided. Fruit and powder preparations designed to contain β‐carotene 5.0 mg per serving on basis of recommended dietary allowance for retinol of 500 retinol equivalents for children aged 3‐6 years. Type of interventions did not include provision of iron and thus outside scope of this review. | |
| 284 children aged 6‐12 months from 12 villages in the Salam sub district and 6 villages in Ngluwar sub district, both located in Magelang district in centre of Java. Study took place from June to December 2000. Participants randomly assigned to 1 of 4 groups: group 1 (n = 72): daily multiple‐micronutrient food‐like tablets (foodLETS); group 2 (n = 70): weekly multiple‐micronutrient food‐like tablets (foodLETS); group 3 (n = 70): daily iron food‐like tablets (foodLETs); group 4 (n = 70): daily placebo. FoodLETS given as daily elemental iron (as ferrous sulphate), daily multiple micronutrients (14 nutrients: vitamins A, D, E, K, C, thiamine, riboflavin, vitamin B12, niacin, folate, iron, zinc, copper, iodine) and weekly multiple micronutrient (same 14 nutrients). Multiple micronutrient supplement and placebo produced in form of foodLETS and were provided in blister packs of 7 tablets. Results showed an increase in iron stores in daily iron and daily multiple micronutrients group, but not in weekly multiple micronutrients group. Adverse effects observed were vomiting and diarrhoea, with no significant difference between intervention groups. Type of participants outside age range defined for inclusion in this review. | |
| 557 anaemic children aged 6‐18 months from field study area for Kintampo Health Research Centre, located in Kintampo district of rural Ghana. This is a malaria endemic area where principal complementary food is a maize‐based porridge. Participants were randomly assigned to 1 of 2 groups: group 1 (n = 246): home fortification with MNP containing 80 mg of elemental iron (as microencapsulated ferrous fumarate) and ascorbic acid 50 mg added to weaning foods (after it was cooked); group 2 (n = 247): iron drops containing 40 mg of elemental iron given 3 times per day for 2 months. Study took place during May and August 1999. Dosage of iron in the Sprinkles sachet was double that in the ferrous sulphate drops. Outcomes included anaemia, ferritin, serum zinc and growth concentration. Anaemia was successfully treated in the 2 groups in 58% and 56% of children. There were no significant differences in adverse effects between groups. Diarrhoea was reported in 14.5% of participants receiving drops and 12.8% of participants receiving MNP. Type of participants outside age range defined for inclusion in this review. | |
| 437 Ghanaian non‐anaemic children aged 8‐20 months, who were ingesting a weaning food in addition to breast milk were randomised individually to 1 of 4 groups: group 1 (n = 110): MNP (with iron only) containing 40 mg of elemental iron (as microencapsulated ferrous fumarate) daily; group 2 (n = 107): MNP (with iron and vitamin A) containing 40 mg of elemental iron (as microencapsulated ferrous fumarate) + retinol equivalents (as retinyl acetate) 600 μg daily; group 3 (n = 112): 12.5 mg of elemental iron (as ferrous sulphate iron drops) daily; group 4 (n = 108): placebo in powder form. Primary outcome measures were change in Hb and anaemic status at baseline and end of study. Prophylactic supplementation provided to children for 6 months (October 1999 to March 2000) and children who maintained Hb of ≥ 100 g/L at end of intervention were reassessed at 12 months' postintervention. Acceptability of powders was better in comparison to iron drops. No significant changes were seen in mean Hb, ferritin or serum retinol values from baseline to end of supplementation period among groups. Study area considered a setting where intestinal parasites, malaria and infectious diarrhoea are common. Supplementation period began at end of rainy season and had finished by end of dry season when the burden of malaria is lower. Iron and haematological status maintained equally well among all groups, including MNP and placebo. Type of participants outside age range defined for inclusion in this review. | |
| 304 anaemic children aged 6‐18 months from rural Ghana. Research took place between February and May 2000, at end of dry season, in field study area of the Kintampo Health Research Centre, located in Brong Ahafo region of Ghana. This is a malaria endemic area in which principal complementary food is a maize‐based porridge, low in bioavailable iron and zinc. Participants were randomly assigned to 1 of 2 groups: group 1 (n = 144): home fortification with "multiple micronutrient powders" including 80 mg of elemental iron (as microencapsulated ferrous fumarate) + ascorbic acid 50 mg; group 2 (n = 160): home fortification with powders containing 80 mg of elemental iron (as microencapsulated ferrous fumarate) + zinc (as gluconate) 5 mg over 2 months. Outcomes included anaemia, ferritin, serum zinc and growth concentration. Both formulations were successful in treating anaemia. There was no effect on zinc status and growth. Type of participants outside age range defined for inclusion in this review. | |
| Objective was to determine effect of providing an MNP with or without iron on incidence of malaria among children living in a high malaria‐burden area. Double‐blind, cluster‐randomised trial of children aged 6‐35 months (mean 19.4 ± 8.6 months) conducted over 6 months in 2010 in a rural community setting in central Ghana, West Africa (n = 1958 living in 1552 clusters). Children randomised by cluster to receive an MNP with iron (iron group; iron 12.5 mg/day) or without iron (no iron group). The MNP with and without iron were added to semi‐liquid home‐prepared foods daily for 5 months followed by 1 month of further monitoring. Insecticide‐treated bed nets were provided at enrolment, as well as malaria treatment when indicated. Malaria incidence overall significantly lower in iron group compared with no iron group (76.1 episodes/100 child‐years with iron and 86.1 episodes/100 child‐years with no iron; RR 0.87, 95% CI 0.79 to 0.97), and during intervention period (79.4 episodes/100 child‐years with iron and 90.7 episodes/100 child‐years with no iron; RR 0.87, 95% CI 0.78 to 0.96). In secondary analyses, these differences were no longer statistically significant after adjusting for baseline iron deficiency and anaemia status overall (adjusted RR 0.87, 95% CI 0.75 to 1.01) and during intervention period (adjusted RR 0.86, 95% CI 0.74 to 1.00). Type of participants outside age range defined for inclusion in this review (more than half the children did not meet inclusion criteria). |
CBC: complete blood count; CI: confidence interval; Hb: haemoglobin; MNP: micronutrient powder; n: number of children; NaFeEDTA: sodium iron ethylenediaminetetraacetic acid; SD: standard deviation; RR: risk ratio; UNICEF: United Nations Children's Fund; WHO: World Health Organization.
Characteristics of ongoing studies [ordered by study ID]
| Trial name or title | Food Fortification Powder for Improving Micronutrient Status in Underweight and Overweight/Obese Primary School Children. |
| Methods | Randomised controlled trial. |
| Participants | 348 apparently healthy primary school boys and girls aged 6‐9 years, with haemoglobin concentration < 110 g/L in Vietnam. Exclusion criteria: haemoglobin concentration < 70 g/L, currently taking or planning to take vitamin and mineral supplementation, chronic disease or infection, congenital anomalies or severe malnutrition. |
| Interventions | Participants will be assigned to 1 of 2 groups.
|
| Outcomes | Haemoglobin concentration, iron status (measured by serum ferritin), zinc status (measured by serum zinc), body composition (by triceps skinfold thickness, mid‐upper arm circumference and waist circumference), cost‐benefit analysis, dietary intake, growth (assessed by height, weight and Z‐scores), morbidity and health status. |
| Starting date | 20 September 2016. |
| Contact information | Dr Ewa Szymlek‐Gay. Institute for Physical Activity and Nutrition (IPAN) School of Exercise and Nutrition Sciences 221 Burwood Highway Burwood VIC 3125, Australia. Telephone: +61 3 9244 5404. Email: [email protected]. Dr Hoang Thi Duc Ngan. National Institute of Nutrition 48B Tang Bat Ho Street Hai Ba Trung District Hanoi, Vietnam. Telephone: +84 43 9713088. Email: [email protected]. |
| Notes | Source of funding: National Institute of Nutrition, Vietnam, and Deakin University, Australia. |
| Trial name or title | Effect of Home‐Fortification with Sprinkles in Haematologic and Nutritional Status in Preschool Children in Medellín. |
| Methods | Randomised controlled trial, triple‐blind and placebo‐controlled. |
| Participants | 100 children aged 5‐59 months, not anaemic or with severe malnourished attending 2 child care centres in Medellín, Colombia. |
| Interventions | Participants will be randomly assigned to 1 of 2 groups.
Interventions will be provided during weekdays for 11 weeks. |
| Outcomes | Primary: haemoglobin at 10 weeks (g/dL). Secondary: transferrin at 10 weeks (mg/dL). Other outcomes: child growth Indicators. |
| Starting date | September 2013. |
| Contact information | Cristian Vargas, MD. Lic Viviana Ramírez, Nutritionist. Fundación de Atención a la Niñez (FAN), Medellin, Anqtioquia, Colombia. Telephone: +57 30 06099044. Email: [email protected] and [email protected]. |
| Notes | Source of funding: CES University. |
| Trial name or title | Iodine Intake & Status of Preschoolers Given MNP for 6 Months. |
| Methods | Randomised controlled trial. |
| Participants | 396 apparently healthy boys and girls aged 4‐6 years attending La Trinidad Benguet daycare centres, in Benguet, Philippines who are permanent residents in the barangay or municipality, with informed written parental consent and whose mothers are willing to devote time for survey. Exclusion criteria: severely underweight, obvious clinical problem such as goitre, congenital heart disease or plans of transferring residence outside municipality within next 6 months. |
| Interventions | Participants will be randomly assigned to 1 of 2 groups.
MNP contains 15 vitamins and minerals, including vitamin A, D, E, C, B1, B2, B6 and B12, niacin, folic acid, iron, zinc, copper, selenium, iodine. Iodine 90 µg per sachet of 1 g of MNP. |
| Outcomes | Urinary iodine at 6 months, weight‐for‐age, height‐for‐age, likability of a communication material on knowledge of mothers. |
| Starting date | November 2014. |
| Contact information | Imelda O Degay. University of the Philippines, Los Banos, Philippines. |
| Notes | Source of funding: Nutrition Center of the Philippines. |
| Trial name or title | Early Child Development and Nutrition in Guatemala. |
| Methods | Cluster‐randomised controlled trial. |
| Participants | 3000 infants aged 6‐12 months and preschool‐age children aged 36‐48 months, Spanish speakers, undernourished (length and height for age < ‐1 Z‐score), without any obvious health or developmental problems that would interfere with growth, nutrition or development, who are planning to remain in area for subsequent year and whose parents or legal guardians of child is aged ≥ 18 years, speak and understand Spanish and live with child in study community. Exclusion criteria: severe stunting (length and height for age < ‐3 Z‐scores), identified conditions that could interfere with their development and growth, severely anaemic (haemoglobin < 70 g/L). |
| Interventions | The children will be assigned through neighbourhood clusters randomised into 4 groups.
MNP contains zinc 9 mg, copper 0.3 mg, elemental iron 12.5 mg, vitamin D3 5 mg, folic acid 160 µg (0.16 mg), vitamin E 5 mg, iodine 90 µg, calcium 200 mg, vitamin A 250 µg RE, phosphorus 150 mg, vitamin C 40 mg, magnesium 40 mg, vitamin B12 0.9 µg, selenium 17 µg, thiamine 0.5 mg, manganese 0.17 mg, niacin 0.5 mg, biotin 8 mg, riboflavin 6 mg, vitamin B5 1.8 mg, vitamin B6 0.5 mg. Investigators will focus on preschool‐age children (aged 36‐48 months) to examine if micronutrients + a school readiness intervention can improve children's school readiness skills. |
| Outcomes | Cognitive, motor, social‐emotional development from baseline to 12 months; weight, length/height, micronutrient status from baseline to 12 months. |
| Starting date | December 2014. |
| Contact information | Dr Maureen M Black. University of Maryland. Telephone: +1 410 7062136. Email: [email protected]. |
| Notes | Source of funding: University of Maryland and Association for the Study and Prevention of HIV/AIDS. |
| Trial name or title | Stunting Prevention Project in Thatta and Sajawal Districts, Sindh Province, Pakistan. |
| Methods | 29 Union Councils with best performance and highly covered Lady Health Workers catchment areas will be selected as intervention clusters. Of the 29 Union Councils, 10 Union Councils will be selected using simple random sampling. 5 Union Councils in each group, giving a total sample size of 5000 participants. Participants will be recruited and followed monthly for compliance of food‐based supplements, dietary diversity, pregnancy outcomes, and maternal and child morbidity and mortality. |
| Participants | 5000 pregnant women, lactating mothers and children aged 6‐59 months. Blood samples will be collected twice from a subset of 200 children (100 in each group). |
| Interventions | Interventions will focus on food‐based supplementation and non‐food‐based interventions delivered through Lady Health Workers. A blanket approach will be used for the distribution of food‐based supplementation, consisting of locally produced lipid‐based nutrient supplements for children aged 6‐23 months, MNP for children aged 24‐59 months and wheat soy blend for pregnant and lactating women. Control group will receive routine public and private health services available within the area. Infants and children will receive an MNP sachet to obtain RDA of 15 micronutrients on alternate days. |
| Outcomes | Height, weight and mid upper arm circumference. For children, length/height‐for‐age, weight‐for‐age and weight‐for‐length/height, anaemia, haemoglobin concentrations. |
| Starting date | January 2014. |
| Contact information | Dr Sajid Bashir Soofi. Department of Paediatrics and Child Health, Aga Khan University, Karachi, Pakistan. Email: [email protected]. |
| Notes | Sources of funding: Aga Khan University; United Nations World Food Programme, Islamabad, Pakistan, and Pakistan Ministry of Health. |
| Trial name or title | The Efficacy of Multiple MNP Supplementation in Children Under 5 Years in Arusha District. |
| Methods | Randomised controlled trial. |
| Participants | 436 children aged 6‐59 months with moderate anaemia (Hb concentration 70‐100 g/L) whose families reside within study villages in Arusha, Tanzania. Exclusion criteria: chronic or acute disease, sickle‐cell anaemia or consuming multi‐vitamin‐mineral supplements on a regular basis. |
| Interventions | Participants will be randomly assigned to 1 of 4 groups.
|
| Outcomes | Haemoglobin concentration, vitamin A concentration and nutritional status. |
| Starting date | 7 September 2015. |
| Contact information | Dr Martin Kimanya. Telephone: +2557596284. Email: kejod@nm‐aist.ac.tz. |
| Notes | Source of funding: COSTECH, Dar‐es‐Salaam, and The Nelson Mandela African Institution of Science and Technology, Arusha, Tanzania. |
COSTECH: Commission for Science and Technology; MNP: multiple micronutrient powder; RDA: recommended dietary allowance.
Data and analyses
| Outcome or subgroup title | No. of studies | No. of participants | Statistical method | Effect size |
| 1 Anaemia Show forest plot | 10 | 2448 | Risk Ratio (M‐H, Random, 95% CI) | 0.66 [0.49, 0.88] |
| Analysis 1.1  Comparison 1 Point‐of‐use fortification of foods with micronutrients powders (MNP) versus no intervention or placebo, Outcome 1 Anaemia. | ||||
| 2 Anaemia by anaemic status of participants at start of intervention Show forest plot | 10 | 2448 | Risk Ratio (M‐H, Random, 95% CI) | 0.66 [0.49, 0.88] |
| Analysis 1.2  Comparison 1 Point‐of‐use fortification of foods with micronutrients powders (MNP) versus no intervention or placebo, Outcome 2 Anaemia by anaemic status of participants at start of intervention. | ||||
| 2.1 Anaemic | 0 | 0 | Risk Ratio (M‐H, Random, 95% CI) | 0.0 [0.0, 0.0] |
| 2.2 Non‐anaemic | 1 | 199 | Risk Ratio (M‐H, Random, 95% CI) | 1.49 [0.74, 3.02] |
| 2.3 Mixed/unknown | 9 | 2249 | Risk Ratio (M‐H, Random, 95% CI) | 0.61 [0.45, 0.82] |
| 3 Anaemia by age of children at start of intervention Show forest plot | 9 | 2249 | Risk Ratio (M‐H, Random, 95% CI) | 0.61 [0.45, 0.82] |
| Analysis 1.3  Comparison 1 Point‐of‐use fortification of foods with micronutrients powders (MNP) versus no intervention or placebo, Outcome 3 Anaemia by age of children at start of intervention. | ||||
| 3.1 Aged 24‐59 months | 6 | 1706 | Risk Ratio (M‐H, Random, 95% CI) | 0.64 [0.44, 0.93] |
| 3.2 Aged 60 months or older | 3 | 543 | Risk Ratio (M‐H, Random, 95% CI) | 0.53 [0.25, 1.12] |
| 4 Anaemia by malaria status of study site at time of trial Show forest plot | 9 | 2249 | Risk Ratio (M‐H, Random, 95% CI) | 0.61 [0.45, 0.82] |
| Analysis 1.4  Comparison 1 Point‐of‐use fortification of foods with micronutrients powders (MNP) versus no intervention or placebo, Outcome 4 Anaemia by malaria status of study site at time of trial. | ||||
| 4.1 Yes | 4 | 934 | Risk Ratio (M‐H, Random, 95% CI) | 0.57 [0.29, 1.14] |
| 4.2 No | 4 | 1252 | Risk Ratio (M‐H, Random, 95% CI) | 0.72 [0.62, 0.85] |
| 4.3 Not reported | 1 | 63 | Risk Ratio (M‐H, Random, 95% CI) | 0.34 [0.21, 0.56] |
| 5 Anaemia by frequency Show forest plot | 9 | 2249 | Risk Ratio (M‐H, Random, 95% CI) | 0.62 [0.46, 0.82] |
| Analysis 1.5  Comparison 1 Point‐of‐use fortification of foods with micronutrients powders (MNP) versus no intervention or placebo, Outcome 5 Anaemia by frequency. | ||||
| 5.1 Daily | 9 | 2163 | Risk Ratio (M‐H, Random, 95% CI) | 0.59 [0.43, 0.80] |
| 5.2 Weekly | 1 | 86 | Risk Ratio (M‐H, Random, 95% CI) | 1.09 [0.50, 2.37] |
| 5.3 Flexible | 0 | 0 | Risk Ratio (M‐H, Random, 95% CI) | 0.0 [0.0, 0.0] |
| 6 Anaemia by duration of intervention Show forest plot | 9 | 2249 | Risk Ratio (M‐H, Random, 95% CI) | 0.61 [0.45, 0.82] |
| Analysis 1.6  Comparison 1 Point‐of‐use fortification of foods with micronutrients powders (MNP) versus no intervention or placebo, Outcome 6 Anaemia by duration of intervention. | ||||
| 6.1 Less than 3 months | 3 | 867 | Risk Ratio (M‐H, Random, 95% CI) | 0.71 [0.63, 0.80] |
| 6.2 3 months or longer | 6 | 1382 | Risk Ratio (M‐H, Random, 95% CI) | 0.51 [0.31, 0.84] |
| 7 Anaemia by iron content of product Show forest plot | 9 | 2249 | Risk Ratio (M‐H, Random, 95% CI) | 0.61 [0.45, 0.82] |
| Analysis 1.7  Comparison 1 Point‐of‐use fortification of foods with micronutrients powders (MNP) versus no intervention or placebo, Outcome 7 Anaemia by iron content of product. | ||||
| 7.1 12.5 mg elemental iron or less | 7 | 1705 | Risk Ratio (M‐H, Random, 95% CI) | 0.72 [0.65, 0.80] |
| 7.2 More than 12.5 mg elemental iron | 2 | 544 | Risk Ratio (M‐H, Random, 95% CI) | 0.26 [0.14, 0.50] |
| 8 Anaemia by type of iron compound Show forest plot | 9 | 2249 | Risk Ratio (M‐H, Random, 95% CI) | 0.61 [0.45, 0.82] |
| Analysis 1.8 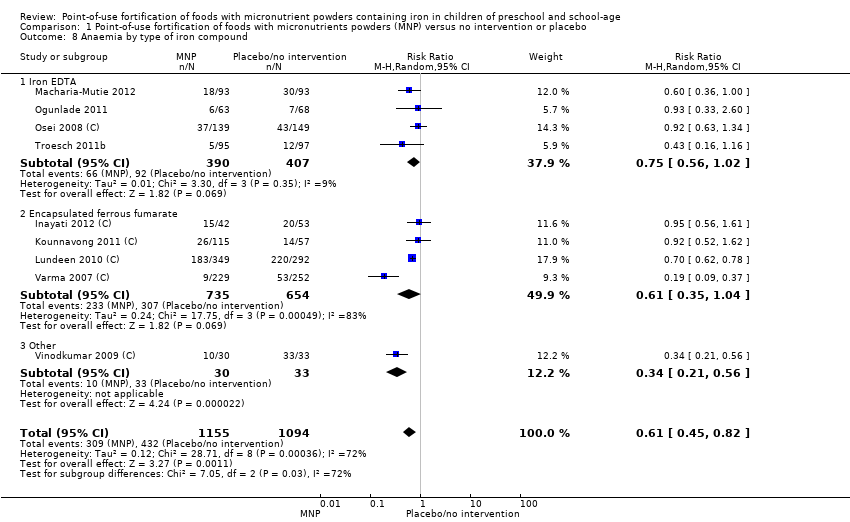 Comparison 1 Point‐of‐use fortification of foods with micronutrients powders (MNP) versus no intervention or placebo, Outcome 8 Anaemia by type of iron compound. | ||||
| 8.1 Iron EDTA | 4 | 797 | Risk Ratio (M‐H, Random, 95% CI) | 0.75 [0.56, 1.02] |
| 8.2 Encapsulated ferrous fumarate | 4 | 1389 | Risk Ratio (M‐H, Random, 95% CI) | 0.61 [0.35, 1.04] |
| 8.3 Other | 1 | 63 | Risk Ratio (M‐H, Random, 95% CI) | 0.34 [0.21, 0.56] |
| 9 Anaemia by number of nutrients accompanying iron Show forest plot | 9 | 2249 | Risk Ratio (M‐H, Random, 95% CI) | 0.61 [0.45, 0.82] |
| Analysis 1.9  Comparison 1 Point‐of‐use fortification of foods with micronutrients powders (MNP) versus no intervention or placebo, Outcome 9 Anaemia by number of nutrients accompanying iron. | ||||
| 9.1 1‐4 | 3 | 1185 | Risk Ratio (M‐H, Random, 95% CI) | 0.37 [0.16, 0.86] |
| 9.2 5‐9 | 0 | 0 | Risk Ratio (M‐H, Random, 95% CI) | 0.0 [0.0, 0.0] |
| 9.3 10‐15 | 6 | 1064 | Risk Ratio (M‐H, Random, 95% CI) | 0.82 [0.65, 1.03] |
| 10 Anaemia by micronutrient composition Show forest plot | 9 | 2249 | Risk Ratio (M‐H, Random, 95% CI) | 0.61 [0.45, 0.82] |
| Analysis 1.10 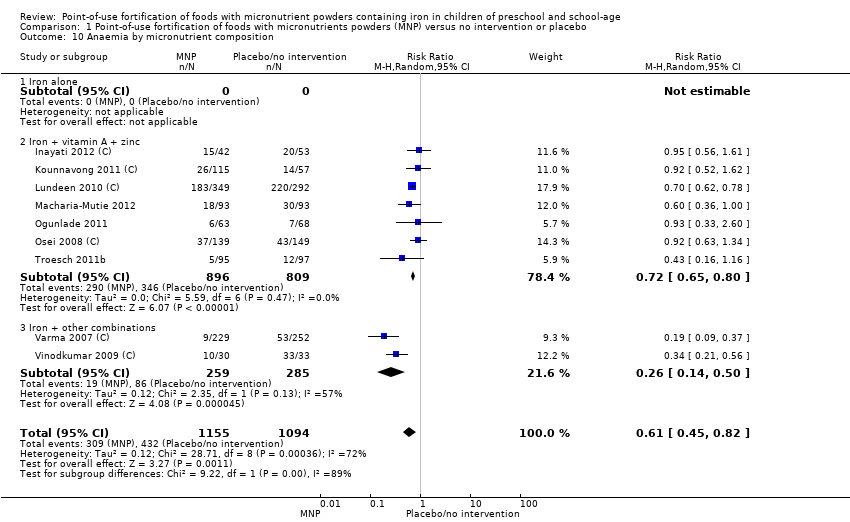 Comparison 1 Point‐of‐use fortification of foods with micronutrients powders (MNP) versus no intervention or placebo, Outcome 10 Anaemia by micronutrient composition. | ||||
| 10.1 Iron alone | 0 | 0 | Risk Ratio (M‐H, Random, 95% CI) | 0.0 [0.0, 0.0] |
| 10.2 Iron + vitamin A + zinc | 7 | 1705 | Risk Ratio (M‐H, Random, 95% CI) | 0.72 [0.65, 0.80] |
| 10.3 Iron + other combinations | 2 | 544 | Risk Ratio (M‐H, Random, 95% CI) | 0.26 [0.14, 0.50] |
| 11 Haemoglobin (g/L) Show forest plot | 11 | 2746 | Mean Difference (IV, Random, 95% CI) | 3.37 [0.94, 5.80] |
| Analysis 1.11  Comparison 1 Point‐of‐use fortification of foods with micronutrients powders (MNP) versus no intervention or placebo, Outcome 11 Haemoglobin (g/L). | ||||
| 12 Haemoglobin by anaemic status of participants at start of intervention (g/L) Show forest plot | 10 | 2547 | Mean Difference (IV, Random, 95% CI) | 3.70 [1.08, 6.32] |
| Analysis 1.12  Comparison 1 Point‐of‐use fortification of foods with micronutrients powders (MNP) versus no intervention or placebo, Outcome 12 Haemoglobin by anaemic status of participants at start of intervention (g/L). | ||||
| 12.1 Anaemic | 0 | 0 | Mean Difference (IV, Random, 95% CI) | 0.0 [0.0, 0.0] |
| 12.2 Non‐anaemic | 0 | 0 | Mean Difference (IV, Random, 95% CI) | 0.0 [0.0, 0.0] |
| 12.3 Mixed/unknown | 10 | 2547 | Mean Difference (IV, Random, 95% CI) | 3.70 [1.08, 6.32] |
| 13 Haemoglobin by age of children at start of intervention Show forest plot | 10 | 2547 | Mean Difference (IV, Random, 95% CI) | 3.70 [1.08, 6.32] |
| Analysis 1.13 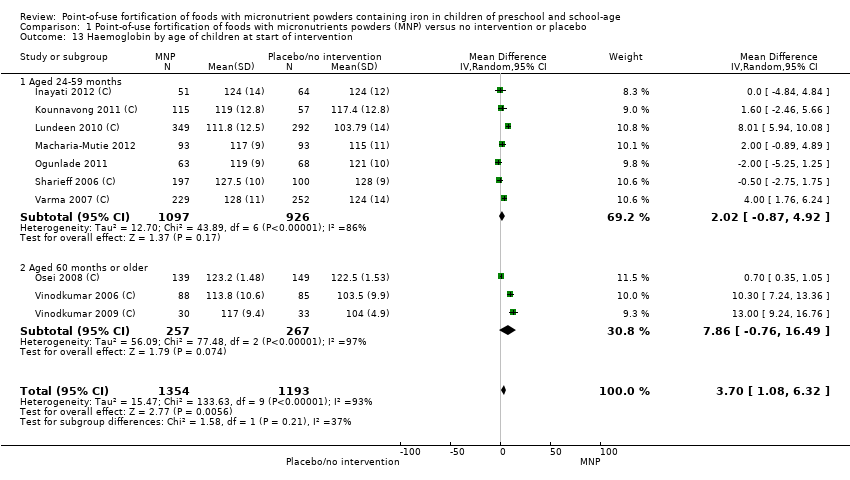 Comparison 1 Point‐of‐use fortification of foods with micronutrients powders (MNP) versus no intervention or placebo, Outcome 13 Haemoglobin by age of children at start of intervention. | ||||
| 13.1 Aged 24‐59 months | 7 | 2023 | Mean Difference (IV, Random, 95% CI) | 2.02 [‐0.87, 4.92] |
| 13.2 Aged 60 months or older | 3 | 524 | Mean Difference (IV, Random, 95% CI) | 7.86 [‐0.76, 16.49] |
| 14 Haemoglobin by malaria status of study site at time of trial Show forest plot | 10 | 2547 | Mean Difference (IV, Random, 95% CI) | 3.70 [1.08, 6.32] |
| Analysis 1.14 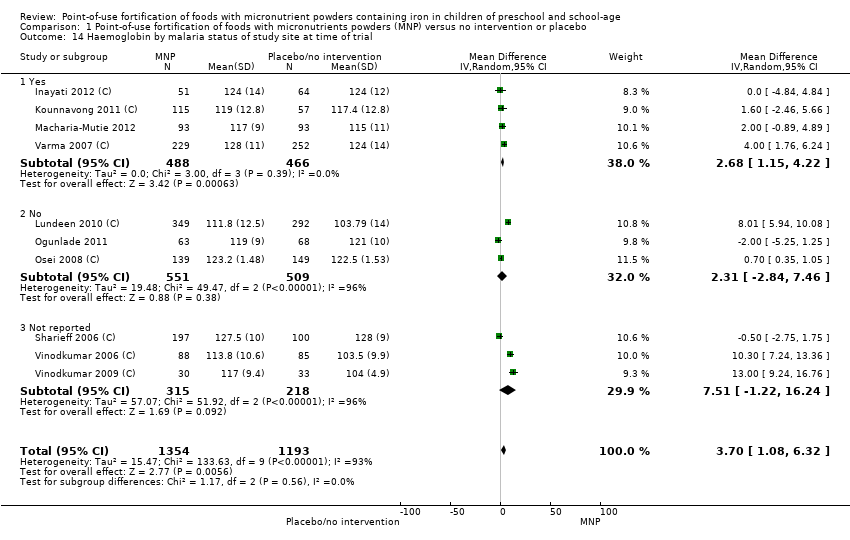 Comparison 1 Point‐of‐use fortification of foods with micronutrients powders (MNP) versus no intervention or placebo, Outcome 14 Haemoglobin by malaria status of study site at time of trial. | ||||
| 14.1 Yes | 4 | 954 | Mean Difference (IV, Random, 95% CI) | 2.68 [1.15, 4.22] |
| 14.2 No | 3 | 1060 | Mean Difference (IV, Random, 95% CI) | 2.31 [‐2.84, 7.46] |
| 14.3 Not reported | 3 | 533 | Mean Difference (IV, Random, 95% CI) | 7.51 [‐1.22, 16.24] |
| 15 Haemoglobin by frequency (g/L) Show forest plot | 10 | 2547 | Mean Difference (IV, Random, 95% CI) | 3.27 [0.84, 5.70] |
| Analysis 1.15  Comparison 1 Point‐of‐use fortification of foods with micronutrients powders (MNP) versus no intervention or placebo, Outcome 15 Haemoglobin by frequency (g/L). | ||||
| 15.1 Daily | 10 | 2315 | Mean Difference (IV, Random, 95% CI) | 3.84 [1.07, 6.61] |
| 15.2 Weekly | 2 | 232 | Mean Difference (IV, Random, 95% CI) | ‐0.25 [‐3.07, 2.56] |
| 15.3 Flexible | 0 | 0 | Mean Difference (IV, Random, 95% CI) | 0.0 [0.0, 0.0] |
| 16 Haemoglobin by duration of intervention Show forest plot | 10 | 2547 | Mean Difference (IV, Random, 95% CI) | 3.70 [1.08, 6.32] |
| Analysis 1.16 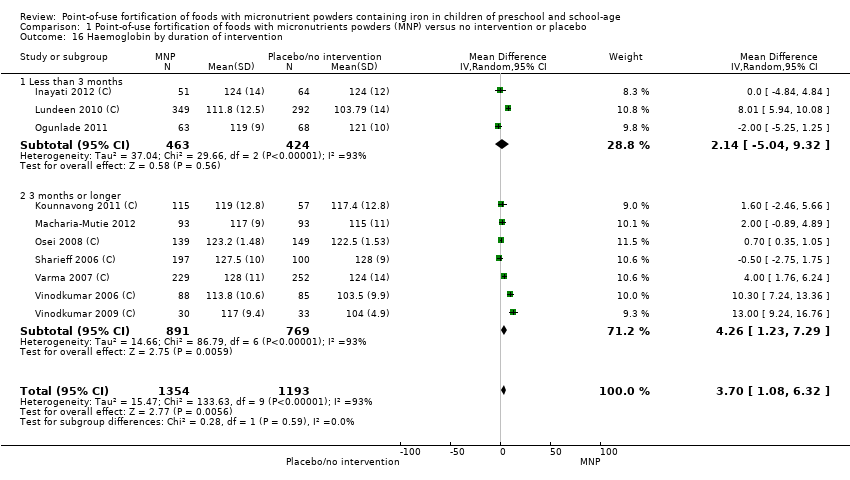 Comparison 1 Point‐of‐use fortification of foods with micronutrients powders (MNP) versus no intervention or placebo, Outcome 16 Haemoglobin by duration of intervention. | ||||
| 16.1 Less than 3 months | 3 | 887 | Mean Difference (IV, Random, 95% CI) | 2.14 [‐5.04, 9.32] |
| 16.2 3 months or longer | 7 | 1660 | Mean Difference (IV, Random, 95% CI) | 4.26 [1.23, 7.29] |
| 17 Haemoglobin by iron content of product Show forest plot | 10 | 2547 | Mean Difference (IV, Random, 95% CI) | 3.70 [1.08, 6.32] |
| Analysis 1.17 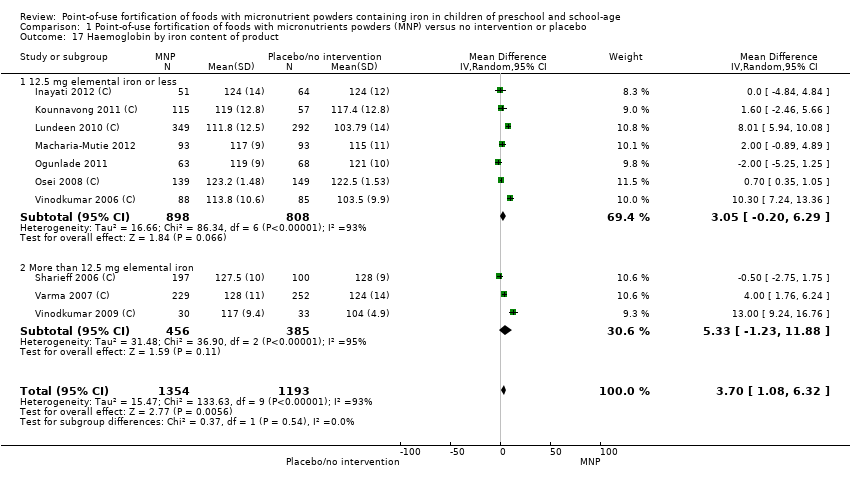 Comparison 1 Point‐of‐use fortification of foods with micronutrients powders (MNP) versus no intervention or placebo, Outcome 17 Haemoglobin by iron content of product. | ||||
| 17.1 12.5 mg elemental iron or less | 7 | 1706 | Mean Difference (IV, Random, 95% CI) | 3.05 [‐0.20, 6.29] |
| 17.2 More than 12.5 mg elemental iron | 3 | 841 | Mean Difference (IV, Random, 95% CI) | 5.33 [‐1.23, 11.88] |
| 18 Haemoglobin by type of iron compound (g/L) Show forest plot | 10 | 2547 | Mean Difference (IV, Random, 95% CI) | 3.70 [1.08, 6.32] |
| Analysis 1.18  Comparison 1 Point‐of‐use fortification of foods with micronutrients powders (MNP) versus no intervention or placebo, Outcome 18 Haemoglobin by type of iron compound (g/L). | ||||
| 18.1 Iron EDTA | 3 | 605 | Mean Difference (IV, Random, 95% CI) | 0.51 [‐0.99, 2.02] |
| 18.2 Encapsulated ferrous fumarate | 5 | 1706 | Mean Difference (IV, Random, 95% CI) | 2.81 [‐0.77, 6.38] |
| 18.3 Other | 2 | 236 | Mean Difference (IV, Random, 95% CI) | 11.42 [8.81, 14.03] |
| 19 Haemoglobin by number of nutrients accompanying iron (g/L) Show forest plot | 10 | 2547 | Mean Difference (IV, Random, 95% CI) | 3.70 [1.08, 6.32] |
| Analysis 1.19  Comparison 1 Point‐of‐use fortification of foods with micronutrients powders (MNP) versus no intervention or placebo, Outcome 19 Haemoglobin by number of nutrients accompanying iron (g/L). | ||||
| 19.1 + 1‐4 micronutrients | 3 | 1185 | Mean Difference (IV, Random, 95% CI) | 8.11 [3.70, 12.52] |
| 19.2 + 5‐9 micronutrients | 2 | 470 | Mean Difference (IV, Random, 95% CI) | 4.85 [‐5.73, 15.43] |
| 19.3 + 10‐15 micronutrients | 5 | 892 | Mean Difference (IV, Random, 95% CI) | 0.69 [0.35, 1.03] |
| 20 Haemoglobin by micronutrient composition (g/L) Show forest plot | 10 | 2547 | Mean Difference (IV, Random, 95% CI) | 3.70 [1.08, 6.32] |
| Analysis 1.20  Comparison 1 Point‐of‐use fortification of foods with micronutrients powders (MNP) versus no intervention or placebo, Outcome 20 Haemoglobin by micronutrient composition (g/L). | ||||
| 20.1 Iron alone | 0 | 0 | Mean Difference (IV, Random, 95% CI) | 0.0 [0.0, 0.0] |
| 20.2 Iron + vitamin A + zinc | 7 | 1830 | Mean Difference (IV, Random, 95% CI) | 1.53 [‐0.88, 3.95] |
| 20.3 Iron + other combinations | 3 | 717 | Mean Difference (IV, Random, 95% CI) | 8.95 [3.42, 14.49] |
| 21 Iron deficiency Show forest plot | 5 | 1364 | Risk Ratio (M‐H, Random, 95% CI) | 0.35 [0.27, 0.47] |
| Analysis 1.21  Comparison 1 Point‐of‐use fortification of foods with micronutrients powders (MNP) versus no intervention or placebo, Outcome 21 Iron deficiency. | ||||
| 22 Iron deficiency by anaemia status at start of intervention Show forest plot | 5 | 1364 | Risk Ratio (M‐H, Random, 95% CI) | 0.35 [0.27, 0.47] |
| Analysis 1.22 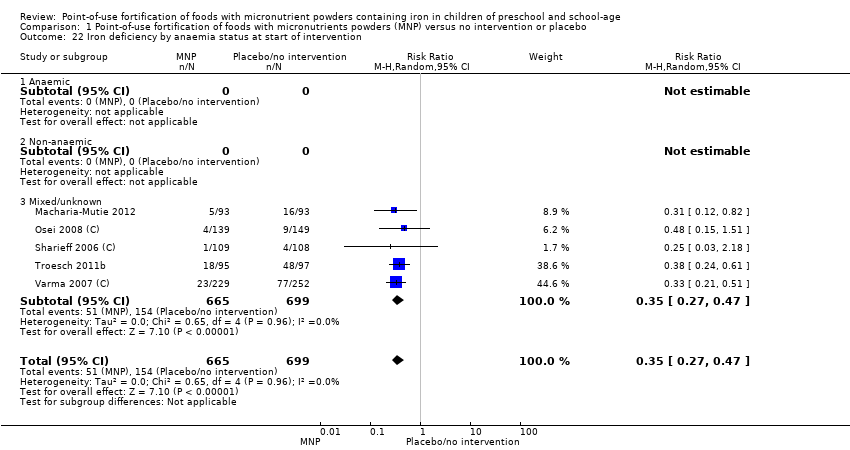 Comparison 1 Point‐of‐use fortification of foods with micronutrients powders (MNP) versus no intervention or placebo, Outcome 22 Iron deficiency by anaemia status at start of intervention. | ||||
| 22.1 Anaemic | 0 | 0 | Risk Ratio (M‐H, Random, 95% CI) | 0.0 [0.0, 0.0] |
| 22.2 Non‐anaemic | 0 | 0 | Risk Ratio (M‐H, Random, 95% CI) | 0.0 [0.0, 0.0] |
| 22.3 Mixed/unknown | 5 | 1364 | Risk Ratio (M‐H, Random, 95% CI) | 0.35 [0.27, 0.47] |
| 23 Iron deficiency by age of children at start of intervention Show forest plot | 5 | 1364 | Risk Ratio (M‐H, Random, 95% CI) | 0.35 [0.27, 0.47] |
| Analysis 1.23  Comparison 1 Point‐of‐use fortification of foods with micronutrients powders (MNP) versus no intervention or placebo, Outcome 23 Iron deficiency by age of children at start of intervention. | ||||
| 23.1 Aged 24‐59 months | 3 | 884 | Risk Ratio (M‐H, Random, 95% CI) | 0.32 [0.22, 0.48] |
| 23.2 Aged 60 months or older | 2 | 480 | Risk Ratio (M‐H, Random, 95% CI) | 0.39 [0.26, 0.61] |
| 24 Iron deficiency by malaria status of study site at time of trial Show forest plot | 5 | 1364 | Risk Ratio (M‐H, Random, 95% CI) | 0.35 [0.27, 0.47] |
| Analysis 1.24 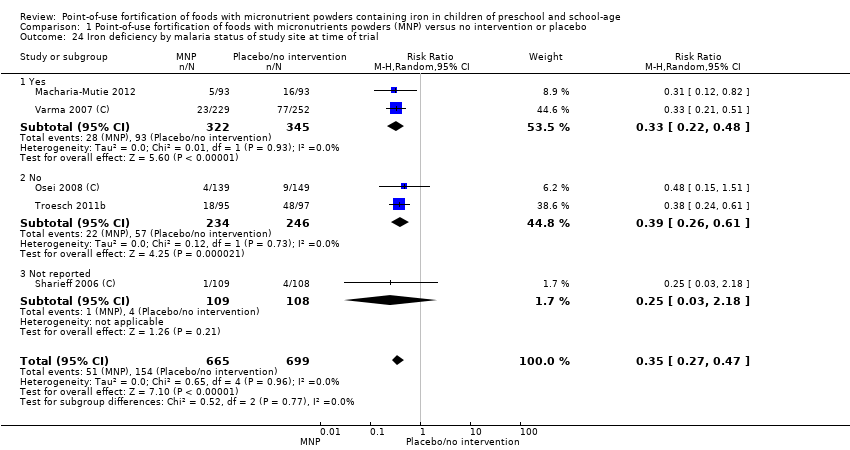 Comparison 1 Point‐of‐use fortification of foods with micronutrients powders (MNP) versus no intervention or placebo, Outcome 24 Iron deficiency by malaria status of study site at time of trial. | ||||
| 24.1 Yes | 2 | 667 | Risk Ratio (M‐H, Random, 95% CI) | 0.33 [0.22, 0.48] |
| 24.2 No | 2 | 480 | Risk Ratio (M‐H, Random, 95% CI) | 0.39 [0.26, 0.61] |
| 24.3 Not reported | 1 | 217 | Risk Ratio (M‐H, Random, 95% CI) | 0.25 [0.03, 2.18] |
| 25 Iron deficiency by frequency Show forest plot | 5 | 1364 | Risk Ratio (M‐H, Random, 95% CI) | 0.35 [0.27, 0.47] |
| Analysis 1.25  Comparison 1 Point‐of‐use fortification of foods with micronutrients powders (MNP) versus no intervention or placebo, Outcome 25 Iron deficiency by frequency. | ||||
| 25.1 Daily | 0 | 0 | Risk Ratio (M‐H, Random, 95% CI) | 0.0 [0.0, 0.0] |
| 25.2 Weekly | 5 | 1364 | Risk Ratio (M‐H, Random, 95% CI) | 0.35 [0.27, 0.47] |
| 25.3 Flexible | 0 | 0 | Risk Ratio (M‐H, Random, 95% CI) | 0.0 [0.0, 0.0] |
| 26 Iron deficiency by duration of intervention Show forest plot | 5 | 1364 | Risk Ratio (M‐H, Random, 95% CI) | 0.35 [0.27, 0.47] |
| Analysis 1.26 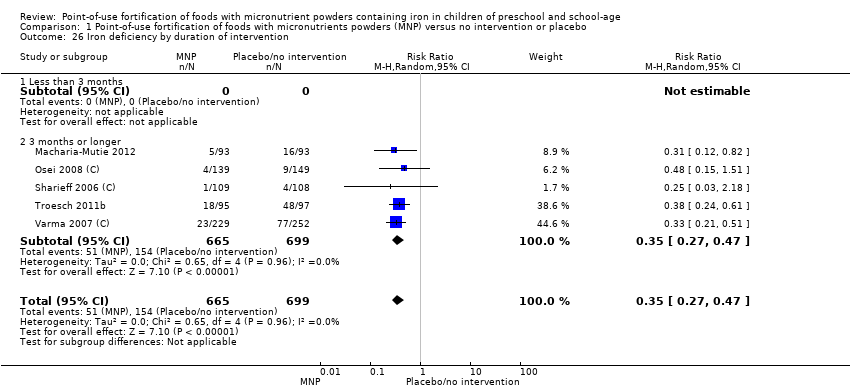 Comparison 1 Point‐of‐use fortification of foods with micronutrients powders (MNP) versus no intervention or placebo, Outcome 26 Iron deficiency by duration of intervention. | ||||
| 26.1 Less than 3 months | 0 | 0 | Risk Ratio (M‐H, Random, 95% CI) | 0.0 [0.0, 0.0] |
| 26.2 3 months or longer | 5 | 1364 | Risk Ratio (M‐H, Random, 95% CI) | 0.35 [0.27, 0.47] |
| 27 Iron deficiency by iron content of product Show forest plot | 5 | 1364 | Risk Ratio (M‐H, Random, 95% CI) | 0.35 [0.27, 0.47] |
| Analysis 1.27 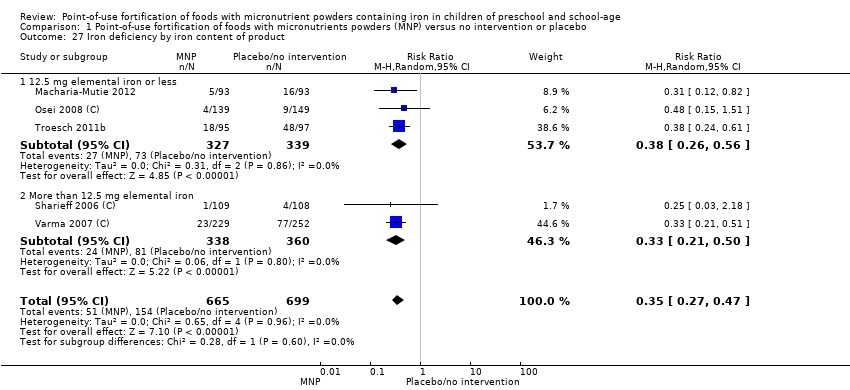 Comparison 1 Point‐of‐use fortification of foods with micronutrients powders (MNP) versus no intervention or placebo, Outcome 27 Iron deficiency by iron content of product. | ||||
| 27.1 12.5 mg elemental iron or less | 3 | 666 | Risk Ratio (M‐H, Random, 95% CI) | 0.38 [0.26, 0.56] |
| 27.2 More than 12.5 mg elemental iron | 2 | 698 | Risk Ratio (M‐H, Random, 95% CI) | 0.33 [0.21, 0.50] |
| 28 Iron deficiency by type of iron compound Show forest plot | 5 | 1364 | Risk Ratio (M‐H, Random, 95% CI) | 0.35 [0.27, 0.47] |
| Analysis 1.28  Comparison 1 Point‐of‐use fortification of foods with micronutrients powders (MNP) versus no intervention or placebo, Outcome 28 Iron deficiency by type of iron compound. | ||||
| 28.1 Iron EDTA | 3 | 666 | Risk Ratio (M‐H, Random, 95% CI) | 0.38 [0.26, 0.56] |
| 28.2 Encapsulated ferrous fumarate | 2 | 698 | Risk Ratio (M‐H, Random, 95% CI) | 0.33 [0.21, 0.50] |
| 28.3 Other | 0 | 0 | Risk Ratio (M‐H, Random, 95% CI) | 0.0 [0.0, 0.0] |
| 29 Iron deficiency by number of nutrients accompanying iron Show forest plot | 5 | 1364 | Risk Ratio (M‐H, Random, 95% CI) | 0.35 [0.27, 0.47] |
| Analysis 1.29  Comparison 1 Point‐of‐use fortification of foods with micronutrients powders (MNP) versus no intervention or placebo, Outcome 29 Iron deficiency by number of nutrients accompanying iron. | ||||
| 29.1 + 1‐4 micronutrients | 1 | 481 | Risk Ratio (M‐H, Random, 95% CI) | 0.33 [0.21, 0.51] |
| 29.2 + 5‐9 micronutrients | 0 | 0 | Risk Ratio (M‐H, Random, 95% CI) | 0.0 [0.0, 0.0] |
| 29.3 + 10‐15 micronutrients | 4 | 883 | Risk Ratio (M‐H, Random, 95% CI) | 0.37 [0.25, 0.55] |
| 30 Iron deficiency by micronutrient composition Show forest plot | 5 | 1364 | Risk Ratio (M‐H, Random, 95% CI) | 0.35 [0.27, 0.47] |
| Analysis 1.30 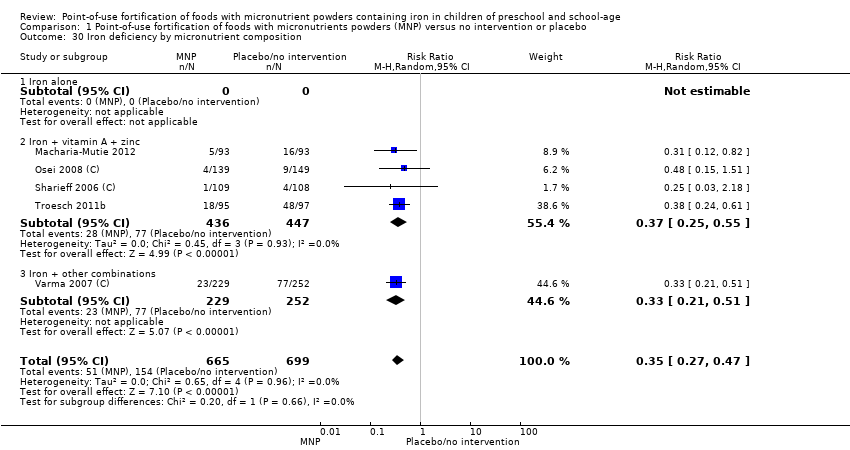 Comparison 1 Point‐of‐use fortification of foods with micronutrients powders (MNP) versus no intervention or placebo, Outcome 30 Iron deficiency by micronutrient composition. | ||||
| 30.1 Iron alone | 0 | 0 | Risk Ratio (M‐H, Random, 95% CI) | 0.0 [0.0, 0.0] |
| 30.2 Iron + vitamin A + zinc | 4 | 883 | Risk Ratio (M‐H, Random, 95% CI) | 0.37 [0.25, 0.55] |
| 30.3 Iron + other combinations | 1 | 481 | Risk Ratio (M‐H, Random, 95% CI) | 0.33 [0.21, 0.51] |
| 31 Ferritin (μg/L) Show forest plot | 3 | 1066 | Std. Mean Difference (IV, Random, 95% CI) | 0.42 [‐4.36, 5.19] |
| Analysis 1.31  Comparison 1 Point‐of‐use fortification of foods with micronutrients powders (MNP) versus no intervention or placebo, Outcome 31 Ferritin (μg/L). | ||||
| 32 All‐cause mortality Show forest plot | 1 | Risk Ratio (M‐H, Random, 95% CI) | Totals not selected | |
| Analysis 1.32 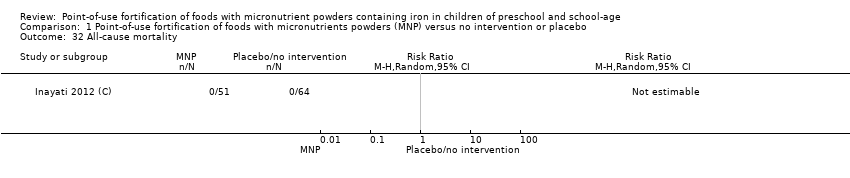 Comparison 1 Point‐of‐use fortification of foods with micronutrients powders (MNP) versus no intervention or placebo, Outcome 32 All‐cause mortality. | ||||
| 33 Diarrhoea Show forest plot | 2 | 366 | Risk Ratio (M‐H, Random, 95% CI) | 0.97 [0.53, 1.78] |
| Analysis 1.33  Comparison 1 Point‐of‐use fortification of foods with micronutrients powders (MNP) versus no intervention or placebo, Outcome 33 Diarrhoea. | ||||
| 34 Adverse effects Show forest plot | 1 | Risk Ratio (M‐H, Random, 95% CI) | Totals not selected | |
| Analysis 1.34 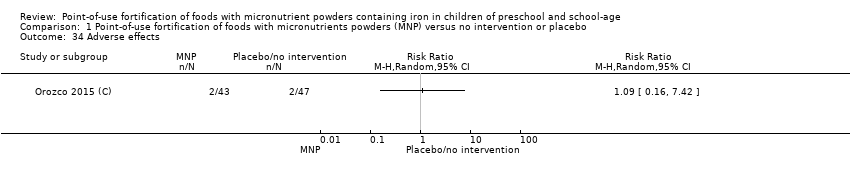 Comparison 1 Point‐of‐use fortification of foods with micronutrients powders (MNP) versus no intervention or placebo, Outcome 34 Adverse effects. | ||||
| 35 Iron deficiency anaemia Show forest plot | 3 | 918 | Risk Ratio (M‐H, Random, 95% CI) | 0.28 [0.07, 1.10] |
| Analysis 1.35  Comparison 1 Point‐of‐use fortification of foods with micronutrients powders (MNP) versus no intervention or placebo, Outcome 35 Iron deficiency anaemia. | ||||
| 36 All‐cause morbidity Show forest plot | 3 | 538 | Risk Ratio (M‐H, Random, 95% CI) | 0.96 [0.74, 1.23] |
| Analysis 1.36 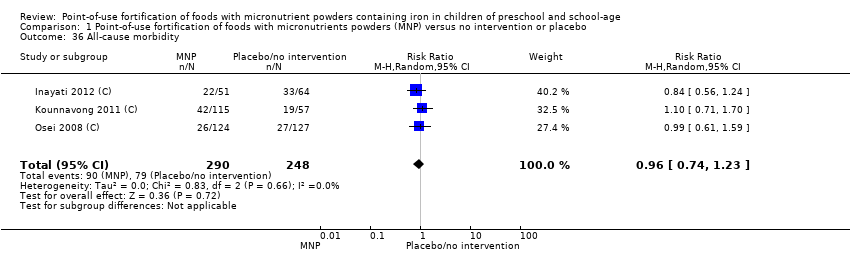 Comparison 1 Point‐of‐use fortification of foods with micronutrients powders (MNP) versus no intervention or placebo, Outcome 36 All‐cause morbidity. | ||||
| 37 Acute respiratory infection Show forest plot | 1 | Risk Ratio (M‐H, Random, 95% CI) | Totals not selected | |
| Analysis 1.37 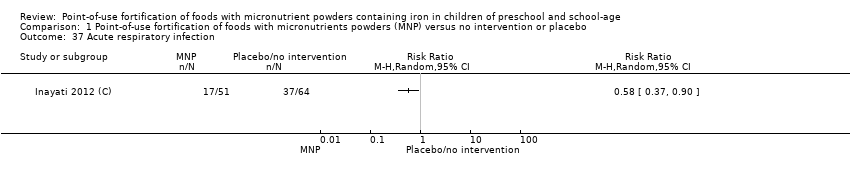 Comparison 1 Point‐of‐use fortification of foods with micronutrients powders (MNP) versus no intervention or placebo, Outcome 37 Acute respiratory infection. | ||||
| 38 Growth (height‐for‐age Z‐score) Show forest plot | 4 | 617 | Mean Difference (IV, Random, 95% CI) | ‐0.02 [‐0.20, 0.17] |
| Analysis 1.38  Comparison 1 Point‐of‐use fortification of foods with micronutrients powders (MNP) versus no intervention or placebo, Outcome 38 Growth (height‐for‐age Z‐score). | ||||
| 39 Growth (weight‐for‐age Z‐score) Show forest plot | 3 | 502 | Mean Difference (IV, Random, 95% CI) | ‐0.01 [‐0.09, 0.07] |
| Analysis 1.39 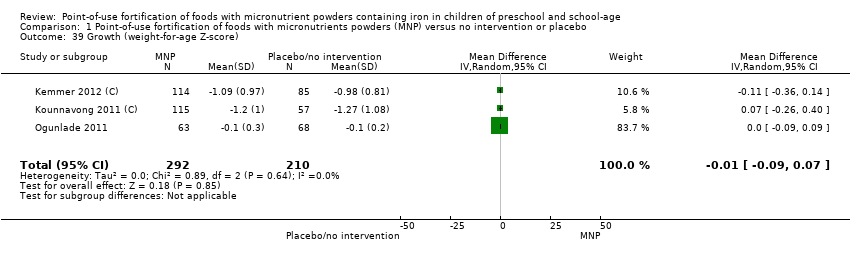 Comparison 1 Point‐of‐use fortification of foods with micronutrients powders (MNP) versus no intervention or placebo, Outcome 39 Growth (weight‐for‐age Z‐score). | ||||
| 40 Growth (weight‐for‐height Z‐score) Show forest plot | 2 | 287 | Mean Difference (IV, Random, 95% CI) | 0.09 [0.00, 0.19] |
| Analysis 1.40  Comparison 1 Point‐of‐use fortification of foods with micronutrients powders (MNP) versus no intervention or placebo, Outcome 40 Growth (weight‐for‐height Z‐score). | ||||
| 41 Adherence Show forest plot | 1 | Risk Ratio (M‐H, Random, 95% CI) | Totals not selected | |
| Analysis 1.41 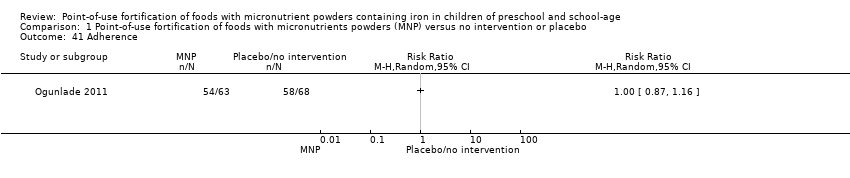 Comparison 1 Point‐of‐use fortification of foods with micronutrients powders (MNP) versus no intervention or placebo, Outcome 41 Adherence. | ||||
| 42 Serum/plasma retinol (mmol/L) Show forest plot | 2 | 547 | Mean Difference (IV, Random, 95% CI) | 10.08 [‐10.72, 30.88] |
| Analysis 1.42 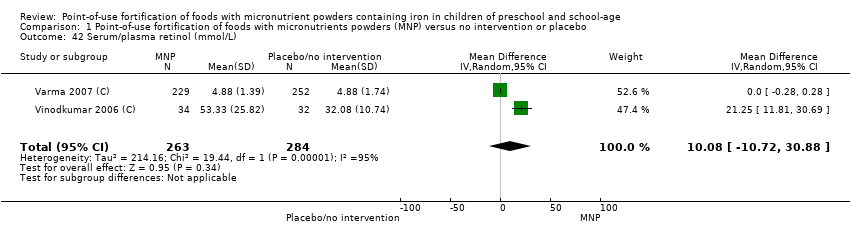 Comparison 1 Point‐of‐use fortification of foods with micronutrients powders (MNP) versus no intervention or placebo, Outcome 42 Serum/plasma retinol (mmol/L). | ||||
| 43 Serum/plasma zinc concentrations (mmol/L) Show forest plot | 1 | Mean Difference (IV, Random, 95% CI) | Totals not selected | |
| Analysis 1.43  Comparison 1 Point‐of‐use fortification of foods with micronutrients powders (MNP) versus no intervention or placebo, Outcome 43 Serum/plasma zinc concentrations (mmol/L). | ||||
| 44 Iron status (iron‐binding capacity) (non‐prespecified) (µmol/kg) Show forest plot | 1 | Mean Difference (IV, Random, 95% CI) | Totals not selected | |
| Analysis 1.44 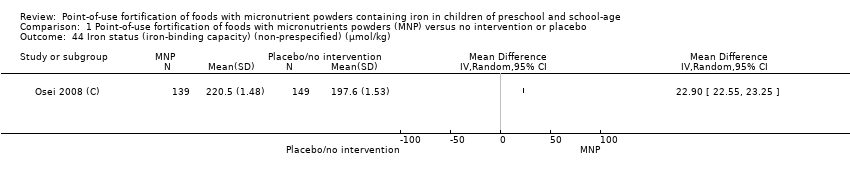 Comparison 1 Point‐of‐use fortification of foods with micronutrients powders (MNP) versus no intervention or placebo, Outcome 44 Iron status (iron‐binding capacity) (non‐prespecified) (µmol/kg). | ||||
| 45 Iron status (serum‐transferrin receptors; non‐prespecified) (mg/L) Show forest plot | 1 | Mean Difference (IV, Random, 95% CI) | Totals not selected | |
| Analysis 1.45  Comparison 1 Point‐of‐use fortification of foods with micronutrients powders (MNP) versus no intervention or placebo, Outcome 45 Iron status (serum‐transferrin receptors; non‐prespecified) (mg/L). | ||||
| 46 Serum vitamin E (non‐prespecified) (µg/dL) Show forest plot | 1 | Mean Difference (IV, Random, 95% CI) | Totals not selected | |
| Analysis 1.46  Comparison 1 Point‐of‐use fortification of foods with micronutrients powders (MNP) versus no intervention or placebo, Outcome 46 Serum vitamin E (non‐prespecified) (µg/dL). | ||||
| 47 Serum vitamin B12 (non‐prespecified) (pg/mL) Show forest plot | 2 | 329 | Mean Difference (IV, Random, 95% CI) | 241.16 [‐258.70, 741.02] |
| Analysis 1.47  Comparison 1 Point‐of‐use fortification of foods with micronutrients powders (MNP) versus no intervention or placebo, Outcome 47 Serum vitamin B12 (non‐prespecified) (pg/mL). | ||||
| 48 Zinc deficiency (non‐prespecified) Show forest plot | 1 | Risk Ratio (M‐H, Random, 95% CI) | Totals not selected | |
| Analysis 1.48  Comparison 1 Point‐of‐use fortification of foods with micronutrients powders (MNP) versus no intervention or placebo, Outcome 48 Zinc deficiency (non‐prespecified). | ||||
| 49 Vitamin A deficiency (non‐prespecified) Show forest plot | 1 | Risk Ratio (M‐H, Random, 95% CI) | Totals not selected | |
| Analysis 1.49  Comparison 1 Point‐of‐use fortification of foods with micronutrients powders (MNP) versus no intervention or placebo, Outcome 49 Vitamin A deficiency (non‐prespecified). | ||||
| 50 Serum folate concentration (ng/mL) Show forest plot | 2 | 329 | Mean Difference (IV, Random, 95% CI) | 2.16 [0.76, 3.56] |
| Analysis 1.50  Comparison 1 Point‐of‐use fortification of foods with micronutrients powders (MNP) versus no intervention or placebo, Outcome 50 Serum folate concentration (ng/mL). | ||||
| 51 Height (non‐prespecified) (cm) Show forest plot | 2 | 182 | Mean Difference (IV, Random, 95% CI) | 0.05 [‐3.71, 3.82] |
| Analysis 1.51 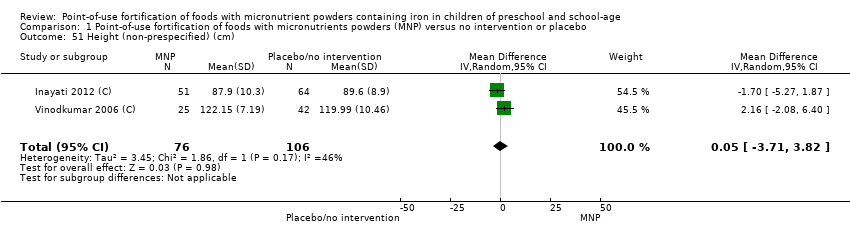 Comparison 1 Point‐of‐use fortification of foods with micronutrients powders (MNP) versus no intervention or placebo, Outcome 51 Height (non‐prespecified) (cm). | ||||
| 52 Weight (non‐prespecified) (kg) Show forest plot | 3 | 313 | Mean Difference (IV, Random, 95% CI) | ‐0.02 [‐0.59, 0.55] |
| Analysis 1.52  Comparison 1 Point‐of‐use fortification of foods with micronutrients powders (MNP) versus no intervention or placebo, Outcome 52 Weight (non‐prespecified) (kg). | ||||
| 53 Fever (non‐prespecified) Show forest plot | 1 | Risk Ratio (M‐H, Random, 95% CI) | Totals not selected | |
| Analysis 1.53  Comparison 1 Point‐of‐use fortification of foods with micronutrients powders (MNP) versus no intervention or placebo, Outcome 53 Fever (non‐prespecified). | ||||
| 54 Stunting (non‐prespecified) Show forest plot | 2 | 654 | Risk Ratio (M‐H, Random, 95% CI) | 0.91 [0.66, 1.25] |
| Analysis 1.54  Comparison 1 Point‐of‐use fortification of foods with micronutrients powders (MNP) versus no intervention or placebo, Outcome 54 Stunting (non‐prespecified). | ||||
| 55 Angular stomatitis (non‐prespecified) Show forest plot | 2 | 236 | Risk Ratio (M‐H, Random, 95% CI) | 0.04 [0.01, 0.29] |
| Analysis 1.55  Comparison 1 Point‐of‐use fortification of foods with micronutrients powders (MNP) versus no intervention or placebo, Outcome 55 Angular stomatitis (non‐prespecified). | ||||
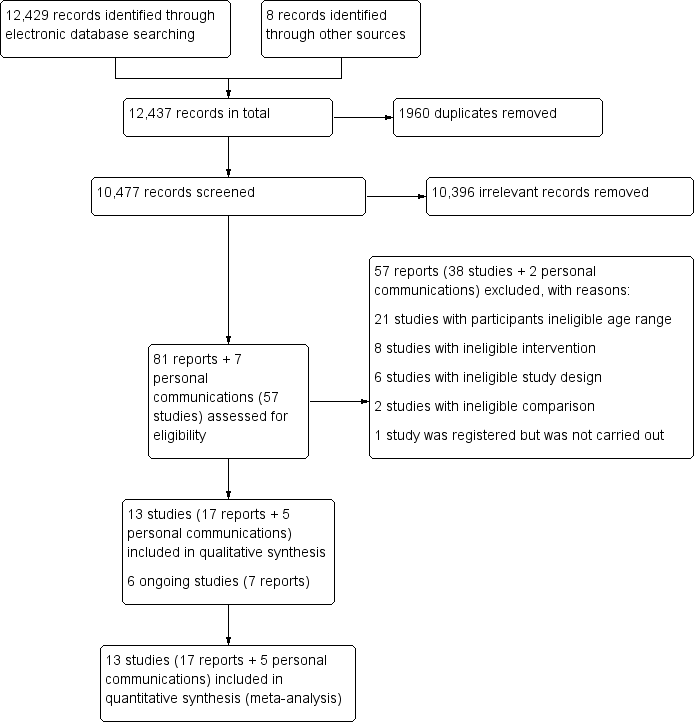
Study flow diagram.
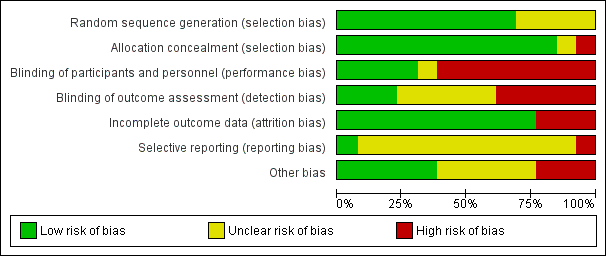
Risk of bias graph: review authors' judgements about each risk of bias item presented as percentages across all included trials.

Risk of bias summary: review authors' judgements about each risk of bias item for each included study.

Funnel plot of comparison: 1 Point‐of‐use fortification of foods with micronutrients powders versus no intervention/placebo, outcome: 1.11 Haemoglobin (g/L).
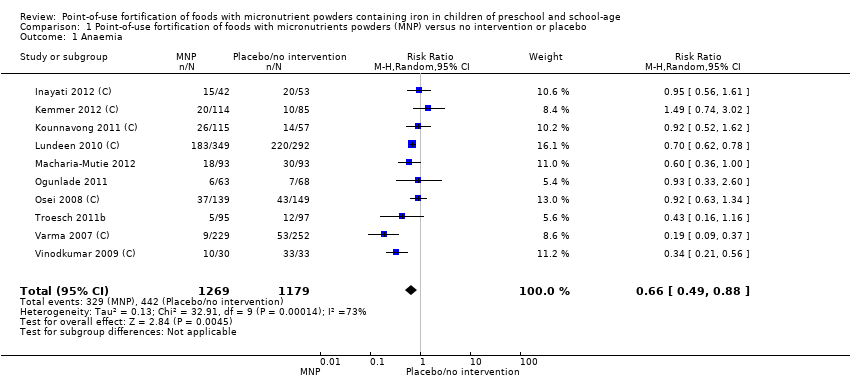
Comparison 1 Point‐of‐use fortification of foods with micronutrients powders (MNP) versus no intervention or placebo, Outcome 1 Anaemia.

Comparison 1 Point‐of‐use fortification of foods with micronutrients powders (MNP) versus no intervention or placebo, Outcome 2 Anaemia by anaemic status of participants at start of intervention.
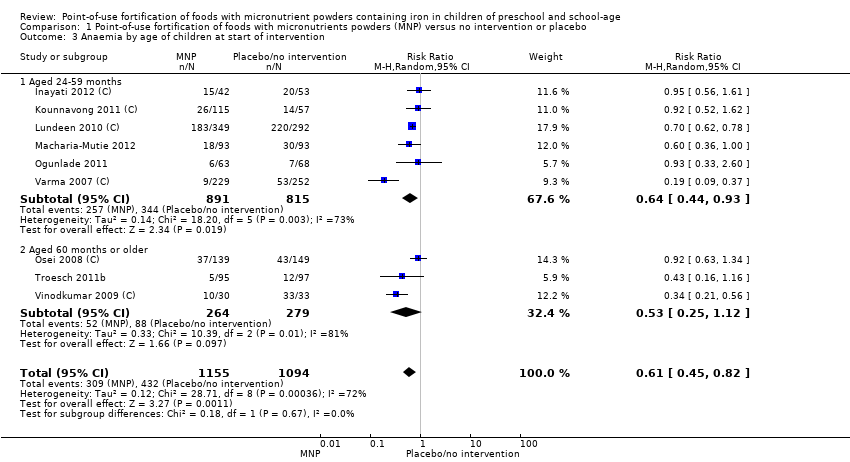
Comparison 1 Point‐of‐use fortification of foods with micronutrients powders (MNP) versus no intervention or placebo, Outcome 3 Anaemia by age of children at start of intervention.

Comparison 1 Point‐of‐use fortification of foods with micronutrients powders (MNP) versus no intervention or placebo, Outcome 4 Anaemia by malaria status of study site at time of trial.

Comparison 1 Point‐of‐use fortification of foods with micronutrients powders (MNP) versus no intervention or placebo, Outcome 5 Anaemia by frequency.

Comparison 1 Point‐of‐use fortification of foods with micronutrients powders (MNP) versus no intervention or placebo, Outcome 6 Anaemia by duration of intervention.
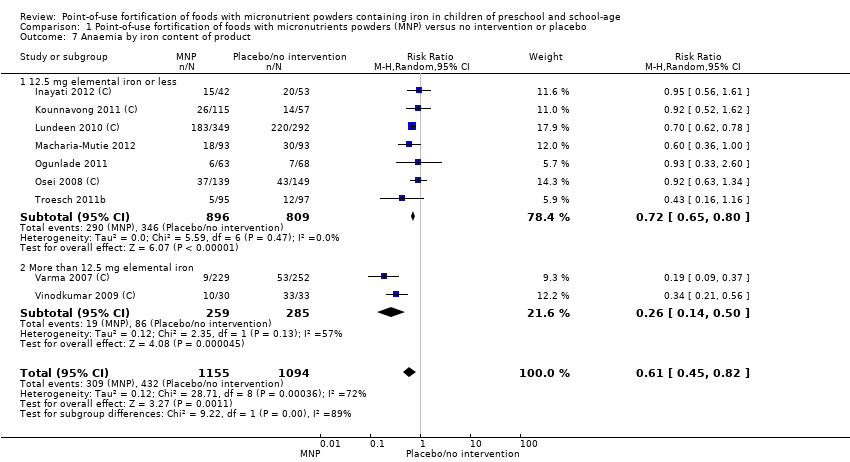
Comparison 1 Point‐of‐use fortification of foods with micronutrients powders (MNP) versus no intervention or placebo, Outcome 7 Anaemia by iron content of product.

Comparison 1 Point‐of‐use fortification of foods with micronutrients powders (MNP) versus no intervention or placebo, Outcome 8 Anaemia by type of iron compound.

Comparison 1 Point‐of‐use fortification of foods with micronutrients powders (MNP) versus no intervention or placebo, Outcome 9 Anaemia by number of nutrients accompanying iron.

Comparison 1 Point‐of‐use fortification of foods with micronutrients powders (MNP) versus no intervention or placebo, Outcome 10 Anaemia by micronutrient composition.

Comparison 1 Point‐of‐use fortification of foods with micronutrients powders (MNP) versus no intervention or placebo, Outcome 11 Haemoglobin (g/L).

Comparison 1 Point‐of‐use fortification of foods with micronutrients powders (MNP) versus no intervention or placebo, Outcome 12 Haemoglobin by anaemic status of participants at start of intervention (g/L).

Comparison 1 Point‐of‐use fortification of foods with micronutrients powders (MNP) versus no intervention or placebo, Outcome 13 Haemoglobin by age of children at start of intervention.

Comparison 1 Point‐of‐use fortification of foods with micronutrients powders (MNP) versus no intervention or placebo, Outcome 14 Haemoglobin by malaria status of study site at time of trial.

Comparison 1 Point‐of‐use fortification of foods with micronutrients powders (MNP) versus no intervention or placebo, Outcome 15 Haemoglobin by frequency (g/L).

Comparison 1 Point‐of‐use fortification of foods with micronutrients powders (MNP) versus no intervention or placebo, Outcome 16 Haemoglobin by duration of intervention.

Comparison 1 Point‐of‐use fortification of foods with micronutrients powders (MNP) versus no intervention or placebo, Outcome 17 Haemoglobin by iron content of product.

Comparison 1 Point‐of‐use fortification of foods with micronutrients powders (MNP) versus no intervention or placebo, Outcome 18 Haemoglobin by type of iron compound (g/L).

Comparison 1 Point‐of‐use fortification of foods with micronutrients powders (MNP) versus no intervention or placebo, Outcome 19 Haemoglobin by number of nutrients accompanying iron (g/L).

Comparison 1 Point‐of‐use fortification of foods with micronutrients powders (MNP) versus no intervention or placebo, Outcome 20 Haemoglobin by micronutrient composition (g/L).
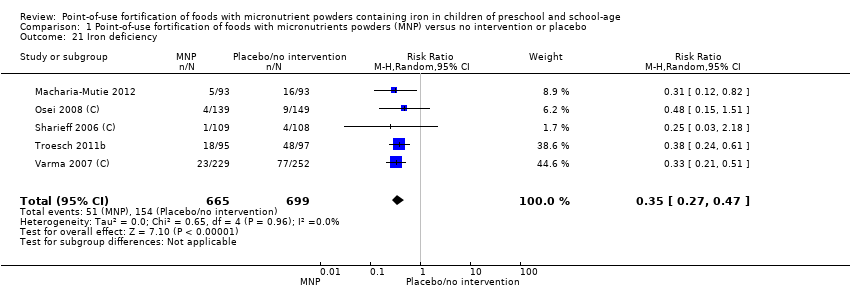
Comparison 1 Point‐of‐use fortification of foods with micronutrients powders (MNP) versus no intervention or placebo, Outcome 21 Iron deficiency.

Comparison 1 Point‐of‐use fortification of foods with micronutrients powders (MNP) versus no intervention or placebo, Outcome 22 Iron deficiency by anaemia status at start of intervention.

Comparison 1 Point‐of‐use fortification of foods with micronutrients powders (MNP) versus no intervention or placebo, Outcome 23 Iron deficiency by age of children at start of intervention.

Comparison 1 Point‐of‐use fortification of foods with micronutrients powders (MNP) versus no intervention or placebo, Outcome 24 Iron deficiency by malaria status of study site at time of trial.

Comparison 1 Point‐of‐use fortification of foods with micronutrients powders (MNP) versus no intervention or placebo, Outcome 25 Iron deficiency by frequency.

Comparison 1 Point‐of‐use fortification of foods with micronutrients powders (MNP) versus no intervention or placebo, Outcome 26 Iron deficiency by duration of intervention.

Comparison 1 Point‐of‐use fortification of foods with micronutrients powders (MNP) versus no intervention or placebo, Outcome 27 Iron deficiency by iron content of product.

Comparison 1 Point‐of‐use fortification of foods with micronutrients powders (MNP) versus no intervention or placebo, Outcome 28 Iron deficiency by type of iron compound.
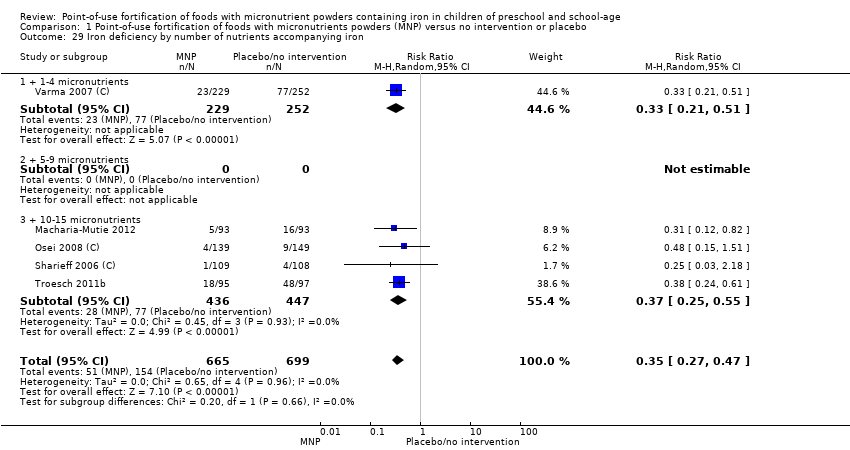
Comparison 1 Point‐of‐use fortification of foods with micronutrients powders (MNP) versus no intervention or placebo, Outcome 29 Iron deficiency by number of nutrients accompanying iron.

Comparison 1 Point‐of‐use fortification of foods with micronutrients powders (MNP) versus no intervention or placebo, Outcome 30 Iron deficiency by micronutrient composition.

Comparison 1 Point‐of‐use fortification of foods with micronutrients powders (MNP) versus no intervention or placebo, Outcome 31 Ferritin (μg/L).

Comparison 1 Point‐of‐use fortification of foods with micronutrients powders (MNP) versus no intervention or placebo, Outcome 32 All‐cause mortality.

Comparison 1 Point‐of‐use fortification of foods with micronutrients powders (MNP) versus no intervention or placebo, Outcome 33 Diarrhoea.

Comparison 1 Point‐of‐use fortification of foods with micronutrients powders (MNP) versus no intervention or placebo, Outcome 34 Adverse effects.
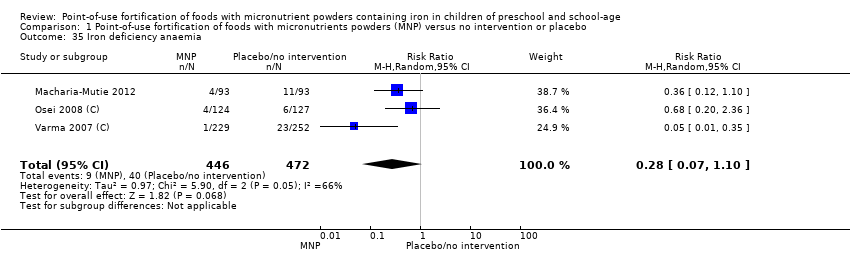
Comparison 1 Point‐of‐use fortification of foods with micronutrients powders (MNP) versus no intervention or placebo, Outcome 35 Iron deficiency anaemia.

Comparison 1 Point‐of‐use fortification of foods with micronutrients powders (MNP) versus no intervention or placebo, Outcome 36 All‐cause morbidity.

Comparison 1 Point‐of‐use fortification of foods with micronutrients powders (MNP) versus no intervention or placebo, Outcome 37 Acute respiratory infection.
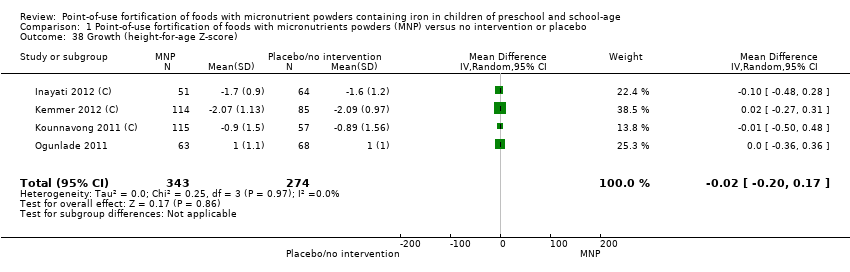
Comparison 1 Point‐of‐use fortification of foods with micronutrients powders (MNP) versus no intervention or placebo, Outcome 38 Growth (height‐for‐age Z‐score).

Comparison 1 Point‐of‐use fortification of foods with micronutrients powders (MNP) versus no intervention or placebo, Outcome 39 Growth (weight‐for‐age Z‐score).

Comparison 1 Point‐of‐use fortification of foods with micronutrients powders (MNP) versus no intervention or placebo, Outcome 40 Growth (weight‐for‐height Z‐score).

Comparison 1 Point‐of‐use fortification of foods with micronutrients powders (MNP) versus no intervention or placebo, Outcome 41 Adherence.

Comparison 1 Point‐of‐use fortification of foods with micronutrients powders (MNP) versus no intervention or placebo, Outcome 42 Serum/plasma retinol (mmol/L).
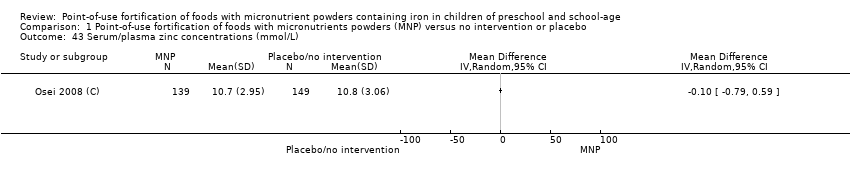
Comparison 1 Point‐of‐use fortification of foods with micronutrients powders (MNP) versus no intervention or placebo, Outcome 43 Serum/plasma zinc concentrations (mmol/L).

Comparison 1 Point‐of‐use fortification of foods with micronutrients powders (MNP) versus no intervention or placebo, Outcome 44 Iron status (iron‐binding capacity) (non‐prespecified) (µmol/kg).
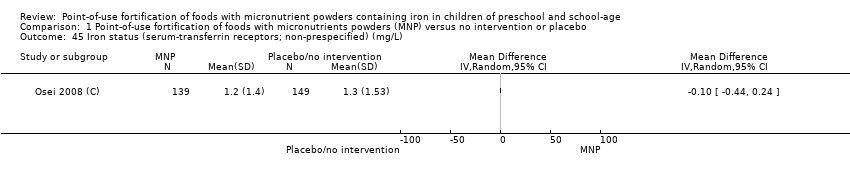
Comparison 1 Point‐of‐use fortification of foods with micronutrients powders (MNP) versus no intervention or placebo, Outcome 45 Iron status (serum‐transferrin receptors; non‐prespecified) (mg/L).

Comparison 1 Point‐of‐use fortification of foods with micronutrients powders (MNP) versus no intervention or placebo, Outcome 46 Serum vitamin E (non‐prespecified) (µg/dL).

Comparison 1 Point‐of‐use fortification of foods with micronutrients powders (MNP) versus no intervention or placebo, Outcome 47 Serum vitamin B12 (non‐prespecified) (pg/mL).

Comparison 1 Point‐of‐use fortification of foods with micronutrients powders (MNP) versus no intervention or placebo, Outcome 48 Zinc deficiency (non‐prespecified).
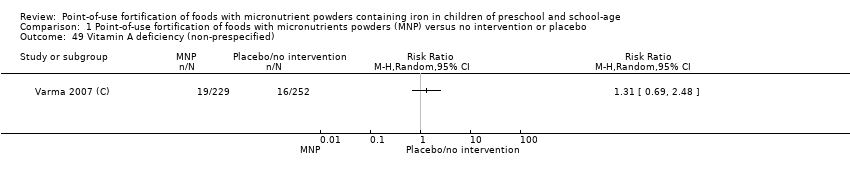
Comparison 1 Point‐of‐use fortification of foods with micronutrients powders (MNP) versus no intervention or placebo, Outcome 49 Vitamin A deficiency (non‐prespecified).

Comparison 1 Point‐of‐use fortification of foods with micronutrients powders (MNP) versus no intervention or placebo, Outcome 50 Serum folate concentration (ng/mL).

Comparison 1 Point‐of‐use fortification of foods with micronutrients powders (MNP) versus no intervention or placebo, Outcome 51 Height (non‐prespecified) (cm).
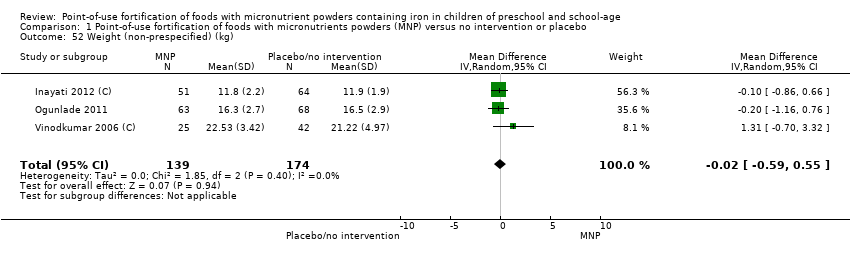
Comparison 1 Point‐of‐use fortification of foods with micronutrients powders (MNP) versus no intervention or placebo, Outcome 52 Weight (non‐prespecified) (kg).

Comparison 1 Point‐of‐use fortification of foods with micronutrients powders (MNP) versus no intervention or placebo, Outcome 53 Fever (non‐prespecified).
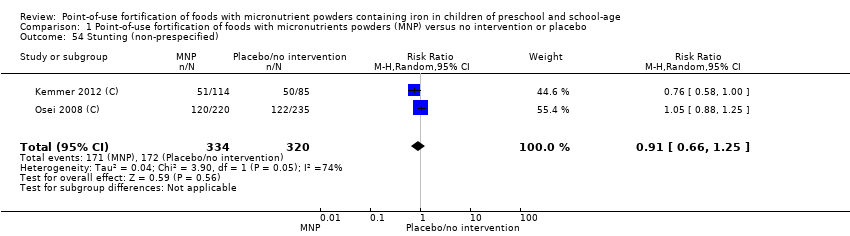
Comparison 1 Point‐of‐use fortification of foods with micronutrients powders (MNP) versus no intervention or placebo, Outcome 54 Stunting (non‐prespecified).
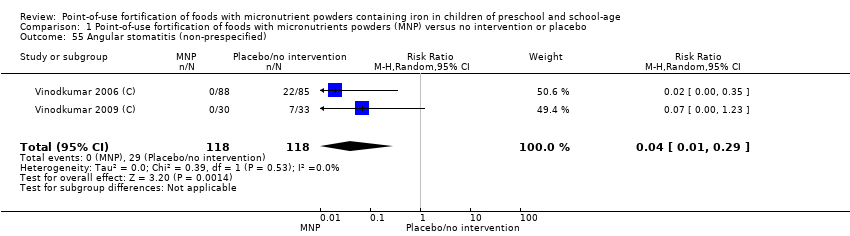
Comparison 1 Point‐of‐use fortification of foods with micronutrients powders (MNP) versus no intervention or placebo, Outcome 55 Angular stomatitis (non‐prespecified).
| Point‐of‐use fortification of foods with MNP compared to no intervention or placebo in preschool and school‐age children | ||||||
| Patient or population: preschool and school‐age children Setting: all settings Intervention: point‐of‐use fortification of foods with MNP Comparison: no intervention or placebo | ||||||
| Outcomes | Anticipated absolute effects* (95% CI) | Relative effect | Number of participants | Quality of the evidence | Comments | |
| Risk with no intervention or placebo | Risk with point‐of‐use fortification of foods with MNP | |||||
| Anaemia (defined as haemoglobin < 110 g/L for children aged 24‐59 months and < 115 g/L for children aged 5‐11.9 years, adjusted by altitude where appropriate)* | Study population | RR 0.66 | 2448 | ⊕⊕⊕⊝ | Included studies: Inayati 2012 (C); Kemmer 2012 (C); Kounnavong 2011 (C); Lundeen 2010 (C); Macharia‐Mutie 2012; Ogunlade 2011; Osei 2008 (C); Troesch 2011b; Varma 2007 (C); Vinodkumar 2009 (C). | |
| 375 per 1000 | 247 per 1000 | |||||
| Haemoglobin | The mean haemoglobin score in control groups ranged from 103.50 g/L to 128.00 g/L | The mean haemoglobin score in intervention groups was, on average, 3.37 g/L higher (0.94 g/L higher to 5.80 g/L higher) | ‐ | 2746 | ⊕⊕⊝⊝ | Included studies: Inayati 2012 (C); Kemmer 2012 (C); Kounnavong 2011 (C); Lundeen 2010 (C); Macharia‐Mutie 2012; Ogunlade 2011; Osei 2008 (C); Sharieff 2006 (C); Varma 2007 (C); Vinodkumar 2006 (C); Vinodkumar 2009 (C). |
| Iron deficiency (defined by using ferritin concentrations less than 15 µg/L) | Study population | RR 0.35 | 1364 | ⊕⊕⊕⊝ | Included studies: Macharia‐Mutie 2012; Osei 2008 (C); Sharieff 2006 (C); Troesch 2011b; Varma 2007 (C). | |
| 220 per 1000 | 77 per 1000 | |||||
| Ferritin | 0 | The standardised mean ferritin score in intervention groups was, on average, 0.42 μg/L higher (4.36 μg/L lower to 5.19 μg/L higher) | ‐ | 1066 | ⊕⊝⊝⊝ | Included studies: Osei 2008 (C); Sharieff 2006 (C); Varma 2007 (C). |
| All‐cause mortality (number of deaths during trial) | Study population | Not estimable | 115 | ⊕⊕⊝⊝ | Included study: Inayati 2012 (C). | |
| 0 per 1000 | 0 per 1000 | |||||
| Diarrhoea (≥ 3 liquid stools per day) | Study population | RR 0.97 | 366 | ⊕⊕⊝⊝ | Included studies: Inayati 2012 (C); Osei 2008 (C). | |
| 96 per 1000 | 93 per 1000 | |||||
| Adverse effects (any, as defined by trialists) | Study population | RR 1.09 | 90 | ⊕⊕⊕⊝ | Included study: Orozco 2015 (C). | |
| 43 per 1000 | 46 per 1000 | |||||
| *The risk in the intervention group (and its 95% confidence interval) is based on the assumed risk in the comparison group and the relative effect of the intervention (and its 95% CI). CI: confidence interval; MD: mean difference; MNP: micronutrient powder; RCT: randomised controlled trial; RR: risk ratio. | ||||||
| GRADE Working Group grades of evidence | ||||||
| aMost studies had no blinding. High heterogeneity (72%) with most studies showing a positive effect of MNP. | ||||||
| Method | Approach |
| Unit of analysis issues | Cross‐over trials We planned to only include the first period of a randomised cross‐over trial prior to the washout period or to a change in the sequence of treatments. We planned to treat them as parallel randomised controlled trials. |
| Outcome or subgroup title | No. of studies | No. of participants | Statistical method | Effect size |
| 1 Anaemia Show forest plot | 10 | 2448 | Risk Ratio (M‐H, Random, 95% CI) | 0.66 [0.49, 0.88] |
| 2 Anaemia by anaemic status of participants at start of intervention Show forest plot | 10 | 2448 | Risk Ratio (M‐H, Random, 95% CI) | 0.66 [0.49, 0.88] |
| 2.1 Anaemic | 0 | 0 | Risk Ratio (M‐H, Random, 95% CI) | 0.0 [0.0, 0.0] |
| 2.2 Non‐anaemic | 1 | 199 | Risk Ratio (M‐H, Random, 95% CI) | 1.49 [0.74, 3.02] |
| 2.3 Mixed/unknown | 9 | 2249 | Risk Ratio (M‐H, Random, 95% CI) | 0.61 [0.45, 0.82] |
| 3 Anaemia by age of children at start of intervention Show forest plot | 9 | 2249 | Risk Ratio (M‐H, Random, 95% CI) | 0.61 [0.45, 0.82] |
| 3.1 Aged 24‐59 months | 6 | 1706 | Risk Ratio (M‐H, Random, 95% CI) | 0.64 [0.44, 0.93] |
| 3.2 Aged 60 months or older | 3 | 543 | Risk Ratio (M‐H, Random, 95% CI) | 0.53 [0.25, 1.12] |
| 4 Anaemia by malaria status of study site at time of trial Show forest plot | 9 | 2249 | Risk Ratio (M‐H, Random, 95% CI) | 0.61 [0.45, 0.82] |
| 4.1 Yes | 4 | 934 | Risk Ratio (M‐H, Random, 95% CI) | 0.57 [0.29, 1.14] |
| 4.2 No | 4 | 1252 | Risk Ratio (M‐H, Random, 95% CI) | 0.72 [0.62, 0.85] |
| 4.3 Not reported | 1 | 63 | Risk Ratio (M‐H, Random, 95% CI) | 0.34 [0.21, 0.56] |
| 5 Anaemia by frequency Show forest plot | 9 | 2249 | Risk Ratio (M‐H, Random, 95% CI) | 0.62 [0.46, 0.82] |
| 5.1 Daily | 9 | 2163 | Risk Ratio (M‐H, Random, 95% CI) | 0.59 [0.43, 0.80] |
| 5.2 Weekly | 1 | 86 | Risk Ratio (M‐H, Random, 95% CI) | 1.09 [0.50, 2.37] |
| 5.3 Flexible | 0 | 0 | Risk Ratio (M‐H, Random, 95% CI) | 0.0 [0.0, 0.0] |
| 6 Anaemia by duration of intervention Show forest plot | 9 | 2249 | Risk Ratio (M‐H, Random, 95% CI) | 0.61 [0.45, 0.82] |
| 6.1 Less than 3 months | 3 | 867 | Risk Ratio (M‐H, Random, 95% CI) | 0.71 [0.63, 0.80] |
| 6.2 3 months or longer | 6 | 1382 | Risk Ratio (M‐H, Random, 95% CI) | 0.51 [0.31, 0.84] |
| 7 Anaemia by iron content of product Show forest plot | 9 | 2249 | Risk Ratio (M‐H, Random, 95% CI) | 0.61 [0.45, 0.82] |
| 7.1 12.5 mg elemental iron or less | 7 | 1705 | Risk Ratio (M‐H, Random, 95% CI) | 0.72 [0.65, 0.80] |
| 7.2 More than 12.5 mg elemental iron | 2 | 544 | Risk Ratio (M‐H, Random, 95% CI) | 0.26 [0.14, 0.50] |
| 8 Anaemia by type of iron compound Show forest plot | 9 | 2249 | Risk Ratio (M‐H, Random, 95% CI) | 0.61 [0.45, 0.82] |
| 8.1 Iron EDTA | 4 | 797 | Risk Ratio (M‐H, Random, 95% CI) | 0.75 [0.56, 1.02] |
| 8.2 Encapsulated ferrous fumarate | 4 | 1389 | Risk Ratio (M‐H, Random, 95% CI) | 0.61 [0.35, 1.04] |
| 8.3 Other | 1 | 63 | Risk Ratio (M‐H, Random, 95% CI) | 0.34 [0.21, 0.56] |
| 9 Anaemia by number of nutrients accompanying iron Show forest plot | 9 | 2249 | Risk Ratio (M‐H, Random, 95% CI) | 0.61 [0.45, 0.82] |
| 9.1 1‐4 | 3 | 1185 | Risk Ratio (M‐H, Random, 95% CI) | 0.37 [0.16, 0.86] |
| 9.2 5‐9 | 0 | 0 | Risk Ratio (M‐H, Random, 95% CI) | 0.0 [0.0, 0.0] |
| 9.3 10‐15 | 6 | 1064 | Risk Ratio (M‐H, Random, 95% CI) | 0.82 [0.65, 1.03] |
| 10 Anaemia by micronutrient composition Show forest plot | 9 | 2249 | Risk Ratio (M‐H, Random, 95% CI) | 0.61 [0.45, 0.82] |
| 10.1 Iron alone | 0 | 0 | Risk Ratio (M‐H, Random, 95% CI) | 0.0 [0.0, 0.0] |
| 10.2 Iron + vitamin A + zinc | 7 | 1705 | Risk Ratio (M‐H, Random, 95% CI) | 0.72 [0.65, 0.80] |
| 10.3 Iron + other combinations | 2 | 544 | Risk Ratio (M‐H, Random, 95% CI) | 0.26 [0.14, 0.50] |
| 11 Haemoglobin (g/L) Show forest plot | 11 | 2746 | Mean Difference (IV, Random, 95% CI) | 3.37 [0.94, 5.80] |
| 12 Haemoglobin by anaemic status of participants at start of intervention (g/L) Show forest plot | 10 | 2547 | Mean Difference (IV, Random, 95% CI) | 3.70 [1.08, 6.32] |
| 12.1 Anaemic | 0 | 0 | Mean Difference (IV, Random, 95% CI) | 0.0 [0.0, 0.0] |
| 12.2 Non‐anaemic | 0 | 0 | Mean Difference (IV, Random, 95% CI) | 0.0 [0.0, 0.0] |
| 12.3 Mixed/unknown | 10 | 2547 | Mean Difference (IV, Random, 95% CI) | 3.70 [1.08, 6.32] |
| 13 Haemoglobin by age of children at start of intervention Show forest plot | 10 | 2547 | Mean Difference (IV, Random, 95% CI) | 3.70 [1.08, 6.32] |
| 13.1 Aged 24‐59 months | 7 | 2023 | Mean Difference (IV, Random, 95% CI) | 2.02 [‐0.87, 4.92] |
| 13.2 Aged 60 months or older | 3 | 524 | Mean Difference (IV, Random, 95% CI) | 7.86 [‐0.76, 16.49] |
| 14 Haemoglobin by malaria status of study site at time of trial Show forest plot | 10 | 2547 | Mean Difference (IV, Random, 95% CI) | 3.70 [1.08, 6.32] |
| 14.1 Yes | 4 | 954 | Mean Difference (IV, Random, 95% CI) | 2.68 [1.15, 4.22] |
| 14.2 No | 3 | 1060 | Mean Difference (IV, Random, 95% CI) | 2.31 [‐2.84, 7.46] |
| 14.3 Not reported | 3 | 533 | Mean Difference (IV, Random, 95% CI) | 7.51 [‐1.22, 16.24] |
| 15 Haemoglobin by frequency (g/L) Show forest plot | 10 | 2547 | Mean Difference (IV, Random, 95% CI) | 3.27 [0.84, 5.70] |
| 15.1 Daily | 10 | 2315 | Mean Difference (IV, Random, 95% CI) | 3.84 [1.07, 6.61] |
| 15.2 Weekly | 2 | 232 | Mean Difference (IV, Random, 95% CI) | ‐0.25 [‐3.07, 2.56] |
| 15.3 Flexible | 0 | 0 | Mean Difference (IV, Random, 95% CI) | 0.0 [0.0, 0.0] |
| 16 Haemoglobin by duration of intervention Show forest plot | 10 | 2547 | Mean Difference (IV, Random, 95% CI) | 3.70 [1.08, 6.32] |
| 16.1 Less than 3 months | 3 | 887 | Mean Difference (IV, Random, 95% CI) | 2.14 [‐5.04, 9.32] |
| 16.2 3 months or longer | 7 | 1660 | Mean Difference (IV, Random, 95% CI) | 4.26 [1.23, 7.29] |
| 17 Haemoglobin by iron content of product Show forest plot | 10 | 2547 | Mean Difference (IV, Random, 95% CI) | 3.70 [1.08, 6.32] |
| 17.1 12.5 mg elemental iron or less | 7 | 1706 | Mean Difference (IV, Random, 95% CI) | 3.05 [‐0.20, 6.29] |
| 17.2 More than 12.5 mg elemental iron | 3 | 841 | Mean Difference (IV, Random, 95% CI) | 5.33 [‐1.23, 11.88] |
| 18 Haemoglobin by type of iron compound (g/L) Show forest plot | 10 | 2547 | Mean Difference (IV, Random, 95% CI) | 3.70 [1.08, 6.32] |
| 18.1 Iron EDTA | 3 | 605 | Mean Difference (IV, Random, 95% CI) | 0.51 [‐0.99, 2.02] |
| 18.2 Encapsulated ferrous fumarate | 5 | 1706 | Mean Difference (IV, Random, 95% CI) | 2.81 [‐0.77, 6.38] |
| 18.3 Other | 2 | 236 | Mean Difference (IV, Random, 95% CI) | 11.42 [8.81, 14.03] |
| 19 Haemoglobin by number of nutrients accompanying iron (g/L) Show forest plot | 10 | 2547 | Mean Difference (IV, Random, 95% CI) | 3.70 [1.08, 6.32] |
| 19.1 + 1‐4 micronutrients | 3 | 1185 | Mean Difference (IV, Random, 95% CI) | 8.11 [3.70, 12.52] |
| 19.2 + 5‐9 micronutrients | 2 | 470 | Mean Difference (IV, Random, 95% CI) | 4.85 [‐5.73, 15.43] |
| 19.3 + 10‐15 micronutrients | 5 | 892 | Mean Difference (IV, Random, 95% CI) | 0.69 [0.35, 1.03] |
| 20 Haemoglobin by micronutrient composition (g/L) Show forest plot | 10 | 2547 | Mean Difference (IV, Random, 95% CI) | 3.70 [1.08, 6.32] |
| 20.1 Iron alone | 0 | 0 | Mean Difference (IV, Random, 95% CI) | 0.0 [0.0, 0.0] |
| 20.2 Iron + vitamin A + zinc | 7 | 1830 | Mean Difference (IV, Random, 95% CI) | 1.53 [‐0.88, 3.95] |
| 20.3 Iron + other combinations | 3 | 717 | Mean Difference (IV, Random, 95% CI) | 8.95 [3.42, 14.49] |
| 21 Iron deficiency Show forest plot | 5 | 1364 | Risk Ratio (M‐H, Random, 95% CI) | 0.35 [0.27, 0.47] |
| 22 Iron deficiency by anaemia status at start of intervention Show forest plot | 5 | 1364 | Risk Ratio (M‐H, Random, 95% CI) | 0.35 [0.27, 0.47] |
| 22.1 Anaemic | 0 | 0 | Risk Ratio (M‐H, Random, 95% CI) | 0.0 [0.0, 0.0] |
| 22.2 Non‐anaemic | 0 | 0 | Risk Ratio (M‐H, Random, 95% CI) | 0.0 [0.0, 0.0] |
| 22.3 Mixed/unknown | 5 | 1364 | Risk Ratio (M‐H, Random, 95% CI) | 0.35 [0.27, 0.47] |
| 23 Iron deficiency by age of children at start of intervention Show forest plot | 5 | 1364 | Risk Ratio (M‐H, Random, 95% CI) | 0.35 [0.27, 0.47] |
| 23.1 Aged 24‐59 months | 3 | 884 | Risk Ratio (M‐H, Random, 95% CI) | 0.32 [0.22, 0.48] |
| 23.2 Aged 60 months or older | 2 | 480 | Risk Ratio (M‐H, Random, 95% CI) | 0.39 [0.26, 0.61] |
| 24 Iron deficiency by malaria status of study site at time of trial Show forest plot | 5 | 1364 | Risk Ratio (M‐H, Random, 95% CI) | 0.35 [0.27, 0.47] |
| 24.1 Yes | 2 | 667 | Risk Ratio (M‐H, Random, 95% CI) | 0.33 [0.22, 0.48] |
| 24.2 No | 2 | 480 | Risk Ratio (M‐H, Random, 95% CI) | 0.39 [0.26, 0.61] |
| 24.3 Not reported | 1 | 217 | Risk Ratio (M‐H, Random, 95% CI) | 0.25 [0.03, 2.18] |
| 25 Iron deficiency by frequency Show forest plot | 5 | 1364 | Risk Ratio (M‐H, Random, 95% CI) | 0.35 [0.27, 0.47] |
| 25.1 Daily | 0 | 0 | Risk Ratio (M‐H, Random, 95% CI) | 0.0 [0.0, 0.0] |
| 25.2 Weekly | 5 | 1364 | Risk Ratio (M‐H, Random, 95% CI) | 0.35 [0.27, 0.47] |
| 25.3 Flexible | 0 | 0 | Risk Ratio (M‐H, Random, 95% CI) | 0.0 [0.0, 0.0] |
| 26 Iron deficiency by duration of intervention Show forest plot | 5 | 1364 | Risk Ratio (M‐H, Random, 95% CI) | 0.35 [0.27, 0.47] |
| 26.1 Less than 3 months | 0 | 0 | Risk Ratio (M‐H, Random, 95% CI) | 0.0 [0.0, 0.0] |
| 26.2 3 months or longer | 5 | 1364 | Risk Ratio (M‐H, Random, 95% CI) | 0.35 [0.27, 0.47] |
| 27 Iron deficiency by iron content of product Show forest plot | 5 | 1364 | Risk Ratio (M‐H, Random, 95% CI) | 0.35 [0.27, 0.47] |
| 27.1 12.5 mg elemental iron or less | 3 | 666 | Risk Ratio (M‐H, Random, 95% CI) | 0.38 [0.26, 0.56] |
| 27.2 More than 12.5 mg elemental iron | 2 | 698 | Risk Ratio (M‐H, Random, 95% CI) | 0.33 [0.21, 0.50] |
| 28 Iron deficiency by type of iron compound Show forest plot | 5 | 1364 | Risk Ratio (M‐H, Random, 95% CI) | 0.35 [0.27, 0.47] |
| 28.1 Iron EDTA | 3 | 666 | Risk Ratio (M‐H, Random, 95% CI) | 0.38 [0.26, 0.56] |
| 28.2 Encapsulated ferrous fumarate | 2 | 698 | Risk Ratio (M‐H, Random, 95% CI) | 0.33 [0.21, 0.50] |
| 28.3 Other | 0 | 0 | Risk Ratio (M‐H, Random, 95% CI) | 0.0 [0.0, 0.0] |
| 29 Iron deficiency by number of nutrients accompanying iron Show forest plot | 5 | 1364 | Risk Ratio (M‐H, Random, 95% CI) | 0.35 [0.27, 0.47] |
| 29.1 + 1‐4 micronutrients | 1 | 481 | Risk Ratio (M‐H, Random, 95% CI) | 0.33 [0.21, 0.51] |
| 29.2 + 5‐9 micronutrients | 0 | 0 | Risk Ratio (M‐H, Random, 95% CI) | 0.0 [0.0, 0.0] |
| 29.3 + 10‐15 micronutrients | 4 | 883 | Risk Ratio (M‐H, Random, 95% CI) | 0.37 [0.25, 0.55] |
| 30 Iron deficiency by micronutrient composition Show forest plot | 5 | 1364 | Risk Ratio (M‐H, Random, 95% CI) | 0.35 [0.27, 0.47] |
| 30.1 Iron alone | 0 | 0 | Risk Ratio (M‐H, Random, 95% CI) | 0.0 [0.0, 0.0] |
| 30.2 Iron + vitamin A + zinc | 4 | 883 | Risk Ratio (M‐H, Random, 95% CI) | 0.37 [0.25, 0.55] |
| 30.3 Iron + other combinations | 1 | 481 | Risk Ratio (M‐H, Random, 95% CI) | 0.33 [0.21, 0.51] |
| 31 Ferritin (μg/L) Show forest plot | 3 | 1066 | Std. Mean Difference (IV, Random, 95% CI) | 0.42 [‐4.36, 5.19] |
| 32 All‐cause mortality Show forest plot | 1 | Risk Ratio (M‐H, Random, 95% CI) | Totals not selected | |
| 33 Diarrhoea Show forest plot | 2 | 366 | Risk Ratio (M‐H, Random, 95% CI) | 0.97 [0.53, 1.78] |
| 34 Adverse effects Show forest plot | 1 | Risk Ratio (M‐H, Random, 95% CI) | Totals not selected | |
| 35 Iron deficiency anaemia Show forest plot | 3 | 918 | Risk Ratio (M‐H, Random, 95% CI) | 0.28 [0.07, 1.10] |
| 36 All‐cause morbidity Show forest plot | 3 | 538 | Risk Ratio (M‐H, Random, 95% CI) | 0.96 [0.74, 1.23] |
| 37 Acute respiratory infection Show forest plot | 1 | Risk Ratio (M‐H, Random, 95% CI) | Totals not selected | |
| 38 Growth (height‐for‐age Z‐score) Show forest plot | 4 | 617 | Mean Difference (IV, Random, 95% CI) | ‐0.02 [‐0.20, 0.17] |
| 39 Growth (weight‐for‐age Z‐score) Show forest plot | 3 | 502 | Mean Difference (IV, Random, 95% CI) | ‐0.01 [‐0.09, 0.07] |
| 40 Growth (weight‐for‐height Z‐score) Show forest plot | 2 | 287 | Mean Difference (IV, Random, 95% CI) | 0.09 [0.00, 0.19] |
| 41 Adherence Show forest plot | 1 | Risk Ratio (M‐H, Random, 95% CI) | Totals not selected | |
| 42 Serum/plasma retinol (mmol/L) Show forest plot | 2 | 547 | Mean Difference (IV, Random, 95% CI) | 10.08 [‐10.72, 30.88] |
| 43 Serum/plasma zinc concentrations (mmol/L) Show forest plot | 1 | Mean Difference (IV, Random, 95% CI) | Totals not selected | |
| 44 Iron status (iron‐binding capacity) (non‐prespecified) (µmol/kg) Show forest plot | 1 | Mean Difference (IV, Random, 95% CI) | Totals not selected | |
| 45 Iron status (serum‐transferrin receptors; non‐prespecified) (mg/L) Show forest plot | 1 | Mean Difference (IV, Random, 95% CI) | Totals not selected | |
| 46 Serum vitamin E (non‐prespecified) (µg/dL) Show forest plot | 1 | Mean Difference (IV, Random, 95% CI) | Totals not selected | |
| 47 Serum vitamin B12 (non‐prespecified) (pg/mL) Show forest plot | 2 | 329 | Mean Difference (IV, Random, 95% CI) | 241.16 [‐258.70, 741.02] |
| 48 Zinc deficiency (non‐prespecified) Show forest plot | 1 | Risk Ratio (M‐H, Random, 95% CI) | Totals not selected | |
| 49 Vitamin A deficiency (non‐prespecified) Show forest plot | 1 | Risk Ratio (M‐H, Random, 95% CI) | Totals not selected | |
| 50 Serum folate concentration (ng/mL) Show forest plot | 2 | 329 | Mean Difference (IV, Random, 95% CI) | 2.16 [0.76, 3.56] |
| 51 Height (non‐prespecified) (cm) Show forest plot | 2 | 182 | Mean Difference (IV, Random, 95% CI) | 0.05 [‐3.71, 3.82] |
| 52 Weight (non‐prespecified) (kg) Show forest plot | 3 | 313 | Mean Difference (IV, Random, 95% CI) | ‐0.02 [‐0.59, 0.55] |
| 53 Fever (non‐prespecified) Show forest plot | 1 | Risk Ratio (M‐H, Random, 95% CI) | Totals not selected | |
| 54 Stunting (non‐prespecified) Show forest plot | 2 | 654 | Risk Ratio (M‐H, Random, 95% CI) | 0.91 [0.66, 1.25] |
| 55 Angular stomatitis (non‐prespecified) Show forest plot | 2 | 236 | Risk Ratio (M‐H, Random, 95% CI) | 0.04 [0.01, 0.29] |