Infusión continua de lidocaína intravenosa perioperatoria para el dolor posoperatorio y la recuperación en adultos
Información
- DOI:
- https://doi.org/10.1002/14651858.CD009642.pub3Copiar DOI

- Base de datos:
-
- Cochrane Database of Systematic Reviews
- Versión publicada:
-
- 04 junio 2018see what's new
- Tipo:
-
- Intervention
- Etapa:
-
- Review
- Grupo Editorial Cochrane:
-
Grupo Cochrane de Anestesia
- Copyright:
-
- Copyright © 2018 The Cochrane Collaboration. Published by John Wiley & Sons, Ltd.
Cifras del artículo
Altmetric:
Citado por:
Autores
Contributions of authors
Stephanie Weibel (SW), Yvonne Jelting (YJ), Nathan Leon Pace (NLP), Antonia Helf (AH), Leopold HJ Eberhart (LE), Klaus Hahnenkamp (KH), Markus W Hollmann (MH), Daniel M Poepping (DP), Alexander Schnabel (AS), Peter Kranke (PK)
(Original review: Kranke 2015)
Conceiving the review: AS, PK
Co‐ordinating the review: original review ‐ PK; update ‐ SW, PK
Undertaking manual searches: original review ‐ JJ, SW; update ‐ YJ, SW
Screening search results: original review ‐ JJ, SW; update ‐ SW, YJ, AH
Organizing retrieval of papers: original review ‐ JJ, SW, PK; update ‐ SW, YJ, PK
Screening retrieved papers against inclusion criteria: original review ‐ JJ, SW; update ‐ SW, YJ, AH
Appraising quality of papers: original review ‐ JJ, SW; update ‐ SW; YJ, AH
Abstracting data from papers: original review ‐ SW, JJ, PK, DP, LE, AS, KH, MH; update ‐ SW, YJ, AH
Writing to authors of papers for additional information ‐ original review: SW; update ‐ SW, YJ
Providing additional data about papers: SW
Obtaining and screening data on unpublished studies: SW
Data management for the review: SW
Entering data into Review Manager 5 (RevMan 5; Review Manager 2014): SW
RevMan statistical data: SW, NLP
Other statistical analysis not using RevMan: original review ‐ PK, NLP; update ‐ SW, NLP
Double entry of data: original review ‐ (data entered by person one: SW; data checked by person two: JJ); update ‐ data entered by person one: SW; data checked by person two: YJ)
Interpretation of data: original review ‐ PK, SW, LE, MH, KH, DP, NLP; update ‐ PK, SW, LE, MH, KH, DP, NLP, AS, YJ, AH
Statistical inferences: original review ‐NLP, PK, SW; update ‐ NLP, PK, SW
Writing the review: original review: SW, PK, JJ, MH; update ‐ SW, PK, YJ, AH
Securing funding for the review: PK
Performing previous work that was the foundation of the present study: original review ‐ MH, KH, PK; update: PK
Guarantor for the review (one author): PK
Person responsible for reading and checking review before submission: PK
Sources of support
Internal sources
-
Departmental resources only, Germany.
External sources
-
No sources of support supplied
Declarations of interest
Stephanie Weibel: none known.
Yvonne Jelting: none known.
Nathan Leon Pace: has no conflict of interest regarding the topic of this review. Nathan L Pace has received payment for development of educational presentations (Barash, Cullen, Stoelting Clinical Anesthesia 8th edition) and provided consultancy (St Marks Hospital, Salt Lake City, UT) on topics not related to the current review. He has received supplements to attend Cochrane meetings. He also has stocks and shares in companies which have no interest in the topic of this review (TIAA‐CREF, Fidelity, Vanguard, USAA, Morgan Stanley).
Antonia Helf: none known.
Leopold HJ Eberhart: has no conflict of interest regarding the topic of this review. Leopold HJ Eberhart has received lecture fees (from
Baxter GmbH and Fresenius GmbH), payment for lectures (from Grünenthal GmbH, Baxter GmbH and Fresenius, GmbH) and has
provided consultancy (for Grünenthal GmbH, Baxter GmbH, ratiopharm GmbH) for topics not related to the current review. He
holds a board membership (with Grünenthal GmbH Deutschland) who do not have an interest in the topic of this review.
Klaus Hahnenkamp: is working in this research area and has participated in a clinical study that is relevant for this systematic review (Herroeder 2007). Critical appraisal and data extraction were done by JJ and SW.
Markus W Hollmann: is working in this research area and has participated in a clinical study that is relevant for this systematic review (Herroeder 2007). Critical appraisal and data extraction were done by JJ and SW.
Daniel M Poepping: none known.
Alexander Schnabel: none known.
Peter Kranke: has no conflict of interest regarding the topic of this review. Peter Kranke has received lecture fees (from FreseniusKabi,
MSD, Ratiopharm, Covidien) and has provided consultancy (to MSD, FreseniusKabi, Ratiopharm, Covidien) on topics not related
to the current review. He has been involved in the conduct of Phase II and phase III clinical trials not related to the current review.
Acknowledgements
We would like to thank Jane Cracknell (Managing Editor, Cochrane Anaesthesia, Critical and Emergency Care Group (ACE), formerly Cochrane Anaesthesia Review Group (CARG)), Mathew Zacharias (Content Editor), Marialena Trivella (Statistical Editor), Jane Ballantyne and William Zempsky (Peer Reviewers), and Janet Wale (Consumer Editor) for their help and editorial advice during the preparation of the protocol for the review (Selig 2012); and Karen Hovhannisyan (ACE Information Specialist) for performing the professional literature search.
We would like to thank Andy Smith (Content Editor), Vibeke E Horstmann (Statistical Editor), Andrew Moore and Marc Gentili (Peer Reviewers), and Janet Wale (Consumer Editor) for their help and editorial advice during the preparation of the review (Kranke 2015).
We would like to thank Andrew Smith (content editor), Vibeke E Horstmann (statistical editor), Marc Gentili,Tim R McCormick (peer reviewers), Janet Wale (consumer editor) for their help and editorial advice during the preparation of the updated systematic review.
We would like to thank Elisabeth Friedrich‐Würstlein (University library, Wuerzburg) for her assistance during the literature search and organizing full texts of the relevant publications.
We thank Bita Mesgarpour for translation and data abstraction of the included Persian study (Ismail 2008); and Taru Jokinen for helping with the translation of Spanish articles during the search process.
We thank Wolfgang Viechtbauer, author of the R metafor package, for advice on multivariate meta‐analytic methods for independent tau2 estimation in subgroups.
We would like to explicitly thank Laurence Weinberg for the willingness to answer all of our open questions on his manuscript patiently until the end (Weinberg 2016). He was the only author that showed this commitment.
We would like to thank Johanna Jokinen for her contribution to the original review (Kranke 2015).
Version history
| Published | Title | Stage | Authors | Version |
| 2018 Jun 04 | Continuous intravenous perioperative lidocaine infusion for postoperative pain and recovery in adults | Review | Stephanie Weibel, Yvonne Jelting, Nathan L Pace, Antonia Helf, Leopold HJ Eberhart, Klaus Hahnenkamp, Markus W Hollmann, Daniel M Poepping, Alexander Schnabel, Peter Kranke | |
| 2015 Jul 16 | Continuous intravenous perioperative lidocaine infusion for postoperative pain and recovery | Review | Peter Kranke, Johanna Jokinen, Nathan Leon Pace, Alexander Schnabel, Markus W Hollmann, Klaus Hahnenkamp, Leopold HJ Eberhart, Daniel M Poepping, Stephanie Weibel | |
| 2012 Feb 15 | Continuous intravenous perioperative lidocaine infusion for postoperative pain and recovery | Protocol | Christian Selig, Alexander Schnabel, Markus W. Hollmann, Klaus Hahnenkamp, Leopold H. J. Eberhart, Daniel Poepping, Niklas Hahn, Nathan Leon Pace, Peter Kranke | |
Differences between protocol and review
Changes to the authors of the review since publication of the protocol (Selig 2012)
In 2015 (Kranke 2015)
-
Two authors (C Selig and N Hahn) were no longer involved with the review and were removed from the list of authors.
-
Two new authors (J Jokinen and S Weibel) were added to the authors list and contributed to the review, as described in the Contributions of authors section.
For the current update:
-
Peter Kranke moved from first to last author (contact author). Stephanie Weibel became the new first author.
-
Johanna Jokinen left the review team.
-
Yvonne Jelting and Antonia Helf were newly added.
Differences in the methods used between the protocol (Selig 2012), and the review (Kranke 2015)
-
Criteria for considering studies for this review: we added the following to the review 'The IV lidocaine infusion, must have been started intraoperatively (with or without an IV bolus) prior to incision and continued until the end of surgery.' In the protocol we only described 'to have been continued postoperatively'.
-
At the protocol stage we planned to include quasi‐RCTs if it were found that few RCTs were available for meta‐analysis. However, in the review we did not include quasi‐RCTs due to the large number of available RCTs, which present the best available evidence, regarding the topic of interest.
-
We did not pre‐specify in the protocol for this review at which time periods the relevant outcomes of this review should be analysed. Based on pharmacodynamic and pharmacokinetic considerations and the logic in many included trials in which the postoperative observation period was divided into at least two distinct time intervals, we decided to subdivide outcome reporting for pain, postoperative opioid consumption, nausea and vomiting, etc. into different postoperative time points (e.g. 'early' and 'late'/'overall') to cover most of the reported data adequately.
-
In the protocol we planned to include pain data reported on VAS 0 to 100 mm scale. Due to the large proportion of data reported on other scales, we decided to include all pain data presented on a VAS 0 to 100 mm scale, NRS 0 to 10 and VRS 0 to 10 (0 = no pain, 10 = worst pain), and VAS 0 to 10 cm.
-
We broadened the outcome 'time to first bowel sounds' and included data on 'time to first bowel movement'.
-
The outcomes 'intraoperative and postoperative opioid requirements' were not previously considered in the published protocol. However, after intensive study of the relevant published trials dealing with perioperative lidocaine infusion for reduction of postoperative pain, we recognized that this outcome was widely analysed within the studies and we believe that opioid consumption is another relevant outcome to understand the effect of lidocaine in the perioperative setting since it may also affect the postoperative recovery and occurrence of side effects, e.g. ileus, nausea or vomiting.
-
Measurement of treatment effects: in the protocol we planned for data on pain scores, neuropsychological status or patient satisfaction that are reported on disparate scales, to calculate the standardized mean difference (SMD) obtained from the MD and SD. In the published review we combined, for the outcome 'pain', all data presented on either VAS 0 to 10 cm scale, VAS 0 to 100 mm, NRS 0 to 10, or VRS 0 to 10 (0 = no pain, 10 = worst pain) and transformed the first three into VAS 0 to 10 cm and presented the effect estimates as MD.
-
Dealing with missing data: in the protocol we planned to perform complete‐case analyses if there were exclusions/dropouts in the study flow. We intended to perform sensitivity analyses by inputting missing data (best case and worst case) in instances of more than trivial missing data. To the review we added the following statement which explains the handling of missing data which are obviously not crucial for the overall estimation of the treatment effect: 'If data were missing due to random events and the impact of missing data was considered marginal, we included data in the analysis only on those participants whose results were known. Studies with incomplete reporting of their study flow or disputable exclusions were subsequently excluded in a sensitivity meta‐analysis to assess bias. The potential impact of the missing data on the results was considered in the interpretation of the results of the review.'
-
In the protocol we did not pre‐specify that we will include median values and IQR. However, during data extraction we recognized that the data in large part were reported as median and IQR. Since we wanted to include as much data as possible, we calculated in the review the mean and SD from median and IQR in accordance with Higgins 2011. To assess the impact of the median data on the summary statistics, we performed a sensitivity analysis.
-
Assessment of heterogeneity: in the protocol we planned to perform meta‐regressions to explain heterogeneity. In the present review, we did not perform these calculations.
-
'Summary of findings' table: at the protocol stage we planned to present results on pain scores and gastrointestinal recovery within 'Summary of findings' tables. We decided post‐analysis to additionally present nausea as an outcome of public interest. We presented further the results of the different surgical subgroups (open abdominal, laparoscopic abdominal, and other surgeries) for the outcome 'pain (early)' to reflect the specific benefit for abdominal surgery patients.
-
Sensitivity analysis: in the protocol we planned to perform a sensitivity analysis using the inverse variance weighted fixed‐effect model. Due to the large heterogeneity observed between the studies the random‐effects model fits much better than the fixed‐effect model. Therefore, we did not perform this sensitivity analysis.
-
Sensitivity analysis: we analysed the impact of data reported as median and IQR on the overall effect estimation to each outcome to judge the robustness of the summary statistics.
-
Sensitivity analysis: we planned in the protocol to perform a sensitivity analysis including only low risk of bias studies to test the robustness of the summary statistics. Since only few studies received an overall low risk classification, we reconsidered that point in the review and proceeded to exclude the high risk of bias studies to judge the robustness of the summary statistics.
Differences in the methods used between the published review (Kranke 2015), and the updated review
-
We have changed the title from 'Continuous intravenous perioperative lidocaine infusion for postoperative pain and recovery' to 'Continuous intravenous perioperative lidocaine infusion for postoperative pain and recovery in adults' to reflect the focus on the adult population.
-
We have made changes to the list of primary outcomes: due to the high priority of adverse effects in the investigation of medical interventions, we moved the outcome 'adverse events' from secondary to primary outcomes.
-
We separated the outcome 'time to first bowel movement/sounds' into 'time to first bowel movement' and 'time to first bowel sounds'. We combined the outcomes 'time to first defaecation' and 'time to first bowel movement' into one outcome named as 'time to first defaecation/bowel movement' since both outcomes measure the same clinical condition.
-
We have made changes to the 'Summary of findings' table (GRADE‐relevant outcomes). We have reduced the number of 'Summary of findings' tables to one per comparison and created the following outcome categories: pain (early, intermediate, and late time points), gastrointestinal recovery (postoperative ileus, time to first defaecation/bowel movement), adverse events, postoperative nausea (overall), postoperative opioid consumption (overall). The outcomes 'time to first bowel sound', 'time to first flatus', and 'postoperative nausea (early)' are no longer GRADE‐relevant outcomes.
-
We performed meta‐analyses for the following new outcomes due to availability of more than three studies: length of hospital stay (outpatient surgery, mins), surgical complications (anastomotic leak), surgical complications (bleeding), patient satisfaction, and intraoperative remifentanil consumption.
-
We omitted studies with suspected small variance reporting for the outcomes: pain, gastrointestinal recovery, and opioid consumption.
-
Assessment of risk of other bias: we no longer assessed a lack of sample size calculation in trials as high risk of other bias.
-
In contrast to the original review, we calculated the SMD as summary statistics for all pain outcomes since several different scales were used in the individual trials. The use of SMD as summary statistics was originally described in the protocol.
-
We changed 'dealing with missing data' to the method described in the original protocol.
-
We introduced the 95% prediction interval (PI) to understand the uncertainty associated with an intervention about whether an intervention works or not in the light of between‐study heterogeneity.
-
We used the Mantel‐Haenszel method for RRs instead of inverse variance weighting.
-
We have changed the 'Summary of findings' table with respect to presented outcomes (we removed subgroups for pain 'early' and added adverse events plus postoperative opioid consumption 'overall') and to the approach for assessing inconsistency and imprecision (see 95% PI).
-
Sensitivity analysis (fixed‐effect model): as described in the protocol, we included in the current update sensitivity analyses using the fixed‐effect model.
-
Sensitivity analysis (risk of bias): as in the protocol described, we performed in the current update sensitivity analyses, including only low risk of bias studies to test the robustness of the summary statistics.
-
Sensitivity analysis (suspected variance reporting): we added studies with suspected variance reporting to the meta‐analyses of relevant outcomes to explore the impact on the effect estimates in sensitivity meta‐analyses.
Keywords
MeSH
Medical Subject Headings (MeSH) Keywords
- Analgesia, Epidural;
- Analgesics, Opioid [therapeutic use];
- Anesthetics, Intravenous [*administration & dosage, adverse effects];
- Anesthetics, Local [*administration & dosage, adverse effects];
- Ileus [epidemiology];
- Lidocaine [*administration & dosage, adverse effects];
- Nausea [epidemiology];
- Pain Measurement;
- Pain, Postoperative [*drug therapy];
- Postoperative Complications [epidemiology];
- Randomized Controlled Trials as Topic;
- Recovery of Function;
Medical Subject Headings Check Words
Humans;
PICO

Study flow diagram.

Risk of bias summary: review authors' judgements about each risk of bias item for each included study.

Risk of bias graph: review authors' judgements about each risk of bias item presented as percentages across all included studies.

Comparison 1 Intravenous (IV) lidocaine versus placebo, Outcome 1 Pain score at rest, 'early time points' (1 h to 4 h, PACU).

Comparison 1 Intravenous (IV) lidocaine versus placebo, Outcome 2 Pain score at rest, 'intermediate time points' (24 h).

Comparison 1 Intravenous (IV) lidocaine versus placebo, Outcome 3 Pain score at rest, 'late time points' (48 h).
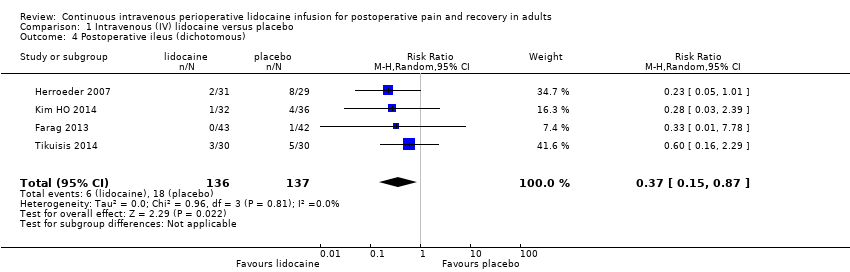
Comparison 1 Intravenous (IV) lidocaine versus placebo, Outcome 4 Postoperative ileus (dichotomous).

Comparison 1 Intravenous (IV) lidocaine versus placebo, Outcome 5 Time to first defaecation/bowel movement (h).

Comparison 1 Intravenous (IV) lidocaine versus placebo, Outcome 6 Time to first flatus (h).

Comparison 1 Intravenous (IV) lidocaine versus placebo, Outcome 7 Time to first bowel sounds (h).

Comparison 1 Intravenous (IV) lidocaine versus placebo, Outcome 8 Length of hospital stay (days).

Comparison 1 Intravenous (IV) lidocaine versus placebo, Outcome 9 Length of hospital stay (outpatient surgery, mins).

Comparison 1 Intravenous (IV) lidocaine versus placebo, Outcome 10 Surgical complications ‐ anastomotic leak.

Comparison 1 Intravenous (IV) lidocaine versus placebo, Outcome 11 Surgical complications ‐ bleeding.

Comparison 1 Intravenous (IV) lidocaine versus placebo, Outcome 12 Surgical complications ‐ postoperative infection.
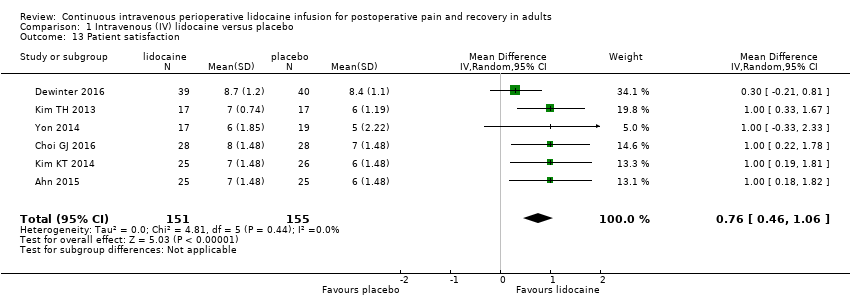
Comparison 1 Intravenous (IV) lidocaine versus placebo, Outcome 13 Patient satisfaction.

Comparison 1 Intravenous (IV) lidocaine versus placebo, Outcome 14 Postoperative nausea, 'early time points' (PACU).

Comparison 1 Intravenous (IV) lidocaine versus placebo, Outcome 15 Postoperative nausea, 'overall' (0 to 24 h, to 48 h, to 72 h).

Comparison 1 Intravenous (IV) lidocaine versus placebo, Outcome 16 Postoperative vomiting, 'early time points' (PACU).
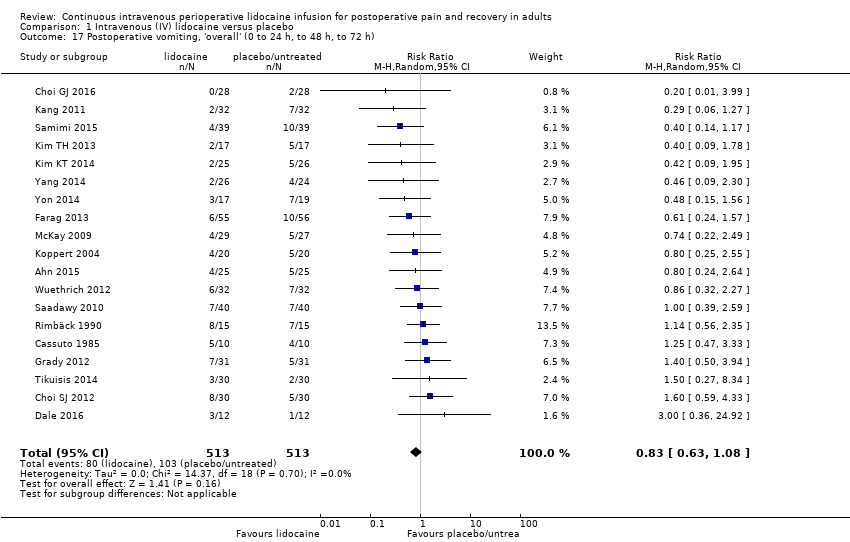
Comparison 1 Intravenous (IV) lidocaine versus placebo, Outcome 17 Postoperative vomiting, 'overall' (0 to 24 h, to 48 h, to 72 h).

Comparison 1 Intravenous (IV) lidocaine versus placebo, Outcome 18 Intraoperative opioid consumption (MEQ, mg).

Comparison 1 Intravenous (IV) lidocaine versus placebo, Outcome 19 Intraoperative remifentanil consumption (µg).

Comparison 1 Intravenous (IV) lidocaine versus placebo, Outcome 20 Postoperative opioid consumption, PACU (MEQ, mg).
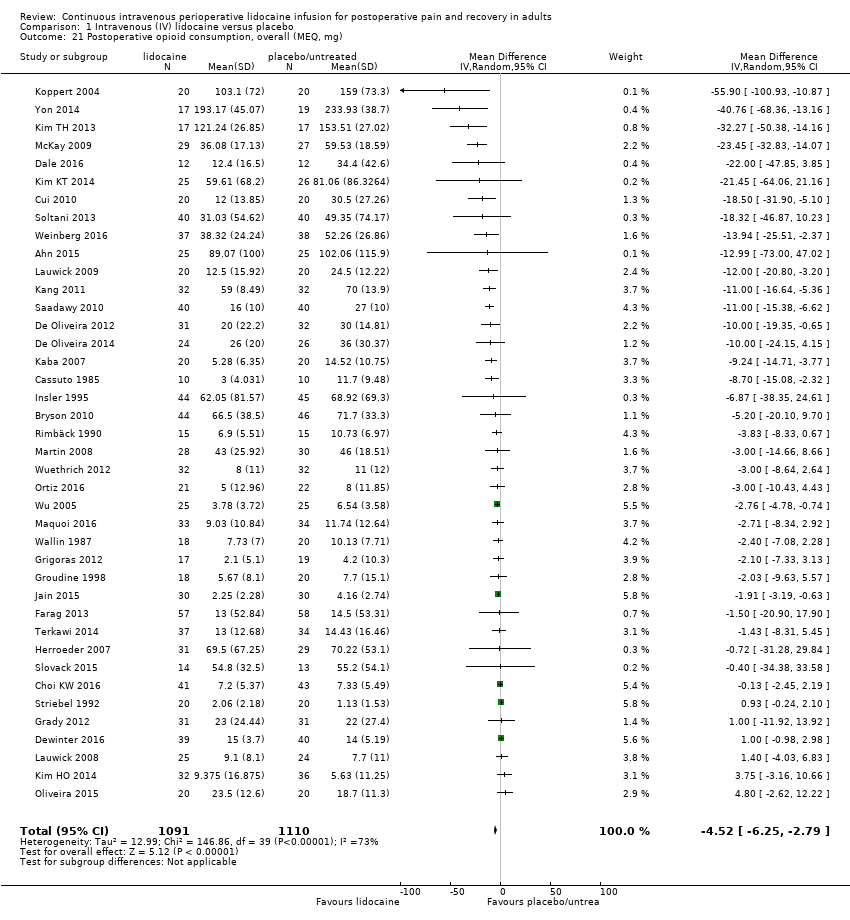
Comparison 1 Intravenous (IV) lidocaine versus placebo, Outcome 21 Postoperative opioid consumption, overall (MEQ, mg).
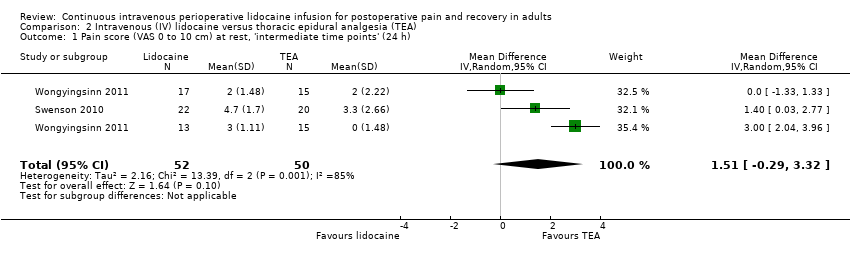
Comparison 2 Intravenous (IV) lidocaine versus thoracic epidural analgesia (TEA), Outcome 1 Pain score (VAS 0 to 10 cm) at rest, 'intermediate time points' (24 h).

Comparison 2 Intravenous (IV) lidocaine versus thoracic epidural analgesia (TEA), Outcome 2 Pain score (VAS 0 to 10 cm) at rest, 'late time points' (48 h).

Comparison 2 Intravenous (IV) lidocaine versus thoracic epidural analgesia (TEA), Outcome 3 Time to first bowel movement (h).
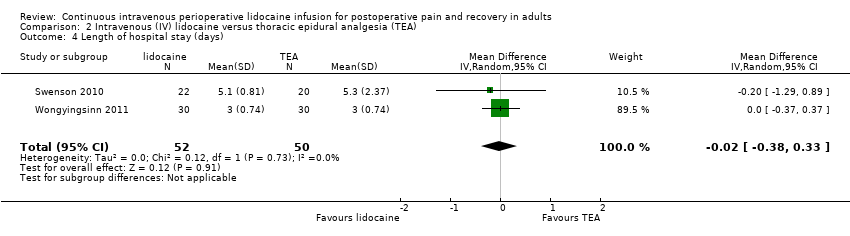
Comparison 2 Intravenous (IV) lidocaine versus thoracic epidural analgesia (TEA), Outcome 4 Length of hospital stay (days).

Comparison 2 Intravenous (IV) lidocaine versus thoracic epidural analgesia (TEA), Outcome 5 Intraoperative opioid consumption (MEQ, mg).
| IV Lidocaine compared to placebo or no treatment in patients undergoing any elective or urgent surgical procedure under general anaesthesia | |||||||
| Patient or population: adult patients undergoing any elective or urgent surgical procedure under general anaesthesia | |||||||
| Outcomes | Illustrative comparative risks* (95% CI) | Relative effect (95% CI) | Prediction interval | No. of Participants | Quality of the evidence | Comments | |
| Assumed risk with placebo or no treatment | Corresponding risk with IV lidocaine | ||||||
| 1. Pain (VAS 0 to 10 cm, 0 to 100 mm, NRS 0 to 10) | Pain score at rest, 'early time points' (1 hto 4 hpostoperatively, or in the PACU) | ‐ | (1.61 lower to 0.62 higher) | 1656 | ⊕⊝⊝⊝ | A SMD of 0.50 fewer is equivalent to a range of 0.37 cm fewer (SD = 0.74 cm) to 2.48 cm fewer (SD = 4.95 cm) on a VAS 0 to 10 cm scale in the intervention group. The range of mean effects that can be expected in a future study (95% PI) includes both benefit and harmk. | |
| The standardized mean pain score in the intervention group was 0.50 lower (0.72 lower to 0.28 lower) | |||||||
| Pain score at rest, 'intermediate time points' (24 hpostoperatively) | ‐ | (0.44 lower to 0.16 higher) | 1847 | ⊕⊕⊕⊝ | A SMD of 0.14 fewer is equivalent to a range of 0.10 cm fewer (SD = 0.74 cm) to 0.48 cm fewer (SD = 3.42 cm) on a VAS 0 to 10 cm scale in the intervention group. The range of mean effects that can be expected in a future study (95% PI) is clinically not relevantk. | ||
| The standardized mean pain score in the intervention group was 0.14 lower (0.25 lower to 0.04 lower) | |||||||
| Pain score at rest, 'late time points' (48 hpostoperatively) | ‐ | (0.60 lower to 0.38 higher) | 1404 | ⊕⊕⊕⊝ | A SMD of 0.11 fewer is equivalent to a range of 0.08 cm fewer (SD = 0.7 cm) to 0.42 cm fewer (SD = 3.8 cm) on a VAS 0 to 10 cm scale in the intervention group. The range of mean effects that can be expected in a future study (95% PI) is clinically not relevantk. | ||
| The standardized mean pain score in the intervention group was 0.11 lower (0.25 lower to 0.04 higher) | |||||||
| 2. Gastrointestinal recovery | Postoperative ileus (dichotomous) The number of participants with postoperative ileus | RR 0.37 (0.15 to 0.87) | (0.05 lower to 2.43 higher) | 273 | ⊕⊝⊝⊝ | The range of mean effects that can be expected in a future study (95% PI) includes both benefit and harm. | |
| 131 per 1000 | 48 per 1000 (20 to 114) | ||||||
| Time to first defaecation/bowel movement (h) | ‐ | (22.19 h shorter to 6.36 h longer) | 684 | ⊕⊝⊝⊝ | The range of mean effects that can be expected in a future study (95% PI) includes both benefit and clinical non‐relevance. | ||
| The mean time to first defaecation/bowel movement in the control group ranged from 24 h to 94 h | The mean time to first defaecation/bowel movement in the intervention group was 7.92 h shorter (12.71 h shorter to 3.13 h shorter) | ||||||
| 3. Adverse events (e.g. the number of participants that died, or had arrhythmias, other heart rate disorders, or showed any signs of lidocaine toxicity) | See comment | See comment | ‐ | ‐ | See comment | ⊕⊝⊝⊝ | Adverse events that were investigated in a few trials are death, arrhythmia, light‐headedness, perioral numbness, and dizziness. The effect of lidocaine on these adverse effects is uncertain. |
| 4. Postoperative nausea, 'overall' (0 to 24 h, to 48 h, to 72 h) | 350 per 1000 | 273 per 1000 (235 to 319) | RR 0.78 (0.67 to 0.91) | (0.49 lower to 1.23 higher) | 1903 | ⊕⊝⊝⊝ | The range of mean effects that can be expected in a future study (95% PI) includes both benefit and clinical non‐relevance. |
| 5. Postoperative opioid consumption, 'overall' (MEQ, mg) | The mean postoperative opioid consumption in the control group ranged from 1.13 mg to 233.93 mg | The mean postoperative opioid consumption in the intervention group was 4.52 mg lower (6.25 mg lower to 2.79 mg lower) | ‐ | (12.03 mg lower to 3.00 mg higher) | 2201 (40 RCTs) | ⊕⊝⊝⊝ | The range of mean effects that can be expected in a future study (95% PI) includes both benefit and clinical non‐relevance. |
| *The risk in the intervention group (and its 95% CI) is based on the assumed risk in the comparison group and the relative effect of the intervention (and its 95% CI). CI: confidence interval; MD: mean difference; MEQ: morphine equivalents; NRS: numeric rating scale; PACU: postanaesthesia care unit; RCT: randomized controlled trial; RR: risk ratio; SMD: standardized mean difference; SD: standard deviation; VAS: visual analogue scale | |||||||
| GRADE Working Group grades of evidence | |||||||
| aDowngrading for study limitations: substantial information is derived from studies at high or unclear risk of bias (selection bias, blinding, attrition bias). Exclusion of high and unclear risk of bias studies affected the robustness of the estimated effect. bDowngrading for inconsistency: the 95% PI is significantly wider than the 95% CI (we assume between‐study heterogeneity). cDowngrading for imprecision: we downgraded for imprecision due to the fact that the 95% PI crosses the line of identity in contrast to the 95% CI. dPublication bias: test for publication bias suggested funnel plot asymmetry and trim and fill analysis changed the conclusion. We did not downgrade for publication bias since we have already downgraded for inconsistency (true heterogeneity may be a source of funnel plot asymmetry). eStudy limitations: substantial information is derived from studies at high or unclear risk of bias (selection bias, blinding, attrition bias). However, exclusion of high and unclear risk of bias studies did not affect the robustness of the estimated effect (95% CI: clinical non‐relevant range of effects). fInconsistency: the 95% PI is wider than the 95% CI (we assume between‐study heterogeneity), but the range of effects lie in areas of clinical non‐relevance. Therefore, we did not downgrade for inconsistency. gImprecision: we did not downgrade for imprecision since the 95% PI and the 95% CI around the effect size are narrow (precise result with no clinical relevance). hPublication bias: test for publication bias suggested funnel plot asymmetry but trim and fill analysis did not change the conclusion (95% CI: clinical non‐relevant range of effects). iDowngrading for study limitations and publication bias: we downgraded by one level for the combination of study limitations and funnel plot asymmetry, because of the uncertain risk of bias domains for over half of the studies and the evidence for publication bias shown by funnel plot asymmetry. jThere are few trials investigating adverse events with a great heterogeneity in the investigated adverse events and with a lack of systematic assessment and reporting of adverse events which limits quality of evidence. Data of adverse events were not pooled in any meta‐analysis. Downgrading for inconsistency, imprecision, and study quality. kClinical relevance is assumed if the minimally important difference on the 0 to 10 cm pain scale is approximately 1 cm. | |||||||
| IV lidocaine compared to TEA in adult patients undergoing any elective or urgent surgical procedure under general anaesthesia | |||||||
| Patient or population: adult patients undergoing any elective or urgent surgical procedure under general anaesthesia | |||||||
| Outcomes | Illustrative comparative risks* (95% CI) | Relative effect (95% CI) | Prediction interval | No. of Participants | Quality of the evidence | Comments | |
| Assumed risk with placebo or no treatment | Corresponding risk with IV lidocaine | ||||||
| 1. Pain (VAS 0 to 10 cm, 0 to 100 mm, NRS 0 to 10 | Pain score at rest, 'early time points' (1 hto 4 hpostoperatively, or in the PACU) | ‐ | ‐ | (0 RCTs) | ‐ | No trial assessed this outcome. | |
| See comment | See comment | ||||||
| Pain score at rest, 'intermediate time points' (24 hpostoperatively) (VAS 0 to 10 cm) | ‐ | Not estimable* | 102 | ⊕⊝⊝⊝ | The estimated effect (95% CI) includes both benefit and harmg. | ||
| The mean pain score 'intermediate time points' ranged across control groups from 0 to 3.3 cm | The mean pain score 'intermediate time points' in the intervention group was 1.51 cm higher (0.29 lower to 3.32 higher) | ||||||
| Pain score at rest 'late time points' (48 hpostoperatively) (VAS 0 to 10 cm) | ‐ | Not estimable* | 102 | ⊕⊝⊝⊝ | The estimated effect (95% CI) includes both benefit and harmg. | ||
| The mean pain score 'late time points' ranged across control groups from 0 to 2.7 cm | The mean pain score 'late time points' in the intervention group was 0.98 cm higher (1.19 lower to 3.16 higher) | ||||||
| 2. Gastrointestinal recovery | Postoperative ileus (dichotomous) The number of participants with postoperative ileus | Not estimable | Not estimable* | 60 (1 RCT) | ⊕⊝⊝⊝ | Only one small trial assessed this outcome. | |
| Two out of 30 participants in the control group and one out of 30 in the lidocaine group had postoperative ileus | |||||||
| Time to bowel movements (h) | ‐ | Not estimable* | 102 | ⊕⊝⊝⊝ | The estimated effect (95% CI) includes both benefit and harm. | ||
| The mean time to first bowel movements (h) ranged across control groups from 39 h to 72 h | The mean time to first bowel movements (h) in the intervention group was 1.66 h shorter (10.88 shorter to 7.56 longer) | ||||||
| 3. Adverse events (e.g. the number of participants that died, or had arrhythmias, other heart rate disorders, or showed any signs of lidocaine toxicity) | See comment | See comment | ‐ | ‐ | See comment | ⊕⊝⊝⊝ | All adverse events that are reported in the individual studies were listed in Table 12. |
| 4. Postoperative nausea, 'overall' (0 to 24 h, to 48 h, to 72 h) | 17 out of 30 participants in the control group and 11 out of 30 in the lidocaine group had nausea | Not estimable | Not estimable* | 60 (1 RCT) | ⊕⊝⊝⊝ | Only one small trial assessed this outcome. | |
| 5. Postoperative opioid consumption, 'overall' (MEQ, mg) | See comment | See comment | ‐ | ‐ | (0 RCTs) | ‐ | No trial assessed this outcome. |
| *The risk in the intervention group (and its 95% CI) is based on the assumed risk in the comparison group and the relative effect of the intervention (and its 95% CI). CI: confidence interval; MEQ: morphine equivalents; NRS: numeric rating scale; PACU: postanaesthesia care unit; RCT: randomized controlled trial; VAS: visual analogue scale | |||||||
| GRADE Working Group grades of evidence | |||||||
| * The estimate of the PI is imprecise when based on only a few studies with small sample size (IntHout 2016). In this case, we did not provide the 95% PI. aDowngrading for study limitations: substantial information is derived from studies at high or unclear risk of bias (selection bias, blinding, attrition bias). Exclusion of high and unclear risk of bias studies affected the robustness of the estimated effect. bDowngrading for inconsistency: between‐study heterogeneity was high for this outcome. cDowngrading for imprecision: we downgraded for imprecision due to the fact that the 95% CI around the effect size was large. dDowngrading for imprecision: we double‐downgraded for imprecision since information is derived from only one small trial. eDowngrading for imprecision: we double‐downgraded for imprecision since the 95% CI around the effect size was large, including benefit and harm. There is a high uncertainty associated with this effect estimate. fThere is great heterogeneity in the investigated adverse events in the individual trials with a lack of systematic assessment and reporting of adverse events which limits quality of evidence. gClinical relevance is assumed if the minimally important difference on the 0 to 10 cm pain scale is approximately 1 cm. | |||||||
| All studies | Without high/unclear risk of bias studies (incomplete outcome data) | ||||
| Outcome | Statistical method | Studies | Effect estimate | Studies | Effect estimate |
| Pain score, rest, 'early time points' (1 hr to 4 hrs, PACU) | SMD (IV, Random, 95% CI) | 29 | −0.50 (−0.72 to −0.28) | 17 | −0.45 (−0.77 to −0.14) |
| Pain score, rest, 'intermediate time points' (24 hrs) | SMD (IV, Random, 95% CI) | 33 | −0.14 (−0.25 to −0.04) | 18 | −0.12 (−0.26 to 0.01) |
| Pain score, rest, 'late time points' (48 hrs) | SMD (IV, Random, 95% CI) | 24 | −0.11 (−0.25 to 0.04) | 11 | −0.06 (−0.27 to 0.15) |
| Postoperative ileus (dichotomous) | RR (MH, Random, 95% CI) | 4 | 0.37 (0.15 to 0.87) | 4 | 0.37 (0.15 to 0.87) |
| Time to first defaecation/bowel movement (hrs) | MD (IV, Random, 95% CI) | 12 | −7.92 (−12.71 to −3.13) | 8 | −7.5 (−14.38 to −0.63) |
| Time to first flatus (hrs) | MD (IV, Random, 95% CI) | 13 | −4.09 (−6.30 to −1.87) | 9 | −3.98 (−7.03 to −0.93) |
| Time to first bowel sounds (hrs) | MD (IV, Random, 95% CI) | 2 | −6.08 (−13.77 to 1.60) | 2 | −6.08 (−13.77 to 1.60) |
| Length of hospital stay (days) | MD (IV, Random, 95% CI) | 32 | −0.37 (−0.60 to −0.15) | 17 | −0.23 (−0.49 to 0.02) |
| Length of hospital stay (outpatient surgery, mins) | MD (IV, Random, 95% CI) | 3 | −10.81 (−36.93 to 15.31) | 3 | −10.81 (−36.93 to 15.31) |
| Surgical complications ‐ anastomotic leak | RR (MH, Random, 95% CI) | 3 | 0.61 (0.08 to 4.80) | 3 | 0.61 (0.08 to 4.80) |
| Surgical complications ‐ bleeding | RR (MH, Random, 95% CI) | 3 | 1.79 (0.41 to 7.89) | 3 | 1.79 (0.41 to 7.89) |
| Surgical complications ‐ postoperative infection | RR (MH, Random, 95% CI) | 5 | 1.64 (0.41 to 6.52) | 4 | 1.19 (0.25 to 5.67) |
| Patient satisfaction | MD (IV, Random, 95% CI) | 6 | 0.76 (0.46 to 1.06) | 2 | 0.59 (−0.09 to 1.26) |
| Postoperative nausea, early (PACU) | RR (MH, Random, 95% CI) | 8 | 0.72 (0.53 to 0.98) | 7 | 0.66 (0.47 to 0.91) |
| Postoperative nausea, overall (0 to 24 hrs, to 48 hrs, to 72 hrs) | RR (MH, Random, 95% CI) | 35 | 0.78 (0.67 to 0.91) | 19 | 0.87 (0.72 to 1.06) |
| Postoperative vomiting, early (PACU) | RR (MH, Random, 95% CI) | 4 | 0.49 (0.16 to 1.48) | 3 | 0.75 (0.15 to 3.80) |
| Postoperative vomiting, overall (0 to 24 hrs, to 48 hrs, to 72 hrs) | RR (MH, Random, 95% CI) | 19 | 0.83 (0.63 to 1.08) | 7 | 0.88 (0.58 to 1.31) |
| Intraoperative opioid consumption (MEQ, mg) | MD (IV, Random, 95% CI) | 18 | −2.14 (−3.87 to −0.40) | 10 | −1.52 (−4.13 to 1.09) |
| Intraoperative opioid consumption with remifentanil (MEQ, mg) | MD (IV, Random, 95% CI) | 6 | −14.17 (−35.27 to 6.92) | 5 | −16.08 (−41.41 to 9.25) |
| Postoperative opioid consumption, PACU (MEQ, mg) | MD (IV, Random, 95% CI) | 21 | −3.10 (−3.87 to −2.32) | 12 | −2.59 (−3.76 to −1.42) |
| Postoperative opioid consumption, overall (MEQ, mg) | MD (IV, Random, 95% CI) | 40 | −4.52 (−6.25 to −2.79) | 25 | −2.84 (−4.45 to −1.22) |
| Acronyms and abbreviations used in the table: CI = confidence interval, hrs = hours, IV = inverse variance, MD = mean difference, MEQ = morphine equivalent dose, mins = minutes, MH = Mantel Haenszel, PACU = post anaesthesia care unit, RR = risk ratio, SMD = standardized mean difference | |||||
| Mean + SD and median + IQR values | Only mean + SD values | ||||
| Outcome | Statistical method | Studies | Effect estimate | Studies | Effect estimate |
| Pain score , rest, 'early time points' (1 hr to 4 hrs, PACU) | SMD (IV, Random, 95% CI) | 29 | −0.50 (−0.72 to −0.28) | 23 | −0.64 (−0.89 to −0.38) |
| Pain score , rest, 'intermediate time points' (24 hrs) | SMD (IV, Random, 95% CI) | 33 | −0.14 (−0.25 to −0.04) | 27 | −0.16 (−0.29 to −0.04) |
| Pain score , rest, 'late time points' (48 hrs) | SMD (IV, Random, 95% CI) | 24 | −0.11 (−0.25 to 0.04) | 20 | −0.12 (−0.29 to 0.04) |
| Time to first defaecation/bowel movement (hrs) | MD (IV, Random, 95% CI) | 12 | −7.92 (−12.71 to −3.13) | 7 | −6.03 (−10.98 to −1.08) |
| Time to first flatus (hrs) | MD (IV, Random, 95% CI) | 13 | −4.09 (−6.30 to −1.87) | 10 | −4.40 (−6.30 to −2.50) |
| Time to first bowel sounds (hrs) | MD (IV, Random, 95% CI) | 2 | −6.08 (−13.77 to 1.60) | 2 | −6.08 (−13.77 to 1.60) |
| Length of hospital stay (days) | MD (IV, Random, 95% CI) | 32 | −0.37 (−0.60 to −0.15) | 16 | −0.32 (−0.54 to −0.10) |
| Length of hospital stay (outpatient surgery, mins) | MD (IV, Random, 95% CI) | 3 | −10.81 (−36.93 to 15.31) | 0 | Not estimable |
| Patient satisfaction | MD (IV, Random, 95% CI) | 6 | 0.76 (0.46 to 1.06) | 1 | 0.30 (−0.21 to 0.81) |
| Intraoperative opioid consumption (MEQ, mg) | MD (IV, Random, 95% CI) | 18 | −2.14 (−3.87 to −0.40) | 13 | −2.32 (−4.33 to −0.32) |
| Intraoperative opioid consumption with remifentanil (MEQ, mg) | MD (IV, Random, 95% CI) | 6 | −14.17 (−35.27 to 6.92) | 4 | −20.45 (−52.10 to 11.19) |
| Postoperative opioid consumption, PACU (MEQ, mg) | MD (IV, Random, 95% CI) | 21 | −3.10 (−3.87 to −2.32) | 15 | −2.88 (−3.80 to −1.96) |
| Postoperative opioid consumption, overall (MEQ, mg) | MD (IV, Random, 95% CI) | 40 | −4.52 (−6.25 to −2.79) | 28 | −4.64 (−6.72 to −2.56) |
| Acronyms and abbreviations used in this table: CI = confidence interval, hrs = hours, IQR = interquartile range, IV = inverse variance, MD = mean difference, MEQ = morphine equivalent dose, mins = minutes, PACU = post anaesthesia care unit, SD = standard deviation, SMD = standardized mean difference | |||||
| Main meta‐analyses | Open abdominal surgery | Laparoscopic surgery | Other surgery | Test for subgroup difference (P) | |||
| Outcome | n | Effect estimate (I2) | n | Effect estimate (I2) | n | Effect estimate (I2) | |
| Pain score, rest, 'early time points' (1 hr to 4 hrs, PACU) | 8 | −0.54 (−0.82 to −0.26) (51%) | 10 | −0.78 (−1.34 to −0.21) (89%) | 11 | −0.21 (−0.44 to 0.02) (56%) | 0.07 |
| Pain score, rest, 'intermediate time points' (24 hrs) | No subgroup analysis performed (I2 < 30%) | ||||||
| Pain score, rest, 'late time points' (48 hrs) | 7 | 0.03 (−0.17 to 0.23) (0%) | 7 | −0.30 (−0.74 to 0.13) (74%) | 10 | −0.10 (−0.27 to 0.08) (20%) | 0.35 |
| Postoperative ileus (dichotomous) | No subgroup analysis performed (I2 < 30%) | ||||||
| Time to first defaecation/bowel movement (hrs) | 6 | −7.09 (−10.33 to −3.86) (0%) | 5 | −6.23 (−18.07 to 5.62) (85%) | 1 | −6.10 (−24.49 to 12.29) NE | 0.41 |
| Time to first flatus (hrs) | 6 | −4.49 (−7.38 to −1.60) (6%) | 5 | −3.07 (−8.28 to 2.15) (78%) | 2 | −2.15 (−3.56 to −0.74) (0%) | 0.36 |
| Time to first bowel sounds (hrs) | 1 | −10.00 (−17.13 to −2.87) NE | 1 | −2.16 (−9.30 to 4.98) NE | 0 | NE | 0.13 |
| Length of hospital stay (days) | 6 | −0.59 (−0.99 to −0.18) (27%) | 12 | −0.15 (−0.58 to 0.28) (77%) | 14 | −0.48 (−0.84 to −0.11) (69%) | 0.32 |
| Length of hospital stay (outpatient surgery, mins) | 0 | NE | 3 | −10.81 (−36.93 to 15.31) | 0 | NE | NE |
| Surgical complications ‐ anastomotic leak | No subgroup analysis performed (I2 < 30%) | ||||||
| Surgical complications ‐ bleeding | No subgroup analysis performed (I2 < 30%) | ||||||
| Surgical complications ‐ postoperative infection | No subgroup analysis performed (I2 < 30%) | ||||||
| Patient satisfaction | No subgroup analysis performed (I2 < 30%) | ||||||
| Postoperative nausea, early (PACU) | No subgroup analysis performed (I2 < 30%) | ||||||
| Postoperative nausea, overall (0 to 24 hrs, to 48 hrs, to 72 hrs) | No subgroup analysis performed (I2 < 30%) | ||||||
| Postoperative vomiting, early (PACU) | No subgroup analysis performed (I2 < 30%) | ||||||
| Postoperative vomiting, overall (0 to 24 hrs, to 48 hrs, to 72 hrs) | No subgroup analysis performed (I2 < 30%) | ||||||
| Intraoperative opioid consumption (MEQ, mg) | 7 | −1.93 (‐4.61 to 0.75) (78%) | 3 | −0.71 (−7.95 to 6.53) (93%) | 8 | −2.03 (−4.14 to 0.07) (40%) | 0.94 |
| Intraoperative opioid consumption with remifentanil (MEQ, mg) | No subgroup analysis performed (I2 < 30%) | ||||||
| Postoperative opioid consumption, PACU (MEQ, mg) | 5 | −3.03 (−4.82 to −1.23) (0%) | 7 | −3.84 (−4.57 to −3.11) (0%) | 9 | −2.66 (−4.19 to −1.13) (61%) | 0.33 |
| Postoperative opioid consumption, overall (MEQ, mg) | 11 | −3.56 (−6.76 to −0.35) (40%) | 16 | −4.85 (−7.46 to −2.23) (77%) | 13 | −5.54 (−9.35 to −1.72) (77%) | 0.71 |
| Acronyms and abbrviations used in this table: hrs = hours, MEQ = morphine equivalent dose, mins = minutes, NE = not estimable, PACU =post anaesthesia care unit | |||||||
| Main meta‐analyses | < 2 mg/kg/hr until end of surgery to PACU | ≥ 2 mg/kg/hr until end of surgery to PACU | < 2 mg/kg/hr | ≥ 2 mg/kg/hr | Test for subgroup | ||||
| Outcome | n | Effect estimate (I2) | n | Effect estimate (I2) | n | Effect estimate (I2) | n | Effect estimate (I2) | |
| Pain score, rest, 'early time points' (1 hr to 4 hrs, PACU) | 8 | −0.36 (−0.70 to −0.02) (67%) | 21 | −0.54 (−0.82 to −0.27) (82%) | 0.42 | ||||
| Pain score, rest, 'intermediate time points' (24 hrs) | No subgroup analysis performed (I2 < 30%) | ||||||||
| Pain score, rest, 'late time points' (48 hrs) | 5 | −0.15 (−0.39 to 0.09) (0%) | 13 | −0.18 (−0.34 to −0.02) (12%) | 5 | 0.03 (−0.45 to 0.51) (78%) | 1 | 0.11 (−0.39 to 0.61) NE | 0.66 |
| Postoperative ileus (dichotomous) | No subgroup analysis performed (I2 < 30%) | ||||||||
| Time to first defaecation/bowel movement (hrs) | 4 | −7.06 (−11.37 to −2.75) (10%) | 3 | −7.27 (−13.54 to −1.00) (0%) | 4 | −6.97 (−20.09 to 6.16) (86%) | 1 | −20.00 (−50.62 to 10.62) NE | 0.62 |
| Time to first flatus (hrs) | 4 | −5.72 (−9.58 to −1.87) (28%) | 4 | −3.63 (−6.07 to −1.20) (64%) | 4 | −0.43 (−9.46 to 8.61) (84%) | 1 | −6.50 (−17.05 to 4.05) NE | 0.65 |
| Time to first bowel sounds (hrs) | 1 | −10.00 (−17.13 to −2.87) NE | 1 | −2.16 (−9.30 to 4.98) NE | 0 | NE | 0 | NE | 0.13 |
| Length of hospital stay (days) | 7 | −0.51 (−0.84 to −0.19) (2%) | 16 | −0.26 (‐0.50 to −0.03) (58%) | 7 | −0.25 (−1.04 to 0.54) (83%) | 2 | −1.29 (−4.47 to 1.89) (94%) | 0.59 |
| Length of hospital stay (outpatient surgery, mins) | 1 | −44.00 (−75.57 to −12.43) NE | 2 | −2.97 (−11.33 to 5.39) (0%) | 0 | NE | 0 | NE | 0.01 |
| Surgical complications ‐ anastomotic leak | No subgroup analysis performed (I2 < 30%) | ||||||||
| Surgical complications ‐ bleeding | No subgroup analysis performed (I2 < 30%) | ||||||||
| Surgical complications ‐ postoperative infection | No subgroup analysis performed (I2 < 30%) | ||||||||
| Patient satisfaction | No subgroup analysis performed (I2 < 30%) | ||||||||
| Postoperative nausea, early (PACU) | No subgroup analysis performed (I2 < 30%) | ||||||||
| Postoperative nausea, overall (0 to 24 hrs, to 48 hrs, to 72 hrs) | No subgroup analysis performed (I2 < 30%) | ||||||||
| Postoperative vomiting, early (PACU) | No subgroup analysis performed (I2 < 30%) | ||||||||
| Postoperative vomiting, overall (0 to 24 hrs, to 48 hrs, to 72 hrs) | No subgroup analysis performed (I2 < 30%) | ||||||||
| Intraoperative opioid consumption (MEQ, mg) | 7 | −0.68 (−3.51 to 2.15) (80%) | 11 | −3.11 (−5.74 to −0.47) (79%) | 0.22 | ||||
| Intraoperative opioid consumption with remifentanil (MEQ, mg) | No subgroup analysis performed (I2 < 30%) | ||||||||
| Postoperative opioid consumption, PACU (MEQ, mg) | 6 | −3.55 (−5.43 to −1.67) (63%) | 15 | −3.02 (−3.86 to −2.18) (30%) | 0.61 | ||||
| Postoperative opioid consumption, overall (MEQ, mg) | 8 | −2.33 (−5.05 to −0.13) (59%) | 21 | −7.41 (−10.91 to −3.91) (76%) | 8 | −2.88 (−6.25 to 0.49) (72%) | 3 | −3.90 (−10.18 to 2.38) (18%) | 0.14 |
| Acronyms and abbreviations used in this table: hrs = hours, MEQ = morphine equivalent dose, mins = minutes, NE = not estimable, PACU =post anaesthesia care unit | |||||||||
| Outcome | Meta‐regression model (random‐effects model, tau2 estimator: REML) | Open abdominal surgery | Laparoscopic surgery | Other surgery | Test of moderators (P) | Likelihood ratio test (P) | |||
| n | Effect estimate (tau2) | n | Effect estimate (tau2) | n | Effect estimate (tau2) | ||||
| Pain score, rest, 'early time points' (1 hr to 4 hrs, PACU) | Individual tau2 | 8 | −0.55 (−0.83 to −0.27) (0.08) | 10 | −0.78(−1.35 to −0.21) (0.76) | 11 | −0.21 to (−0.44 0.03) (0.09) | 0.07 | 0.017 |
| Pain score, rest, 'late time points' (48 hrs) | Individual tau2 | 7 | 0.03 (−0.17 to 0.23) (0.00) | 7 | −0.03 (−0.73 to 0.12) (0.24) | 10 | −0.10 (−0.27 to 0.08) (0.02) | 0.34 | 0.049 |
| Time to first defaecation/bowel movement (hrs) | Individual tau2 | 6 | −8.16 (−12.44 to −3.87) (5.94) | 5 | −6.22 (−18.42 to 5.98) (127.06) | 1 | −6.10 (−24.49 to 12.29) (0.00) | 0.94 | 0.097 |
| Time to first flatus (hrs) | Individual tau2 | 6 | −4.36 (−6.99 to −1.72) (0.00) | 5 | −2.55 (−9.31 to 4.21) (47.86) | 2 | −2.15 (−3.56 to −0.74) (0.00) | 0.35 | 0.234 |
| Length of hospital stay (days) | Individual tau2 | 6 | −0.62 (−1.07 to −0.18) (0.11) | 12 | −0.16 (−0.66 to 0.33) (0.43) | 14 | −0.47 (−0.83 to −0.12) (0.18) | 0.39 | 0.592 |
| Intraoperative opioid consumption (MEQ, mg) | Individual tau2 | 7 | −2.00 (−4.30 to 0.30) (4.34) | 3 | 0.04 (−11.99 to 12.08) (107.18) | 8 | −1.86 (−3.34 to −0.38) (0.55) | 0.95 | 0.027 |
| Postoperative opioid consumption, PACU (MEQ, mg) | Individual tau2 | 5 | −3.03 (−4.82 to −1.23) (0.00) | 7 | −3.84 (−4.57 to −3.11) (0.00) | 9 | −2.71 (−4.32 to −1.09) (3.45) | 0.37 | 0.211 |
| Postoperative opioid consumption, overall (MEQ, mg) | Individual tau2 | 11 | −3.43 (−6.01 to −0.85) (3.08) | 16 | −5.78 (−9.33 to −2.23) (32.11) | 13 | −6.42 (−11.60 to −1.24) (50.54) | 0.43 | 0.285 |
| Subgroup‐analyses are based on multivariate meta‐analysis models (method: REML, R package 'metafor'; Viechtbauer 2010). We tested for subgroup differences (test of moderators). Tests on subgroup differences are based on the assumption that the tau2 (between‐study heterogeneity) varies across the subgroups. We estimated the tau2s and tested if they have a common value (likelihood ratio test). We rejected the null hypothesis for P < 0.05. Acronyms and abbreviations used in this table: MEQ = morphine equivalent dose, PACU =post anaesthesia care unit, REML = restricted maximum likelihood approach | |||||||||
| All studies | Without high/unclear risk of bias studies (selection bias) | ||||
| Outcome | Statistical method | Studies | Effect estimate | Studies | Effect estimate |
| Pain score, rest, 'early time points' (1 hr to 4 hrs, PACU) | SMD (IV, Random, 95% CI) | 29 | −0.50 (−0.72 to −0.28) | 6 | −0.23 (−0.51 to 0.05) |
| Pain score, rest, 'intermediate time points' (24 hrs) | SMD (IV, Random, 95% CI) | 33 | −0.14 (−0.25 to −0.04) | 6 | 0.09 (−0.13 to 0.30) |
| Pain score, rest, 'late time points' (48 hrs) | SMD (IV, Random, 95% CI) | 24 | −0.11 (−0.25 to 0.04) | 3 | 0.03 (−0.24 to 0.29) |
| Postoperative ileus (dichotomous) | RR (MH, Random, 95% CI) | 4 | 0.37 (0.15 to 0.87) | 0 | Not estimable |
| Time to first defaecation/bowel movement (hrs) | MD (IV, Random, 95% CI) | 12 | −7.92 (−12.71 to −3.13) | 2 | −6.18 (−11.19 to −1.18) |
| Time to first flatus (hrs) | MD (IV, Random, 95% CI) | 13 | −4.09 (−6.30 to −1.87) | 2 | −3.27 (−6.33 to −0.21) |
| Time to first bowel sounds (hrs) | MD (IV, Random, 95% CI) | 2 | −6.08 (−13.77 to 1.60) | 0 | Not estimable |
| Length of hospital stay (days) | MD (IV, Random, 95% CI) | 32 | −0.37 (−0.60 to −0.15) | 3 | −0.13 (−0.70 to 0.44) |
| Length of hospital stay (outpatient surgery, mins) | MD (IV, Random, 95% CI) | 3 | −10.81 (−36.93 to 15.31) | 3 | −10.81 (−36.93 to 15.31) |
| Surgical complications ‐ anastomotic leak | RR (MH, Random, 95% CI) | 3 | 0.61 (0.08 to 4.80) | 0 | Not estimable |
| Surgical complications ‐ bleeding | RR (MH, Random, 95% CI) | 3 | 1.79 (0.41 to 7.89) | 0 | Not estimable |
| Surgical complications ‐ postoperative infection | RR (MH, Random, 95% CI) | 5 | 1.64 (0.41 to 6.52) | 0 | Not estimable |
| Patient satisfaction | MD (IV, Random, 95% CI) | 6 | 0.76 (0.46 to 1.06) | 2 | 0.59 (−0.09 to 1.26) |
| Postoperative nausea, early (PACU) | RR (MH, Random, 95% CI) | 8 | 0.72 (0.53 to 0.98) | 3 | 0.64 (0.30 to 1.37) |
| Postoperative nausea, overall (0 to 24 hrs, to 48 hrs, to 72 hrs) | RR (MH, Random, 95% CI) | 35 | 0.78 (0.67 to 0.91) | 8 | 0.99 (0.69 to 1.42) |
| Postoperative vomiting, early (PACU) | RR (MH, Random, 95% CI) | 4 | 0.49 (0.16 to 1.48) | 2 | 0.39 (0.11 to 1.38) |
| Postoperative vomiting, overall (0 to 24 hrs, to 48 hrs, to 72 hrs) | RR (MH, Random, 95% CI) | 19 | 0.83 (0.63 to 1.08) | 3 | 1.33 (0.50 to 3.53) |
| Intraoperative opioid consumption (MEQ, mg) | MD (IV, Random, 95% CI) | 18 | −2.14 (−3.87 to −0.40) | 3 | −3.28 (−6.56 to −0.00) |
| Intraoperative opioid consumption with remifentanil (MEQ, mg) | MD (IV, Random, 95% CI) | 6 | −14.17 (−35.27 to 6.92) | 2 | −9.53 (−59.18 to 40.12) |
| Postoperative opioid consumption, PACU (MEQ, mg) | MD (IV, Random, 95% CI) | 21 | −3.10 (−3.87 to −2.32) | 6 | −2.69 (−4.13 to −1.24) |
| Postoperative opioid consumption, overall (MEQ, mg) | MD (IV, Random, 95% CI) | 40 | −4.52 (−6.25 to −2.79) | 10 | −2.74 (−5.60 to 0.13) |
| Acronyms and abbreviations used in this table: CI = confidence interval, IV = inverse variance, MD = mean difference, MEQ = morphine equivalent dose, MH = Mantel Haenszel, PACU = postanaesthesia care unit, RR = risk ratio, SMD = standardized mean difference | |||||
| All studies | Without high/unclear risk of bias studies (blinding) | ||||
| Outcome | Statistical method | Studies | Effect estimate | Studies | Effect estimate |
| Pain score, rest, 'early time points' (1 hr to 4 hrs, PACU) | SMD (IV, Random, 95% CI) | 29 | −0.50 (−0.72 to −0.28) | 21 | −0.62 (−0.88 to −0.35) |
| Pain score, rest, 'intermediate time points' (24 hrs) | SMD (IV, Random, 95% CI) | 33 | −0.14 (−0.25 to −0.04) | 22 | −0.19 (−0.33 to −0.05) |
| Pain score, rest, 'late time points' (48 hrs) | SMD (IV, Random, 95% CI) | 24 | −0.11 (−0.25 to 0.04) | 19 | −0.17 (−0.31 to −0.04) |
| Postoperative ileus (dichotomous) | RR (MH, Random, 95% CI) | 4 | 0.37 (0.15 to 0.87) | 2 | 0.55 (0.16 to 1.88) |
| Time to first defaecation/bowel movement (hrs) | MD (IV, Random, 95% CI) | 12 | −7.92 (−12.71 to −3.13) | 5 | −8.87 (−20.51 to 2.78) |
| Time to first flatus (hrs) | MD (IV, Random, 95% CI) | 13 | −4.09 (−6.30 to −1.87) | 6 | −3.63 (−6.59 to −0.67) |
| Time to first bowel sounds (hrs) | MD (IV, Random, 95% CI) | 2 | −6.08 (−13.77 to 1.60) | 1 | −2.16 (−9.30 to 4.98) |
| Length of hospital stay (days) | MD (IV, Random, 95% CI) | 32 | −0.37 (−0.60 to −0.15) | 19 | −0.32 (−0.59 to −0.04) |
| Length of hospital stay (outpatient surgery, mins) | MD (IV, Random, 95% CI) | 3 | −10.81 (−36.93 to 15.31) | 1 | −4.00 (−12.64 to 4.64) |
| Surgical complications ‐ anastomotic leak | RR (MH, Random, 95% CI) | 3 | 0.61 (0.08 to 4.80) | 1 | 1.00 (0.07 to 15.26) |
| Surgical complications ‐ bleeding | RR (MH, Random, 95% CI) | 3 | 1.79 (0.41 to 7.89) | 1 | Not estimable |
| Surgical complications ‐ postoperative infection | RR (MH, Random, 95% CI) | 5 | 1.64 (0.41 to 6.52) | 3 | 0.69 (0.11 to 4.33) |
| Patient satisfaction | MD (IV, Random, 95% CI) | 6 | 0.76 (0.46 to 1.06) | 5 | 1.00 (0.63 to 1.37) |
| Postoperative nausea, early (PACU) | RR (MH, Random, 95% CI) | 8 | 0.72 (0.53 to 0.98) | 6 | 0.75 (0.53 to 1.05) |
| Postoperative nausea, overall (0 to 24 hrs, to 48 hrs, to 72 hrs) | RR (MH, Random, 95% CI) | 35 | 0.78 (0.67 to 0.91) | 23 | 0.78 (0.66 to 0.93) |
| Postoperative vomiting, early (PACU) | RR (MH, Random, 95% CI) | 4 | 0.49 (0.16 to 1.48) | 3 | 0.52 (0.16 to 1.68) |
| Postoperative vomiting, overall (0 to 24 hrs, to 48 hrs, to 72 hrs) | RR (MH, Random, 95% CI) | 19 | 0.83 (0.63 to 1.08) | 15 | 0.70 (0.50 to 0.96) |
| Intraoperative opioid consumption (MEQ, mg) | MD (IV, Random, 95% CI) | 18 | −2.14 (−3.87 to −0.40) | 13 | −1.86 (−3.74 to 0.02) |
| Intraoperative opioid consumption with remifentanil (MEQ, mg) | MD (IV, Random, 95% CI) | 6 | −14.17 (−35.27 to 6.92) | 5 | −16.08 (−41.41 to 9.25) |
| Postoperative opioid consumption, PACU (MEQ, mg) | MD (IV, Random, 95% CI) | 21 | −3.10 (−3.87 to −2.32) | 18 | −2.93 (−3.75 to −2.11) |
| Postoperative opioid consumption, overall (MEQ, mg) | MD (IV, Random, 95% CI) | 40 | −4.52 (−6.25 to −2.79) | 24 | −7.29 (−10.38 to −4.19) |
| Acronyms and abbreviations used in this table: | |||||
| Random‐effects model | Fixed‐effect model | ||||
| Outcome | Statistical method | Studies | Effect estimate | Studies | Effect estimate |
| Pain score, rest, 'early time points' (1 hr to 4 hrs, PACU) | SMD (IV, Random, 95% CI) | 29 | −0.50 (−0.72 to −0.28) | 29 | −0.40 (−0.50 to −0.30) |
| Pain score, rest, 'intermediate time points' (24 hrs) | SMD (IV, Random, 95% CI) | 33 | −0.14 (−0.25 to −0.04) | 33 | −0.13 (−0.22 to −0.04) |
| Pain score, rest, 'late time points' (48 hrs) | SMD (IV, Random, 95% CI) | 24 | −0.11 (−0.25 to 0.04) | 24 | −0.09 (−0.19 to 0.02) |
| Postoperative ileus (dichotomous) | RR (MH, Random, 95% CI) | 4 | 0.37 (0.15 to 0.87) | 4 | 0.35 (0.15 to 0.82) |
| Time to first defaecation/bowel movement (hrs) | MD (IV, Random, 95% CI) | 12 | −7.92 (−12.71 to −3.13) | 12 | −6.01 (−8.53 to −3.49) |
| Time to first flatus (hrs) | MD (IV, Random, 95% CI) | 13 | −4.09 (−6.30 to −1.87) | 13 | −3.63 (−4.59 to −2.68) |
| Time to first bowel sounds (hrs) | MD (IV, Random, 95% CI) | 2 | −6.08 (−13.77 to 1.60) | 2 | −6.09 (−11.13 to −1.04) |
| Length of hospital stay (days) | MD (IV, Random, 95% CI) | 32 | −0.37 (−0.60 to −0.15) | 32 | −0.21 (−0.30 to −0.12) |
| Length of hospital stay (outpatient surgery, mins) | MD (IV, Random, 95% CI) | 3 | −10.81 (−36.93 to 15.31) | 3 | −5.66 (−13.74 to 2.43) |
| Surgical complications ‐ anastomotic leak | RR (MH, Random, 95% CI) | 3 | 0.61 (0.08 to 4.80) | 3 | 0.58 (0.08 to 4.24) |
| Surgical complications ‐ bleeding | RR (MH, Random, 95% CI) | 3 | 1.79 (0.41 to 7.89) | 3 | 1.86 (0.43 to 8.05) |
| Surgical complications ‐ postoperative infection | RR (MH, Random, 95% CI) | 5 | 1.64 (0.41 to 6.52) | 5 | 1.69 (0.53 to 5.33) |
| Patient satisfaction | MD (IV, Random, 95% CI) | 6 | 0.76 (0.46 to 1.06) | 6 | 0.76 (0.46 to 1.06) |
| Postoperative nausea, early (PACU) | RR (MH, Random, 95% CI) | 8 | 0.72 (0.53 to 0.98) | 8 | 0.72 (0.53 to 0.99) |
| Postoperative nausea, overall (0 to 24 hrs, to 48 hrs, to 72 hrs) | RR (MH, Random, 95% CI) | 35 | 0.78 (0.67 to 0.91) | 35 | 0.77 (0.68 to 0.88) |
| Postoperative vomiting, early (PACU) | RR (MH, Random, 95% CI) | 4 | 0.49 (0.16 to 1.48) | 4 | 0.51 (0.18 to 1.44) |
| Postoperative vomiting, overall (0 to 24 hrs, to 48 hrs, to 72 hrs) | RR (MH, Random, 95% CI) | 19 | 0.83 (0.63 to 1.08) | 19 | 0.78 (0.60 to 1.01) |
| Intraoperative opioid consumption (MEQ, mg) | MD (IV, Random, 95% CI) | 18 | −2.14 (−3.87 to −0.40) | 18 | −1.05 (−1.47 to −0.62) |
| Intraoperative opioid consumption with remifentanil (MEQ, mg) | MD (IV, Random, 95% CI) | 6 | −14.17(−35.27 to 6.92) | 6 | −13.68 (−33.53 to 6.17) |
| Postoperative opioid consumption, PACU (MEQ, mg) | MD (IV, Random, 95% CI) | 21 | −3.10 (−3.87 to −2.32) | 21 | −3.14 (−3.67 to −2.61) |
| Postoperative opioid consumption, overall (MEQ, mg) | MD (IV, Random, 95% CI) | 40 | −4.52 (−6.25 to −2.79) | 40 | −1.52 (−2.14 to −0.90) |
| Acronyms and abbreviations used in this table: | |||||
| Without suspicious studies | With suspicious studies | ||||
| Outcome | Statistical method | Studies | Effect estimate | Studies | Effect estimate |
| Pain score, rest, 'early time points' (1 hr to 4 hrs, PACU) | SMD (IV, Random, 95% CI) | 29 | −0.50 (−0.72 to −0.28) | 37 | −0.88 (−1.18 to −0.57) |
| Pain score, rest, 'intermediate time points' (24 hrs) | SMD (IV, Random, 95% CI) | 33 | −0.14 (−0.25 to −0.04) | 41 | −0.29 (−0.44 to −0.15) |
| Pain score, rest, 'late time points' (48 hrs) | SMD (IV, Random, 95% CI) | 24 | −0.11 (−0.25 to 0.04) | 30 | −0.22 (−0.40 to −0.03) |
| Time to first defaecation/bowel movement (hrs) | MD (IV, Random, 95% CI) | 12 | −7.92 (−12.71 to −3.13) | 14 | −7.09 (−10.06 to −4.11) |
| Time to first flatus (hrs) | MD (IV, Random, 95% CI) | 13 | −4.09 (−6.30 to −1.87) | 16 | −5.02 (−7.73 to −2.31) |
| Time to first bowel sounds (hrs) | MD (IV, Random, 95% CI) | 2 | −6.08 (−13.77 to 1.60) | 4 | −4.28 (−10.32 to 1.76) |
| Postoperative opioid consumption, PACU (MEQ, mg) | MD (IV, Random, 95% CI) | 21 | −3.10 (−3.87 to −2.32) | 25 | −3.51 (−4.88 to −2.15) |
| Postoperative opioid consumption, overall (MEQ, mg) | MD (IV, Random, 95% CI) | 40 | −4.52 (−6.25 to −2.79) | 43 | −4.81 (−6.55 to −3.07) |
| Acronyms and abbreviations used in this table: | |||||
| Study ID | Surgical procedure | Start infusion | End infusion | Duration of infusion | Bolus dose | Infusion dose | Total dose |
| Laparoscopic colectomy | 2 mins before intubation | End of the operaton | 216.60 mins (surgery) | 1.5 mg/kg | 2 mg/kg/hr | NA | |
| Abdominal surgery | 30 mins before skin incision | 1 hr after the end of surgery | 157.80 min (infusion) | 1.5 mg/kg | 1.5 mg/kg/hr | NA | |
| Abdominal hysterectomy | Prior to induction | Skin closure | 105.0 mins (anaesthesia) | 1.5 mg/kg | 3 mg/kg/hr | NA | |
| Cholecystectomy | 30 mins before skin incision | 24 hrs postop | 105 mins (surgery) + 30 mins (prior) + 24 hrs (postop) | 100 mg | 2 mg/min | NA | |
| Spine surgery | After induction of anaesthesia | End of surgery | 129.2 mins (surgery) | 1 mg/kg | 1.5 mg/kg/hr | NA | |
| Breast plastic surgeries | 30 mins before skin incision | Skin closure | 295 mins (surgery) + 30 mins (prior) | 1.5 mg/kg | 1.5 mg/kg/hr | NA | |
| Elective total thyroidectomy | Prior to anaesthesia | End of surgery | 135 mins (anaesthesia) | 1.5 mg/kg | 2 mg/kg/hr | NA | |
| Thyroidectomy | Immediately after induction | Extubation | 148.9 mins (anaesthesia) | 2 mg/kg | 3 mg/kg/hr | NA | |
| Thoracic surgery | At induction | Skin closure | 244 mins (anaesthesia) | No bolus | 33 µg/kg/mins | NA | |
| Laparoscopic fundoplication | At induction | 24 hrs after start of continuous infusion | 24 hrs | 1 mg/kg | 2 mg/kg/hr | NA | |
| Outpatient laparoscopic surgery | Prior to induction | End of the surgical procedure | 105.5 mins (time of induction to skin incision) | 1.5 mg/kg | 2 mg/kg/hr | NA | |
| Laparoscopic | Prior to induction | End of the surgical procedure | 144 mins (surgery) | 1.5 mg/kg | 2 mg/kg/hr | NA | |
| Laparoscopic sterilisation in women | At induction | 30 mins after arrival at PACU | 77 mins | 1.5 mg/kg | 1.5 mg/kg/hr | 240 mg | |
| Caesarean delivery | 30 mins before induction | 60 mins after skin closure | 43.2 mins (anaesthesia) + 60 mins (postop) | 1.5 mg/kg | 1.5 mg/kg/hr | NA | |
| Spine surgery | At induction | Discharge from the PACU or a maximum of 8 hrs | 8.5 hrs | No bolus | 2 mg/kg/hr | NA | |
| Abdominal hysterectomy | At induction | 24 hours postop | NA | 1.5 mg/kg | 2 mg/kg/hr | NA | |
| Surgery for breast cancer | Prior to induction | 60 mins after skin closure | 60.6 mins (surgery) + 60 mins (postop) | 1.5 mg/kg | 1.5 mg/kg/hr | 328.1 mg | |
| Radical retropubic prostatectomy | Prior to induction | 60 mins after skin closure | NA | 1.5 mg/kg | 1.5 mg/kg/hr | NA | |
| Colorectal surgery | Prior to induction | 4 hours | 194.3 mins (surgery) + NA (induction to skin incision) + 4 hrs (postop) | 1.5 mg/kg | 2 mg/mins | NA | |
| CABG | After induction of anaesthesia and before surgical incision | Up to 48 hours in the ICU | NA | 1.5 mg/kg | 30 μg/kg/min | NA | |
| Lumbar discectomy | 30 mins before induction | Until 10 mins after extubation | NA | 1.5 mg/kg | 1.5 mg/kg | NA | |
| Laparoscopic cholecystectomy | 10 mins prior to induction | End of first postop hr, max. 180 mins | NA | 1.5 mg/kg | 1.5 mg/kg/hr | NA | |
| Laparoscopic colectomy | At induction | 24 hrs postop | 169 mins (anaesthesia) + 24 hrs (postop) | 1.5 mg/kg | 2 mg/kg/hr intraop and 1.33 mg/kg/h for 24 hrs | NA | |
| Inguinal herniorrhaphy | 2 mins before induction | End of the surgical procedure | 66.03 mins (anaesthesia) + 2 mins (before induction) | 1.5 mg/kg | 2 mg/kg/hr | NA | |
| CABG | 2 mins before induction | NA | NA | 3 mg/kg | 0.05 mg/kg/min | NA | |
| Laparoscopic appendectomy | 2 mins before induction | End of the surgical procedure | 70.0 mins (anaesthesia) or 55.0 (surgery) + 2 mins (before induction) | 1.5 mg/kg | 2 mg/kg/hr | 240.3 mg | |
| Laparoscopic gastrectomy | Preop | End of the surgical procedure | 324 mins (anaesthesia) or 282.06 mins (surgery) | 1.5 mg/kg | 2 mg/kg/hr | NA | |
| Coronary artery bypass graft | Before induction | 24 hrs after end of surgery | 339 mins (anaesthesia) + 24 hrs | 1.5 mg/kg | 2 mg/kg/hr | 3917 mg | |
| Laparoscopic colectomy | Prior to incision | After 24 hrs | 24 hrs | 1 mg/kg | 1 mg/kg/hr | NA | |
| Elective one‐level laminectomy and discectomy | Preop | End of surgery | 110 min (surgery) | 1.5 mg/kg | 2 mg/kg/hr | NA | |
| Major abdominal surgery | 30 mins before skin incision | 1 hr after the end of surgery | 6.2 hrs (infusion) | 1.5 mg/kg | 5 mg/kg/hr | NA | |
| Surgery for colon cancer | 30 mins before surgery | End of the surgical procedure | 157.8 mins (surgery) + 30 min (before surgery) | 2 mg/kg | 3 mg/kg/hr | NA | |
| Outpatient laparoscopic cholecystectomy | At induction | End of the surgical procedure | 60 mins (surgery) + NA (induction to skin incision) | 1.5 mg/kg | 2 mg/kg/hr | NA | |
| Laparoscopic prostatectomy | At induction | End of the surgical procedure | 262.5 mins (surgery) + NA (induction to skin incision) | 1.5 mg/kg | 2 mg/kg/hr | NA | |
| Off‐pump coronary artery bypass graft surgery | At induction | End of the surgical procedure | 208.9 mins (surgery) + NA (induction to skin incision) | 1.5 mg/kg | 2 mg/kg/hr | NA | |
| Prostatectomy | Before induction | 24 hrs postop | 173 mins (anaesthesia) + 24 hrs | 1.5 mg/kg | 2 mg/kg/hr during surgery, | NA | |
| Hip | 30 mins before skin incision | 1 hr after the end of surgery | NA | 1.5 mg/kg | 1.5 mg/kg/hr | NA | |
| Cardiac surgery | After induction | 48 hrs postop | NA | 1 mg/kg | 4 mg/min for 1 hr, | NA | |
| Outpatient surgery | After induction | 1 hr after arrival in the PACU | NA | 1.5 mg/kg | 2 mg/kg/hr | 517 mg | |
| Cardiac surgery | At induction | 48 hrs postop | NA | 1 mg/kg | 240 mg over the first hr and | NA | |
| Cardiac surgery | At induction | Total | NA | 1 mg/kg | 2 mg/min for 2 hrs, and 1 mg/min thereafter | NA | |
| Hysterectomy | At induction | End of surgery | 145.1 mins (anaesthesia) | No bolus | 2 mg/kg/hr | NA | |
| Functional endoscopic sinus surgery | After induction | End of the surgical procedure | 87 mins (anaesthesia) or 62 mins (surgery) | 1.5 mg/kg | 1.5 mg/kg/hr | NA | |
| Laparoscopic cholecystectomy | Before incision | 1 hr after end of surgery | 105.23 mins (surgery) + 1 hr | 1.5 mg/kg | 3 mg/kg/hr | NA | |
| Supratentorial tumour surgery | After induction | End of surgery | 254 mins (surgery) | 1.5 mg/kg | 2 mg/kg/hr | NA | |
| Cholecystectomy | Prior to induction | 24 hrs postop | 109 mins (surgery) + NA (induction to skin incision) + 24 hrs (postop) | 100 mg | 3 mg/min | NA | |
| Laparoscopic cholecystectomy | Prior to induction | End of the surgical procedure | 80.3 mins (surgery) + NA (induction to skin incision) | 2 mg/kg | 2 mg/kg/hr | NA | |
| Abdominal hysterectomy | 30 mins before incision | 1 hr after surgery | 30 mins + 95 min (surgery) + 60 mins | 1.5 mg/kg | 2 mg/kg/hr | NA | |
| VATS | At induction | End of the surgical procedure | NA | 1.5 mg/kg | 3 mg/min if the | 239.6 mg | |
| Ophthalmologic surgeries | NA | Intraoperatively | No bolus | 2.5 mg/kg/hr | |||
| Open abdominal surgery | Time of intubation | 1 hr after surgery | 145.8 mins (surgery) + 60 min | 1.5 mg/kg | 1.5 mg/kg/hr | NA | |
| Large bowel surgery | Before induction | Before skin suturing | 122 mins | 1.5 mg/kg | 2 mg/kg/hr | NA | |
| Tonsillectomy | 30 mins before skin incision | 24 hrs | 57 mins (surgery) + 30 min (before skin incision) + 24 hrs (postop) | 1.5 mg/kg | 2 mg/kg/hr over 6 hrs and | NA | |
| Colon resection | Prior to induction | Until the day after return of bowel function or fifth postop | 69 hrs 54 mins (infusion) | No bolus | 11 patients: 2 mg/min in patients < 70 kg, | NA | |
| Breast cancer surgery | Before induction | 2 hrs after arrival in PACU or at discharge from PACU | 85 mins | 1.5 mg/kg, max. 150 mg | 2 mg/kg/h, max 200 mg/hr | NA | |
| Laparoscopic colon resection | Prior to induction | 24 hrs postop | 115 mins (anaesthesia) + 24 hrs (postop) | 1.5 mg/kg | 2 mg/kg/hr during surgery, 1 mg/ | NA | |
| Cholecystectomy | 30 mins before skin incision | 24 hrs postop | 110 mins (surgery) + 30 min (before skin incision) + 24 hrs | 100 mg | 2 mg/min | NA | |
| CABG | At the opening of the | End of the surgical procedure | NA | 1.5 mg/kg, second dose (4 mg/kg) was administered to the priming solution | 4 mg/min | NA | |
| Hysterectomy | 10 mins prior to induction | Discharge from the operating room | 152.3 (anaesthesia) + 10 mins | 1.5 mg/kg | 1.5 mg/kg/hr | NA | |
| Radical retropubic prostatectomy | Before induction | End of surgery | NA | 1.5 mg/kg | 1.5 mg/kg/hr | NA | |
| Laparoscopic colorectal surgery | Prior to induction | 48 hrs postop | 220 mins (surgery) + NA (induction to skin incision) + 48 (postop) | 1.5 mg/kg, max: 100 mg | 2 mg/kg/hr during surgery, | NA | |
| Laparoscopic cholecystectomy | 30 mins before skin incision | End of the surgical procedure | 81.4 mins (surgery) + 30 mins (before incision) | No bolus | 3 mg/kg/hr | NA | |
| Laparoscopic transperitoneal renal surgery | At induction | 24 hrs postop | 293 mins (anaesthesia) + 24 hrs (postop) | 1.5 mg/kg | 2 mg/kg/hr during surgery, | NA | |
| Abdominal hysterectomy | 10 mins before induction | Wound closure | 118.7 mins (anaesthesia) | 1.5 mg/kg | 1.5 mg/kg/hr | 185.7 mg | |
| Laparoscopic | 2 mins before induction | End of the surgical procedure | 65 mins (anaesthesia) + 2 mins (before induction) | 1.5 mg/kg | 2 mg/kg/hr | 228.71 mg | |
| Transabdominal hysterectomy | 20 mins before skin incision | End of the surgical procedure | 109 mins (surgery) + 20 mins (before skin incision) | 2 mg/kg | 1.5 mg/kg/hr | NA | |
| Subtotal gastrectomy | Preop (protocol: 2 mins before intubation) | End of surgery | 271.27 mins (surgery) | 1.5 mg/kg | 2 mg/kg/hr | NA | |
| Laparotomy | At induction | Wound closure | 114.1 mins (surgery) | 1.0 mg/kg | 2 mg/kg/hr | NA | |
| Acronyms and abbreviations used in this table: CABG = coronary artery bypass graft , CPB = cardiopulmonary bypass, hr = hour, ICU = intensive care unit, min = minute, NA = not available, preop = preoperatively, postop =postoperatively, VATS = Video‐assisted thoracoscopic surgery | |||||||
| Outcome | Statistical method | Studies | Effect estimate (95% CI) | Prediction interval (95% PI) | I2 | Adjusted effect estimate (trim and fill), (number of added studies) |
| Pain score, rest, 'early time points' (1 hr to 4 hrs, PACU) | SMD (IV, Random) | 29 | −0.50 (−0.72 to −0.28) | (−1.61 to 0.62) | 79% | −0.26 (−0.52 to −0.004), (6)* |
| Pain score, rest, 'intermediate time points' (24 hrs) | SMD (IV, Random) | 33 | −0.14 (−0.25 to −0.04) | (−0.44 to 0.16) | 20% | 0.007 (−0.12 to 0.13), (11)* |
| Pain score, rest, 'late time points' 48 hrs) | SMD (IV, Random) | 24 | −0.11 (−0.25 to 0.04) | (−0.60 to 0.38) | 42% | −0.015 (−0.17 to 0.14), (4)* |
| Time to first defaecation/bowel movement (hrs) | MD (IV, Random) | 12 | −7.92 (−12.71 to −3.13) | (−22.19 to 6.36) | 62% | −4.06 (−9.07 to 0.95), (4) |
| Time to first flatus (hrs) | MD (IV, Random) | 13 | −4.09 (−6.30 to −1.87) | (−10.431 to 2.26) | 63% | −3.63(−5.88 to −1.37), (1) |
| Length of hospital stay (days) | MD (IV, Random) | 32 | −0.37 (−0.60 to −0.15) | (−1.26 to 0.52) | 69% | −0.19 (−0.42 to −0.04), (8)* |
| Postoperative nausea, overall (0 to 24 hrs, to 48 hrs, to 72 hrs) | RR (MH, Random) | 35 | 0.78 (0.67 to 0.91) | (0.49 to 1.23) | 22% | 0.87 (0.74 to 1.03), (9)* |
| Postoperative vomiting, overall (0 to 24 hrs, to 48 hrs, to 72 hrs) | RR (MH, Random) | 19 | 0.83 (0.63 to 1.08) | (0.62 to 1.10) | 0% | 0.89 (0.69 to 1.15), (3) |
| Intraoperative opioid consumption (MEQ, mg) | MD (IV, Random) | 18 | −2.14 (−3.87 to −0.40) | (−8.13 to 3.86) | 80% | −2.10 (−3.83 to −0.38), (1) |
| Postoperative opioid consumption, PACU (MEQ, mg) | MD (IV, Random) | 21 | −3.10 (−3.87 to −2.32) | (−5.43 to −0.77) | 40% | −2.91 (−3.72 to −2.11), (2) |
| Postoperative opioid consumption, overall (MEQ, mg) | MD (IV, Random) | 40 | −4.52 (−6.25 to −2.79) | (−12.03 to 3.00) | 73% | −1.09 (−2.97 to 0.79), (16)* |
| Acronyms and abbreviations used in this table: CI = confidence interval, hr = hour, IV = inverse variance, MD = mean difference, MEQ =morphine equivalent dose, MH = Mantel Haenszel, PACU = postanaesthesia care unit, PI = prediction interval, RR = risk ratio, SMD = standardized mean difference We analysed all studies with 10 or more studies for funnel plot asymmetry. The asterisk (*) indicates that we rejected the null hypothesis of funnel plot asymmetry (P < 0.1). | ||||||
| Study ID | Type of adverse event/side effect ‐ lidocaine group | Type of adverse event/side effect ‐ control group | No adverse events/side effects detectable (statement) |
| NA | NA | “Not one patient had a postoperative complication related to lidocaine infusion.” | |
| Light headache (3), cardiac arrhythmias (0), perioral numbness (0), hypotension (0) | Cardiac arrhythmias (0), perioral numbness (0), hypotension (0) | NA | |
| Light‐headedness, tinnitus, dysgeusia, etc. (11) | Light‐headedness, tinnitus, dysgeusia, etc. (21) | NA | |
| Light‐headedness (1) | Light‐headedness (1) | "No adverse reactions to lidocaine were observed." | |
| NA | NA | NA | |
| Dizziness 24 hrs/ 48 hrs/ 72 hrs (1/1/1), itching 24 hrs/ 48 hrs/ 72 hrs (8/3/0), respiratory repression 24 hrs/ 48 hrs/ 72 hrs (0/0/0) | Dizziness 24 hrs/ 48 hrs/ 72 hrs (3/2/1), itching 24 hrs/ 48 hrs/ 72 hrs (6/2/1), respiratory repression 24 hrs/ 48 hrs/ 72 hrs (0/0/0) | NA | |
| NA | NA | “There were no adverse events related to the investigational procedure or systemic administration of lidocaine such as arrhythmia, perioral numbness, visual disturbance, metal taste, or light‐headedness.” | |
| NA | NA | "In addition, none of the patients showed symptoms or signs associated with lidocaine toxicity during the perioperative period." | |
| Drowsiness (0), metal taste (0), perioral numbness (0), visual disturbances (0) | Drowsiness (0), metal taste (0), perioral numbness (0), visual disturbances (0) | "No patient reported any side effect of lidocaine toxicity." | |
| Severe bradycardia (1), perioral paraesthesia (1), restless legs (1) | Severe bradycardia (0), perioral paraesthesia (0), restless legs (0) | NA | |
| NA | NA | "We did not observe any potential cardiovascular or neurological side effects associated with the infusion of systemic lidocaine in our investigation." | |
| NA | NA | "We did not observe any potential cardiovascular or neurological side effects associated with the infusion of systemic lidocaine in our investigation." | |
| NA | NA | “Both groups did not differ with respect to the incidence of other AEs. No patient receiving lidocaine reported subjective symptoms of local anesthetic systemic toxicity.” | |
| Perioperative arrhythmia (0), light‐headedness (0), headache (0), perioral numbness (0), tunnel vision (0), seizures (0) | Perioperative arrhythmia (0), light‐headedness (0), headache (0), perioral numbness (0), tunnel vision (0), seizures (0) | "There were no reported serious side effects during the study." | |
| Pneumonia (0), respiratory failure (0), cardiac arrest (0), arrhythmia (0), heart failure (0), stroke (0), intravascular coagulopathy (0), thromboembolism (0), delirium (0), monoplegia (0), upper gastrointestinal bleeding (0), sepsis (0), readmission (2) | Pneumonia (0), respiratory failure (0), cardiac arrest (0), arrhythmia (0), heart failure (0), stroke (0), intravascular coagulopathy (0), thromboembolism (0), delirium (0), monoplegia (1), upper gastrointestinal bleeding (0), sepsis (0), readmission (3) | NA | |
| NA | NA | NA | |
| NA | NA | "No side effects related to lidocaine were observed." | |
| NA | NA | "No patient experienced identifiable adverse events related to the lidocaine infusion." | |
| NA | NA | NA | |
| Death (1), myocardial infarction (0) | Death (1), myocardial infarction (0) | NA | |
| NA | NA | NA | |
| Drowsiness (3) | Drowsiness (0) | “None of the patients complained of lignocaine‐related side effects such as perioral numbness or metallic taste. The incidence of light‐headedness and nausea was comparable in both the groups. Three patients in Group B demonstrated drowsiness in the postoperative period lasting between 10 and 17 mins.” | |
| NA | NA | NA | |
| NA | NA | NA | |
| NA | NA | NA | |
| NA | NA | "There was no adverse effect from intravenous lidocaine throughout the study." | |
| NA | NA | "In our study, no neuropsychiatric events were observed throughout the process." | |
| NA | NA | “No specific complication or side effect regarding lidocaine or dexmedetomidine was reported.” | |
| Hospital mortality (0) | Hospital mortality (0) | “There were no significant lidocaine‐related adverse events during our trial.” | |
| NA | NA | “There were no side effects from the lidocaine, such as arrhythmia, hypotension, and hypersensitivity.” | |
| NA | NA | "No anaesthesiologist noted adverse events related to the lidocaine infusion during surgery. Furthermore, no patient after having regained consciousness complained of lidocaine‐related side effects such as perioral numbness or metallic taste. The incidences of drowsiness, light‐headedness, and nausea were comparable in the lidocaine and control groups." | |
| Bradycardia (3) | Bradycardia (0) | "No patient experienced an identifiable adverse event related to IV lidocaine infusion." | |
| NA | NA | NA | |
| Bleeding (1), sepsis (1), chest infection (1) | Bladder leakage (1) | NA | |
| Atrial fibrillation (9), other arrhythmia (7), myocardial infarction (0), death (0) | Atrial fibrillation (5), other arrhythmia (10), myocardial infarction (0), death (0) | "All patients started on lidocaine completed their full course of drug and did not experience any adverse events related to the local anaesthetic, such as severe bradycardia (< 40 beats min‐1), asystole, or neurological symptoms." | |
| NA | NA | NA | |
| NA | NA | "No patient reported lidocaine toxicity side effects and no adverse events were reported in both groups" | |
| Serious adverse events (12.3%), no detailed description | Serious adverse events (10.2%), no detailed description | "Adverse events were not significantly different between treatment groups." | |
| Dizziness and visual disturbances (1) | NA | "There were no serious adverse events recorded." | |
| Death (1) | Death (1) | NA | |
| Death due to multiorgan failure (3) and acute graft occlusion (1) | Death (0) | NA | |
| NA | NA | NA | |
| Hypotension (0) | Hypotension (0) | NA | |
| NA | NA | "There was no arrhythmia or adverse effect occurrence." | |
| Hypertension (3), coronary heart disease (0) | Hypertension (4), coronary heart disease (0) | “There were no seizures or other symptoms of potential lidocaine toxicity found in patients who received lidocaine infusion. There was no significant difference in the number of cases complicated by hypertension, tachycardia, dysphoria, or PONV between the normal saline group and the lidocaine group.” | |
| Sedation (2) | NA | "No adverse reactions to lidocaine were reported." | |
| NA | NA | NA | |
| NA | NA | "...also none of the patients experienced lidocaine‐related adverse effects." | |
| Confusion (1), sedation (2), light‐headedness/dizziness (0), blurred vision (0), hypotension (0), respiratory depression (0), pruritus (0) | Confusion (0), sedation (0), light‐headedness/dizziness (0), blurred vision (1), hypotension (1), respiratory depression (0), pruritus (0) | NA | |
| NA | NA | NA | |
| NA | NA | NA | |
| Transient confusion in PACU (1), bradycardia requiring treatment (0) | Transient confusion in PACU (0), bradycardia requiring treatment (0) | NA | |
| NA | NA | No signs of urticaria, dermatitis, asthma bronchiale, anaphylactic shock, restlessness, anxiety, lalopathy, tinnitus, metallic taste, dizziness, visual disturbance, and tremor. | |
| Wound infection (0), anaemia (1), anxiety (1), supraventricular tachycardia (3), back pain (0), bradycardia (0), confusion (2), decreased oxygen saturation level (1), dizziness/light‐headedness (1), fever (1), hyperglycaemia (3), hypertension (3), itching (3), lower extremity numbness (1), intravascular device infection (0), syncope (0), arrhythmia severe (1), confusion severe (1), facial numbness severe (1), shortness of breath (1) | Wound infection (1), anaemia (1), anxiety (0), supraventricular tachycardia (1), back pain (1), bradycardia (1), confusion (0), decreased oxygen saturation level (0), dizziness/light‐headedness (1), fever (1), hyperglycaemia (0), hypertension (0), itching (3), lower extremity numbness (6), intravascular device infection (1), syncope (1), arrhythmia severe (1), confusion severe (0), facial numbness severe (0), shortness of breath (0) | NA | |
| NA | NA | "...no toxicity cases were reported in our cohort...." | |
| Light‐headedness (0), perioral numbness (0), metallic taste (0), dizziness (0), and visual disturbances (0) | NA | "Lidocaine‐associated haemodynamic changes such as severe hypotension, bradycardia, and arrhythmia were not observed in any lidocaine group patient during surgery." | |
| Drowsiness (2) | NA | "Aside from drowsiness in two patients of the lidocaine group, no side effects due to possible lidocaine overdosage were reported." | |
| Death (2) | Death (4) | NA | |
| NA | NA | NA | |
| Pruritus (6), dizziness (14), visual disturbances (4), perioral numbness (2), muscle weakness (1), constipation (4) | Pruritus (9), dizziness (20), visual disturbances (6), perioral numbness (2), muscle weakness (3), constipation (10) | NA | |
| NA | NA | "No patients showed signs of lidocaine toxicity in the postoperative period." | |
| NA | NA | "No patient experienced an identifiable adverse event related to the lidocaine infusion, except that an occasional arrhythmia with stable vital signs was noted in one patient in both groups." | |
| Light‐headedness (0), drowsiness (0), perioral numbness (0), visual disturbances (0), metal taste (0), pathological cardiac rhythm disturbances (0), and seizures (0) | NA | "No postoperative complications and no adverse events related to systemic administration of lidocaine were observed." | |
| NA | NA | NA | |
| Blurred vision (0), hearing problems (0), peripheral paraesthesia (0), dizziness (0), uncontrolled muscle contraction (0), convulsions (0), hypotension (0), | NA | NA | |
| NA | NA | NA | |
| Shivering (0), tinnitus (0) | Shivering (1), tinnitus (0) | NA | |
| Pruritus (1) | Pruritus (4) | NA | |
| Acronyms and abbreviations used in this table: AE = adverse events, IV = intravenous, NA = not available, PACU = postanaesthesia care unit, PONV = postoperative nausea and vomiting | |||
| Outcome or subgroup title | No. of studies | No. of participants | Statistical method | Effect size |
| 1 Pain score at rest, 'early time points' (1 h to 4 h, PACU) Show forest plot | 29 | 1656 | Std. Mean Difference (IV, Random, 95% CI) | ‐0.50 [‐0.72, ‐0.28] |
| 1.1 open abdominal surgery | 8 | 448 | Std. Mean Difference (IV, Random, 95% CI) | ‐0.54 [‐0.82, ‐0.26] |
| 1.2 laparoscopic abdominal surgery | 10 | 518 | Std. Mean Difference (IV, Random, 95% CI) | ‐0.78 [‐1.34, ‐0.21] |
| 1.3 other surgery | 11 | 690 | Std. Mean Difference (IV, Random, 95% CI) | ‐0.21 [‐0.44, 0.02] |
| 2 Pain score at rest, 'intermediate time points' (24 h) Show forest plot | 33 | 1847 | Std. Mean Difference (IV, Random, 95% CI) | ‐0.14 [‐0.25, ‐0.04] |
| 3 Pain score at rest, 'late time points' (48 h) Show forest plot | 24 | 1404 | Std. Mean Difference (IV, Random, 95% CI) | ‐0.11 [‐0.25, 0.04] |
| 4 Postoperative ileus (dichotomous) Show forest plot | 4 | 273 | Risk Ratio (M‐H, Random, 95% CI) | 0.37 [0.15, 0.87] |
| 5 Time to first defaecation/bowel movement (h) Show forest plot | 12 | 684 | Mean Difference (IV, Random, 95% CI) | ‐7.92 [‐12.71, ‐3.13] |
| 6 Time to first flatus (h) Show forest plot | 13 | 785 | Mean Difference (IV, Random, 95% CI) | ‐4.09 [‐6.30, ‐1.87] |
| 7 Time to first bowel sounds (h) Show forest plot | 2 | 110 | Mean Difference (IV, Random, 95% CI) | ‐6.08 [‐13.77, 1.60] |
| 8 Length of hospital stay (days) Show forest plot | 32 | 2077 | Mean Difference (IV, Random, 95% CI) | ‐0.37 [‐0.60, ‐0.15] |
| 9 Length of hospital stay (outpatient surgery, mins) Show forest plot | 3 | 191 | Mean Difference (IV, Random, 95% CI) | ‐10.81 [‐36.93, 15.31] |
| 10 Surgical complications ‐ anastomotic leak Show forest plot | 3 | 188 | Risk Ratio (M‐H, Random, 95% CI) | 0.61 [0.08, 4.80] |
| 11 Surgical complications ‐ bleeding Show forest plot | 3 | 222 | Risk Ratio (M‐H, Random, 95% CI) | 1.79 [0.41, 7.89] |
| 12 Surgical complications ‐ postoperative infection Show forest plot | 5 | 352 | Risk Ratio (M‐H, Random, 95% CI) | 1.64 [0.41, 6.52] |
| 13 Patient satisfaction Show forest plot | 6 | 306 | Mean Difference (IV, Random, 95% CI) | 0.76 [0.46, 1.06] |
| 14 Postoperative nausea, 'early time points' (PACU) Show forest plot | 8 | 511 | Risk Ratio (M‐H, Random, 95% CI) | 0.72 [0.53, 0.98] |
| 15 Postoperative nausea, 'overall' (0 to 24 h, to 48 h, to 72 h) Show forest plot | 35 | 1903 | Risk Ratio (M‐H, Random, 95% CI) | 0.78 [0.67, 0.91] |
| 16 Postoperative vomiting, 'early time points' (PACU) Show forest plot | 4 | 305 | Risk Ratio (M‐H, Random, 95% CI) | 0.49 [0.16, 1.48] |
| 17 Postoperative vomiting, 'overall' (0 to 24 h, to 48 h, to 72 h) Show forest plot | 19 | 1026 | Risk Ratio (M‐H, Random, 95% CI) | 0.83 [0.63, 1.08] |
| 18 Intraoperative opioid consumption (MEQ, mg) Show forest plot | 18 | 1116 | Mean Difference (IV, Random, 95% CI) | ‐2.14 [‐3.87, ‐0.40] |
| 19 Intraoperative remifentanil consumption (µg) Show forest plot | 6 | 490 | Mean Difference (IV, Random, 95% CI) | ‐14.17 [‐35.27, 6.92] |
| 20 Postoperative opioid consumption, PACU (MEQ, mg) Show forest plot | 21 | 1219 | Mean Difference (IV, Random, 95% CI) | ‐3.10 [‐3.87, ‐2.32] |
| 21 Postoperative opioid consumption, overall (MEQ, mg) Show forest plot | 40 | 2201 | Mean Difference (IV, Random, 95% CI) | ‐4.52 [‐6.25, ‐2.79] |
| Outcome or subgroup title | No. of studies | No. of participants | Statistical method | Effect size |
| 1 Pain score (VAS 0 to 10 cm) at rest, 'intermediate time points' (24 h) Show forest plot | 2 | 102 | Mean Difference (IV, Random, 95% CI) | 1.51 [‐0.29, 3.32] |
| 2 Pain score (VAS 0 to 10 cm) at rest, 'late time points' (48 h) Show forest plot | 2 | 102 | Mean Difference (IV, Random, 95% CI) | 0.98 [‐1.19, 3.16] |
| 3 Time to first bowel movement (h) Show forest plot | 2 | 102 | Mean Difference (IV, Random, 95% CI) | ‐1.66 [‐10.88, 7.56] |
| 4 Length of hospital stay (days) Show forest plot | 2 | 102 | Mean Difference (IV, Random, 95% CI) | ‐0.02 [‐0.38, 0.33] |
| 5 Intraoperative opioid consumption (MEQ, mg) Show forest plot | 2 | 100 | Mean Difference (IV, Random, 95% CI) | 7.27 [‐13.92, 28.47] |