| 1 Patients with 1 or more exacerbations requiring oral corticosteroids Show forest plot | 7 | 1204 | Risk Ratio (M‐H, Fixed, 95% CI) | 1.07 [0.87, 1.32] |
|
| 1.1 Pre‐emptive 4‐fold step‐up ICS dose during exacerbations in both groups | 2 | 264 | Risk Ratio (M‐H, Fixed, 95% CI) | 0.96 [0.44, 2.13] |
| 1.2 Pre‐emptive 4‐fold step‐up ICS dose during exacerbations in intermittent group only | 1 | 278 | Risk Ratio (M‐H, Fixed, 95% CI) | 1.03 [0.80, 1.34] |
| 1.3 'As needed' ICS+β2‐agonist use during exacerbations in both groups | 1 | 107 | Risk Ratio (M‐H, Fixed, 95% CI) | 1.17 [0.67, 2.03] |
| 1.4 'As needed' ICS+β2‐agonist use during exacerbations in intermittent group only | 3 | 555 | Risk Ratio (M‐H, Fixed, 95% CI) | 1.20 [0.71, 2.04] |
| 2 Exacerbations requiring oral corticosteroids: subgroup analysis for age Show forest plot | 7 | 1204 | Risk Ratio (M‐H, Fixed, 95% CI) | 1.07 [0.87, 1.32] |
|
| 2.1 Preschool children | 2 | 498 | Risk Ratio (M‐H, Fixed, 95% CI) | 1.09 [0.85, 1.41] |
| 2.2 School‐aged children | 3 | 329 | Risk Ratio (M‐H, Fixed, 95% CI) | 1.26 [0.84, 1.88] |
| 2.3 Adults | 2 | 377 | Risk Ratio (M‐H, Fixed, 95% CI) | 0.60 [0.26, 1.34] |
| 3 Exacerbations requiring oral corticosteroids: subgroup analysis for duration of treatment Show forest plot | 7 | 1204 | Risk Ratio (M‐H, Fixed, 95% CI) | 1.07 [0.87, 1.32] |
|
| 3.1 12 to 24 weeks | 2 | 448 | Risk Ratio (M‐H, Fixed, 95% CI) | 1.13 [0.37, 3.39] |
| 3.2 44 to 52 weeks | 5 | 756 | Risk Ratio (M‐H, Fixed, 95% CI) | 1.07 [0.87, 1.32] |
| 4 Exacerbations requiring oral corticosteroids: subgroup analysis for severity of airway obstruction Show forest plot | 7 | 1204 | Risk Ratio (M‐H, Fixed, 95% CI) | 1.07 [0.87, 1.32] |
|
| 4.1 Mild airway obstruction | 6 | 1089 | Risk Ratio (M‐H, Fixed, 95% CI) | 1.06 [0.86, 1.30] |
| 4.2 Moderate airway obstruction | 1 | 115 | Risk Ratio (M‐H, Fixed, 95% CI) | 2.95 [0.32, 27.51] |
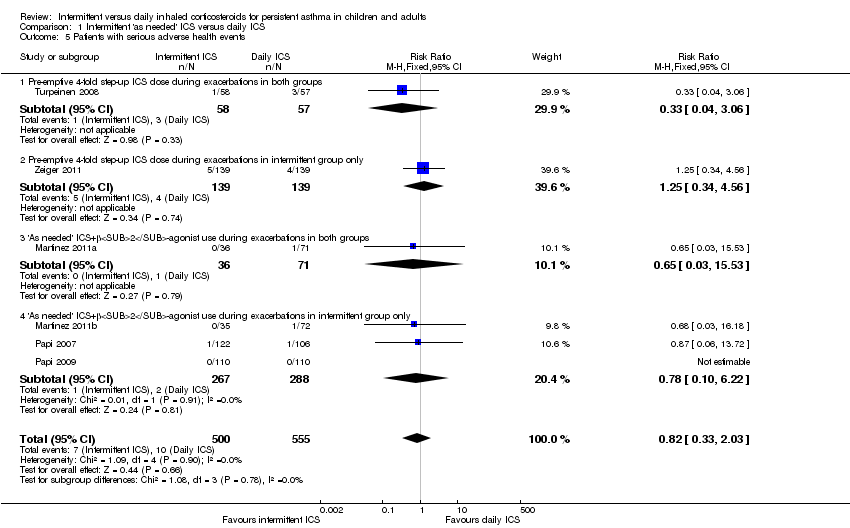
| 5 Patients with serious adverse health events Show forest plot | 6 | 1055 | Risk Ratio (M‐H, Fixed, 95% CI) | 0.82 [0.33, 2.03] |
|
| 5.1 Pre‐emptive 4‐fold step‐up ICS dose during exacerbations in both groups | 1 | 115 | Risk Ratio (M‐H, Fixed, 95% CI) | 0.33 [0.04, 3.06] |
| 5.2 Pre‐emptive 4‐fold step‐up ICS dose during exacerbations in intermittent group only | 1 | 278 | Risk Ratio (M‐H, Fixed, 95% CI) | 1.25 [0.34, 4.56] |
| 5.3 'As needed' ICS+β2‐agonist use during exacerbations in both groups | 1 | 107 | Risk Ratio (M‐H, Fixed, 95% CI) | 0.65 [0.03, 15.53] |
| 5.4 'As needed' ICS+β2‐agonist use during exacerbations in intermittent group only | 3 | 555 | Risk Ratio (M‐H, Fixed, 95% CI) | 0.78 [0.10, 6.22] |
| 6 Patients with at least 1 exacerbation requiring emergency department/acute care visit Show forest plot | 6 | 1055 | Risk Ratio (M‐H, Fixed, 95% CI) | 1.08 [0.90, 1.30] |
|
| 6.1 Pre‐emptive 4‐fold step‐up ICS dose during exacerbations in both groups | 1 | 115 | Risk Ratio (M‐H, Fixed, 95% CI) | 0.98 [0.06, 15.34] |
| 6.2 Pre‐emptive 4‐fold step‐up ICS dose during exacerbations in intermittent group only | 1 | 278 | Risk Ratio (M‐H, Fixed, 95% CI) | 1.08 [0.90, 1.30] |
| 6.3 'As needed' ICS+β2‐agonist use during exacerbations in both groups | 1 | 107 | Risk Ratio (M‐H, Fixed, 95% CI) | 0.0 [0.0, 0.0] |
| 6.4 'As needed' ICS+β2‐agonist use during exacerbations in intermittent group only | 3 | 555 | Risk Ratio (M‐H, Fixed, 95% CI) | 0.0 [0.0, 0.0] |
| 7 Patients with at least 1 exacerbation requiring hospital admission Show forest plot | 7 | 1204 | Risk Ratio (M‐H, Fixed, 95% CI) | 0.85 [0.29, 2.49] |
|
| 7.1 Pre‐emptive 4‐fold step‐up ICS dose during exacerbations in both groups | 2 | 264 | Risk Ratio (M‐H, Fixed, 95% CI) | 0.33 [0.04, 3.06] |
| 7.2 Pre‐emptive 4‐fold step‐up ICS dose during exacerbations in intermittent group only | 1 | 278 | Risk Ratio (M‐H, Fixed, 95% CI) | 1.25 [0.34, 4.56] |
| 7.3 'As needed' ICS+β2‐agonist use during exacerbations in both groups | 1 | 107 | Risk Ratio (M‐H, Fixed, 95% CI) | 0.0 [0.0, 0.0] |
| 7.4 'As needed' ICS+β2‐agonist use during exacerbations in intermittent group only | 3 | 555 | Risk Ratio (M‐H, Fixed, 95% CI) | 0.0 [0.0, 0.0] |
| 8 Number of exacerbations requiring emergency department visits Show forest plot | 2 | 264 | Risk Ratio (M‐H, Fixed, 95% CI) | 0.69 [0.14, 3.44] |
|
| 8.1 Pre‐emptive 4‐fold step‐up ICS dose during exacerbations in both groups | 2 | 264 | Risk Ratio (M‐H, Fixed, 95% CI) | 0.69 [0.14, 3.44] |
| 9 Time to exacerbation requiring oral corticosteroids Show forest plot | 3 | | Hazard Ratio (Random, 95% CI) | 0.88 [0.55, 1.40] |
|
| 9.1 Pre‐emptive 4‐fold step‐up ICS dose during exacerbations in intermittent group only | 1 | | Hazard Ratio (Random, 95% CI) | 0.97 [0.68, 1.38] |
| 9.2 'As needed' ICS+β2‐agonist use during exacerbations in both groups | 1 | | Hazard Ratio (Random, 95% CI) | 0.60 [0.36, 1.01] |
| 9.3 'As needed' ICS+β2‐agonist use during exacerbations in intermittent group only | 1 | | Hazard Ratio (Random, 95% CI) | 1.93 [0.55, 6.76] |
| 10 Change from baseline AM PEFR (%) Show forest plot | 3 | 350 | Mean Difference (IV, Fixed, 95% CI) | ‐2.56 [‐4.49, ‐0.63] |
|
| 10.1 Pre‐emptive 4‐fold step‐up ICS dose during exacerbations in both groups | 1 | 136 | Mean Difference (IV, Fixed, 95% CI) | ‐1.20 [‐6.61, 4.21] |
| 10.2 'As needed' ICS+β2‐agonist use during exacerbations in both groups | 1 | 107 | Mean Difference (IV, Fixed, 95% CI) | ‐2.42 [‐5.34, 0.50] |
| 10.3 'As needed' ICS+β2‐agonist use during exacerbations in intermittent group only | 1 | 107 | Mean Difference (IV, Fixed, 95% CI) | ‐3.10 [‐6.02, ‐0.18] |
| 11 Change from baseline AM PEFR (L/min) Show forest plot | 1 | | Mean Difference (IV, Fixed, 95% CI) | Totals not selected |
|
| 11.1 'As needed' ICS+β2‐agonist use during exacerbations in intermittent group only | 1 | | Mean Difference (IV, Fixed, 95% CI) | 0.0 [0.0, 0.0] |
| 12 Change from baseline FEV1 (%) Show forest plot | 2 | 365 | Mean Difference (IV, Random, 95% CI) | ‐0.49 [‐5.82, 4.84] |
|
| 12.1 Pre‐emptive 4‐fold step‐up ICS dose during exacerbations in both groups | 1 | 137 | Mean Difference (IV, Random, 95% CI) | ‐3.3 [‐6.49, ‐0.11] |
| 12.2 'As needed' ICS+β2‐agonist use during exacerbations in intermittent group only | 1 | 228 | Mean Difference (IV, Random, 95% CI) | 2.14 [‐0.40, 4.68] |
| 13 Change from baseline FEV1 (L) Show forest plot | 1 | | Mean Difference (IV, Fixed, 95% CI) | Totals not selected |
|
| 13.1 'As needed' ICS+β2‐agonist use during exacerbations in intermittent group only | 1 | | Mean Difference (IV, Fixed, 95% CI) | 0.0 [0.0, 0.0] |
| 14 Change from baseline mean diurnal variation in PEFR Show forest plot | 3 | 442 | Mean Difference (IV, Fixed, 95% CI) | 0.02 [‐0.71, 0.76] |
|
| 14.1 'As needed' ICS+β2‐agonist use during exacerbations in both groups | 1 | 107 | Mean Difference (IV, Fixed, 95% CI) | ‐0.14 [‐1.42, 1.14] |
| 14.2 'As needed' ICS+β2‐agonist use during exacerbations in intermittent group only | 2 | 335 | Mean Difference (IV, Fixed, 95% CI) | 0.10 [‐0.79, 1.00] |
| 15 Change in PC20 Show forest plot | 1 | | Mean Difference (IV, Fixed, 95% CI) | Totals not selected |
|
| 15.1 Pre‐emptive 4‐fold step‐up ICS dose during exacerbations in both groups | 1 | | Mean Difference (IV, Fixed, 95% CI) | 0.0 [0.0, 0.0] |
| 16 Change from baseline in asthma control days Show forest plot | 2 | 214 | Mean Difference (IV, Fixed, 95% CI) | ‐0.07 [‐0.14, ‐0.01] |
|
| 16.1 'As needed' ICS+β2‐agonist use during exacerbations in both groups | 1 | 107 | Mean Difference (IV, Fixed, 95% CI) | ‐0.06 [‐0.15, 0.04] |
| 16.2 'As needed' ICS+β2‐agonist use during exacerbations in intermittent group only | 1 | 107 | Mean Difference (IV, Fixed, 95% CI) | ‐0.09 [‐0.18, 0.01] |
| 17 Proportion of asthma control days over the period Show forest plot | 3 | 330 | Mean Difference (IV, Fixed, 95% CI) | ‐0.09 [‐0.14, ‐0.04] |
|
| 17.1 Pre‐emptive 4‐fold step‐up ICS dose during exacerbations in both groups | 1 | 116 | Mean Difference (IV, Fixed, 95% CI) | 0.0 [0.0, 0.0] |
| 17.2 'As needed' ICS+β2‐agonist use during exacerbations in both groups | 1 | 107 | Mean Difference (IV, Fixed, 95% CI) | ‐0.09 [‐0.16, ‐0.02] |
| 17.3 'As needed' ICS+β2‐agonist use during exacerbations in intermittent group only | 1 | 107 | Mean Difference (IV, Fixed, 95% CI) | ‐0.09 [‐0.16, ‐0.02] |
| 18 Change from baseline mean daily use of β2‐agonists (puffs/day) Show forest plot | 3 | 442 | Mean Difference (IV, Fixed, 95% CI) | 0.12 [0.00, 0.23] |
|
| 18.1 'As needed' ICS+β2‐agonist use during exacerbations in both groups | 1 | 107 | Mean Difference (IV, Fixed, 95% CI) | 0.15 [‐0.05, 0.35] |
| 18.2 'As needed' ICS+β2‐agonist use during exacerbations in intermittent group only | 2 | 335 | Mean Difference (IV, Fixed, 95% CI) | 0.10 [‐0.04, 0.24] |
| 19 Cumulative dose of rescue albuterol (μg) over the period Show forest plot | 2 | 214 | Mean Difference (IV, Fixed, 95% CI) | 51.47 [11.36, 91.57] |
|
| 19.1 'As needed' ICS+β2‐agonist use during exacerbations in both groups | 1 | 107 | Mean Difference (IV, Fixed, 95% CI) | 59.30 [4.83, 113.77] |
| 19.2 'As needed' ICS+β2‐agonist use during exacerbations in intermittent group only | 1 | 107 | Mean Difference (IV, Fixed, 95% CI) | 42.2 [‐17.06, 101.46] |
| 20 Change from baseline in daytime symptom scores Show forest plot | 3 | 591 | Std. Mean Difference (IV, Fixed, 95% CI) | 0.13 [‐0.04, 0.29] |
|
| 20.1 Pre‐emptive 4‐fold step‐up ICS dose during exacerbations in both groups | 1 | 143 | Std. Mean Difference (IV, Fixed, 95% CI) | 0.15 [‐0.18, 0.48] |
| 20.2 'As needed' ICS+β2‐agonist use during exacerbations in intermittent group only | 2 | 448 | Std. Mean Difference (IV, Fixed, 95% CI) | 0.12 [‐0.07, 0.30] |
| 21 Change from baseline in asthma symptoms utility index Show forest plot | 1 | | Mean Difference (IV, Fixed, 95% CI) | Totals not selected |
|
| 21.1 Pre‐emptive 4‐fold step‐up ICS dose during exacerbations in both groups | 1 | | Mean Difference (IV, Fixed, 95% CI) | 0.0 [0.0, 0.0] |
| 22 Change in proportion of 'symptom‐free days' Show forest plot | 5 | 984 | Std. Mean Difference (IV, Fixed, 95% CI) | ‐0.15 [‐0.28, ‐0.03] |
|
| 22.1 Pre‐emptive 4‐fold step‐up ICS dose during exacerbations in both groups | 2 | 258 | Std. Mean Difference (IV, Fixed, 95% CI) | ‐0.32 [‐0.57, ‐0.07] |
| 22.2 Pre‐emptive 4‐fold step‐up ICS dose during exacerbations in intermittent group only | 1 | 278 | Std. Mean Difference (IV, Fixed, 95% CI) | 0.0 [‐0.24, 0.24] |
| 22.3 'As needed' ICS+β2‐agonist use during exacerbations in intermittent group only | 2 | 448 | Std. Mean Difference (IV, Fixed, 95% CI) | ‐0.15 [‐0.34, 0.03] |
| 23 Change from baseline in night‐time awakenings Show forest plot | 2 | 448 | Mean Difference (IV, Fixed, 95% CI) | ‐0.03 [‐0.08, 0.02] |
|
| 23.1 'As needed' ICS+β2‐agonist use during exacerbations in intermittent group only | 2 | 448 | Mean Difference (IV, Fixed, 95% CI) | ‐0.03 [‐0.08, 0.02] |
| 24 Change from baseline in quality of life (QoL) Show forest plot | 2 | 389 | Std. Mean Difference (IV, Fixed, 95% CI) | ‐0.16 [‐0.36, 0.04] |
|
| 24.1 Pre‐emptive 4‐fold step‐up ICS dose during exacerbations in both groups | 1 | 137 | Std. Mean Difference (IV, Fixed, 95% CI) | ‐0.24 [‐0.58, 0.10] |
| 24.2 Pre‐emptive 4‐fold step‐up ICS dose during exacerbations in intermittent group only | 1 | 252 | Std. Mean Difference (IV, Fixed, 95% CI) | ‐0.11 [‐0.36, 0.14] |
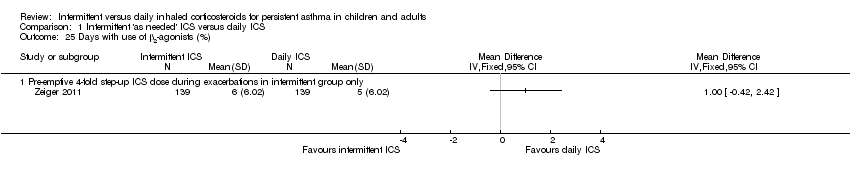
| 25 Days with use of β2‐agonists (%) Show forest plot | 1 | | Mean Difference (IV, Fixed, 95% CI) | Totals not selected |
|
| 25.1 Pre‐emptive 4‐fold step‐up ICS dose during exacerbations in intermittent group only | 1 | | Mean Difference (IV, Fixed, 95% CI) | 0.0 [0.0, 0.0] |
| 26 Change in exhaled nitric oxide (ppb) Show forest plot | 2 | 214 | Mean Difference (IV, Fixed, 95% CI) | 16.80 [11.95, 21.64] |
|
| 26.1 'As needed' ICS+β2‐agonist use during exacerbations in both groups | 1 | 107 | Mean Difference (IV, Fixed, 95% CI) | 18.16 [11.09, 25.23] |
| 26.2 'As needed' ICS+β2‐agonist use during exacerbations in intermittent group only | 1 | 107 | Mean Difference (IV, Fixed, 95% CI) | 15.59 [8.94, 22.24] |
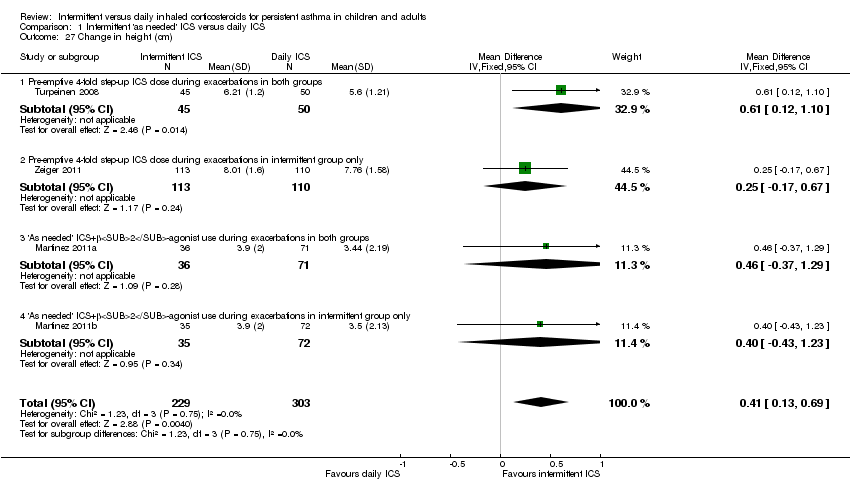
| 27 Change in height (cm) Show forest plot | 4 | 532 | Mean Difference (IV, Fixed, 95% CI) | 0.41 [0.13, 0.69] |
|
| 27.1 Pre‐emptive 4‐fold step‐up ICS dose during exacerbations in both groups | 1 | 95 | Mean Difference (IV, Fixed, 95% CI) | 0.61 [0.12, 1.10] |
| 27.2 Pre‐emptive 4‐fold step‐up ICS dose during exacerbations in intermittent group only | 1 | 223 | Mean Difference (IV, Fixed, 95% CI) | 0.25 [‐0.17, 0.67] |
| 27.3 'As needed' ICS+β2‐agonist use during exacerbations in both groups | 1 | 107 | Mean Difference (IV, Fixed, 95% CI) | 0.46 [‐0.37, 1.29] |
| 27.4 'As needed' ICS+β2‐agonist use during exacerbations in intermittent group only | 1 | 107 | Mean Difference (IV, Fixed, 95% CI) | 0.40 [‐0.43, 1.23] |
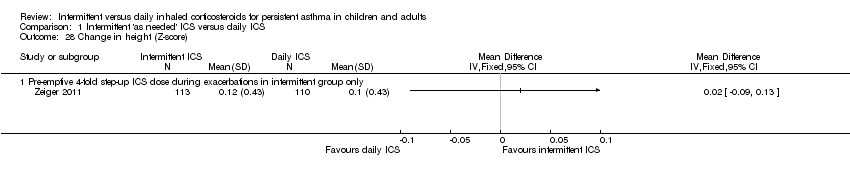
| 28 Change in height (Z‐score) Show forest plot | 1 | | Mean Difference (IV, Fixed, 95% CI) | Totals not selected |
|
| 28.1 Pre‐emptive 4‐fold step‐up ICS dose during exacerbations in intermittent group only | 1 | | Mean Difference (IV, Fixed, 95% CI) | 0.0 [0.0, 0.0] |
| 29 Change in weight (Z‐score) Show forest plot | 1 | | Mean Difference (IV, Fixed, 95% CI) | Totals not selected |
|
| 29.1 Pre‐emptive 4‐fold step‐up ICS dose during exacerbations in intermittent group only | 1 | | Mean Difference (IV, Fixed, 95% CI) | 0.0 [0.0, 0.0] |
| 30 Change in weight (kg) Show forest plot | 1 | | Mean Difference (IV, Fixed, 95% CI) | Totals not selected |
|
| 30.1 Pre‐emptive 4‐fold step‐up ICS dose during exacerbations in intermittent group only | 1 | | Mean Difference (IV, Fixed, 95% CI) | 0.0 [0.0, 0.0] |
| 31 Salivary cortisol level Show forest plot | 1 | | Mean Difference (IV, Fixed, 95% CI) | Totals not selected |
|
| 31.1 'As needed' ICS+β2‐agonist use during exacerbations in intermittent group only | 1 | | Mean Difference (IV, Fixed, 95% CI) | 0.0 [0.0, 0.0] |
| 32 Overall withdrawals Show forest plot | 7 | 1210 | Odds Ratio (M‐H, Fixed, 95% CI) | 1.05 [0.75, 1.46] |
|
| 32.1 Pre‐emptive 4‐fold step‐up ICS dose during exacerbations in both groups | 2 | 264 | Odds Ratio (M‐H, Fixed, 95% CI) | 1.54 [0.71, 3.34] |
| 32.2 Pre‐emptive 4‐fold step‐up ICS dose during exacerbations in intermittent group only | 1 | 278 | Odds Ratio (M‐H, Fixed, 95% CI) | 0.59 [0.34, 1.04] |
| 32.3 'As needed' ICS+β2‐agonist use during exacerbations in both groups | 1 | 107 | Odds Ratio (M‐H, Fixed, 95% CI) | 1.90 [0.63, 5.74] |
| 32.4 'As needed' ICS+β2‐agonist use during exacerbations in intermittent group only | 3 | 561 | Odds Ratio (M‐H, Fixed, 95% CI) | 1.32 [0.75, 2.30] |
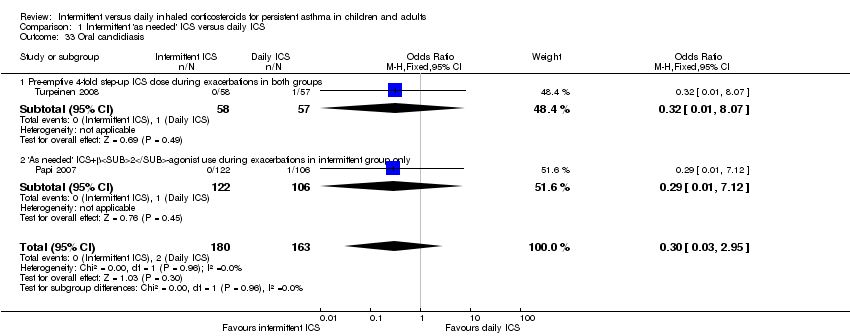
| 33 Oral candidiasis Show forest plot | 2 | 343 | Odds Ratio (M‐H, Fixed, 95% CI) | 0.30 [0.03, 2.95] |
|
| 33.1 Pre‐emptive 4‐fold step‐up ICS dose during exacerbations in both groups | 1 | 115 | Odds Ratio (M‐H, Fixed, 95% CI) | 0.32 [0.01, 8.07] |
| 33.2 'As needed' ICS+β2‐agonist use during exacerbations in intermittent group only | 1 | 228 | Odds Ratio (M‐H, Fixed, 95% CI) | 0.29 [0.01, 7.12] |
| 34 Withdrawal owing to adverse events Show forest plot | 6 | 1063 | Odds Ratio (M‐H, Fixed, 95% CI) | 0.78 [0.21, 2.93] |
|
| 34.1 Pre‐emptive 4‐fold step‐up ICS dose during exacerbations in both groups | 1 | 117 | Odds Ratio (M‐H, Fixed, 95% CI) | 0.33 [0.01, 8.35] |
| 34.2 Pre‐emptive 4‐fold step‐up ICS dose during exacerbations in intermittent group only | 1 | 278 | Odds Ratio (M‐H, Fixed, 95% CI) | 0.20 [0.01, 4.14] |
| 34.3 'As needed' ICS+β2‐agonist use during exacerbations in both groups | 1 | 107 | Odds Ratio (M‐H, Fixed, 95% CI) | 0.0 [0.0, 0.0] |
| 34.4 'As needed' ICS+β2‐agonist use during exacerbations in intermittent group only | 3 | 561 | Odds Ratio (M‐H, Fixed, 95% CI) | 2.85 [0.29, 27.61] |
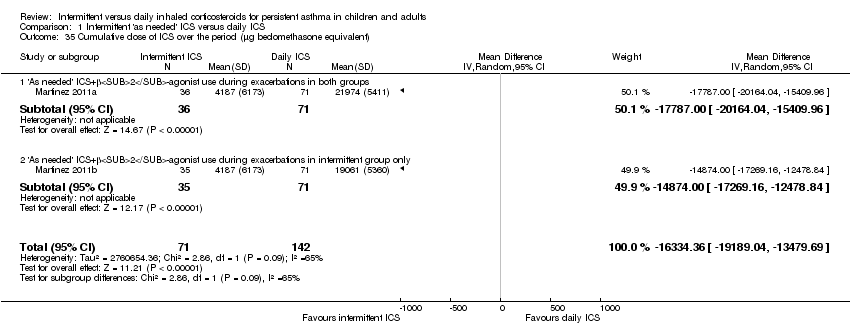
| 35 Cumulative dose of ICS over the period (μg beclomethasone equivalent) Show forest plot | 2 | 213 | Mean Difference (IV, Random, 95% CI) | ‐16334.36 [‐19189.04, ‐13479.69] |
|
| 35.1 'As needed' ICS+β2‐agonist use during exacerbations in both groups | 1 | 107 | Mean Difference (IV, Random, 95% CI) | ‐17787.0 [‐20164.04, ‐15409.96] |
| 35.2 'As needed' ICS+β2‐agonist use during exacerbations in intermittent group only | 1 | 106 | Mean Difference (IV, Random, 95% CI) | ‐14874.0 [‐17269.16, ‐12478.84] |
| 36 Overall adverse effects Show forest plot | 3 | 726 | Odds Ratio (M‐H, Fixed, 95% CI) | 1.01 [0.70, 1.44] |
|
| 36.1 Pre‐emptive 4‐fold step‐up ICS dose during exacerbations in intermittent group only | 1 | 278 | Odds Ratio (M‐H, Fixed, 95% CI) | 0.94 [0.46, 1.90] |
| 36.2 'As needed' ICS+β2‐agonist use during exacerbations in intermittent group only | 2 | 448 | Odds Ratio (M‐H, Fixed, 95% CI) | 1.03 [0.68, 1.57] |
| 37 Withdrawal owing to poor asthma control/exacerbations Show forest plot | 6 | 1063 | Odds Ratio (M‐H, Random, 95% CI) | 1.66 [0.54, 5.13] |
|
| 37.1 Pre‐emptive 4‐fold step‐up ICS dose during exacerbations in both groups | 1 | 117 | Odds Ratio (M‐H, Random, 95% CI) | 3.43 [0.88, 13.38] |
| 37.2 Pre‐emptive 4‐fold step‐up ICS dose during exacerbations in intermittent group only | 1 | 278 | Odds Ratio (M‐H, Random, 95% CI) | 0.28 [0.08, 1.06] |
| 37.3 'As needed' ICS+β2‐agonist use during exacerbations in both groups | 1 | 107 | Odds Ratio (M‐H, Random, 95% CI) | 2.70 [0.68, 10.76] |
| 37.4 'As needed' ICS+β2‐agonist use during exacerbations in intermittent group only | 3 | 561 | Odds Ratio (M‐H, Random, 95% CI) | 2.44 [0.39, 15.41] |
| 38 Pneumonia Show forest plot | 1 | | Odds Ratio (M‐H, Fixed, 95% CI) | Totals not selected |
|
| 38.1 Pre‐emptive 4‐fold step‐up ICS dose during exacerbations in intermittent group only | 1 | | Odds Ratio (M‐H, Fixed, 95% CI) | 0.0 [0.0, 0.0] |
| 39 Nausea Show forest plot | 2 | 393 | Odds Ratio (M‐H, Fixed, 95% CI) | 1.16 [0.54, 2.51] |
|
| 39.1 Pre‐emptive 4‐fold step‐up ICS dose during exacerbations in both groups | 1 | 115 | Odds Ratio (M‐H, Fixed, 95% CI) | 0.98 [0.23, 4.13] |
| 39.2 Pre‐emptive 4‐fold step‐up ICS dose during exacerbations in intermittent group only | 1 | 278 | Odds Ratio (M‐H, Fixed, 95% CI) | 1.24 [0.50, 3.10] |
| 40 Headache Show forest plot | 1 | | Odds Ratio (M‐H, Fixed, 95% CI) | Totals not selected |
|
| 40.1 Pre‐emptive 4‐fold step‐up ICS dose during exacerbations in both groups | 1 | | Odds Ratio (M‐H, Fixed, 95% CI) | 0.0 [0.0, 0.0] |
| 41 Upper respiratory tract infections Show forest plot | 2 | 393 | Odds Ratio (M‐H, Fixed, 95% CI) | 1.47 [0.89, 2.43] |
|
| 41.1 Pre‐emptive 4‐fold step‐up ICS dose during exacerbations in both groups | 1 | 115 | Odds Ratio (M‐H, Fixed, 95% CI) | 0.0 [0.0, 0.0] |
| 41.2 Pre‐emptive 4‐fold step‐up ICS dose during exacerbations in intermittent group only | 1 | 278 | Odds Ratio (M‐H, Fixed, 95% CI) | 1.47 [0.89, 2.43] |
| 42 Death Show forest plot | 2 | 393 | Odds Ratio (M‐H, Fixed, 95% CI) | 0.0 [0.0, 0.0] |
|
| 42.1 Pre‐emptive 4‐fold step‐up ICS dose during exacerbations in both groups | 1 | 115 | Odds Ratio (M‐H, Fixed, 95% CI) | 0.0 [0.0, 0.0] |
| 42.2 Pre‐emptive 4‐fold step‐up ICS dose during exacerbations in intermittent group only | 1 | 278 | Odds Ratio (M‐H, Fixed, 95% CI) | 0.0 [0.0, 0.0] |