Совместное или последовательное применение парацетамола и ибупрофена при лечении лихорадки у детей
Referencias
References to studies included in this review
References to studies excluded from this review
Additional references
Characteristics of studies
Characteristics of included studies [ordered by study ID]
Ir a:
| Methods | Study design: open label, three‐arm randomized trial. Study dates and duration: October 2004 to January 2005. Method of temperature measurement: tympanometric thermometer. Time points measured in study: admission, T0 (time medication given), hour 1 and 2 (if patient not discharged). | |
| Participants | Number: 123 randomized. Number of patients in each intervention: paracetamol n=41, ibuprofen n=42, paracetamol plus ibuprofen n=40. Inclusion criteria: consecutive children between 6 months and 10 years old with a fever of 38 °C. Exclusion criteria: paracetamol or ibuprofen given in the previous six hours, severe or life threatening infection, suspected chicken pox, cellulitis or other spreading skin infection, known to be immunosuppressed, allergy to either ibuprofen or paracetamol, medicated with warfarin, heparin or antihypertensives, symptoms of active gastrointestinal bleeding, known coagulopathy, acute jaundice, likely dehydration, defined as more than four episodes of diarrhoea or vomiting in the previous 24 hours, asthma, defined as a need for regular 'preventer' medication, chronic renal, liver or cardiac failure. Baseline characteristics:
| |
| Interventions | Group 1: paracetamol 15 mg/kg Group 2: ibuprofen 5 mg/kg Group 3: paracetamol 15 mg/kg + ibuprofen 5 mg/kg Frequency of administration: single dose of each | |
| Outcomes | Primary
Secondary
| |
| Notes | Location: Bristol, UK Setting: single centre ‐ Children's Emergency Department, Bristol. Funding: the Anthony Hopkins Memorial Prize, awarded by the Faculty of Accident and Emergency Medicine as an unrestricted award to the Emergency Department. | |
| Risk of bias | ||
| Bias | Authors' judgement | Support for judgement |
| Random sequence generation (selection bias) | Low risk | The allocation sequence was block randomized and generated independently of the research team. |
| Allocation concealment (selection bias) | Low risk | Allocations were placed in sequentially numbered sealed opaque envelopes. |
| Blinding of participants and personnel (performance bias) | Low risk | Open label trial, however temperature is an objective measurement that should not be subject to bias from lack of blinding. |
| Blinding of outcome assessment (detection bias) | Low risk | This was an open label trial, however temperature is an objective measurement that should not be subject to bias from lack of blinding. |
| Incomplete outcome data (attrition bias) | Unclear risk | No reasons given for missing data or patients withdrawn. Subjects withdrawn or missing data: combined 9%, ibuprofen 14.7%, paracetamol 9%. |
| Selective reporting (reporting bias) | High risk |
|
| Other bias | Unclear risk | Potential baseline imbalance: higher proportion of patients in combined group were admitted to hospital compared with other groups. |
| Methods | Study design: individually‐randomized, blinded three‐arm trial. Study dates and duration: January 2005 to May 2007. Method of temperature measurement: axillary continuous probe for 24 hours, then standard digital axillary thermometer for home measurements. Time points measured in study: temperature taken every 30 seconds using axillary temperature probe for first 24 hours, then as needed with standard axillary thermometer at home. | |
| Participants | Number: 156 randomized. Number of patients in each intervention: paracetamol n=52, ibuprofen n=52, paracetamol plus Ibuprofen n=52. Inclusion criteria: children aged 6 months to 6 years in the primary care setting and households in England. Required axillary temperatures of at least 37.8 °C and up to 41 °C. Exclusion criteria: if patients required hospital admission, clinically dehydrated; had recently participated in another trial; had previously participated in PITCH; had a known intolerance, allergy or contraindication to a trial drug; had a chronic neurological, cardiac, pulmonary (except asthma), liver or renal disease; or had parents who could not read or write in English. Baseline characteristics:
| |
| Interventions | Group A: paracetamol 15 mg/kg every 4‐6 hours Group B: ibuprofen 10 mg/kg every 6‐8 hours Group C: paracetamol + ibuprofen alternating Advice was given to parents to give the study drugs for up to 48 hours | |
| Outcomes | Primary:
Secondary:
| |
| Notes | Location: England Setting: multi‐centre – 35 primary care sites (NHS Direct, one walk‐in centre, 30 general practices, two general practitioner out of hours cooperatives, and the emergency department of the Bristol Royal Hospital for Children) and households. Funding: National Institute for Health Research Health Technology Programme. | |
| Risk of bias | ||
| Bias | Authors' judgement | Support for judgement |
| Random sequence generation (selection bias) | Low risk | Randomization sequence was generated via a remote, automated telephone service provided by the Health Services Research Unit at the University of Aberdeen. |
| Allocation concealment (selection bias) | Low risk | After written informed consent had been obtained and the baseline questionnaire completed, the research nurse telephoned a remote, automated randomization service. |
| Blinding of participants and personnel (performance bias) | Low risk | Study medication identity was concealed. |
| Blinding of outcome assessment (detection bias) | Low risk | Research nurse was blinded to process. |
| Incomplete outcome data (attrition bias) | Unclear risk | Article did not address why three patients (one from ibuprofen and two from ibuprofen plus paracetamol group) had missing data for time without fever. "Attrition was minimal." "Thus, children were omitted from analyses only if none of the data required were available, and as these were so few in number the influence of missing data on the intention‐to‐treat analyses was negligible." |
| Selective reporting (reporting bias) | Low risk | All assessed outcomes were reported. |
| Other bias | Low risk | The possibility of receiving either or both drugs combined and the severity of the child's illness may have influenced parental decision to participate. |
| Methods | Study design: prospective, randomized double‐blind placebo control study. Study dates and duration: January 2004 to January 2006. Method of temperature measurement: children > 2 years oral, Children < 2 years rectal. Parents given thermometers for home use. Time points measured in study:temperature measurements at hours 0, 3, 4, 5, 6. | |
| Participants | Number: 40 randomized. Number of patients in each intervention: paracetamol n=19, paracetamol alternating with ibuprofen n=19. Inclusion criteria: healthy children presenting to the out patient clinic with chief complaint of fever. Fever in clinic > 38 °C Exclusion criteria: history of any antipyretic use in the preceding 4 hours or if they had an allergy or other medical contraindication to the medications. Baseline characteristics:
| |
| Interventions | Group A: paracetamol (15 mg/kg) alternated with placebo Group B: paracetamol (15 mg/kg) alternating with Ibuprofen (10 mg/kg) Administration regime: Time Group A Group B 0 APAP APAP 3 placebo ibuprofen 4 APAP placebo | |
| Outcomes | Primary:
Secondary:
| |
| Notes | Location: Washington, USA Setting: single centre: pediatric clinic at Madigan Army Medical centre in Tacoma, Washington. Funding: Resident Research Grant from the American Academy of Pediatrics. | |
| Risk of bias | ||
| Bias | Authors' judgement | Support for judgement |
| Random sequence generation (selection bias) | Low risk | Children were assigned to treatment group A or B using previously generated computer based randomization blocks performed by the Department of Clinical investigation. |
| Allocation concealment (selection bias) | Unclear risk | Each caretaker received a sealed envelope containing their randomization sequence. No mention of the envelope being opaque. |
| Blinding of participants and personnel (performance bias) | Low risk | Parents and investigators remained blinded to the regimen each child had received. Pharmacist was unblinded, but did not assess patients. |
| Blinding of outcome assessment (detection bias) | Low risk | Parents and investigators who measured temperature remained blinded to the regimen each child received. |
| Incomplete outcome data (attrition bias) | Low risk | All subjects were accounted for. Loss to follow up: alternating group 0.5%, paracetamol 0.5%. |
| Selective reporting (reporting bias) | Low risk | All assessed outcomes were reported. |
| Other bias | Low risk | |
| Methods | Study design: randomized, double‐blind and placebo‐controlled clinical trial. Study dates and duration: November 2002 to April 2005. Method of temperature measurement: rectal. Each patient used the same thermometer for the whole duration of study (SureTemp 679, Welch Allyn). Time points measured in study: baseline rectal temperature at T0 then at hours 4, 5, 6, 7, 8. | |
| Participants | Number: 70 randomized Number of patients in each intervention: combined ibuprofen & paracetamol n=37, ibuprofen & placebo n=33. Inclusion criteria: febrile inpatients aged 6 months – 14 years, with rectal temp ≥ 38.8 °C. Exclusion criteria: vomiting, any medical or surgical condition that precluded oral drug administration, acute or chronic hepatic disease, malabsorption syndromes, acute or chronic renal disease with the exception of UTI, chronic metabolic disease, bleeding disorders, asthma, chronic neurological disease that may affect central thermoregulation, cancer, immune suppression, sepsis, critical medical status or known allergy to paracetamol or ibuprofen. Baseline characteristics:
| |
| Interventions | Control: ibuprofen 10 mg/kg followed by placebo 4 hours later Treatment group: single oral dose ibuprofen 10 mg/kg followed by single oral dose paracetamol 15 mg/kg 4 hours later | |
| Outcomes | Primary:
Secondary:
| |
| Notes | Location: Lebanon Setting: multi‐centre. This study was conducted in the paediatric inpatient services of two hospitals in Beirut: the American University of Beirut Medical Centre (AUBMC), which is a tertiary care facility; and Najjar Hospital, a secondary care facility. Funding: this study was funded by the Medical Practice Plan of the Faculty of Medicine at the American University of Beirut, Grant number 686056. Gulf Pharmaceutical Industries, United Arab Emirates, donated all the drugs investigated. | |
| Risk of bias | ||
| Bias | Authors' judgement | Support for judgement |
| Random sequence generation (selection bias) | Low risk | Children enrolled in the study were assigned a random number by the hospital pharmacist according to a computer‐generated random‐number list, which was kept with the pharmacist until the end of the study. |
| Allocation concealment (selection bias) | Low risk | The allocation sequence was generated by one of the co‐investigators who was not involved in subject recruitment, drug administration or outcome assessment. |
| Blinding of participants and personnel (performance bias) | Low risk | Subjects, parents and research assistant were blinded. |
| Blinding of outcome assessment (detection bias) | Low risk | Nurses responsible for drug administration and outcome assessment, treating physicians were blinded to patients' assignment. |
| Incomplete outcome data (attrition bias) | Low risk | Intent‐to‐treat analysis was planned. Loss to follow up: combined group 3%, ibuprofen group 0%. |
| Selective reporting (reporting bias) | Low risk | All assessed outcomes were reported. |
| Other bias | Unclear risk | Forced to stop the trial before achieving the calculated sample size. |
| Methods | Study design: three‐arm, randomized, controlled trial. Study dates and duration: March 2006 to July 2009. Method of temperature measurement: temporal artery thermometer. Time points measured in study: hourly for 6 hours. | |
| Participants | Number: 46 patients; among the 46 patients, 8 participated twice, 3 participated 3 times and 35 participated only once, contributing to 60 febrile episodes that were randomly assigned into the 3 treatment groups. Number of patients in each intervention: 20 episodes per group. Inclusion criteria: 6 months ‐ 8 years with temperature ≥38 °C. Required to demonstrate an ability to cooperate with serial temporal artery temperature measurements and to take medications by mouth Exclusion criteria: Received paracetamol within 6 hours of presentation or ibuprofen, aspirin or other NSAIDs within 8 hours of presentation. Other major exclusions included weight > 60kg (to avoid surpassing 600 mg of ibuprofen or 1000 mg of paracetamol in a single dose), a history of adverse reaction to any study medication ingredient, diabetes mellitus, renal dysfunction, hepatic dysfunction, thrombocytopenia, or presence of moderate or severe dehydration. Children were also excluded if medical judgement determined that the severity of the underlying illness prohibited inclusion or if the child had already participated in the trial on 3 previous occasions. Baseline characteristics:
| |
| Interventions | Treatment group A: single dose ibuprofen 10 mg/kg (oral suspension 100 mg/5 mL) Treatment group B: single dose APAP 15 mg/kg (oral solution USP 160 mg/5 mL) plus ibuprofen 10 mg/kg Treatment group C: ibuprofen 10 mg/kg at the beginning of the study followed by 15 mg/kg of APAP 3 hours later | |
| Outcomes | Primary:
| |
| Notes | Location: USA Setting: one academic medical centre in Hershey, Pennsylvania, USA; patients recruited from outpatient clinics and child day‐care facilities. Funding: this study was supported by a research grant from the George L. Laverty Foundation and in part by a General clinical Research Centre grant from the National Institutes of Health and a CGRC Construction Grant awarded to the Pennsylvania State University College of Medicine. Disclosure: first author has been a paid consultant for the Consumer Healthcare Products Association, McNeil Consumer Healthcare, Novartis Consumer Health, Inc., Procter & Gamble, and Reckitt Benckiser Healthcare International Ltd., but no industry employees were involved in any aspect of the study. 11 patients participated ≥ 2 times (maximum 3 times). | |
| Risk of bias | ||
| Bias | Authors' judgement | Support for judgement |
| Random sequence generation (selection bias) | Low risk | Each child was randomly assigned to 1 of 3 treatment groups according to a computer‐generated log. |
| Allocation concealment (selection bias) | Unclear risk | Not specified. |
| Blinding of participants and personnel (performance bias) | Low risk | No attempt was made to blind the participants, however temperature is an objective measurement that should not be subject to bias from lack of blinding. |
| Blinding of outcome assessment (detection bias) | Low risk | No attempt was made to blind the research nurses, however temperature is an objective measurement that should not be subject to bias from lack of blinding. |
| Incomplete outcome data (attrition bias) | Low risk | No loss of participants during the study. |
| Selective reporting (reporting bias) | Low risk | All assessed outcomes were reported. |
| Other bias | Low risk | |
| Methods | Study design: randomized, double‐blind, parallel‐group trial. Study dates and duration: September 2003 to March 2004. Method of temperature measurement: rectal glass and mercury thermometer. Time points measured in study: daily temperature diary (parents asked to measure rectal temp at least 3 times daily during tx then once daily x 10 days), telephone interview at 24 hours and 48 hours, office visit day 3, 5, 10, and 14 day follow up evaluation. | |
| Participants | Number: 480 Number of patients in each intervention: 160 in each of the 3 groups. Inclusion criteria: all consecutive children aged 6 ‐ 36 months who had rectal temperature ≥38.4 °C. Exclusion criteria: not attending daycare centers, had taken temperature‐altering drugs or antibiotics within 10 days before presentation, known abnormal liver or renal laboratory values, medical history of renal or hepatic impairment, gastrointestinal bleeding, known allergy to any antipyretic, congenital or acquired immunodeficiency, Reye syndrome, asthma, bronchiolitis or malignancy, and children whose caregivers were unable to apply the NCCPC to measure stress. Baseline characteristics:
URI 66(43) 81(52) 80(51) AOM 16(10) 13(8) 17(11) Pharyngitis 10(7) 7(5) 3(2) Bronchiolitis 8(5) 7(5) 9(6) Gastroenteritis 7(5) 7(5) 6(4) Viral illness 47(30) 40(25) 40(26) | |
| Interventions | Group1: paracetamol (12.5 mg/kg) q6h, max 50 mg/kg/day); half of the group received initial loading with paracetamol (25 mg/kg) and the other half received initial loading with ibuprofen (10 mg/kg) Group 2: ibuprofen (5 mg/kg) q8h, max 20 mg/kg/day; half of the group received initial loading with paracetamol (25 mg/kg) and the other half received initial loading with ibuprofen (10 mg/kg) Group 3: paracetamol (12.5 mg/kg/dose, max 50 mg/kg/d) alternating with ibuprofen (5 mg/kg/dose, max 20 mg/kg/d) q4h; half of the group received initial loading with paracetamol (25 mg/kg) and the other half received loading with ibuprofen (10 mg/kg) | |
| Outcomes | Primary:
Secondary:
| |
| Notes | Location: Central Israel Setting: multi‐Centre; three primary paediatric community ambulatory centers. Funding: None disclosed. | |
| Risk of bias | ||
| Bias | Authors' judgement | Support for judgement |
| Random sequence generation (selection bias) | Low risk | "Computerized random number generator to stratify according to the center in blocks of 60 numbers so that each block comprised 20 patients randomly assigned to each treatment group, with 10 patients assigned to each loading medication." |
| Allocation concealment (selection bias) | Low risk | Admitting nurse used a computerized random‐number generator and handed the parent or guardian a sealed opaque folder holding 3 sealed envelopes: 1 containing an advice sheet explaining the physiology of fever and its nonpharmacologic management; 1 containing the prescription for the loading medication; and 1 containing the drug prescription. |
| Blinding of participants and personnel (performance bias) | Unclear risk | Parents were described as being blinded, but the differences in drug regimens and lack of placebos in the single agent arms suggest that blinding is unlikely. |
| Blinding of outcome assessment (detection bias) | Low risk | "All of the children were evaluated and followed up by the same physician (E.M.S.), who was blinded to the group allocations (as were the parents or guardians)." |
| Incomplete outcome data (attrition bias) | Low risk | A total of 480 infants met the eligibility criteria, of whom 464 (96.7%) completed the study. Of the 16 infants (3.3%) who withdrew from the study, 7 (1.5%) failed to return for follow‐up visits within the first 10 days, and 9 (1.9%) did not return for laboratory evaluation after symptoms were alleviated. |
| Selective reporting (reporting bias) | Unclear risk | No significant differences found with different loading medications, so patients were grouped according to maintenance medication. Data for outcomes from different loading medication groups were not reported. |
| Other bias | Low risk | |
Characteristics of excluded studies [ordered by study ID]
Ir a:
| Study | Reason for exclusion |
| Letter | |
| Physician survey | |
| Comment on PITCH trial | |
| No mean temperature or proportion afebrile data published, despite being measured. Thus, study was at high risk for selective outcome reporting bias. Author was contacted and did not have access to original data. No quality of life indices examined. | |
| Review article | |
| Survey | |
| Discussion | |
| Systematic review | |
| Comparison not relevant to this review | |
| Systematic review | |
| Systematic review | |
| Review of PITCH trial | |
| Review article |
Data and analyses
| Outcome or subgroup title | No. of studies | No. of participants | Statistical method | Effect size |
| 1 Mean temperature (°C) Show forest plot | 3 | Mean Difference (IV, Fixed, 95% CI) | Subtotals only | |
| Analysis 1.1 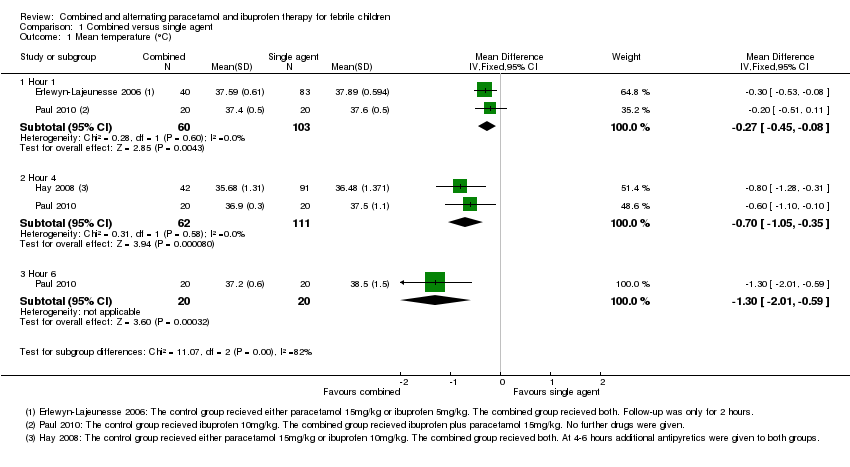 Comparison 1 Combined versus single agent, Outcome 1 Mean temperature (°C). | ||||
| 1.1 Hour 1 | 2 | 163 | Mean Difference (IV, Fixed, 95% CI) | ‐0.27 [‐0.45, ‐0.08] |
| 1.2 Hour 4 | 2 | 173 | Mean Difference (IV, Fixed, 95% CI) | ‐0.70 [‐1.05, ‐0.35] |
| 1.3 Hour 6 | 1 | 40 | Mean Difference (IV, Fixed, 95% CI) | ‐1.30 [‐2.01, ‐0.59] |
| 2 Proportion remaining febrile Show forest plot | 2 | Risk Ratio (M‐H, Random, 95% CI) | Subtotals only | |
| Analysis 1.2 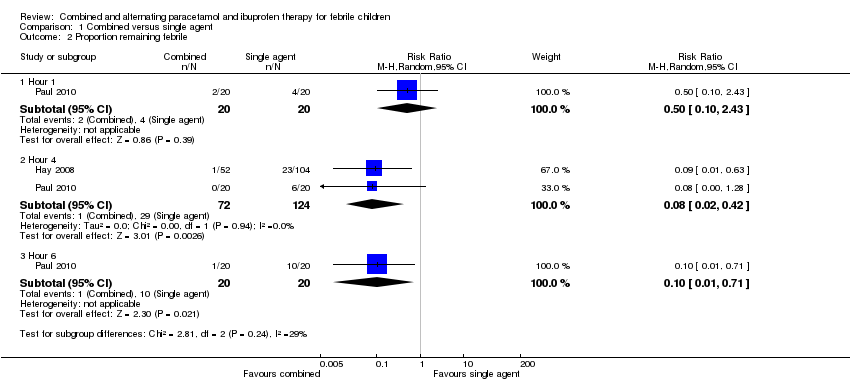 Comparison 1 Combined versus single agent, Outcome 2 Proportion remaining febrile. | ||||
| 2.1 Hour 1 | 1 | 40 | Risk Ratio (M‐H, Random, 95% CI) | 0.5 [0.10, 2.43] |
| 2.2 Hour 4 | 2 | 196 | Risk Ratio (M‐H, Random, 95% CI) | 0.08 [0.02, 0.42] |
| 2.3 Hour 6 | 1 | 40 | Risk Ratio (M‐H, Random, 95% CI) | 0.10 [0.01, 0.71] |
| Outcome or subgroup title | No. of studies | No. of participants | Statistical method | Effect size |
| 1 Non‐communicating Children's Pain Checklist (NCCPC) score Show forest plot | 1 | 1857 | Mean Difference (IV, Random, 95% CI) | ‐3.24 [‐3.82, ‐2.67] |
| Analysis 2.1  Comparison 2 Alternating versus single agent, Outcome 1 Non‐communicating Children's Pain Checklist (NCCPC) score. | ||||
| 1.1 Day 1 | 1 | 619 | Mean Difference (IV, Random, 95% CI) | ‐2.36 [‐2.76, ‐1.96] |
| 1.2 Day 2 | 1 | 619 | Mean Difference (IV, Random, 95% CI) | ‐3.76 [‐4.18, ‐3.34] |
| 1.3 Day 3 | 1 | 619 | Mean Difference (IV, Random, 95% CI) | ‐3.64 [‐4.08, ‐3.20] |
| 2 Absent from daycare, days Show forest plot | 1 | 619 | Mean Difference (IV, Fixed, 95% CI) | ‐0.85 [‐0.95, ‐0.75] |
| Analysis 2.2  Comparison 2 Alternating versus single agent, Outcome 2 Absent from daycare, days. | ||||
| 3 Doses of medication per child Show forest plot | 1 | 2166 | Mean Difference (IV, Random, 95% CI) | ‐1.29 [‐1.69, ‐0.88] |
| Analysis 2.3 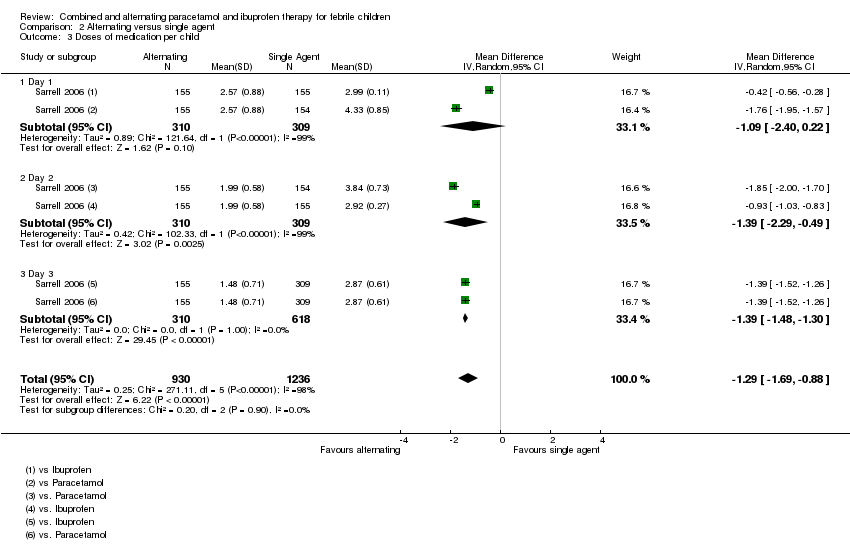 Comparison 2 Alternating versus single agent, Outcome 3 Doses of medication per child. | ||||
| 3.1 Day 1 | 1 | 619 | Mean Difference (IV, Random, 95% CI) | ‐1.09 [‐2.40, 0.22] |
| 3.2 Day 2 | 1 | 619 | Mean Difference (IV, Random, 95% CI) | ‐1.39 [‐2.29, ‐0.49] |
| 3.3 Day 3 | 1 | 928 | Mean Difference (IV, Random, 95% CI) | ‐1.39 [‐1.48, ‐1.30] |
| 4 Mean temperature (°C) Show forest plot | 2 | Mean Difference (IV, Random, 95% CI) | Subtotals only | |
| Analysis 2.4 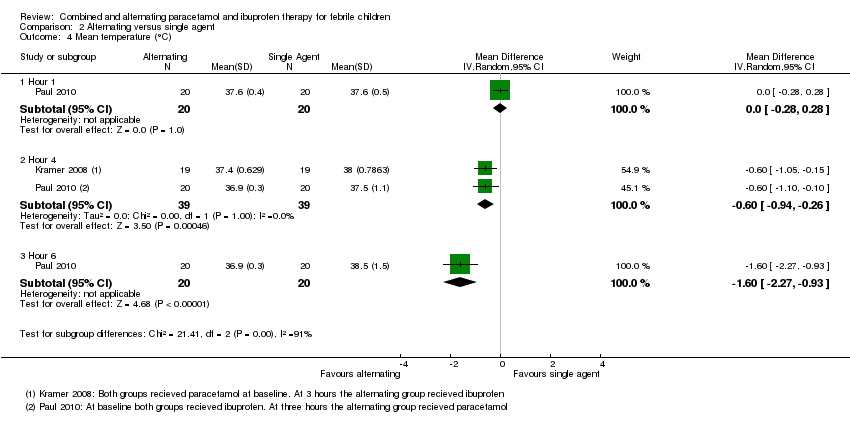 Comparison 2 Alternating versus single agent, Outcome 4 Mean temperature (°C). | ||||
| 4.1 Hour 1 | 1 | 40 | Mean Difference (IV, Random, 95% CI) | 0.0 [‐0.28, 0.28] |
| 4.2 Hour 4 | 2 | 78 | Mean Difference (IV, Random, 95% CI) | ‐0.60 [‐0.94, ‐0.26] |
| 4.3 Hour 6 | 1 | 40 | Mean Difference (IV, Random, 95% CI) | ‐1.60 [‐2.27, ‐0.93] |
| 5 Proportion remaining febrile Show forest plot | 2 | Risk Ratio (M‐H, Fixed, 95% CI) | Subtotals only | |
| Analysis 2.5 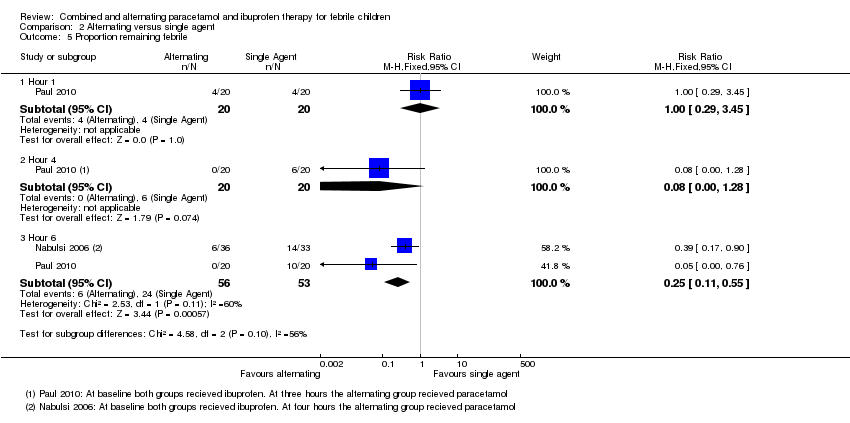 Comparison 2 Alternating versus single agent, Outcome 5 Proportion remaining febrile. | ||||
| 5.1 Hour 1 | 1 | 40 | Risk Ratio (M‐H, Fixed, 95% CI) | 1.0 [0.29, 3.45] |
| 5.2 Hour 4 | 1 | 40 | Risk Ratio (M‐H, Fixed, 95% CI) | 0.08 [0.00, 1.28] |
| 5.3 Hour 6 | 2 | 109 | Risk Ratio (M‐H, Fixed, 95% CI) | 0.25 [0.11, 0.55] |
| Outcome or subgroup title | No. of studies | No. of participants | Statistical method | Effect size |
| 1 Temperature (°C) Show forest plot | 1 | Mean Difference (IV, Fixed, 95% CI) | Subtotals only | |
| Analysis 3.1  Comparison 3 Combined versus alternating therapy, Outcome 1 Temperature (°C). | ||||
| 1.1 Hour 1 | 1 | 40 | Mean Difference (IV, Fixed, 95% CI) | ‐0.20 [‐0.48, 0.08] |
| 1.2 Hour 4 | 1 | 40 | Mean Difference (IV, Fixed, 95% CI) | 0.0 [‐0.19, 0.19] |
| 1.3 Hour 6 | 1 | 40 | Mean Difference (IV, Fixed, 95% CI) | 0.30 [0.01, 0.59] |
| 2 Proportion Febrile Show forest plot | 1 | 120 | Risk Ratio (M‐H, Fixed, 95% CI) | 0.78 [0.21, 2.91] |
| Analysis 3.2 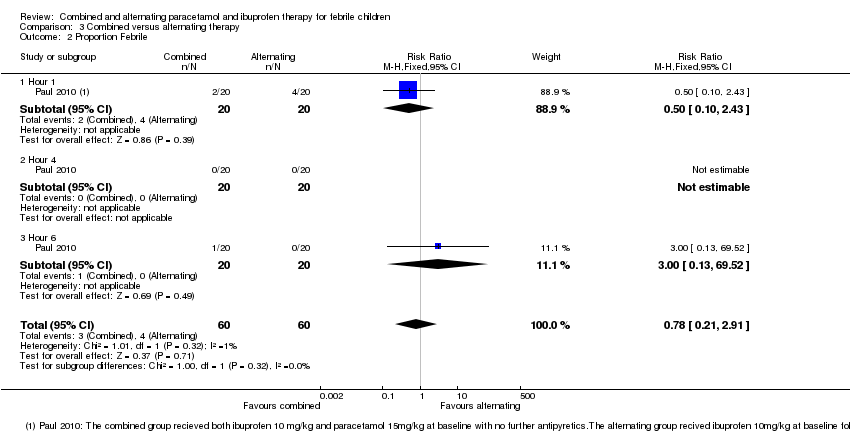 Comparison 3 Combined versus alternating therapy, Outcome 2 Proportion Febrile. | ||||
| 2.1 Hour 1 | 1 | 40 | Risk Ratio (M‐H, Fixed, 95% CI) | 0.5 [0.10, 2.43] |
| 2.2 Hour 4 | 1 | 40 | Risk Ratio (M‐H, Fixed, 95% CI) | 0.0 [0.0, 0.0] |
| 2.3 Hour 6 | 1 | 40 | Risk Ratio (M‐H, Fixed, 95% CI) | 3.0 [0.13, 69.52] |
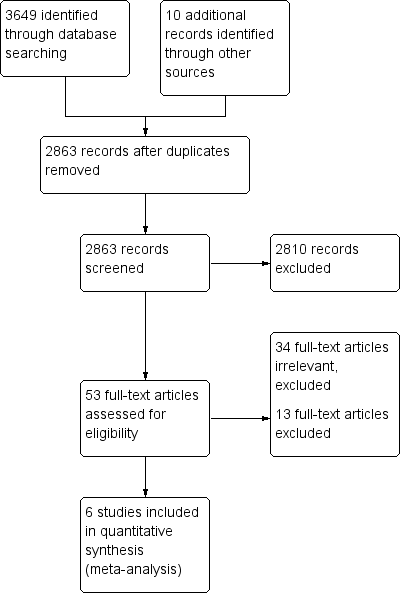
Study flow diagram.
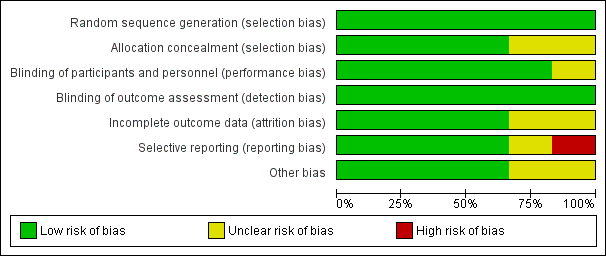
Risk of bias graph: review authors' judgements about each risk of bias item presented as percentages across all included studies.

Risk of bias summary: review authors' judgements about each risk of bias item for each included study.

Comparison 1 Combined versus single agent, Outcome 1 Mean temperature (°C).

Comparison 1 Combined versus single agent, Outcome 2 Proportion remaining febrile.
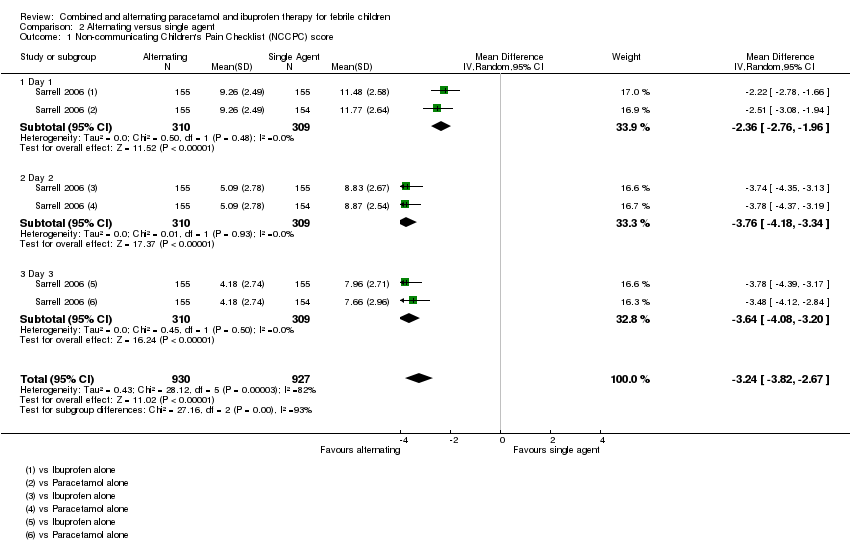
Comparison 2 Alternating versus single agent, Outcome 1 Non‐communicating Children's Pain Checklist (NCCPC) score.

Comparison 2 Alternating versus single agent, Outcome 2 Absent from daycare, days.

Comparison 2 Alternating versus single agent, Outcome 3 Doses of medication per child.

Comparison 2 Alternating versus single agent, Outcome 4 Mean temperature (°C).

Comparison 2 Alternating versus single agent, Outcome 5 Proportion remaining febrile.
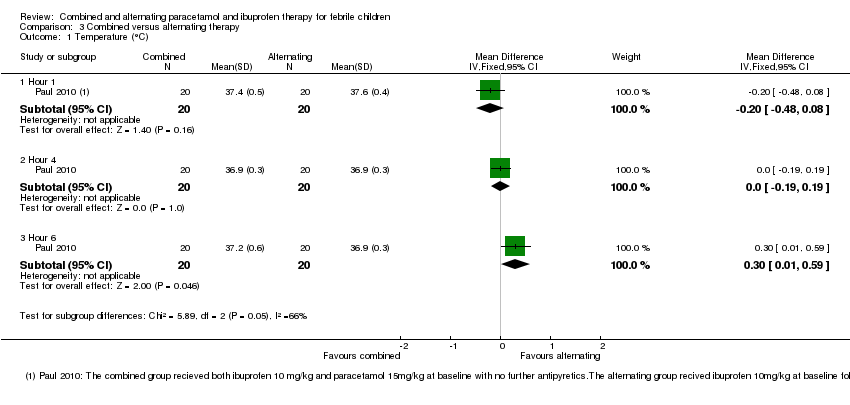
Comparison 3 Combined versus alternating therapy, Outcome 1 Temperature (°C).

Comparison 3 Combined versus alternating therapy, Outcome 2 Proportion Febrile.
| Study ID | Time after administration (hours) | |||||||||
| 0 | 1 | 2 | 3 | 4 | 5 | 6 | 7 | 8 | ||
| P (15 mg/kg) | Ⓣ | Ⓣ | ||||||||
| I (5 mg/kg) | Ⓣ | Ⓣ | ||||||||
| P (15 mg/kg) + I (5 mg/kg) | Ⓣ | Ⓣ | ||||||||
| P (15 mg/kg) | Ⓣ | Ⓣ P | Ⓣ | Ⓣ | ||||||
| I (10 mg/kg) | Ⓣ | Ⓣ | Ⓣ I | Ⓣ | ||||||
| P (15 mg/kg) + I (10 mg/kg) | Ⓣ | Ⓣ P | Ⓣ I | Ⓣ | ||||||
| P (15 mg/kg) | Ⓣ | Ⓣ P | Ⓣ | Ⓣ | ||||||
| P (15 mg/kg) | Ⓣ I (10 mg/kg) | Ⓣ | Ⓣ | Ⓣ | ||||||
| I (10 mg/kg) | Ⓣ | Ⓣ | Ⓣ | Ⓣ | Ⓣ | |||||
| I (10 mg/kg) | Ⓣ P (15 mg/kg) | Ⓣ | Ⓣ | Ⓣ | Ⓣ | |||||
| I (10 mg/kg) | Ⓣ | Ⓣ | Ⓣ | Ⓣ | Ⓣ | Ⓣ | ||||
| I (10 mg/kg) | Ⓣ | Ⓣ | Ⓣ P | Ⓣ | Ⓣ | Ⓣ | ||||
| I (10 mg/kg) + P (15 mg/kg) | Ⓣ | Ⓣ | Ⓣ | Ⓣ | Ⓣ | Ⓣ | ||||
| P or I | P | |||||||||
| P or I | I | |||||||||
| P or I | P | I | ||||||||
| Ⓣ = Temperature reported; P = paracetamol; I = ibuprofen 1Sarrell 2006 asked caretakers to record rectal temperatures three times per day. | ||||||||||
| Alternating versus single agent for fever in children | |||||||
| Patient or population: children with fever | |||||||
| Outcomes | Timepoint | Illustrative comparative risks* (95% CI) | Relative effect | No of participants | Quality of the evidence | Comments | |
| Assumed risk | Corresponding risk | ||||||
| Single agent | Alternating regimen | ||||||
| NCCPC score A score of 7 or more indicates pain. | Day 1 | The mean NCCPC score in the control group was | The mean NCCPC score in the intervention groups was | ‐ | 309 | ⊕⊕⊝⊝ | |
| Day 2 | The mean NCCPC score in the control group was | The mean NCCPC score in the intervention groups was | ‐ | 475 | ⊕⊕⊝⊝ | ||
| Day 3 | The mean NCCPC score in the control group was | The mean NCCPC score in the intervention groups was | ‐ | 464 | ⊕⊕⊝⊝ | ||
| *The basis for the assumed risk (eg the median control group risk across studies) is provided in footnotes. The corresponding risk (and its 95% CI) is based on the assumed risk in the comparison group and the relative effect of the intervention (and its 95% CI). | |||||||
| GRADE Working Group grades of evidence | |||||||
| 1 Downgraded by 2 for risk of bias: in this study mothers collected the data on NCCPC scores and were unblinded to allocation. In addition, in this study the mean number of doses of medication was actually lower in the group allocated to alternating treatment. The reasons for this are unclear as logically they should receive more doses. | |||||||
| Alternating versus single agent for fever in children | |||||||
| Patient or population: children with fever | |||||||
| Outcomes | Timepoint | Illustrative comparative risks* (95% CI) | Relative effect | No of participants | Quality of the evidence | Comments | |
| Assumed risk | Corresponding risk | ||||||
| Single agent | Alternating regimen | ||||||
| Mean Temperature | 1 hour | The mean temperature in the control group was | The mean temperature in the intervention groups was | ‐ | 40 | ⊕⊝⊝⊝ | Children in the alternating regimen group received a second dose of antipyretic at 3‐4 hours |
| 4 hours | The mean temperature in the control groups ranged from | The mean temperature in the intervention groups was | ‐ | 78 | ⊕⊕⊝⊝ | ||
| 6 hours | The mean temperature in the control group was | The mean temperature in the intervention groups was | ‐ | 40 | ⊕⊝⊝⊝ | ||
| Proportion febrile | 1 hour | 20 per 100 | 20 per 100 | RR 1 | 40 | ⊕⊝⊝⊝ | Children in the alternating regimen group received a second dose of antipyretic at 3‐4 hours |
| 4 hours | 30 per 100 | 2 per 100 | RR 0.08 | 40 | ⊕⊝⊝⊝ | ||
| 6 hours | 45 per 100 | 11 per 100 | RR 0.25 | 109 | ⊕⊕⊝⊝ | ||
| *The basis for the assumed risk (eg the median control group risk across studies) is provided in footnotes. The corresponding risk (and its 95% CI) is based on the assumed risk in the comparison group and the relative effect of the intervention (and its 95% CI). | |||||||
| GRADE Working Group grades of evidence | |||||||
| 1 This single study compared a single dose of ibuprofen with ibuprofen plus paracetamol 3 hours later. | |||||||
| Combined versus single agent for fever in children | |||||||
| Patient or population: children with fever Control: a single agent alone at baseline | |||||||
| Outcomes | Timepoint | Illustrative comparative risks* (95% CI) | Relative effect | No of participants | Quality of the evidence | Comments | |
| Assumed risk | Corresponding risk | ||||||
| Single agent | Combined regimen | ||||||
| Mean Temperature | 1 hour | The mean temperature in the control groups ranged from | The mean temperature in the intervention groups was | ‐ | 163 | ⊕⊝⊝⊝ moderate 1,2,3 | |
| 4 hours | The mean temperature in the control groups ranged from | The mean temperature in the intervention groups was | ‐ | 173 | ⊕⊝⊝⊝ moderate 4,2,3 | ||
| 6 hours | The mean temperature in the control group was | The mean temperature in the intervention groups was | ‐ | 40 | ⊕⊝⊝⊝ | ||
| Proportion Febrile | 1 hour | 20 per 100 | 10 per 100 | RR 0.5 | 40 | ⊕⊝⊝⊝ | |
| 4 hours | 23 per 100 | 2 per 100 | RR 0.08 | 196 | ⊕⊝⊝⊝ moderate 4,2,3 | ||
| 6 hours | 50 per 100 | 5 per 100 | RR 0.10 | 40 participants | ⊕⊝⊝⊝ | ||
| *The basis for the assumed risk (eg the median control group risk across studies) is provided in footnotes. The corresponding risk (and its 95% CI) is based on the assumed risk in the comparison group and the relative effect of the intervention (and its 95% CI). | |||||||
| GRADE Working Group grades of evidence | |||||||
| 1 These two studies compared ibuprofen plus paracetamol at baseline with ibuprofen alone (Paul 2010) or ibuprofen or paracetamol alone (Erlewyn‐Lajeunesse 2006). | |||||||
| Combined versus alternating therapy for fever in children | |||||||
| Patient or population: children with fever | |||||||
| Outcomes | Timepoint | Illustrative comparative risks* (95% CI) | Relative effect | No of participants | Quality of the evidence | Comments | |
| Assumed risk | Corresponding risk | ||||||
| Alternating therapy | Combinedtherapy | ||||||
| Mean Temperature | 1 hour | The mean temperature in the control group was | The mean temperature in the intervention groups was | ‐ | 40 | ⊕⊝⊝⊝ | |
| 4 hours | The mean temperature in the control group was | The mean temperature in the intervention groups was | ‐ | 40 | ⊕⊝⊝⊝ | ||
| 6 hours | The mean temperature in the control group was | The mean temperature in the intervention groups was | ‐ | 40 | ⊕⊝⊝⊝ | ||
| Proportion Febrile | 1 hour | 200 per 1000 | 100 per 1000 | RR 0.5 | 40 | ⊕⊝⊝⊝ | |
| 4 hours | ‐ | ‐ | Not estimable | 40 | ⊕⊝⊝⊝ | ||
| 6 hours | 0 per 1000 | 0 per 1000 | RR 3 | 40 | ⊕⊝⊝⊝ | ||
| *The basis for the assumed risk (eg the median control group risk across studies) is provided in footnotes. The corresponding risk (and its 95% CI) is based on the assumed risk in the comparison group and the relative effect of the intervention (and its 95% CI). | |||||||
| GRADE Working Group grades of evidence | |||||||
| 1 This single study was conducted in the USA. | |||||||
| Comparison | Studies | N
| Duration of follow up | Serious adverse events | Comments |
| Combined versus single agent | 123 | 2 hours | Not reported |
| |
| 156 | 5 days | Five serious AE occurred (Admission to hospital ‐ reasons not reported) with no difference between groups | Non‐severe adverse events (mainly diarrhoea and vomiting) were evenly distributed between groups2 | ||
| 46 | 6 hours | Not reported |
| ||
| Alternating versus single agent
| 46 | 6 hours | Not reported | ||
|
| 40 | 6 hours
| None observed
| Non‐severe adverse effects reported in 8/38 (21%) of patients with no difference between groups1
| |
|
| 70 | 8 hours | None observed | Rectal temperature < 36.5 °C (range 35.0 °C to 36.2 °C) 5 (13.9%) combined group 6 (18.2%) ibuprofen group
| |
| 480 | 14 days | None observed | Mild elevated liver enzymes, n=8, mild abnormal renal function, n=14, all normalized by 14 day follow up | ||
| Alternating versus combined therapy | 46 | 6 hours | Not reported |
| |
| 1 Non‐severe AE stated as: diarrhoea, flatulence, emesis, decreased appetite, epigastric pain, nausea, headache, insomnia. Symptoms did not prevent any patients from taking study medications. | |||||
| Outcome or subgroup title | No. of studies | No. of participants | Statistical method | Effect size |
| 1 Mean temperature (°C) Show forest plot | 3 | Mean Difference (IV, Fixed, 95% CI) | Subtotals only | |
| 1.1 Hour 1 | 2 | 163 | Mean Difference (IV, Fixed, 95% CI) | ‐0.27 [‐0.45, ‐0.08] |
| 1.2 Hour 4 | 2 | 173 | Mean Difference (IV, Fixed, 95% CI) | ‐0.70 [‐1.05, ‐0.35] |
| 1.3 Hour 6 | 1 | 40 | Mean Difference (IV, Fixed, 95% CI) | ‐1.30 [‐2.01, ‐0.59] |
| 2 Proportion remaining febrile Show forest plot | 2 | Risk Ratio (M‐H, Random, 95% CI) | Subtotals only | |
| 2.1 Hour 1 | 1 | 40 | Risk Ratio (M‐H, Random, 95% CI) | 0.5 [0.10, 2.43] |
| 2.2 Hour 4 | 2 | 196 | Risk Ratio (M‐H, Random, 95% CI) | 0.08 [0.02, 0.42] |
| 2.3 Hour 6 | 1 | 40 | Risk Ratio (M‐H, Random, 95% CI) | 0.10 [0.01, 0.71] |
| Outcome or subgroup title | No. of studies | No. of participants | Statistical method | Effect size |
| 1 Non‐communicating Children's Pain Checklist (NCCPC) score Show forest plot | 1 | 1857 | Mean Difference (IV, Random, 95% CI) | ‐3.24 [‐3.82, ‐2.67] |
| 1.1 Day 1 | 1 | 619 | Mean Difference (IV, Random, 95% CI) | ‐2.36 [‐2.76, ‐1.96] |
| 1.2 Day 2 | 1 | 619 | Mean Difference (IV, Random, 95% CI) | ‐3.76 [‐4.18, ‐3.34] |
| 1.3 Day 3 | 1 | 619 | Mean Difference (IV, Random, 95% CI) | ‐3.64 [‐4.08, ‐3.20] |
| 2 Absent from daycare, days Show forest plot | 1 | 619 | Mean Difference (IV, Fixed, 95% CI) | ‐0.85 [‐0.95, ‐0.75] |
| 3 Doses of medication per child Show forest plot | 1 | 2166 | Mean Difference (IV, Random, 95% CI) | ‐1.29 [‐1.69, ‐0.88] |
| 3.1 Day 1 | 1 | 619 | Mean Difference (IV, Random, 95% CI) | ‐1.09 [‐2.40, 0.22] |
| 3.2 Day 2 | 1 | 619 | Mean Difference (IV, Random, 95% CI) | ‐1.39 [‐2.29, ‐0.49] |
| 3.3 Day 3 | 1 | 928 | Mean Difference (IV, Random, 95% CI) | ‐1.39 [‐1.48, ‐1.30] |
| 4 Mean temperature (°C) Show forest plot | 2 | Mean Difference (IV, Random, 95% CI) | Subtotals only | |
| 4.1 Hour 1 | 1 | 40 | Mean Difference (IV, Random, 95% CI) | 0.0 [‐0.28, 0.28] |
| 4.2 Hour 4 | 2 | 78 | Mean Difference (IV, Random, 95% CI) | ‐0.60 [‐0.94, ‐0.26] |
| 4.3 Hour 6 | 1 | 40 | Mean Difference (IV, Random, 95% CI) | ‐1.60 [‐2.27, ‐0.93] |
| 5 Proportion remaining febrile Show forest plot | 2 | Risk Ratio (M‐H, Fixed, 95% CI) | Subtotals only | |
| 5.1 Hour 1 | 1 | 40 | Risk Ratio (M‐H, Fixed, 95% CI) | 1.0 [0.29, 3.45] |
| 5.2 Hour 4 | 1 | 40 | Risk Ratio (M‐H, Fixed, 95% CI) | 0.08 [0.00, 1.28] |
| 5.3 Hour 6 | 2 | 109 | Risk Ratio (M‐H, Fixed, 95% CI) | 0.25 [0.11, 0.55] |
| Outcome or subgroup title | No. of studies | No. of participants | Statistical method | Effect size |
| 1 Temperature (°C) Show forest plot | 1 | Mean Difference (IV, Fixed, 95% CI) | Subtotals only | |
| 1.1 Hour 1 | 1 | 40 | Mean Difference (IV, Fixed, 95% CI) | ‐0.20 [‐0.48, 0.08] |
| 1.2 Hour 4 | 1 | 40 | Mean Difference (IV, Fixed, 95% CI) | 0.0 [‐0.19, 0.19] |
| 1.3 Hour 6 | 1 | 40 | Mean Difference (IV, Fixed, 95% CI) | 0.30 [0.01, 0.59] |
| 2 Proportion Febrile Show forest plot | 1 | 120 | Risk Ratio (M‐H, Fixed, 95% CI) | 0.78 [0.21, 2.91] |
| 2.1 Hour 1 | 1 | 40 | Risk Ratio (M‐H, Fixed, 95% CI) | 0.5 [0.10, 2.43] |
| 2.2 Hour 4 | 1 | 40 | Risk Ratio (M‐H, Fixed, 95% CI) | 0.0 [0.0, 0.0] |
| 2.3 Hour 6 | 1 | 40 | Risk Ratio (M‐H, Fixed, 95% CI) | 3.0 [0.13, 69.52] |