Scolaris Content Display Scolaris Content Display

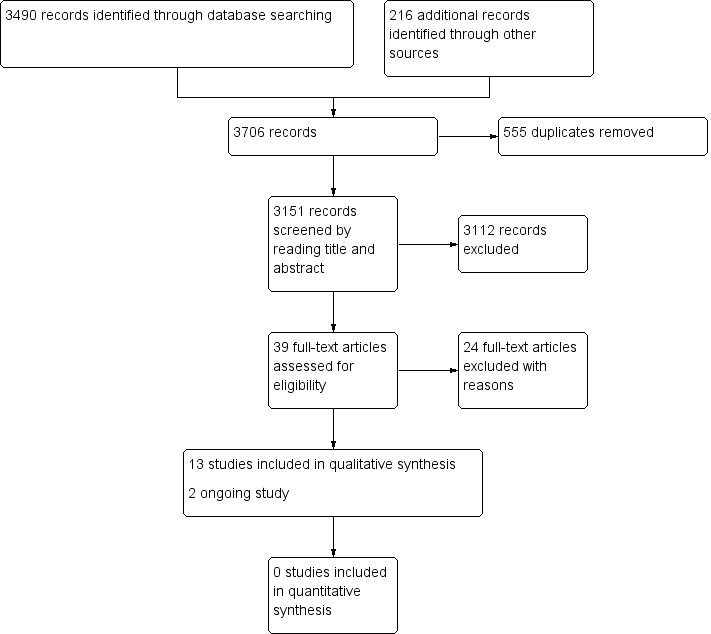
Study flow diagram.
Figuras y tablas -
Figure 1

Study flow diagram.

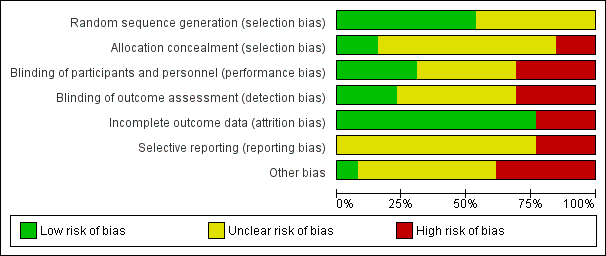
Risk of bias graph: review authors' judgements about each risk of bias item presented as percentages across all included studies.
Figuras y tablas -
Figure 2

Risk of bias graph: review authors' judgements about each risk of bias item presented as percentages across all included studies.

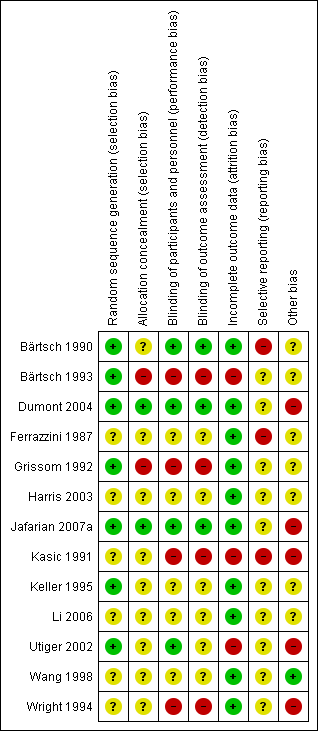
Risk of bias summary: review authors' judgements about each risk of bias item for each included study.
Figuras y tablas -
Figure 3

Risk of bias summary: review authors' judgements about each risk of bias item for each included study.

Comparison 1 Acetazolamide versus placebo, Outcome 1 AMS symptoms (standardized).
Figuras y tablas -
Analysis 1.1

Comparison 1 Acetazolamide versus placebo, Outcome 1 AMS symptoms (standardized).

Summary of findings for the main comparison. Non‐pharmacological interventions for treating acute high altitude illness

Non‐pharmacological interventions for treating acute high altitude illness

Patient or population: people suffering from high altitude illness
Setting: Swiss‒Italian border, USA.
Intervention: hyperbaric chamber, simulated descent (193 millibars)
Comparison: supplementary oxygen, simulated descent (20 millibars)

Outcomes and intervention

Anticipated absolute effects* (95% CI)

Relative effect
(95% CI)

№ of participants
(studies)

Certainty of the evidence
(GRADE)

Comments

Risk with various interventions

Risk with non‐pharmacological interventions

All‐cause mortality

Not reported

Complete relief of AMS symptoms

Not reported

Reduction in symptom score severity at 12 hours

(Clinical score: ranged from 0 to 11 (worse))

Intervention:

Simulated descent of 193 millibars versus 20 millibars

The mean score in the control group was 3.1

The mean score in the intervention group was 2.5

0.6 points lower with intervention

64 (1 RCT)

⊕⊕⊝⊝
Low 1

Adverse effects during treatment

Intervention:

Hyperbaric chamber/ 160 millibars versus supplementary oxygen

0 per 1000

0 per 1000

Nil

29
(1 RCT)

⊕⊕⊝⊝
Low1

*The risk in the intervention group (and its 95% CI) is based on the assumed risk in the comparison group and the relative effect of the intervention (and its 95% CI).

CI: Confidence interval; RR: Risk ratio; OR: Odds ratio

GRADE Working Group grades of evidence
High certainty: We are very confident that the true effect lies close to that of the estimate of the effect
Moderate certainty: We are moderately confident in the effect estimate: the true effect is likely to be close to the estimate of the effect, but there is a possibility that it is substantially different
Low certainty: Our confidence in the effect estimate is limited: the true effect may be substantially different from the estimate of the effect
Very low certainty: We have very little confidence in the effect estimate: the true effect is likely to be substantially different from the estimate of effect

1 Quality of evidence downgraded by two levels due to serious risk of bias (performance bias (blinding was not specified), attrition bias and selective reporting bias) and serious imprecision (optimal information size criteria not achieved)

Figuras y tablas -
Summary of findings for the main comparison. Non‐pharmacological interventions for treating acute high altitude illness
Summary of findings 2. Pharmacological interventions for treating acute high altitude illness

Pharmacological interventions for treating acute high altitude illness

Patient or population: people suffering from high altitude illness
Setting: Alaska, borders between China, India and Pakistan, Iran, Nepal, Tibet, Swiss‒Italian border.
Intervention: pharmacological interventions (dexamethasone, acetazolamide, gabapentin)
Comparison: placebo

Outcomes

Anticipated absolute effects* (95% CI)

Relative effect
(95% CI)

№ of participants
(studies)

Certainty of the evidence
(GRADE)

Comments

Risk with various interventions

Risk with pharmacological interventions

All‐cause mortality

Not reported

Complete relief of AMS symptoms

(12 to 16 hours after treatment)

Scale used: Acute Mountain Sickness score (ranged from 0 to 9 (worse))

Dexamethasone versus placebo

0 per 1000

471 per 1000

No estimable

35
(1 RCT)

⊕⊕⊝⊝
Low 1

Reduction in symptom score severity

Time of measurement: 1 to 48 hours after treatment, end of treatment

Scale of measurement: Self‐administered AMS questionnaires (ranged from 0 to 90 (worse)), AMS Symptom Questionnaire (ranged from 0 to 22 (worse)), Acute Mountain Sickness score (ranged from 0 to 9 (worse)), HAH Visual analogue score (VAS) (range no stated), Lake Louise Score (from 0 to 15 (worse)),

Acetazolamide versus placebo

Standardized Mean Difference 1.15 lower
(2.56 lower to 0.27 higher)

25
(2 RCTs)

⊕⊕⊝⊝
Low 2

Dexamethasone versus placebo

Mean change from baseline: 0.4 units

Mean change from baseline: 4.1 units

Difference of 3.7 units (reported by trial authors)

35
(1 RCT)

⊕⊕⊕⊝
Moderate 3

Gabapentin versus placebo

Mean VAS score: 4.75

Mean VAS score: 2.92

Not stated

24
(1 RCT)

⊕⊕⊝⊝
Low 4

Magnesium versus placebo

Mean score: 10.3 units

Mean score: 9 units

Not stated

25
(1 RCT)

⊕⊕⊝⊝
Low 4

Adverse effects

Time of measurement: 1 to 48 hours after treatment, end of treatment

Scale of measurement:not stated

Acetazolamide versus placebo

No reported

0 per 1000

Not estimable

25
(1 RCT)

⊕⊕⊝⊝
Low 4

Gabapentin versus placebo

0 per 1000

0 per 1000

Not stated

24
(1 RCT)

⊕⊕⊝⊝
Low 4

Magnesium sulphate versus placebo

77 per 1000

750 per 1000

Not stated

25
(1 RCT)

⊕⊕⊝⊝
Low 4

*The risk in the intervention group (and its 95% confidence interval) is based on the assumed risk in the comparison group and the relative effect of the intervention (and its 95% CI).

CI: Confidence interval; RR: Risk ratio; OR: Odds ratio

GRADE Working Group grades of evidence
High certainty: We are very confident that the true effect lies close to that of the estimate of the effect
Moderate certainty: We are moderately confident in the effect estimate: the true effect is likely to be close to the estimate of the effect, but there is a possibility that it is substantially different
Low certainty: Our confidence in the effect estimate is limited: the true effect may be substantially different from the estimate of the effect
Very low certainty: We have very little confidence in the effect estimate: the true effect is likely to be substantially different from the estimate of effect

1 Quality of evidence downgraded by two levels due to very serious risk of bias (multiple unclear biases and high risk of selective reporting bias)

2 Quality of evidence downgraded by two levels due to serious risk of bias (selection bias) and serious inconsistency (I² = 58%).

3 Quality of evidence downgraded by one level due to serious risk of bias (selection, performance and detection bias).

4 Quality of evidence downgraded by two levels due to serious risk of bias and serious imprecision.

Figuras y tablas -
Summary of findings 2. Pharmacological interventions for treating acute high altitude illness
Comparison 1. Acetazolamide versus placebo

Outcome or subgroup title

No. of studies

No. of participants

Statistical method

Effect size

1 AMS symptoms (standardized) Show forest plot

2

25

Std. Mean Difference (IV, Random, 95% CI)

‐1.15 [‐2.56, 0.27]

Figuras y tablas -
Comparison 1. Acetazolamide versus placebo