Dos clozapine untuk skizofrenia
Referencias
References to studies included in this review
References to studies excluded from this review
References to studies awaiting assessment
Additional references
Characteristics of studies
Characteristics of included studies [ordered by study ID]
| Methods | Allocation: randomly assigned (no further details). | |
| Participants | Diagnosis: schizophrenia. | |
| Interventions | 1. Clozapine: dose 200 mg/day. N = 94. | |
| Outcomes | Global state: Clinically important response as defined by individual studies (BPRS score > 30% change). Leaving the study early. | |
| Notes | ||
| Risk of bias | ||
| Bias | Authors' judgement | Support for judgement |
| Random sequence generation (selection bias) | Unclear risk | Randomly assigned, no further details. |
| Allocation concealment (selection bias) | Unclear risk | No details. |
| Blinding of participants and personnel (performance bias) | High risk | Not stated. |
| Blinding of outcome assessment (detection bias) | High risk | Not stated. |
| Incomplete outcome data (attrition bias) | Low risk | All data reported; no loss to follow up. |
| Selective reporting (reporting bias) | Low risk | No indication of selective reporting. |
| Other bias | Unclear risk | Sponsor unclear. |
| Methods | Allocation: randomised, method not stated | |
| Participants | Patients with schizophrenia (inpatients; male & female) | |
| Interventions | 1. Clozapine: dose 200‐300 mg/day. N = 30 2. Clozapine: dose 301‐400 mg/day. N = 30 3. Clozapine: dose 401‐500 mg/day. N = 30 Initial dose 25 mg/day in all cases: doses above achieved at 2‐3 weeks | |
| Outcomes | Mental state: Clinical improvement, clinician assessed Adverse effects: TESS scale score | |
| Notes | ||
| Risk of bias | ||
| Bias | Authors' judgement | Support for judgement |
| Random sequence generation (selection bias) | Unclear risk | Randomly assigned, no further details. |
| Allocation concealment (selection bias) | Unclear risk | No details. |
| Blinding of participants and personnel (performance bias) | High risk | Not stated. |
| Blinding of outcome assessment (detection bias) | High risk | Not stated. |
| Incomplete outcome data (attrition bias) | Low risk | All data reported; no loss to follow up. |
| Selective reporting (reporting bias) | Low risk | No indication of selective reporting. |
| Other bias | Unclear risk | Sponsor unclear. |
| Methods | Allocation: randomised using random number table | |
| Participants | Diagnosis: schizophrenia (CCMD‐3) | |
| Interventions | 1. Clozapine: dose < 150 mg/day. N = 30. | |
| Outcomes | Adverse effects: serum lipid level before and after treatment, body weight, BMI. | |
| Notes | * Standard dose group: two participants left the study early (due to neutropenia and | |
| Risk of bias | ||
| Bias | Authors' judgement | Support for judgement |
| Random sequence generation (selection bias) | Low risk | Allocation by random number table. |
| Allocation concealment (selection bias) | Unclear risk | Not stated |
| Blinding of participants and personnel (performance bias) | High risk | Not stated. |
| Blinding of outcome assessment (detection bias) | High risk | Not stated. |
| Incomplete outcome data (attrition bias) | Low risk | Three participants left the study early, reasons given. |
| Selective reporting (reporting bias) | Low risk | No indication of selective reporting. |
| Other bias | Low risk | No indication of other bias. |
| Methods | Allocation: randomised, method not stated. | |
| Participants | Patients with schizophrenia (inpatients; male & female). | |
| Interventions | 1.Clozapine (capsule): dose 300 mg/day. N = 25. 2.Clozapine (capsule): dose 600 mg/day. N = 26. | |
| Outcomes | Mental state: Clinical improvement, clinician assessed. Mental state: BPRS score (data not available). Adverse effects: TESS scale score (data not available). | |
| Notes | ||
| Risk of bias | ||
| Bias | Authors' judgement | Support for judgement |
| Random sequence generation (selection bias) | Unclear risk | Randomly assigned, no further details. |
| Allocation concealment (selection bias) | Unclear risk | No details. |
| Blinding of participants and personnel (performance bias) | Unclear risk | ‘Double blind’, no further details. |
| Blinding of outcome assessment (detection bias) | Unclear risk | ‘Double blind’, no further details. |
| Incomplete outcome data (attrition bias) | Low risk | All data reported; no loss to follow‐up. |
| Selective reporting (reporting bias) | High risk | BPRS and TESS score data not available. |
| Other bias | Unclear risk | Sponsor unclear. |
| Methods | Allocation: implied randomisation trial, no details on method of allocation. | |
| Participants | Diagnosis: treatment refractory schizophrenia or schizoaffective disorder (DSM‐III‐R). Consent: signed informed consent. | |
| Interventions | 1. Clozapine: dose 100 mg/day. N = 14. | |
| Outcomes | Mental state: (BPRS‐A) total score. Leaving the study early. | |
| Notes | 1. Patients stayed in research centre for four weeks for adaptation (naturalistic baseline with no modification in their treatment regimen). Before first phase of clozapine treatment, patients underwent a four‐week haloperidol treatment and then a one‐week wash out. We contacted the main trialist to obtain missing data on CGI, SANS, responders at 16 weeks, and on which dosage group the four responders belonged to but we have not received results at the time of writing. 2. data from Simpson 1999 have been adjusted in accordance with the published corrections (Simpson 2001). Specifically, the standard errors for BPRS‐A endpoint scores which were originally reported by the authors as if they were standard deviations have been converted to standard deviations. | |
| Risk of bias | ||
| Bias | Authors' judgement | Support for judgement |
| Random sequence generation (selection bias) | High risk | Implied randomisation trial, no details on method of allocation. |
| Allocation concealment (selection bias) | Unclear risk | No details. |
| Blinding of participants and personnel (performance bias) | Unclear risk | Participants were blinded to doses of clozapine; no details on personnel giving the treatment. |
| Blinding of outcome assessment (detection bias) | Low risk | Assessors were blinded to doses of clozapine. |
| Incomplete outcome data (attrition bias) | High risk | 44 out of 48 patients completed the first 16 weeks of the trial; four patients had their last observation carried forward. If a patient had attained the maximum assigned dose for two weeks, his or her data were carried forward for end‐point analysis. However, as clozapine can take more time to exert its effect, if the patient leaves the study soon after two weeks, the last observation carried forward might underestimate the efficiency of that particular dose of clozapine. |
| Selective reporting (reporting bias) | High risk | Responders' data reported at 48 weeks, but not at end of 16 weeks and 32 weeks by dose; CGI, SANS not reported. |
| Other bias | High risk | Sponsored by Novartis Pharmaceuticals. |
BPRS: Brief Psychiatric Rating Scale
BPRS‐A: Brief Psychiatric Rating Scale ‐ Anchored
Characteristics of excluded studies [ordered by study ID]
| Study | Reason for exclusion |
| Allocation: random allocation. Participants: all had schizophrenia. Intervention: examined bioavailability at a clozapine dose regime of between 200 mg/day and 800 mg/day. Outcome: no additional data for this review; study examined only the bioavailability of clozapine. | |
| Allocation: method of allocation unclear. Participants: all had schizophrenia or schizoaffective disorder. Intervention: compared akathisia at three clozapine doses of 100mg/day, 300mg/day & 600mg/day. Outcomes: Barnes akathisia scale endpoint and change scores unavailable. | |
| Allocation: random allocation. Participants: all had treatment refractory schizophrenia or schizoaffective disorder. Intervention: three clozapine doses of 100 mg/day, 300 mg/day and 600 mg/day. Outcome: no additional data for this review; these 4 studies examined (a) relationship between tardive dyskinesia and extrapyramidal symptoms, (b) coefficients of variation in the relationship between dose and plasma concentration levels, (c) plasma cotinine levels, and (d) effects of haloperidol. | |
| Allocation: method of allocation unclear. Participants: all had schizophrenia or schizoaffective disorder. Intervention: compared muscarinic side effects at three clozapine doses of 100mg/day, 300mg/day & 600mg/day. Outcomes: no usable data before the first cross‐over. | |
| Allocation: method of allocation unclear. Participants: all had schizophrenia or schizoaffective disorder. Intervention: compared serum prolactin level at three clozapine doses of 100mg/day, 300mg/day & 600mg/day. Outcomes: no usable data before the first cross‐over. | |
| Allocation: non‐randomized controlled trial. Participants: all had schizophrenia. Intervention: studied BEAM changes after taking three different dosages of clozapine: < 150 mg/day vs 150 mg/day to 400 mg/day vs > 400 mg/day. Outcomes: BEAM changes. | |
| Allocation: random allocation. Participants: all had schizophrenia. Intervention: two clozapine doses of < 300mg/day & > 300mg/day, but adjunctive medication (sulpiride) not held constant between different clozapine dosage groups. Outcomes: compared BPRS and TESS scores between groups. | |
| Allocation: not allocated at random. Participants: all had schizophrenia. Intervention: three different clozapine doses. Outcomes: compared PANSS scores and p300 test results. | |
| Allocation: not randomised; allocation at discretion of psychiatrists in charge. Participation: all had schizophrenia. Intervention: examined effects of clozapine at two doses (up to 100 mg t.i.d. and up to 400 mg t.i.d.). Outcome: BPRS and NOSIE, plus TES for adverse effects. | |
| Allocation: random allocation. Participants: all had schizophrenia. Intervention: examined BPRS, CGI, smoking measures & EEG changes at three clozapine serum level ranges (50 ng/mL to 150 ng/mL, 200 ng/mL to 300 ng/mL & 350 ng/mL to 450ng/mL). Outcome: no additional data for this review; comparison was by serum clozapine level, and not by clozapine dose. | |
| Allocation: random allocation. Participants: all had chronic schizophrenia. Intervention: examined smoking measures at three clozapine serum level ranges (50 ng/mL to 150ng/mL, 200 ng/mL to 300ng/mL & 350 ng/mL to 450ng/mL). Outcome: no additional data for this review; comparison was by serum clozapine level, and not by clozapine dose. | |
| Allocation: random allocation. Participants: all had treatment refractory schizophrenia or schizoaffective disorder. Intervention: three clozapine doses of 100 mg/day, 300 mg/day and 600 mg/day. Outcome: no additional data; study compared those with and without probable tardive dyskinesia in a subgroup of 23 participants from the Simpson 1999 trial. | |
| Allocation: random allocation. Participants: all had treatment refractory schizophrenia or schizoaffective disorder. Intervention: three clozapine doses of 100 mg/day, 300 mg/day and 600 mg/day. Outcome: no additional data; study compared those with and without probable tardive dyskinesia in a subgroup of 33 participants from the Simpson 1999 trial. | |
| Allocation: random allocation. Participants: all had chronic schizophrenia. Intervention: compared BPRS, CGI & EPS scores at two clozapine doses of 400mg/day & 800mg/day. Outcomes: data limited to the 'first 25' patients with no information on which dosage group they belonged to; attempts to contact first author unsuccessful. | |
| Allocation: random allocation. Participants: all had schizophrenia. Intervention: clozapine commenced at 400 mg/day with participants randomised at end of week four to 400mg/day or 800mg/day. Study compared dosage groups on BPRS scores and numbers discontinuing in the first three weeks. Outcomes: compared BPRS scores by serum clozapine level, and not by clozapine dose; attempts to contact first author unsuccessful. | |
| Allocation: not randomly allocated. Participants: all had schizophrenia. Intervention: examined the relationship between plasma clozapine concentration and clinical response. | |
| Allocation: random allocation. Participants: all had chronic schizophrenia. Intervention: examined the change in BPRS and SANS scores at three different serum clozapine levels. Outcomes: compared BPRS scores by serum clozapine level, and not by clozapine dose. | |
| Allocation: random allocation. Participants: all had chronic schizophrenia. Intervention: examined the change in EEG at three different serum clozapine levels. Outcomes: compared BPRS scores by serum clozapine level, and not by clozapine dose. |
Characteristics of studies awaiting assessment [ordered by study ID]
| Methods | Allocation: unclear, no details. |
| Participants | Diagnosis: treatment resistant schizophrenia or schizoaffective disorder (DSM‐III‐R). Racial origin: not stated. |
| Interventions | 1. Clozapine: dose 100 mg/day. |
| Outcomes | None. |
| Notes | This report presents additional results from the Simpson 1999 trial. Patients were allowed to adapt to new clinical environment for minimum of four weeks, followed by four weeks of haloperidol treatment and a one‐week wash‐out period. Participants who were randomised to 300 mg/day or 600 mg/day of clozapine were subsequently categorised as “improvers” or “non‐improvers” based on change in CGI scores, and these groups were compared on demographics, baseline characteristics and BPRS scores. No information was given, however, on the dosage group to which the improvers and non‐improvers belonged. We contacted the lead author who agreed to send the missing data, but at the time of writing this had not been received. If we subsequently receive this data, we will include it in future versions of this review. |
Data and analyses
| Outcome or subgroup title | No. of studies | No. of participants | Statistical method | Effect size |
| 1 Mental state: Average endpoint score (BPRS‐A, high = poor) ‐ medium term Show forest plot | 1 | 31 | Mean Difference (IV, Random, 95% CI) | 3.55 [‐4.50, 11.60] |
| Analysis 1.1  Comparison 1 CLOZAPINE: VERY LOW DOSE (up to 149 mg/day) versus LOW DOSE (150 to 300 mg/day), Outcome 1 Mental state: Average endpoint score (BPRS‐A, high = poor) ‐ medium term. | ||||
| 2 Adverse effects: 1a. Weight ‐ BMI ‐ short term Show forest plot | 1 | 59 | Mean Difference (IV, Random, 95% CI) | ‐0.10 [‐0.95, 0.75] |
| Analysis 1.2 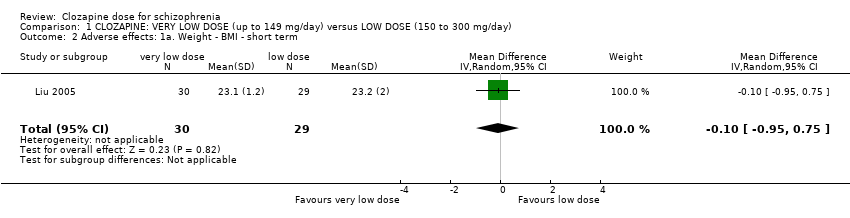 Comparison 1 CLOZAPINE: VERY LOW DOSE (up to 149 mg/day) versus LOW DOSE (150 to 300 mg/day), Outcome 2 Adverse effects: 1a. Weight ‐ BMI ‐ short term. | ||||
| 3 Adverse effects: 1b. Weight ‐ weight gain Show forest plot | 1 | Mean Difference (IV, Random, 95% CI) | Subtotals only | |
| Analysis 1.3 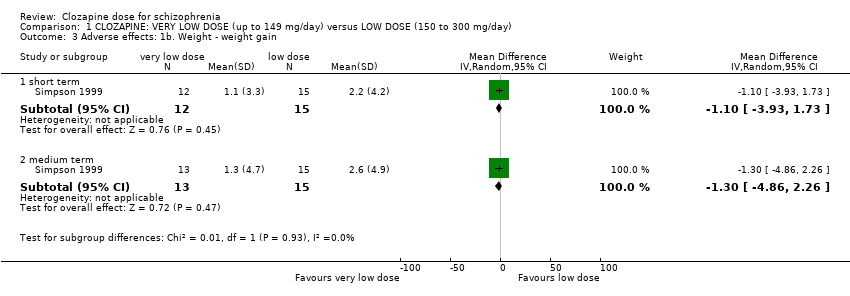 Comparison 1 CLOZAPINE: VERY LOW DOSE (up to 149 mg/day) versus LOW DOSE (150 to 300 mg/day), Outcome 3 Adverse effects: 1b. Weight ‐ weight gain. | ||||
| 3.1 short term | 1 | 27 | Mean Difference (IV, Random, 95% CI) | ‐1.1 [‐3.93, 1.73] |
| 3.2 medium term | 1 | 28 | Mean Difference (IV, Random, 95% CI) | ‐1.3 [‐4.86, 2.26] |
| 4 Adverse effects: 1c. Weight ‐ body weight at endpoint ‐ short term Show forest plot | 1 | 59 | Mean Difference (IV, Random, 95% CI) | 0.0 [‐3.92, 3.92] |
| Analysis 1.4 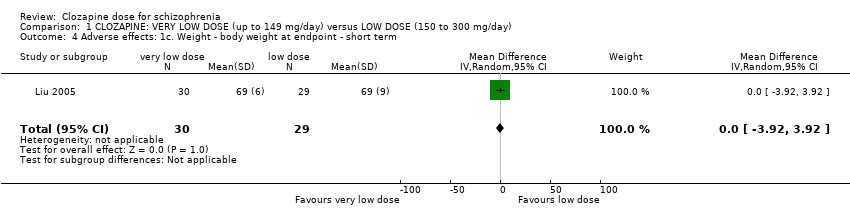 Comparison 1 CLOZAPINE: VERY LOW DOSE (up to 149 mg/day) versus LOW DOSE (150 to 300 mg/day), Outcome 4 Adverse effects: 1c. Weight ‐ body weight at endpoint ‐ short term. | ||||
| 5 Adverse effects: 2a. Metabolic ‐ blood glucose ‐ short term Show forest plot | 1 | Mean Difference (IV, Random, 95% CI) | Subtotals only | |
| Analysis 1.5  Comparison 1 CLOZAPINE: VERY LOW DOSE (up to 149 mg/day) versus LOW DOSE (150 to 300 mg/day), Outcome 5 Adverse effects: 2a. Metabolic ‐ blood glucose ‐ short term. | ||||
| 5.1 Before meal | 1 | 59 | Mean Difference (IV, Random, 95% CI) | ‐0.40 [‐1.06, 0.26] |
| 5.2 1 hour after meal | 1 | 59 | Mean Difference (IV, Random, 95% CI) | ‐0.70 [‐2.01, 0.61] |
| 5.3 2 hours after meal | 1 | 59 | Mean Difference (IV, Random, 95% CI) | 0.30 [‐0.98, 1.58] |
| 5.4 3 hours after meal | 1 | 59 | Mean Difference (IV, Random, 95% CI) | ‐0.70 [‐1.59, 0.19] |
| 6 Adverse effects: 2b. Metabolic ‐ lipid profile ‐ short term Show forest plot | 1 | Mean Difference (IV, Random, 95% CI) | Subtotals only | |
| Analysis 1.6  Comparison 1 CLOZAPINE: VERY LOW DOSE (up to 149 mg/day) versus LOW DOSE (150 to 300 mg/day), Outcome 6 Adverse effects: 2b. Metabolic ‐ lipid profile ‐ short term. | ||||
| 6.1 triglycerides | 1 | 59 | Mean Difference (IV, Random, 95% CI) | 1.00 [0.51, 1.49] |
| 6.2 cholesterol ‐ total | 1 | 59 | Mean Difference (IV, Random, 95% CI) | 0.50 [‐0.12, 1.12] |
| 6.3 lipoprotein ‐ high density (HDL) | 1 | 59 | Mean Difference (IV, Random, 95% CI) | 0.04 [‐0.14, 0.22] |
| 6.4 lipoprotein ‐ low density (LDL) | 1 | 59 | Mean Difference (IV, Random, 95% CI) | 0.10 [‐0.36, 0.56] |
| 6.5 Apo A‐1 | 1 | 59 | Mean Difference (IV, Random, 95% CI) | 0.05 [‐0.10, 0.20] |
| 6.6 Apo‐B | 1 | 59 | Mean Difference (IV, Random, 95% CI) | 0.13 [‐0.16, 0.42] |
| 7 Leaving the study early Show forest plot | 2 | 91 | Risk Ratio (M‐H, Random, 95% CI) | 1.50 [0.09, 25.41] |
| Analysis 1.7  Comparison 1 CLOZAPINE: VERY LOW DOSE (up to 149 mg/day) versus LOW DOSE (150 to 300 mg/day), Outcome 7 Leaving the study early. | ||||
| 7.1 any reason ‐ medium term | 1 | 31 | Risk Ratio (M‐H, Random, 95% CI) | 6.0 [0.31, 115.56] |
| 7.2 specific reason (alanine aminotransferase level) ‐ short term | 1 | 60 | Risk Ratio (M‐H, Random, 95% CI) | 0.33 [0.01, 7.87] |
| Outcome or subgroup title | No. of studies | No. of participants | Statistical method | Effect size |
| 1 Mental state: 1a. Average endpoint score (BPRS‐A, high = poor) ‐ medium term Show forest plot | 1 | 31 | Mean Difference (IV, Random, 95% CI) | 6.67 [‐2.09, 15.43] |
| Analysis 2.1  Comparison 2 CLOZAPINE: VERY LOW DOSE (up to 149 mg/day) versus STANDARD DOSE (301‐600 mg/day), Outcome 1 Mental state: 1a. Average endpoint score (BPRS‐A, high = poor) ‐ medium term. | ||||
| 2 Adverse effects: 1a. Weight ‐ BMI ‐ short term Show forest plot | 1 | 58 | Mean Difference (IV, Random, 95% CI) | 0.10 [‐0.76, 0.96] |
| Analysis 2.2 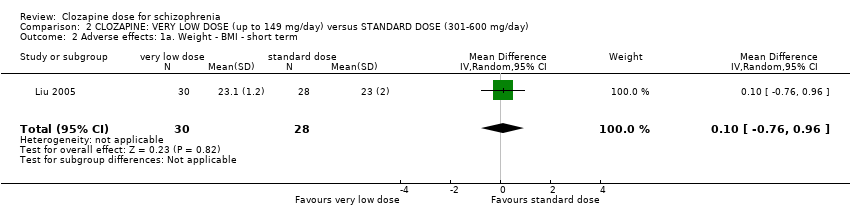 Comparison 2 CLOZAPINE: VERY LOW DOSE (up to 149 mg/day) versus STANDARD DOSE (301‐600 mg/day), Outcome 2 Adverse effects: 1a. Weight ‐ BMI ‐ short term. | ||||
| 3 Adverse effects: 1b. Weight ‐ weight gain Show forest plot | 1 | Mean Difference (IV, Random, 95% CI) | Subtotals only | |
| Analysis 2.3 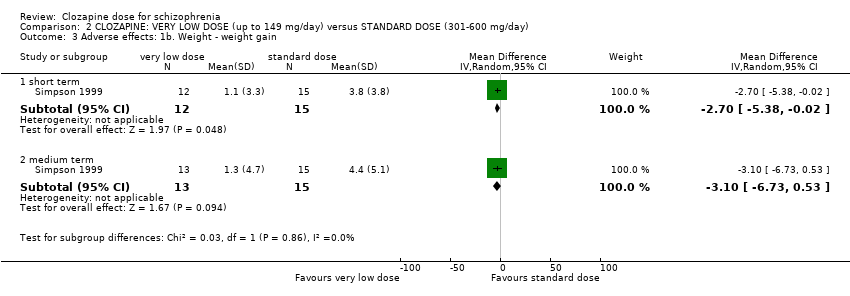 Comparison 2 CLOZAPINE: VERY LOW DOSE (up to 149 mg/day) versus STANDARD DOSE (301‐600 mg/day), Outcome 3 Adverse effects: 1b. Weight ‐ weight gain. | ||||
| 3.1 short term | 1 | 27 | Mean Difference (IV, Random, 95% CI) | ‐2.70 [‐5.38, ‐0.02] |
| 3.2 medium term | 1 | 28 | Mean Difference (IV, Random, 95% CI) | ‐3.10 [‐6.73, 0.53] |
| 4 Adverse effects: 1c. Weight ‐ body weight at endpoint ‐ short term Show forest plot | 1 | 58 | Mean Difference (IV, Random, 95% CI) | 1.0 [‐2.66, 4.66] |
| Analysis 2.4  Comparison 2 CLOZAPINE: VERY LOW DOSE (up to 149 mg/day) versus STANDARD DOSE (301‐600 mg/day), Outcome 4 Adverse effects: 1c. Weight ‐ body weight at endpoint ‐ short term. | ||||
| 5 Adverse effects: 2a. Metabolic ‐ blood glucose ‐ short term Show forest plot | 1 | Mean Difference (IV, Random, 95% CI) | Subtotals only | |
| Analysis 2.5  Comparison 2 CLOZAPINE: VERY LOW DOSE (up to 149 mg/day) versus STANDARD DOSE (301‐600 mg/day), Outcome 5 Adverse effects: 2a. Metabolic ‐ blood glucose ‐ short term. | ||||
| 5.1 one hour after meal | 1 | 58 | Mean Difference (IV, Random, 95% CI) | ‐1.60 [‐2.90, ‐0.30] |
| 5.2 before meal | 1 | 58 | Mean Difference (IV, Random, 95% CI) | ‐0.10 [‐0.68, 0.48] |
| 5.3 two hours after meal | 1 | 58 | Mean Difference (IV, Random, 95% CI) | ‐0.60 [‐1.89, 0.69] |
| 5.4 three hours after meal | 1 | 58 | Mean Difference (IV, Random, 95% CI) | ‐0.30 [‐1.55, 0.95] |
| 6 Adverse effects: 2b. Metabolic ‐ lipid profile ‐ short term Show forest plot | 1 | Mean Difference (IV, Random, 95% CI) | Subtotals only | |
| Analysis 2.6 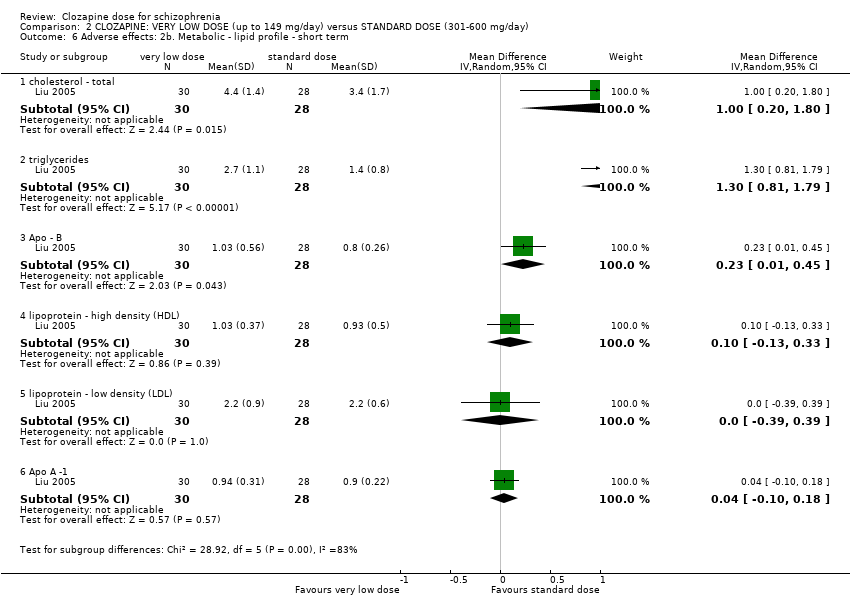 Comparison 2 CLOZAPINE: VERY LOW DOSE (up to 149 mg/day) versus STANDARD DOSE (301‐600 mg/day), Outcome 6 Adverse effects: 2b. Metabolic ‐ lipid profile ‐ short term. | ||||
| 6.1 cholesterol ‐ total | 1 | 58 | Mean Difference (IV, Random, 95% CI) | 1.00 [0.20, 1.80] |
| 6.2 triglycerides | 1 | 58 | Mean Difference (IV, Random, 95% CI) | 1.30 [0.81, 1.79] |
| 6.3 Apo ‐ B | 1 | 58 | Mean Difference (IV, Random, 95% CI) | 0.23 [0.01, 0.45] |
| 6.4 lipoprotein ‐ high density (HDL) | 1 | 58 | Mean Difference (IV, Random, 95% CI) | 0.10 [‐0.13, 0.33] |
| 6.5 lipoprotein ‐ low density (LDL) | 1 | 58 | Mean Difference (IV, Random, 95% CI) | 0.0 [‐0.39, 0.39] |
| 6.6 Apo A ‐1 | 1 | 58 | Mean Difference (IV, Random, 95% CI) | 0.04 [‐0.10, 0.18] |
| 7 Leaving the study early Show forest plot | 2 | 91 | Risk Ratio (M‐H, Random, 95% CI) | 0.73 [0.14, 3.72] |
| Analysis 2.7  Comparison 2 CLOZAPINE: VERY LOW DOSE (up to 149 mg/day) versus STANDARD DOSE (301‐600 mg/day), Outcome 7 Leaving the study early. | ||||
| 7.1 any reason ‐ medium term | 1 | 31 | Risk Ratio (M‐H, Random, 95% CI) | 1.21 [0.20, 7.55] |
| 7.2 specific reason (neutropenia and tachycardia) ‐ short term | 1 | 60 | Risk Ratio (M‐H, Random, 95% CI) | 0.2 [0.01, 4.00] |
| Outcome or subgroup title | No. of studies | No. of participants | Statistical method | Effect size |
| 1 Mental state: 1a. Clinically important response as (BPRS score > 30% change) Show forest plot | 1 | 176 | Risk Ratio (M‐H, Fixed, 95% CI) | 0.93 [0.78, 1.10] |
| Analysis 3.1  Comparison 3 CLOZAPINE: LOW DOSE (150 to 300 mg/day) versus STANDARD DOSE (301 to 600 mg/day), Outcome 1 Mental state: 1a. Clinically important response as (BPRS score > 30% change). | ||||
| 2 Mental state: 1b. Average endpoint score (BPRS‐A total, high = poor) Show forest plot | 2 | Mean Difference (IV, Random, 95% CI) | Subtotals only | |
| Analysis 3.2  Comparison 3 CLOZAPINE: LOW DOSE (150 to 300 mg/day) versus STANDARD DOSE (301 to 600 mg/day), Outcome 2 Mental state: 1b. Average endpoint score (BPRS‐A total, high = poor). | ||||
| 2.1 short term | 1 | 176 | Mean Difference (IV, Random, 95% CI) | 1.70 [‐1.26, 4.66] |
| 2.2 medium term | 1 | 34 | Mean Difference (IV, Random, 95% CI) | 3.12 [‐4.20, 10.44] |
| 3 Mental state: 1c. Average endpoint score (BPRS‐A subscores, high = poor) ‐ short term Show forest plot | 1 | Mean Difference (IV, Fixed, 95% CI) | Subtotals only | |
| Analysis 3.3 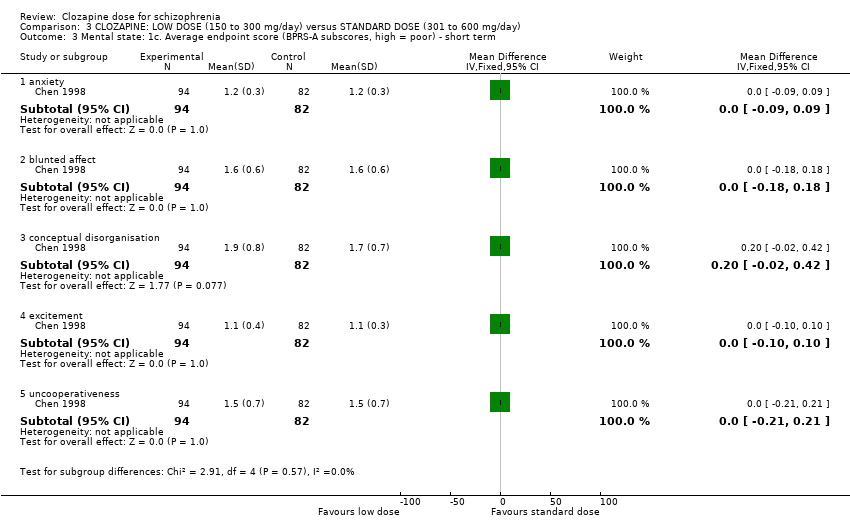 Comparison 3 CLOZAPINE: LOW DOSE (150 to 300 mg/day) versus STANDARD DOSE (301 to 600 mg/day), Outcome 3 Mental state: 1c. Average endpoint score (BPRS‐A subscores, high = poor) ‐ short term. | ||||
| 3.1 anxiety | 1 | 176 | Mean Difference (IV, Fixed, 95% CI) | 0.0 [‐0.09, 0.09] |
| 3.2 blunted affect | 1 | 176 | Mean Difference (IV, Fixed, 95% CI) | 0.0 [‐0.18, 0.18] |
| 3.3 conceptual disorganisation | 1 | 176 | Mean Difference (IV, Fixed, 95% CI) | 0.20 [‐0.02, 0.42] |
| 3.4 excitement | 1 | 176 | Mean Difference (IV, Fixed, 95% CI) | 0.0 [‐0.10, 0.10] |
| 3.5 uncooperativeness | 1 | 176 | Mean Difference (IV, Fixed, 95% CI) | 0.0 [‐0.21, 0.21] |
| 4 Mental state: 1e. Clinical improvement, clinician assessed Show forest plot | 2 | 141 | Risk Ratio (M‐H, Random, 95% CI) | 0.76 [0.36, 1.61] |
| Analysis 3.4  Comparison 3 CLOZAPINE: LOW DOSE (150 to 300 mg/day) versus STANDARD DOSE (301 to 600 mg/day), Outcome 4 Mental state: 1e. Clinical improvement, clinician assessed. | ||||
| 5 Adverse effects: 1a. Weight ‐ BMI ‐ short term Show forest plot | 1 | 57 | Mean Difference (IV, Random, 95% CI) | 0.20 [‐0.84, 1.24] |
| Analysis 3.5  Comparison 3 CLOZAPINE: LOW DOSE (150 to 300 mg/day) versus STANDARD DOSE (301 to 600 mg/day), Outcome 5 Adverse effects: 1a. Weight ‐ BMI ‐ short term. | ||||
| 6 Adverse effects: 1b. Weight ‐ weight gain Show forest plot | 1 | Mean Difference (IV, Random, 95% CI) | Subtotals only | |
| Analysis 3.6  Comparison 3 CLOZAPINE: LOW DOSE (150 to 300 mg/day) versus STANDARD DOSE (301 to 600 mg/day), Outcome 6 Adverse effects: 1b. Weight ‐ weight gain. | ||||
| 6.1 short term | 1 | 165 | Mean Difference (IV, Random, 95% CI) | ‐1.60 [‐3.81, 0.61] |
| 6.2 medium term | 1 | 30 | Mean Difference (IV, Random, 95% CI) | ‐1.80 [‐5.38, 1.78] |
| 7 Adverse effects: 1c. Weight ‐ body weight at endpoint ‐ short term Show forest plot | 1 | 57 | Mean Difference (IV, Random, 95% CI) | 1.0 [‐3.42, 5.42] |
| Analysis 3.7  Comparison 3 CLOZAPINE: LOW DOSE (150 to 300 mg/day) versus STANDARD DOSE (301 to 600 mg/day), Outcome 7 Adverse effects: 1c. Weight ‐ body weight at endpoint ‐ short term. | ||||
| 8 Adverse effects: 2a. Metabolic ‐ blood glucose ‐ short term Show forest plot | 1 | Mean Difference (IV, Random, 95% CI) | Subtotals only | |
| Analysis 3.8 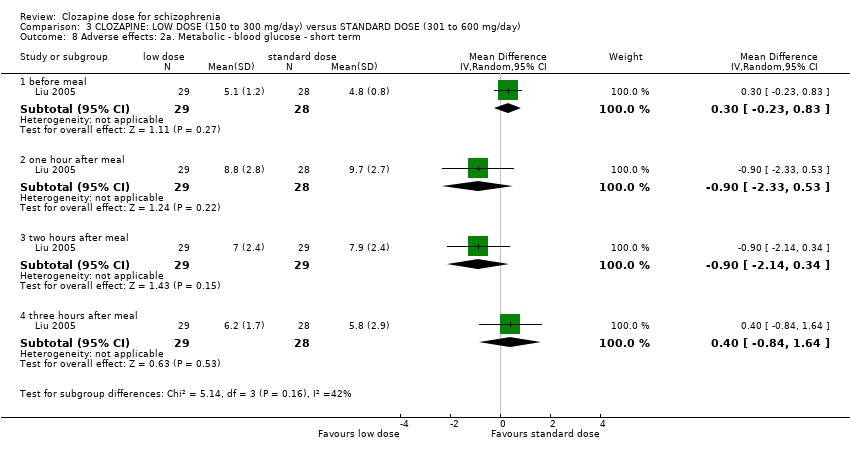 Comparison 3 CLOZAPINE: LOW DOSE (150 to 300 mg/day) versus STANDARD DOSE (301 to 600 mg/day), Outcome 8 Adverse effects: 2a. Metabolic ‐ blood glucose ‐ short term. | ||||
| 8.1 before meal | 1 | 57 | Mean Difference (IV, Random, 95% CI) | 0.30 [‐0.23, 0.83] |
| 8.2 one hour after meal | 1 | 57 | Mean Difference (IV, Random, 95% CI) | ‐0.90 [‐2.33, 0.53] |
| 8.3 two hours after meal | 1 | 58 | Mean Difference (IV, Random, 95% CI) | ‐0.90 [‐2.14, 0.34] |
| 8.4 three hours after meal | 1 | 57 | Mean Difference (IV, Random, 95% CI) | 0.40 [‐0.84, 1.64] |
| 9 Adverse effects: 2b. Metabolic ‐ lipid profile ‐ short term Show forest plot | 1 | Mean Difference (IV, Random, 95% CI) | Subtotals only | |
| Analysis 3.9  Comparison 3 CLOZAPINE: LOW DOSE (150 to 300 mg/day) versus STANDARD DOSE (301 to 600 mg/day), Outcome 9 Adverse effects: 2b. Metabolic ‐ lipid profile ‐ short term. | ||||
| 9.1 cholesterol ‐ total | 1 | 57 | Mean Difference (IV, Random, 95% CI) | 0.5 [‐0.29, 1.29] |
| 9.2 triglycerides | 1 | 57 | Mean Difference (IV, Random, 95% CI) | 0.30 [‐0.12, 0.72] |
| 9.3 lipoprotein ‐ high density (HDL) | 1 | 57 | Mean Difference (IV, Random, 95% CI) | 0.06 [‐0.16, 0.28] |
| 9.4 lipoprotein ‐ low density (LDL) | 1 | 57 | Mean Difference (IV, Random, 95% CI) | ‐0.10 [‐0.50, 0.30] |
| 9.5 Apo A ‐1 | 1 | 57 | Mean Difference (IV, Random, 95% CI) | ‐0.01 [‐0.14, 0.12] |
| 9.6 Apo ‐ B | 1 | 57 | Mean Difference (IV, Random, 95% CI) | 0.10 [‐0.14, 0.34] |
| 10 Adverse effects: 3. Various effects ‐ short term Show forest plot | 1 | Risk Ratio (M‐H, Fixed, 95% CI) | Subtotals only | |
| Analysis 3.10  Comparison 3 CLOZAPINE: LOW DOSE (150 to 300 mg/day) versus STANDARD DOSE (301 to 600 mg/day), Outcome 10 Adverse effects: 3. Various effects ‐ short term. | ||||
| 10.1 lethargy | 1 | 176 | Risk Ratio (M‐H, Fixed, 95% CI) | 0.77 [0.60, 0.97] |
| 10.2 hypersalivation | 1 | 176 | Risk Ratio (M‐H, Fixed, 95% CI) | 0.70 [0.57, 0.84] |
| 10.3 dizziness | 1 | 176 | Risk Ratio (M‐H, Fixed, 95% CI) | 0.56 [0.39, 0.81] |
| 10.4 tachycardia | 1 | 176 | Risk Ratio (M‐H, Fixed, 95% CI) | 0.57 [0.45, 0.71] |
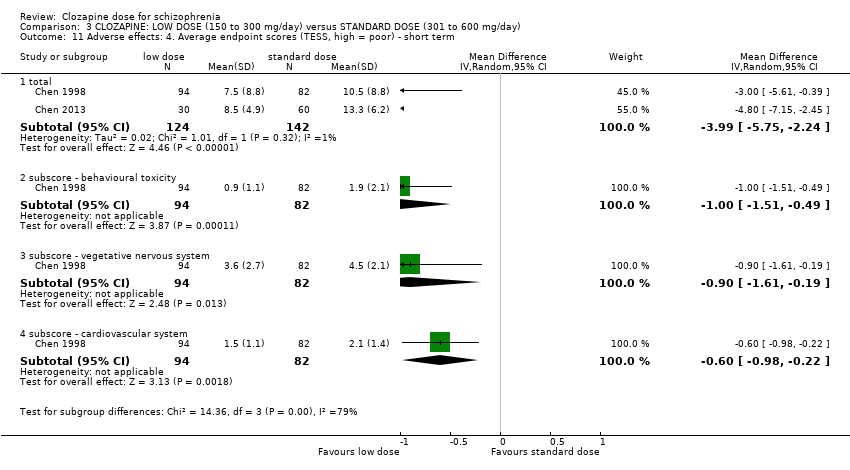
| 11 Adverse effects: 4. Average endpoint scores (TESS, high = poor) ‐ short term Show forest plot | 2 | Mean Difference (IV, Random, 95% CI) | Subtotals only | |
| Analysis 3.11  Comparison 3 CLOZAPINE: LOW DOSE (150 to 300 mg/day) versus STANDARD DOSE (301 to 600 mg/day), Outcome 11 Adverse effects: 4. Average endpoint scores (TESS, high = poor) ‐ short term. | ||||
| 11.1 total | 2 | 266 | Mean Difference (IV, Random, 95% CI) | ‐3.99 [‐5.75, ‐2.24] |
| 11.2 subscore ‐ behavioural toxicity | 1 | 176 | Mean Difference (IV, Random, 95% CI) | 1.00 [‐1.51, ‐0.49] |
| 11.3 subscore ‐ vegetative nervous system | 1 | 176 | Mean Difference (IV, Random, 95% CI) | ‐0.90 [‐1.61, ‐0.19] |
| 11.4 subscore ‐ cardiovascular system | 1 | 176 | Mean Difference (IV, Random, 95% CI) | ‐0.60 [‐0.98, ‐0.22] |
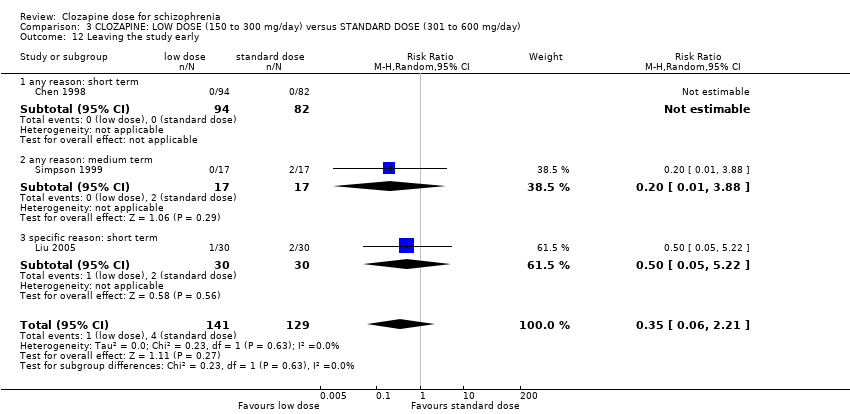
| 12 Leaving the study early Show forest plot | 3 | 270 | Risk Ratio (M‐H, Random, 95% CI) | 0.35 [0.06, 2.21] |
| Analysis 3.12  Comparison 3 CLOZAPINE: LOW DOSE (150 to 300 mg/day) versus STANDARD DOSE (301 to 600 mg/day), Outcome 12 Leaving the study early. | ||||
| 12.1 any reason: short term | 1 | 176 | Risk Ratio (M‐H, Random, 95% CI) | 0.0 [0.0, 0.0] |
| 12.2 any reason: medium term | 1 | 34 | Risk Ratio (M‐H, Random, 95% CI) | 0.20 [0.01, 3.88] |
| 12.3 specific reason: short term | 1 | 60 | Risk Ratio (M‐H, Random, 95% CI) | 0.5 [0.05, 5.22] |

Clozapine structure

Study flow diagram.

Risk of bias graph: review authors' judgements about each risk of bias item presented as percentages across all included studies.

Risk of bias summary: review authors' judgements about each risk of bias item for each included study.
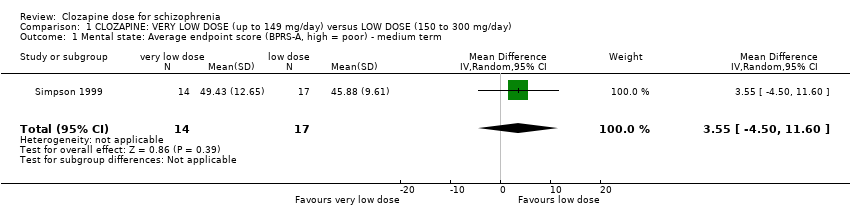
Comparison 1 CLOZAPINE: VERY LOW DOSE (up to 149 mg/day) versus LOW DOSE (150 to 300 mg/day), Outcome 1 Mental state: Average endpoint score (BPRS‐A, high = poor) ‐ medium term.

Comparison 1 CLOZAPINE: VERY LOW DOSE (up to 149 mg/day) versus LOW DOSE (150 to 300 mg/day), Outcome 2 Adverse effects: 1a. Weight ‐ BMI ‐ short term.

Comparison 1 CLOZAPINE: VERY LOW DOSE (up to 149 mg/day) versus LOW DOSE (150 to 300 mg/day), Outcome 3 Adverse effects: 1b. Weight ‐ weight gain.

Comparison 1 CLOZAPINE: VERY LOW DOSE (up to 149 mg/day) versus LOW DOSE (150 to 300 mg/day), Outcome 4 Adverse effects: 1c. Weight ‐ body weight at endpoint ‐ short term.
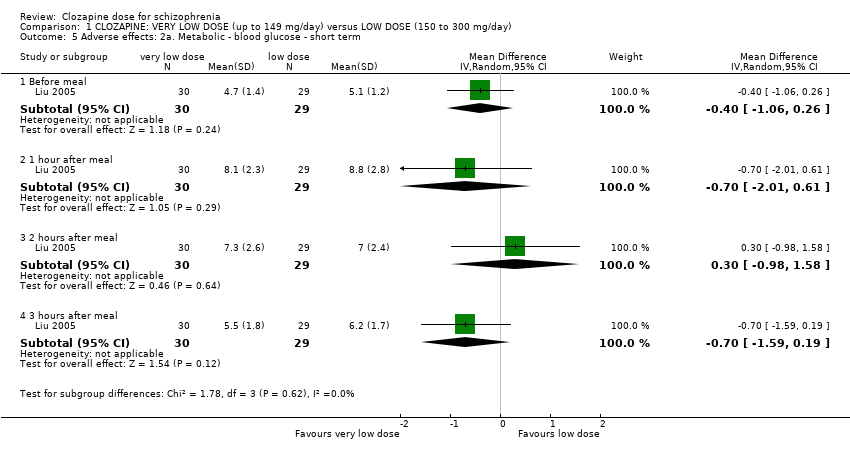
Comparison 1 CLOZAPINE: VERY LOW DOSE (up to 149 mg/day) versus LOW DOSE (150 to 300 mg/day), Outcome 5 Adverse effects: 2a. Metabolic ‐ blood glucose ‐ short term.

Comparison 1 CLOZAPINE: VERY LOW DOSE (up to 149 mg/day) versus LOW DOSE (150 to 300 mg/day), Outcome 6 Adverse effects: 2b. Metabolic ‐ lipid profile ‐ short term.
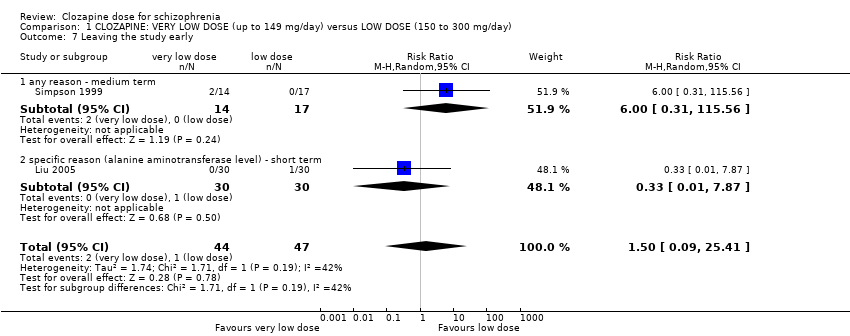
Comparison 1 CLOZAPINE: VERY LOW DOSE (up to 149 mg/day) versus LOW DOSE (150 to 300 mg/day), Outcome 7 Leaving the study early.
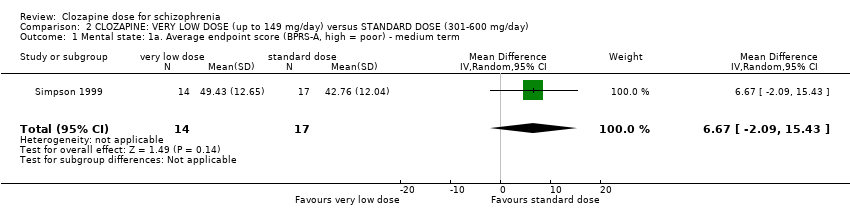
Comparison 2 CLOZAPINE: VERY LOW DOSE (up to 149 mg/day) versus STANDARD DOSE (301‐600 mg/day), Outcome 1 Mental state: 1a. Average endpoint score (BPRS‐A, high = poor) ‐ medium term.

Comparison 2 CLOZAPINE: VERY LOW DOSE (up to 149 mg/day) versus STANDARD DOSE (301‐600 mg/day), Outcome 2 Adverse effects: 1a. Weight ‐ BMI ‐ short term.

Comparison 2 CLOZAPINE: VERY LOW DOSE (up to 149 mg/day) versus STANDARD DOSE (301‐600 mg/day), Outcome 3 Adverse effects: 1b. Weight ‐ weight gain.

Comparison 2 CLOZAPINE: VERY LOW DOSE (up to 149 mg/day) versus STANDARD DOSE (301‐600 mg/day), Outcome 4 Adverse effects: 1c. Weight ‐ body weight at endpoint ‐ short term.

Comparison 2 CLOZAPINE: VERY LOW DOSE (up to 149 mg/day) versus STANDARD DOSE (301‐600 mg/day), Outcome 5 Adverse effects: 2a. Metabolic ‐ blood glucose ‐ short term.

Comparison 2 CLOZAPINE: VERY LOW DOSE (up to 149 mg/day) versus STANDARD DOSE (301‐600 mg/day), Outcome 6 Adverse effects: 2b. Metabolic ‐ lipid profile ‐ short term.

Comparison 2 CLOZAPINE: VERY LOW DOSE (up to 149 mg/day) versus STANDARD DOSE (301‐600 mg/day), Outcome 7 Leaving the study early.

Comparison 3 CLOZAPINE: LOW DOSE (150 to 300 mg/day) versus STANDARD DOSE (301 to 600 mg/day), Outcome 1 Mental state: 1a. Clinically important response as (BPRS score > 30% change).

Comparison 3 CLOZAPINE: LOW DOSE (150 to 300 mg/day) versus STANDARD DOSE (301 to 600 mg/day), Outcome 2 Mental state: 1b. Average endpoint score (BPRS‐A total, high = poor).

Comparison 3 CLOZAPINE: LOW DOSE (150 to 300 mg/day) versus STANDARD DOSE (301 to 600 mg/day), Outcome 3 Mental state: 1c. Average endpoint score (BPRS‐A subscores, high = poor) ‐ short term.
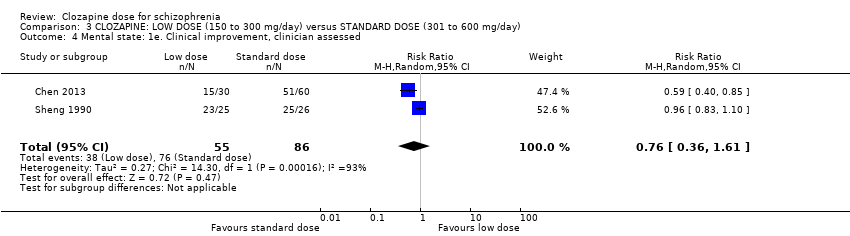
Comparison 3 CLOZAPINE: LOW DOSE (150 to 300 mg/day) versus STANDARD DOSE (301 to 600 mg/day), Outcome 4 Mental state: 1e. Clinical improvement, clinician assessed.

Comparison 3 CLOZAPINE: LOW DOSE (150 to 300 mg/day) versus STANDARD DOSE (301 to 600 mg/day), Outcome 5 Adverse effects: 1a. Weight ‐ BMI ‐ short term.
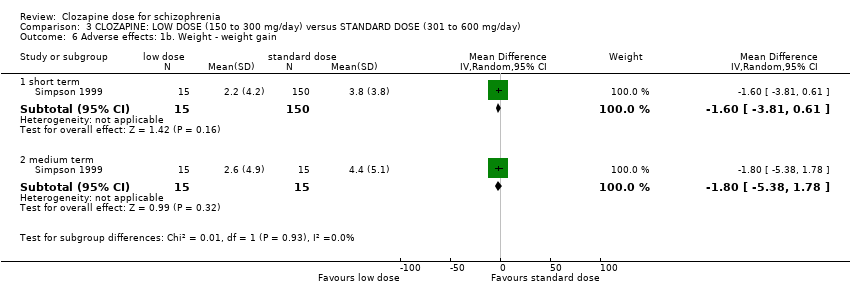
Comparison 3 CLOZAPINE: LOW DOSE (150 to 300 mg/day) versus STANDARD DOSE (301 to 600 mg/day), Outcome 6 Adverse effects: 1b. Weight ‐ weight gain.

Comparison 3 CLOZAPINE: LOW DOSE (150 to 300 mg/day) versus STANDARD DOSE (301 to 600 mg/day), Outcome 7 Adverse effects: 1c. Weight ‐ body weight at endpoint ‐ short term.

Comparison 3 CLOZAPINE: LOW DOSE (150 to 300 mg/day) versus STANDARD DOSE (301 to 600 mg/day), Outcome 8 Adverse effects: 2a. Metabolic ‐ blood glucose ‐ short term.
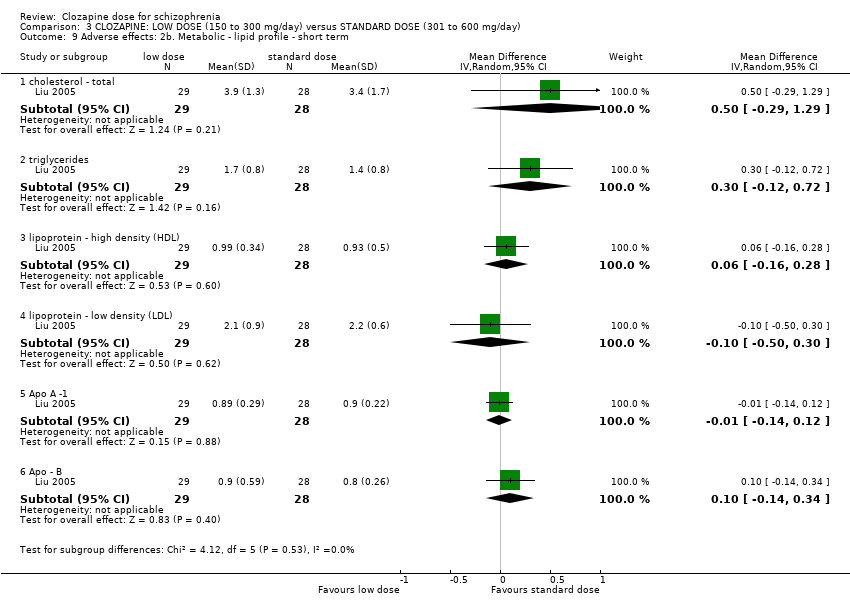
Comparison 3 CLOZAPINE: LOW DOSE (150 to 300 mg/day) versus STANDARD DOSE (301 to 600 mg/day), Outcome 9 Adverse effects: 2b. Metabolic ‐ lipid profile ‐ short term.
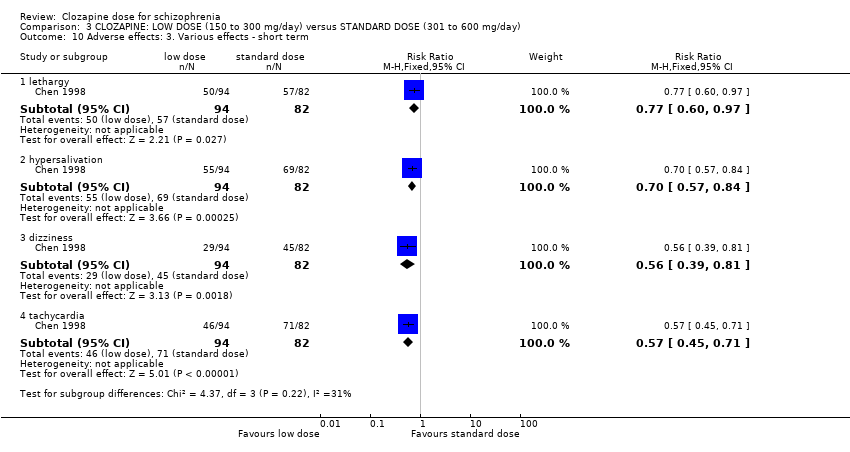
Comparison 3 CLOZAPINE: LOW DOSE (150 to 300 mg/day) versus STANDARD DOSE (301 to 600 mg/day), Outcome 10 Adverse effects: 3. Various effects ‐ short term.
Comparison 3 CLOZAPINE: LOW DOSE (150 to 300 mg/day) versus STANDARD DOSE (301 to 600 mg/day), Outcome 11 Adverse effects: 4. Average endpoint scores (TESS, high = poor) ‐ short term.
Comparison 3 CLOZAPINE: LOW DOSE (150 to 300 mg/day) versus STANDARD DOSE (301 to 600 mg/day), Outcome 12 Leaving the study early.
| CLOZAPINE: VERY LOW DOSE (up to 149 mg/day) versus LOW DOSE (150‐300 mg/day) for schizophrenia | ||||||
| Patient or population: patients with schizophrenia | ||||||
| Outcomes | Illustrative comparative risks* (95% CI) | Relative effect | No of Participants | Quality of the evidence | Comments | |
| Assumed risk | Corresponding risk | |||||
| Control | Clozapine: very low dose (up to 149 mg/day) versus low dose (150 mg/day to 300 mg/day) | |||||
| Global state: clinically important response, as defined by individual studies | See comment | See comment | Not estimable | 0 | See comment | No study reported this outcome. |
| Mental state: clinically important response, as defined by individual studies * Follow‐up: 16 weeks | The mean clinical response: mental state ‐ average scores ‐ medium term endpoint (BPRS‐A, high = worse) in the intervention group was | 31 | ⊕⊝⊝⊝ | * Pre‐defined outcome not reported: Mental state measured as average endpoint scores (BPRS‐A, high = worse). | ||
| Functioning: clinically important change in general functioning, as defined by individual studies | See comment | See comment | Not estimable | 0 | See comment | No study reported this outcome. |
| Adverse effect: clinically important adverse effect (weight ‐ BMI) | The mean adverse effect ‐ any clinically important specific adverse effects ‐ BMI in the intervention group was | 59 | ⊕⊕⊝⊝ | |||
| Service use: number of days hospitalised | See comment | See comment | Not estimable | 0 | See comment | No study reported this outcome. |
| Service use: time to hospitalisation | See comment | See comment | Not estimable | 0 | See comment | No study reported this outcome. |
| Quality of life: clinically important change in general quality of life | See comment | See comment | Not estimable | 0 | See comment | No study reported this outcome. |
| *The basis for the assumed risk (e.g. the median control group risk across studies) is provided in footnotes. The corresponding risk (and its 95% CI) is based on the assumed risk in the comparison group and the relative effect of the intervention (and its 95% CI). | ||||||
| GRADE Working Group grades of evidence | ||||||
| 1 Risk of bias: rated as 'serious' (downgraded by 1) due to attrition bias, reporting bias, and sponsorship by Novartis Pharmaceuticals. | ||||||
| CLOZAPINE: VERY LOW DOSE (up to 149 mg/day) versus STANDARD DOSE (301‐600 mg/day) for schizophrenia | ||||||
| Patient or population: patients with schizophrenia | ||||||
| Outcomes | Illustrative comparative risks* (95% CI) | Relative effect | No of Participants | Quality of the evidence | Comments | |
| Assumed risk | Corresponding risk | |||||
| Control | Clozapine: very low dose (up to 149 mg/day) versus standard dose (301 mg/day to 600 mg/day) | |||||
| Global state: clinically important response, as defined by individual studies | See comment | See comment | Not estimable | 0 | See comment | No study reported this outcome. |
| Mental state: clinically important response, as defined by individual studies * Follow‐up: 16 weeks | The mean clinical response: mental state ‐ average scores ‐ medium term endpoint (BPRS‐A, high = worse) in the intervention group was | 31 | ⊕⊝⊝⊝ | * Pre‐defined outcome not reported: Mental state measured as average endpoint scores (BPRS‐A, high = worse). | ||
| Functioning: clinically important change in general functioning, as defined by individual studies | See comment | See comment | Not estimable | 0 | See comment | No study reported this outcome. |
| Adverse effect: clinically important adverse effect (weight ‐ BMI) | The mean adverse effect ‐ any clinically important specific adverse effects ‐ BMI in the intervention group was | 58 | ⊕⊕⊝⊝ | |||
| Service use: number of days hospitalised | See comment | See comment | Not estimable | 0 | See comment | No study reported this outcome. |
| Service use: time to hospitalisation | See comment | See comment | Not estimable | 0 | See comment | No study reported this outcome. |
| Quality of life: clinically important change in general quality of life | See comment | See comment | Not estimable | 0 | See comment | No study reported this outcome. |
| *The basis for the assumed risk (e.g. the median control group risk across studies) is provided in footnotes. The corresponding risk (and its 95% confidence interval) is based on the assumed risk in the comparison group and the relative effect of the intervention (and its 95% CI). | ||||||
| GRADE Working Group grades of evidence | ||||||
| 1 Risk of bias: rated as 'serious' (downgraded by 1) due to attrition bias, reporting bias, and sponsorship by Novartis Pharmaceuticals. | ||||||
| Clozapine: low dose (150 mg/day to 300 mg/day) versus standard dose (301 mg/day to 600 mg/day) for schizophrenia | ||||||
| Patient or population: patients with schizophrenia | ||||||
| Outcomes | Illustrative comparative risks* (95% CI) | Relative effect | No of Participants | Quality of the evidence | Comments | |
| Assumed risk | Corresponding risk | |||||
| Control | Clozapine: low dose (150 mg/day to 300 mg/day) versus standard dose (301 mg/day to 600 mg/day) | |||||
| Global state: clinically important response, as defined by individual studies | See comment | See comment | Not estimable | 0 | See comment | No study reported this outcome. |
| Mental state: clinically important response in mental state | Low1 | RR 0.93 | 176 | ⊕⊕⊝⊝ | ||
| 200 per 1000 | 186 per 1000 | |||||
| Moderate1 | ||||||
| 500 per 1000 | 465 per 1000 | |||||
| High1 | ||||||
| 800 per 1000 | 744 per 1000 | |||||
| Functioning: clinically important change in general functioning, as defined by individual studies | See comment | See comment | Not estimable | 0 | See comment | No study reported this outcome. |
| Adverse effect: clinically important adverse effect ( weight ‐ BMI) | The mean adverse effect ‐ any clinically important specific adverse effects ‐ BMI in the intervention group was | 57 | ⊕⊕⊝⊝ | |||
| Service use: number of days hospitalised | See comment | See comment | Not estimable | 0 | See comment | No study reported this outcome. |
| Service use: time to hospitalisation | See comment | See comment | Not estimable | 0 | See comment | No study reported this outcome. |
| Quality of life: clinically important change in general quality of life | See comment | See comment | Not estimable | 0 | See comment | No study reported this outcome. |
| *The basis for the assumed risk (e.g. the median control group risk across studies) is provided in footnotes. The corresponding risk (and its 95% confidence interval) is based on the assumed risk in the comparison group and the relative effect of the intervention (and its 95% CI). | ||||||
| GRADE Working Group grades of evidence | ||||||
| 1 Risk of bias rated as 'serious' (downgraded by 1) as allocation concealment, blinding status and trial sponsorship unclear 3 Imprecision: rated as 'serious' (downgraded by 1) as only one study providing data, small number of participants (less than 200) | ||||||
| Title | Reference |
| Clozapine versus other atypical antipsychotics for schizophrenia | |
| Clozapine combined with different antipsychotic drugs for treatment resistant schizophrenia | |
| Clozapine versus typical neuroleptic medication for schizophrenia | |
| Pharmacological interventions for clozapine‐induced hypersalivation |
| Outcome or subgroup title | No. of studies | No. of participants | Statistical method | Effect size |
| 1 Mental state: Average endpoint score (BPRS‐A, high = poor) ‐ medium term Show forest plot | 1 | 31 | Mean Difference (IV, Random, 95% CI) | 3.55 [‐4.50, 11.60] |
| 2 Adverse effects: 1a. Weight ‐ BMI ‐ short term Show forest plot | 1 | 59 | Mean Difference (IV, Random, 95% CI) | ‐0.10 [‐0.95, 0.75] |
| 3 Adverse effects: 1b. Weight ‐ weight gain Show forest plot | 1 | Mean Difference (IV, Random, 95% CI) | Subtotals only | |
| 3.1 short term | 1 | 27 | Mean Difference (IV, Random, 95% CI) | ‐1.1 [‐3.93, 1.73] |
| 3.2 medium term | 1 | 28 | Mean Difference (IV, Random, 95% CI) | ‐1.3 [‐4.86, 2.26] |
| 4 Adverse effects: 1c. Weight ‐ body weight at endpoint ‐ short term Show forest plot | 1 | 59 | Mean Difference (IV, Random, 95% CI) | 0.0 [‐3.92, 3.92] |
| 5 Adverse effects: 2a. Metabolic ‐ blood glucose ‐ short term Show forest plot | 1 | Mean Difference (IV, Random, 95% CI) | Subtotals only | |
| 5.1 Before meal | 1 | 59 | Mean Difference (IV, Random, 95% CI) | ‐0.40 [‐1.06, 0.26] |
| 5.2 1 hour after meal | 1 | 59 | Mean Difference (IV, Random, 95% CI) | ‐0.70 [‐2.01, 0.61] |
| 5.3 2 hours after meal | 1 | 59 | Mean Difference (IV, Random, 95% CI) | 0.30 [‐0.98, 1.58] |
| 5.4 3 hours after meal | 1 | 59 | Mean Difference (IV, Random, 95% CI) | ‐0.70 [‐1.59, 0.19] |
| 6 Adverse effects: 2b. Metabolic ‐ lipid profile ‐ short term Show forest plot | 1 | Mean Difference (IV, Random, 95% CI) | Subtotals only | |
| 6.1 triglycerides | 1 | 59 | Mean Difference (IV, Random, 95% CI) | 1.00 [0.51, 1.49] |
| 6.2 cholesterol ‐ total | 1 | 59 | Mean Difference (IV, Random, 95% CI) | 0.50 [‐0.12, 1.12] |
| 6.3 lipoprotein ‐ high density (HDL) | 1 | 59 | Mean Difference (IV, Random, 95% CI) | 0.04 [‐0.14, 0.22] |
| 6.4 lipoprotein ‐ low density (LDL) | 1 | 59 | Mean Difference (IV, Random, 95% CI) | 0.10 [‐0.36, 0.56] |
| 6.5 Apo A‐1 | 1 | 59 | Mean Difference (IV, Random, 95% CI) | 0.05 [‐0.10, 0.20] |
| 6.6 Apo‐B | 1 | 59 | Mean Difference (IV, Random, 95% CI) | 0.13 [‐0.16, 0.42] |
| 7 Leaving the study early Show forest plot | 2 | 91 | Risk Ratio (M‐H, Random, 95% CI) | 1.50 [0.09, 25.41] |
| 7.1 any reason ‐ medium term | 1 | 31 | Risk Ratio (M‐H, Random, 95% CI) | 6.0 [0.31, 115.56] |
| 7.2 specific reason (alanine aminotransferase level) ‐ short term | 1 | 60 | Risk Ratio (M‐H, Random, 95% CI) | 0.33 [0.01, 7.87] |
| Outcome or subgroup title | No. of studies | No. of participants | Statistical method | Effect size |
| 1 Mental state: 1a. Average endpoint score (BPRS‐A, high = poor) ‐ medium term Show forest plot | 1 | 31 | Mean Difference (IV, Random, 95% CI) | 6.67 [‐2.09, 15.43] |
| 2 Adverse effects: 1a. Weight ‐ BMI ‐ short term Show forest plot | 1 | 58 | Mean Difference (IV, Random, 95% CI) | 0.10 [‐0.76, 0.96] |
| 3 Adverse effects: 1b. Weight ‐ weight gain Show forest plot | 1 | Mean Difference (IV, Random, 95% CI) | Subtotals only | |
| 3.1 short term | 1 | 27 | Mean Difference (IV, Random, 95% CI) | ‐2.70 [‐5.38, ‐0.02] |
| 3.2 medium term | 1 | 28 | Mean Difference (IV, Random, 95% CI) | ‐3.10 [‐6.73, 0.53] |
| 4 Adverse effects: 1c. Weight ‐ body weight at endpoint ‐ short term Show forest plot | 1 | 58 | Mean Difference (IV, Random, 95% CI) | 1.0 [‐2.66, 4.66] |
| 5 Adverse effects: 2a. Metabolic ‐ blood glucose ‐ short term Show forest plot | 1 | Mean Difference (IV, Random, 95% CI) | Subtotals only | |
| 5.1 one hour after meal | 1 | 58 | Mean Difference (IV, Random, 95% CI) | ‐1.60 [‐2.90, ‐0.30] |
| 5.2 before meal | 1 | 58 | Mean Difference (IV, Random, 95% CI) | ‐0.10 [‐0.68, 0.48] |
| 5.3 two hours after meal | 1 | 58 | Mean Difference (IV, Random, 95% CI) | ‐0.60 [‐1.89, 0.69] |
| 5.4 three hours after meal | 1 | 58 | Mean Difference (IV, Random, 95% CI) | ‐0.30 [‐1.55, 0.95] |
| 6 Adverse effects: 2b. Metabolic ‐ lipid profile ‐ short term Show forest plot | 1 | Mean Difference (IV, Random, 95% CI) | Subtotals only | |
| 6.1 cholesterol ‐ total | 1 | 58 | Mean Difference (IV, Random, 95% CI) | 1.00 [0.20, 1.80] |
| 6.2 triglycerides | 1 | 58 | Mean Difference (IV, Random, 95% CI) | 1.30 [0.81, 1.79] |
| 6.3 Apo ‐ B | 1 | 58 | Mean Difference (IV, Random, 95% CI) | 0.23 [0.01, 0.45] |
| 6.4 lipoprotein ‐ high density (HDL) | 1 | 58 | Mean Difference (IV, Random, 95% CI) | 0.10 [‐0.13, 0.33] |
| 6.5 lipoprotein ‐ low density (LDL) | 1 | 58 | Mean Difference (IV, Random, 95% CI) | 0.0 [‐0.39, 0.39] |
| 6.6 Apo A ‐1 | 1 | 58 | Mean Difference (IV, Random, 95% CI) | 0.04 [‐0.10, 0.18] |
| 7 Leaving the study early Show forest plot | 2 | 91 | Risk Ratio (M‐H, Random, 95% CI) | 0.73 [0.14, 3.72] |
| 7.1 any reason ‐ medium term | 1 | 31 | Risk Ratio (M‐H, Random, 95% CI) | 1.21 [0.20, 7.55] |
| 7.2 specific reason (neutropenia and tachycardia) ‐ short term | 1 | 60 | Risk Ratio (M‐H, Random, 95% CI) | 0.2 [0.01, 4.00] |
| Outcome or subgroup title | No. of studies | No. of participants | Statistical method | Effect size |
| 1 Mental state: 1a. Clinically important response as (BPRS score > 30% change) Show forest plot | 1 | 176 | Risk Ratio (M‐H, Fixed, 95% CI) | 0.93 [0.78, 1.10] |
| 2 Mental state: 1b. Average endpoint score (BPRS‐A total, high = poor) Show forest plot | 2 | Mean Difference (IV, Random, 95% CI) | Subtotals only | |
| 2.1 short term | 1 | 176 | Mean Difference (IV, Random, 95% CI) | 1.70 [‐1.26, 4.66] |
| 2.2 medium term | 1 | 34 | Mean Difference (IV, Random, 95% CI) | 3.12 [‐4.20, 10.44] |
| 3 Mental state: 1c. Average endpoint score (BPRS‐A subscores, high = poor) ‐ short term Show forest plot | 1 | Mean Difference (IV, Fixed, 95% CI) | Subtotals only | |
| 3.1 anxiety | 1 | 176 | Mean Difference (IV, Fixed, 95% CI) | 0.0 [‐0.09, 0.09] |
| 3.2 blunted affect | 1 | 176 | Mean Difference (IV, Fixed, 95% CI) | 0.0 [‐0.18, 0.18] |
| 3.3 conceptual disorganisation | 1 | 176 | Mean Difference (IV, Fixed, 95% CI) | 0.20 [‐0.02, 0.42] |
| 3.4 excitement | 1 | 176 | Mean Difference (IV, Fixed, 95% CI) | 0.0 [‐0.10, 0.10] |
| 3.5 uncooperativeness | 1 | 176 | Mean Difference (IV, Fixed, 95% CI) | 0.0 [‐0.21, 0.21] |
| 4 Mental state: 1e. Clinical improvement, clinician assessed Show forest plot | 2 | 141 | Risk Ratio (M‐H, Random, 95% CI) | 0.76 [0.36, 1.61] |
| 5 Adverse effects: 1a. Weight ‐ BMI ‐ short term Show forest plot | 1 | 57 | Mean Difference (IV, Random, 95% CI) | 0.20 [‐0.84, 1.24] |
| 6 Adverse effects: 1b. Weight ‐ weight gain Show forest plot | 1 | Mean Difference (IV, Random, 95% CI) | Subtotals only | |
| 6.1 short term | 1 | 165 | Mean Difference (IV, Random, 95% CI) | ‐1.60 [‐3.81, 0.61] |
| 6.2 medium term | 1 | 30 | Mean Difference (IV, Random, 95% CI) | ‐1.80 [‐5.38, 1.78] |
| 7 Adverse effects: 1c. Weight ‐ body weight at endpoint ‐ short term Show forest plot | 1 | 57 | Mean Difference (IV, Random, 95% CI) | 1.0 [‐3.42, 5.42] |
| 8 Adverse effects: 2a. Metabolic ‐ blood glucose ‐ short term Show forest plot | 1 | Mean Difference (IV, Random, 95% CI) | Subtotals only | |
| 8.1 before meal | 1 | 57 | Mean Difference (IV, Random, 95% CI) | 0.30 [‐0.23, 0.83] |
| 8.2 one hour after meal | 1 | 57 | Mean Difference (IV, Random, 95% CI) | ‐0.90 [‐2.33, 0.53] |
| 8.3 two hours after meal | 1 | 58 | Mean Difference (IV, Random, 95% CI) | ‐0.90 [‐2.14, 0.34] |
| 8.4 three hours after meal | 1 | 57 | Mean Difference (IV, Random, 95% CI) | 0.40 [‐0.84, 1.64] |
| 9 Adverse effects: 2b. Metabolic ‐ lipid profile ‐ short term Show forest plot | 1 | Mean Difference (IV, Random, 95% CI) | Subtotals only | |
| 9.1 cholesterol ‐ total | 1 | 57 | Mean Difference (IV, Random, 95% CI) | 0.5 [‐0.29, 1.29] |
| 9.2 triglycerides | 1 | 57 | Mean Difference (IV, Random, 95% CI) | 0.30 [‐0.12, 0.72] |
| 9.3 lipoprotein ‐ high density (HDL) | 1 | 57 | Mean Difference (IV, Random, 95% CI) | 0.06 [‐0.16, 0.28] |
| 9.4 lipoprotein ‐ low density (LDL) | 1 | 57 | Mean Difference (IV, Random, 95% CI) | ‐0.10 [‐0.50, 0.30] |
| 9.5 Apo A ‐1 | 1 | 57 | Mean Difference (IV, Random, 95% CI) | ‐0.01 [‐0.14, 0.12] |
| 9.6 Apo ‐ B | 1 | 57 | Mean Difference (IV, Random, 95% CI) | 0.10 [‐0.14, 0.34] |
| 10 Adverse effects: 3. Various effects ‐ short term Show forest plot | 1 | Risk Ratio (M‐H, Fixed, 95% CI) | Subtotals only | |
| 10.1 lethargy | 1 | 176 | Risk Ratio (M‐H, Fixed, 95% CI) | 0.77 [0.60, 0.97] |
| 10.2 hypersalivation | 1 | 176 | Risk Ratio (M‐H, Fixed, 95% CI) | 0.70 [0.57, 0.84] |
| 10.3 dizziness | 1 | 176 | Risk Ratio (M‐H, Fixed, 95% CI) | 0.56 [0.39, 0.81] |
| 10.4 tachycardia | 1 | 176 | Risk Ratio (M‐H, Fixed, 95% CI) | 0.57 [0.45, 0.71] |
| 11 Adverse effects: 4. Average endpoint scores (TESS, high = poor) ‐ short term Show forest plot | 2 | Mean Difference (IV, Random, 95% CI) | Subtotals only | |
| 11.1 total | 2 | 266 | Mean Difference (IV, Random, 95% CI) | ‐3.99 [‐5.75, ‐2.24] |
| 11.2 subscore ‐ behavioural toxicity | 1 | 176 | Mean Difference (IV, Random, 95% CI) | 1.00 [‐1.51, ‐0.49] |
| 11.3 subscore ‐ vegetative nervous system | 1 | 176 | Mean Difference (IV, Random, 95% CI) | ‐0.90 [‐1.61, ‐0.19] |
| 11.4 subscore ‐ cardiovascular system | 1 | 176 | Mean Difference (IV, Random, 95% CI) | ‐0.60 [‐0.98, ‐0.22] |
| 12 Leaving the study early Show forest plot | 3 | 270 | Risk Ratio (M‐H, Random, 95% CI) | 0.35 [0.06, 2.21] |
| 12.1 any reason: short term | 1 | 176 | Risk Ratio (M‐H, Random, 95% CI) | 0.0 [0.0, 0.0] |
| 12.2 any reason: medium term | 1 | 34 | Risk Ratio (M‐H, Random, 95% CI) | 0.20 [0.01, 3.88] |
| 12.3 specific reason: short term | 1 | 60 | Risk Ratio (M‐H, Random, 95% CI) | 0.5 [0.05, 5.22] |