Dosis de clozapina para la esquizofrenia
Información
- DOI:
- https://doi.org/10.1002/14651858.CD009555.pub2Copiar DOI

- Base de datos:
-
- Cochrane Database of Systematic Reviews
- Versión publicada:
-
- 14 junio 2017see what's new
- Tipo:
-
- Intervention
- Etapa:
-
- Review
- Grupo Editorial Cochrane:
-
Grupo Cochrane de Esquizofrenia
- Copyright:
-
- Copyright © 2017 The Cochrane Collaboration. Published by John Wiley & Sons, Ltd.
Cifras del artículo
Altmetric:
Citado por:
Autores
Contributions of authors
Selvizhi Subramanian – protocol development, study selection, data collection and synthesis, report writing.
Birgit A Vőllm – protocol development, study selection, data collection and synthesis, report writing.
Nick Huband – data synthesis, report writing.
Sources of support
Internal sources
-
none, Other.
External sources
-
none, Other.
Declarations of interest
Selvizhi Subramanian – none known.
Birgit A Vőllm – none known.
Nick Huband – none known.
Acknowledgements
The Cochrane Schizophrenia Group Editorial Base in Nottingham produces and maintains standard text for use in the Methods section of their reviews. We have used this text as the basis of what appears here and adapted it as required.
Version history
| Published | Title | Stage | Authors | Version |
| 2017 Jun 14 | Clozapine dose for schizophrenia | Review | Selvizhi Subramanian, Birgit A Völlm, Nick Huband | |
| 2012 Jan 18 | Clozapine dose for schizophrenia | Protocol | Selvizhi Subramanian, Birgit A Völlm | |
Differences between protocol and review
The original categorisation of doses of clozapine was slightly changed to enable us to accommodate the doses compared in the trials of the four included papers.
Keywords
MeSH
Medical Subject Headings (MeSH) Keywords
Medical Subject Headings Check Words
Humans;
PICO

Clozapine structure

Study flow diagram.

Risk of bias graph: review authors' judgements about each risk of bias item presented as percentages across all included studies.

Risk of bias summary: review authors' judgements about each risk of bias item for each included study.
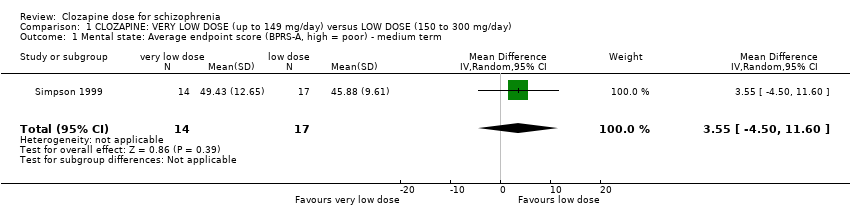
Comparison 1 CLOZAPINE: VERY LOW DOSE (up to 149 mg/day) versus LOW DOSE (150 to 300 mg/day), Outcome 1 Mental state: Average endpoint score (BPRS‐A, high = poor) ‐ medium term.

Comparison 1 CLOZAPINE: VERY LOW DOSE (up to 149 mg/day) versus LOW DOSE (150 to 300 mg/day), Outcome 2 Adverse effects: 1a. Weight ‐ BMI ‐ short term.

Comparison 1 CLOZAPINE: VERY LOW DOSE (up to 149 mg/day) versus LOW DOSE (150 to 300 mg/day), Outcome 3 Adverse effects: 1b. Weight ‐ weight gain.

Comparison 1 CLOZAPINE: VERY LOW DOSE (up to 149 mg/day) versus LOW DOSE (150 to 300 mg/day), Outcome 4 Adverse effects: 1c. Weight ‐ body weight at endpoint ‐ short term.
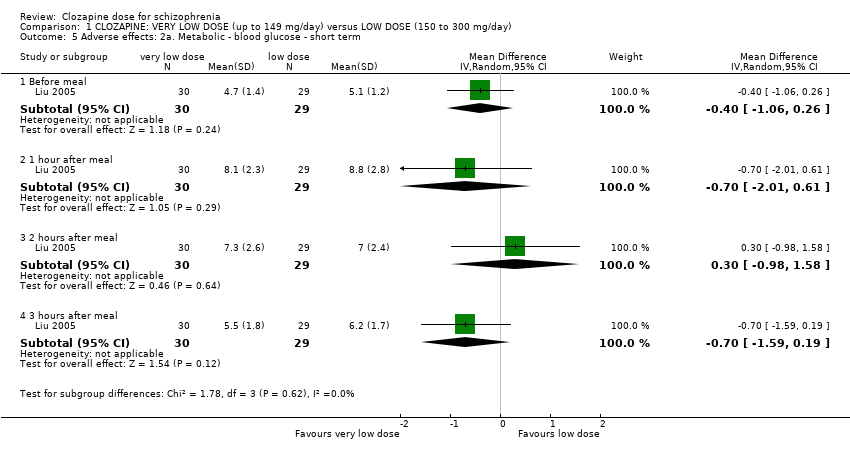
Comparison 1 CLOZAPINE: VERY LOW DOSE (up to 149 mg/day) versus LOW DOSE (150 to 300 mg/day), Outcome 5 Adverse effects: 2a. Metabolic ‐ blood glucose ‐ short term.

Comparison 1 CLOZAPINE: VERY LOW DOSE (up to 149 mg/day) versus LOW DOSE (150 to 300 mg/day), Outcome 6 Adverse effects: 2b. Metabolic ‐ lipid profile ‐ short term.
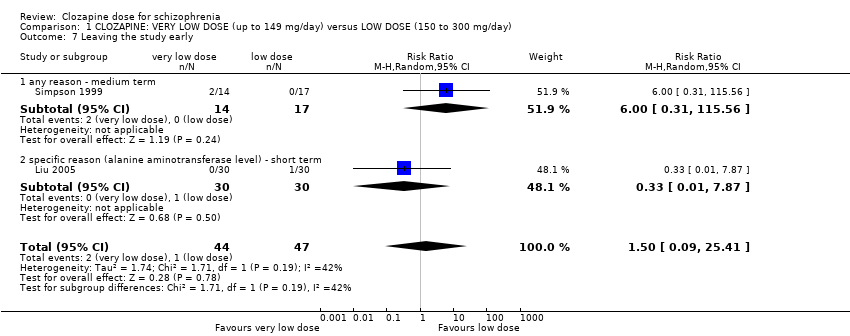
Comparison 1 CLOZAPINE: VERY LOW DOSE (up to 149 mg/day) versus LOW DOSE (150 to 300 mg/day), Outcome 7 Leaving the study early.
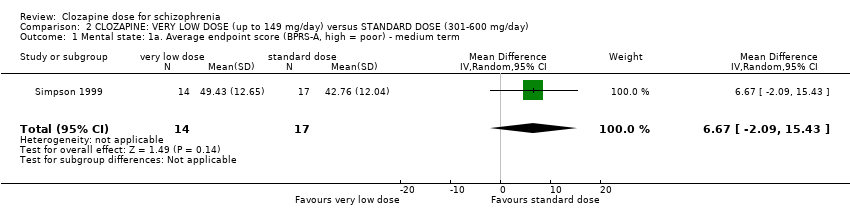
Comparison 2 CLOZAPINE: VERY LOW DOSE (up to 149 mg/day) versus STANDARD DOSE (301‐600 mg/day), Outcome 1 Mental state: 1a. Average endpoint score (BPRS‐A, high = poor) ‐ medium term.

Comparison 2 CLOZAPINE: VERY LOW DOSE (up to 149 mg/day) versus STANDARD DOSE (301‐600 mg/day), Outcome 2 Adverse effects: 1a. Weight ‐ BMI ‐ short term.

Comparison 2 CLOZAPINE: VERY LOW DOSE (up to 149 mg/day) versus STANDARD DOSE (301‐600 mg/day), Outcome 3 Adverse effects: 1b. Weight ‐ weight gain.
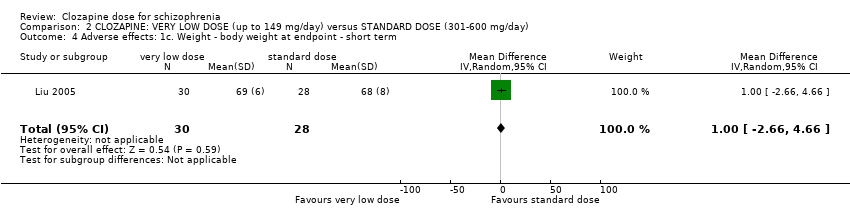
Comparison 2 CLOZAPINE: VERY LOW DOSE (up to 149 mg/day) versus STANDARD DOSE (301‐600 mg/day), Outcome 4 Adverse effects: 1c. Weight ‐ body weight at endpoint ‐ short term.

Comparison 2 CLOZAPINE: VERY LOW DOSE (up to 149 mg/day) versus STANDARD DOSE (301‐600 mg/day), Outcome 5 Adverse effects: 2a. Metabolic ‐ blood glucose ‐ short term.

Comparison 2 CLOZAPINE: VERY LOW DOSE (up to 149 mg/day) versus STANDARD DOSE (301‐600 mg/day), Outcome 6 Adverse effects: 2b. Metabolic ‐ lipid profile ‐ short term.

Comparison 2 CLOZAPINE: VERY LOW DOSE (up to 149 mg/day) versus STANDARD DOSE (301‐600 mg/day), Outcome 7 Leaving the study early.

Comparison 3 CLOZAPINE: LOW DOSE (150 to 300 mg/day) versus STANDARD DOSE (301 to 600 mg/day), Outcome 1 Mental state: 1a. Clinically important response as (BPRS score > 30% change).

Comparison 3 CLOZAPINE: LOW DOSE (150 to 300 mg/day) versus STANDARD DOSE (301 to 600 mg/day), Outcome 2 Mental state: 1b. Average endpoint score (BPRS‐A total, high = poor).

Comparison 3 CLOZAPINE: LOW DOSE (150 to 300 mg/day) versus STANDARD DOSE (301 to 600 mg/day), Outcome 3 Mental state: 1c. Average endpoint score (BPRS‐A subscores, high = poor) ‐ short term.
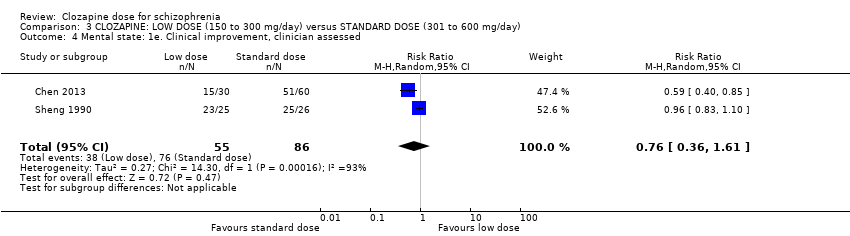
Comparison 3 CLOZAPINE: LOW DOSE (150 to 300 mg/day) versus STANDARD DOSE (301 to 600 mg/day), Outcome 4 Mental state: 1e. Clinical improvement, clinician assessed.

Comparison 3 CLOZAPINE: LOW DOSE (150 to 300 mg/day) versus STANDARD DOSE (301 to 600 mg/day), Outcome 5 Adverse effects: 1a. Weight ‐ BMI ‐ short term.
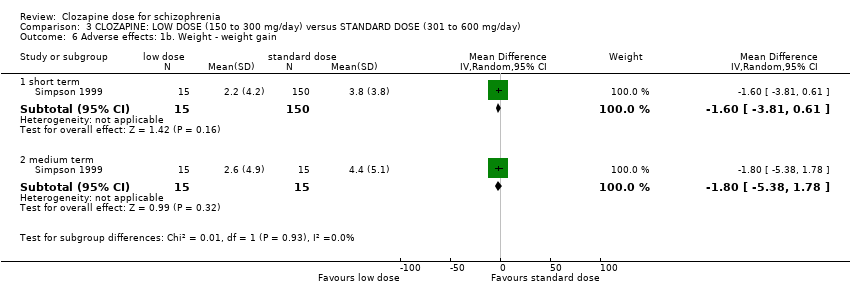
Comparison 3 CLOZAPINE: LOW DOSE (150 to 300 mg/day) versus STANDARD DOSE (301 to 600 mg/day), Outcome 6 Adverse effects: 1b. Weight ‐ weight gain.

Comparison 3 CLOZAPINE: LOW DOSE (150 to 300 mg/day) versus STANDARD DOSE (301 to 600 mg/day), Outcome 7 Adverse effects: 1c. Weight ‐ body weight at endpoint ‐ short term.

Comparison 3 CLOZAPINE: LOW DOSE (150 to 300 mg/day) versus STANDARD DOSE (301 to 600 mg/day), Outcome 8 Adverse effects: 2a. Metabolic ‐ blood glucose ‐ short term.
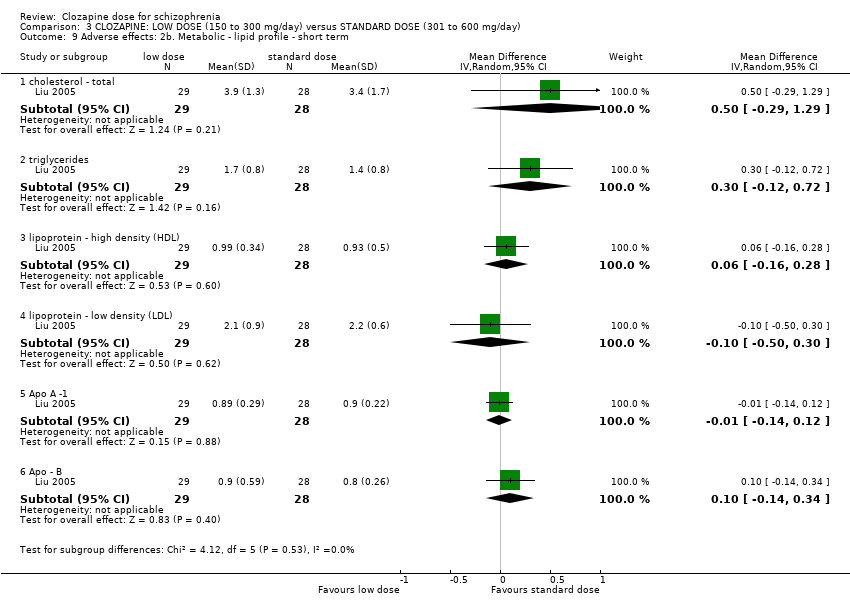
Comparison 3 CLOZAPINE: LOW DOSE (150 to 300 mg/day) versus STANDARD DOSE (301 to 600 mg/day), Outcome 9 Adverse effects: 2b. Metabolic ‐ lipid profile ‐ short term.
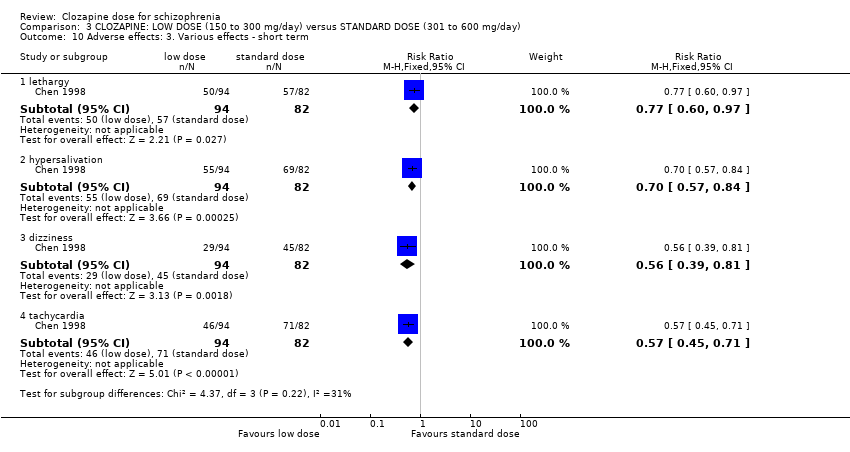
Comparison 3 CLOZAPINE: LOW DOSE (150 to 300 mg/day) versus STANDARD DOSE (301 to 600 mg/day), Outcome 10 Adverse effects: 3. Various effects ‐ short term.
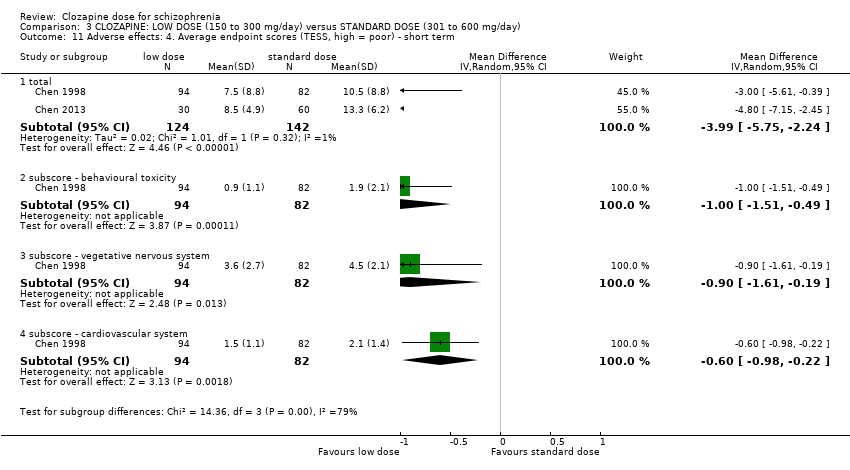
Comparison 3 CLOZAPINE: LOW DOSE (150 to 300 mg/day) versus STANDARD DOSE (301 to 600 mg/day), Outcome 11 Adverse effects: 4. Average endpoint scores (TESS, high = poor) ‐ short term.
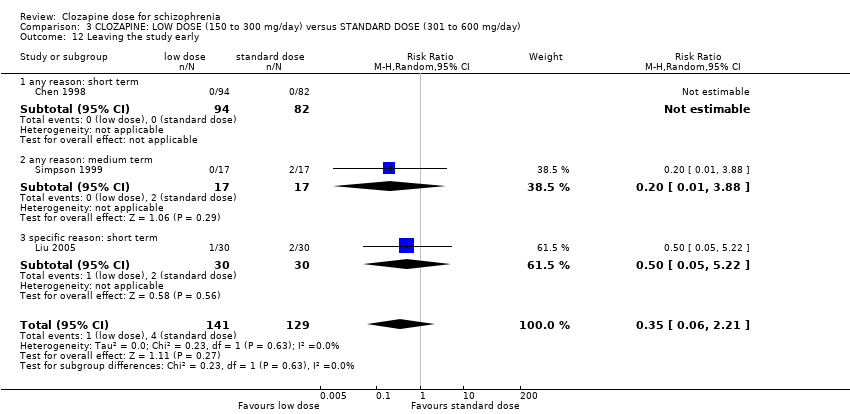
Comparison 3 CLOZAPINE: LOW DOSE (150 to 300 mg/day) versus STANDARD DOSE (301 to 600 mg/day), Outcome 12 Leaving the study early.
| CLOZAPINE: VERY LOW DOSE (up to 149 mg/day) versus LOW DOSE (150‐300 mg/day) for schizophrenia | ||||||
| Patient or population: patients with schizophrenia | ||||||
| Outcomes | Illustrative comparative risks* (95% CI) | Relative effect | No of Participants | Quality of the evidence | Comments | |
| Assumed risk | Corresponding risk | |||||
| Control | Clozapine: very low dose (up to 149 mg/day) versus low dose (150 mg/day to 300 mg/day) | |||||
| Global state: clinically important response, as defined by individual studies | See comment | See comment | Not estimable | 0 | See comment | No study reported this outcome. |
| Mental state: clinically important response, as defined by individual studies * Follow‐up: 16 weeks | The mean clinical response: mental state ‐ average scores ‐ medium term endpoint (BPRS‐A, high = worse) in the intervention group was | 31 | ⊕⊝⊝⊝ | * Pre‐defined outcome not reported: Mental state measured as average endpoint scores (BPRS‐A, high = worse). | ||
| Functioning: clinically important change in general functioning, as defined by individual studies | See comment | See comment | Not estimable | 0 | See comment | No study reported this outcome. |
| Adverse effect: clinically important adverse effect (weight ‐ BMI) | The mean adverse effect ‐ any clinically important specific adverse effects ‐ BMI in the intervention group was | 59 | ⊕⊕⊝⊝ | |||
| Service use: number of days hospitalised | See comment | See comment | Not estimable | 0 | See comment | No study reported this outcome. |
| Service use: time to hospitalisation | See comment | See comment | Not estimable | 0 | See comment | No study reported this outcome. |
| Quality of life: clinically important change in general quality of life | See comment | See comment | Not estimable | 0 | See comment | No study reported this outcome. |
| *The basis for the assumed risk (e.g. the median control group risk across studies) is provided in footnotes. The corresponding risk (and its 95% CI) is based on the assumed risk in the comparison group and the relative effect of the intervention (and its 95% CI). | ||||||
| GRADE Working Group grades of evidence | ||||||
| 1 Risk of bias: rated as 'serious' (downgraded by 1) due to attrition bias, reporting bias, and sponsorship by Novartis Pharmaceuticals. | ||||||
| CLOZAPINE: VERY LOW DOSE (up to 149 mg/day) versus STANDARD DOSE (301‐600 mg/day) for schizophrenia | ||||||
| Patient or population: patients with schizophrenia | ||||||
| Outcomes | Illustrative comparative risks* (95% CI) | Relative effect | No of Participants | Quality of the evidence | Comments | |
| Assumed risk | Corresponding risk | |||||
| Control | Clozapine: very low dose (up to 149 mg/day) versus standard dose (301 mg/day to 600 mg/day) | |||||
| Global state: clinically important response, as defined by individual studies | See comment | See comment | Not estimable | 0 | See comment | No study reported this outcome. |
| Mental state: clinically important response, as defined by individual studies * Follow‐up: 16 weeks | The mean clinical response: mental state ‐ average scores ‐ medium term endpoint (BPRS‐A, high = worse) in the intervention group was | 31 | ⊕⊝⊝⊝ | * Pre‐defined outcome not reported: Mental state measured as average endpoint scores (BPRS‐A, high = worse). | ||
| Functioning: clinically important change in general functioning, as defined by individual studies | See comment | See comment | Not estimable | 0 | See comment | No study reported this outcome. |
| Adverse effect: clinically important adverse effect (weight ‐ BMI) | The mean adverse effect ‐ any clinically important specific adverse effects ‐ BMI in the intervention group was | 58 | ⊕⊕⊝⊝ | |||
| Service use: number of days hospitalised | See comment | See comment | Not estimable | 0 | See comment | No study reported this outcome. |
| Service use: time to hospitalisation | See comment | See comment | Not estimable | 0 | See comment | No study reported this outcome. |
| Quality of life: clinically important change in general quality of life | See comment | See comment | Not estimable | 0 | See comment | No study reported this outcome. |
| *The basis for the assumed risk (e.g. the median control group risk across studies) is provided in footnotes. The corresponding risk (and its 95% confidence interval) is based on the assumed risk in the comparison group and the relative effect of the intervention (and its 95% CI). | ||||||
| GRADE Working Group grades of evidence | ||||||
| 1 Risk of bias: rated as 'serious' (downgraded by 1) due to attrition bias, reporting bias, and sponsorship by Novartis Pharmaceuticals. | ||||||
| Clozapine: low dose (150 mg/day to 300 mg/day) versus standard dose (301 mg/day to 600 mg/day) for schizophrenia | ||||||
| Patient or population: patients with schizophrenia | ||||||
| Outcomes | Illustrative comparative risks* (95% CI) | Relative effect | No of Participants | Quality of the evidence | Comments | |
| Assumed risk | Corresponding risk | |||||
| Control | Clozapine: low dose (150 mg/day to 300 mg/day) versus standard dose (301 mg/day to 600 mg/day) | |||||
| Global state: clinically important response, as defined by individual studies | See comment | See comment | Not estimable | 0 | See comment | No study reported this outcome. |
| Mental state: clinically important response in mental state | Low1 | RR 0.93 | 176 | ⊕⊕⊝⊝ | ||
| 200 per 1000 | 186 per 1000 | |||||
| Moderate1 | ||||||
| 500 per 1000 | 465 per 1000 | |||||
| High1 | ||||||
| 800 per 1000 | 744 per 1000 | |||||
| Functioning: clinically important change in general functioning, as defined by individual studies | See comment | See comment | Not estimable | 0 | See comment | No study reported this outcome. |
| Adverse effect: clinically important adverse effect ( weight ‐ BMI) | The mean adverse effect ‐ any clinically important specific adverse effects ‐ BMI in the intervention group was | 57 | ⊕⊕⊝⊝ | |||
| Service use: number of days hospitalised | See comment | See comment | Not estimable | 0 | See comment | No study reported this outcome. |
| Service use: time to hospitalisation | See comment | See comment | Not estimable | 0 | See comment | No study reported this outcome. |
| Quality of life: clinically important change in general quality of life | See comment | See comment | Not estimable | 0 | See comment | No study reported this outcome. |
| *The basis for the assumed risk (e.g. the median control group risk across studies) is provided in footnotes. The corresponding risk (and its 95% confidence interval) is based on the assumed risk in the comparison group and the relative effect of the intervention (and its 95% CI). | ||||||
| GRADE Working Group grades of evidence | ||||||
| 1 Risk of bias rated as 'serious' (downgraded by 1) as allocation concealment, blinding status and trial sponsorship unclear 3 Imprecision: rated as 'serious' (downgraded by 1) as only one study providing data, small number of participants (less than 200) | ||||||
| Title | Reference |
| Clozapine versus other atypical antipsychotics for schizophrenia | |
| Clozapine combined with different antipsychotic drugs for treatment resistant schizophrenia | |
| Clozapine versus typical neuroleptic medication for schizophrenia | |
| Pharmacological interventions for clozapine‐induced hypersalivation |
| Outcome or subgroup title | No. of studies | No. of participants | Statistical method | Effect size |
| 1 Mental state: Average endpoint score (BPRS‐A, high = poor) ‐ medium term Show forest plot | 1 | 31 | Mean Difference (IV, Random, 95% CI) | 3.55 [‐4.50, 11.60] |
| 2 Adverse effects: 1a. Weight ‐ BMI ‐ short term Show forest plot | 1 | 59 | Mean Difference (IV, Random, 95% CI) | ‐0.10 [‐0.95, 0.75] |
| 3 Adverse effects: 1b. Weight ‐ weight gain Show forest plot | 1 | Mean Difference (IV, Random, 95% CI) | Subtotals only | |
| 3.1 short term | 1 | 27 | Mean Difference (IV, Random, 95% CI) | ‐1.1 [‐3.93, 1.73] |
| 3.2 medium term | 1 | 28 | Mean Difference (IV, Random, 95% CI) | ‐1.3 [‐4.86, 2.26] |
| 4 Adverse effects: 1c. Weight ‐ body weight at endpoint ‐ short term Show forest plot | 1 | 59 | Mean Difference (IV, Random, 95% CI) | 0.0 [‐3.92, 3.92] |
| 5 Adverse effects: 2a. Metabolic ‐ blood glucose ‐ short term Show forest plot | 1 | Mean Difference (IV, Random, 95% CI) | Subtotals only | |
| 5.1 Before meal | 1 | 59 | Mean Difference (IV, Random, 95% CI) | ‐0.40 [‐1.06, 0.26] |
| 5.2 1 hour after meal | 1 | 59 | Mean Difference (IV, Random, 95% CI) | ‐0.70 [‐2.01, 0.61] |
| 5.3 2 hours after meal | 1 | 59 | Mean Difference (IV, Random, 95% CI) | 0.30 [‐0.98, 1.58] |
| 5.4 3 hours after meal | 1 | 59 | Mean Difference (IV, Random, 95% CI) | ‐0.70 [‐1.59, 0.19] |
| 6 Adverse effects: 2b. Metabolic ‐ lipid profile ‐ short term Show forest plot | 1 | Mean Difference (IV, Random, 95% CI) | Subtotals only | |
| 6.1 triglycerides | 1 | 59 | Mean Difference (IV, Random, 95% CI) | 1.00 [0.51, 1.49] |
| 6.2 cholesterol ‐ total | 1 | 59 | Mean Difference (IV, Random, 95% CI) | 0.50 [‐0.12, 1.12] |
| 6.3 lipoprotein ‐ high density (HDL) | 1 | 59 | Mean Difference (IV, Random, 95% CI) | 0.04 [‐0.14, 0.22] |
| 6.4 lipoprotein ‐ low density (LDL) | 1 | 59 | Mean Difference (IV, Random, 95% CI) | 0.10 [‐0.36, 0.56] |
| 6.5 Apo A‐1 | 1 | 59 | Mean Difference (IV, Random, 95% CI) | 0.05 [‐0.10, 0.20] |
| 6.6 Apo‐B | 1 | 59 | Mean Difference (IV, Random, 95% CI) | 0.13 [‐0.16, 0.42] |
| 7 Leaving the study early Show forest plot | 2 | 91 | Risk Ratio (M‐H, Random, 95% CI) | 1.50 [0.09, 25.41] |
| 7.1 any reason ‐ medium term | 1 | 31 | Risk Ratio (M‐H, Random, 95% CI) | 6.0 [0.31, 115.56] |
| 7.2 specific reason (alanine aminotransferase level) ‐ short term | 1 | 60 | Risk Ratio (M‐H, Random, 95% CI) | 0.33 [0.01, 7.87] |
| Outcome or subgroup title | No. of studies | No. of participants | Statistical method | Effect size |
| 1 Mental state: 1a. Average endpoint score (BPRS‐A, high = poor) ‐ medium term Show forest plot | 1 | 31 | Mean Difference (IV, Random, 95% CI) | 6.67 [‐2.09, 15.43] |
| 2 Adverse effects: 1a. Weight ‐ BMI ‐ short term Show forest plot | 1 | 58 | Mean Difference (IV, Random, 95% CI) | 0.10 [‐0.76, 0.96] |
| 3 Adverse effects: 1b. Weight ‐ weight gain Show forest plot | 1 | Mean Difference (IV, Random, 95% CI) | Subtotals only | |
| 3.1 short term | 1 | 27 | Mean Difference (IV, Random, 95% CI) | ‐2.70 [‐5.38, ‐0.02] |
| 3.2 medium term | 1 | 28 | Mean Difference (IV, Random, 95% CI) | ‐3.10 [‐6.73, 0.53] |
| 4 Adverse effects: 1c. Weight ‐ body weight at endpoint ‐ short term Show forest plot | 1 | 58 | Mean Difference (IV, Random, 95% CI) | 1.0 [‐2.66, 4.66] |
| 5 Adverse effects: 2a. Metabolic ‐ blood glucose ‐ short term Show forest plot | 1 | Mean Difference (IV, Random, 95% CI) | Subtotals only | |
| 5.1 one hour after meal | 1 | 58 | Mean Difference (IV, Random, 95% CI) | ‐1.60 [‐2.90, ‐0.30] |
| 5.2 before meal | 1 | 58 | Mean Difference (IV, Random, 95% CI) | ‐0.10 [‐0.68, 0.48] |
| 5.3 two hours after meal | 1 | 58 | Mean Difference (IV, Random, 95% CI) | ‐0.60 [‐1.89, 0.69] |
| 5.4 three hours after meal | 1 | 58 | Mean Difference (IV, Random, 95% CI) | ‐0.30 [‐1.55, 0.95] |
| 6 Adverse effects: 2b. Metabolic ‐ lipid profile ‐ short term Show forest plot | 1 | Mean Difference (IV, Random, 95% CI) | Subtotals only | |
| 6.1 cholesterol ‐ total | 1 | 58 | Mean Difference (IV, Random, 95% CI) | 1.00 [0.20, 1.80] |
| 6.2 triglycerides | 1 | 58 | Mean Difference (IV, Random, 95% CI) | 1.30 [0.81, 1.79] |
| 6.3 Apo ‐ B | 1 | 58 | Mean Difference (IV, Random, 95% CI) | 0.23 [0.01, 0.45] |
| 6.4 lipoprotein ‐ high density (HDL) | 1 | 58 | Mean Difference (IV, Random, 95% CI) | 0.10 [‐0.13, 0.33] |
| 6.5 lipoprotein ‐ low density (LDL) | 1 | 58 | Mean Difference (IV, Random, 95% CI) | 0.0 [‐0.39, 0.39] |
| 6.6 Apo A ‐1 | 1 | 58 | Mean Difference (IV, Random, 95% CI) | 0.04 [‐0.10, 0.18] |
| 7 Leaving the study early Show forest plot | 2 | 91 | Risk Ratio (M‐H, Random, 95% CI) | 0.73 [0.14, 3.72] |
| 7.1 any reason ‐ medium term | 1 | 31 | Risk Ratio (M‐H, Random, 95% CI) | 1.21 [0.20, 7.55] |
| 7.2 specific reason (neutropenia and tachycardia) ‐ short term | 1 | 60 | Risk Ratio (M‐H, Random, 95% CI) | 0.2 [0.01, 4.00] |
| Outcome or subgroup title | No. of studies | No. of participants | Statistical method | Effect size |
| 1 Mental state: 1a. Clinically important response as (BPRS score > 30% change) Show forest plot | 1 | 176 | Risk Ratio (M‐H, Fixed, 95% CI) | 0.93 [0.78, 1.10] |
| 2 Mental state: 1b. Average endpoint score (BPRS‐A total, high = poor) Show forest plot | 2 | Mean Difference (IV, Random, 95% CI) | Subtotals only | |
| 2.1 short term | 1 | 176 | Mean Difference (IV, Random, 95% CI) | 1.70 [‐1.26, 4.66] |
| 2.2 medium term | 1 | 34 | Mean Difference (IV, Random, 95% CI) | 3.12 [‐4.20, 10.44] |
| 3 Mental state: 1c. Average endpoint score (BPRS‐A subscores, high = poor) ‐ short term Show forest plot | 1 | Mean Difference (IV, Fixed, 95% CI) | Subtotals only | |
| 3.1 anxiety | 1 | 176 | Mean Difference (IV, Fixed, 95% CI) | 0.0 [‐0.09, 0.09] |
| 3.2 blunted affect | 1 | 176 | Mean Difference (IV, Fixed, 95% CI) | 0.0 [‐0.18, 0.18] |
| 3.3 conceptual disorganisation | 1 | 176 | Mean Difference (IV, Fixed, 95% CI) | 0.20 [‐0.02, 0.42] |
| 3.4 excitement | 1 | 176 | Mean Difference (IV, Fixed, 95% CI) | 0.0 [‐0.10, 0.10] |
| 3.5 uncooperativeness | 1 | 176 | Mean Difference (IV, Fixed, 95% CI) | 0.0 [‐0.21, 0.21] |
| 4 Mental state: 1e. Clinical improvement, clinician assessed Show forest plot | 2 | 141 | Risk Ratio (M‐H, Random, 95% CI) | 0.76 [0.36, 1.61] |
| 5 Adverse effects: 1a. Weight ‐ BMI ‐ short term Show forest plot | 1 | 57 | Mean Difference (IV, Random, 95% CI) | 0.20 [‐0.84, 1.24] |
| 6 Adverse effects: 1b. Weight ‐ weight gain Show forest plot | 1 | Mean Difference (IV, Random, 95% CI) | Subtotals only | |
| 6.1 short term | 1 | 165 | Mean Difference (IV, Random, 95% CI) | ‐1.60 [‐3.81, 0.61] |
| 6.2 medium term | 1 | 30 | Mean Difference (IV, Random, 95% CI) | ‐1.80 [‐5.38, 1.78] |
| 7 Adverse effects: 1c. Weight ‐ body weight at endpoint ‐ short term Show forest plot | 1 | 57 | Mean Difference (IV, Random, 95% CI) | 1.0 [‐3.42, 5.42] |
| 8 Adverse effects: 2a. Metabolic ‐ blood glucose ‐ short term Show forest plot | 1 | Mean Difference (IV, Random, 95% CI) | Subtotals only | |
| 8.1 before meal | 1 | 57 | Mean Difference (IV, Random, 95% CI) | 0.30 [‐0.23, 0.83] |
| 8.2 one hour after meal | 1 | 57 | Mean Difference (IV, Random, 95% CI) | ‐0.90 [‐2.33, 0.53] |
| 8.3 two hours after meal | 1 | 58 | Mean Difference (IV, Random, 95% CI) | ‐0.90 [‐2.14, 0.34] |
| 8.4 three hours after meal | 1 | 57 | Mean Difference (IV, Random, 95% CI) | 0.40 [‐0.84, 1.64] |
| 9 Adverse effects: 2b. Metabolic ‐ lipid profile ‐ short term Show forest plot | 1 | Mean Difference (IV, Random, 95% CI) | Subtotals only | |
| 9.1 cholesterol ‐ total | 1 | 57 | Mean Difference (IV, Random, 95% CI) | 0.5 [‐0.29, 1.29] |
| 9.2 triglycerides | 1 | 57 | Mean Difference (IV, Random, 95% CI) | 0.30 [‐0.12, 0.72] |
| 9.3 lipoprotein ‐ high density (HDL) | 1 | 57 | Mean Difference (IV, Random, 95% CI) | 0.06 [‐0.16, 0.28] |
| 9.4 lipoprotein ‐ low density (LDL) | 1 | 57 | Mean Difference (IV, Random, 95% CI) | ‐0.10 [‐0.50, 0.30] |
| 9.5 Apo A ‐1 | 1 | 57 | Mean Difference (IV, Random, 95% CI) | ‐0.01 [‐0.14, 0.12] |
| 9.6 Apo ‐ B | 1 | 57 | Mean Difference (IV, Random, 95% CI) | 0.10 [‐0.14, 0.34] |
| 10 Adverse effects: 3. Various effects ‐ short term Show forest plot | 1 | Risk Ratio (M‐H, Fixed, 95% CI) | Subtotals only | |
| 10.1 lethargy | 1 | 176 | Risk Ratio (M‐H, Fixed, 95% CI) | 0.77 [0.60, 0.97] |
| 10.2 hypersalivation | 1 | 176 | Risk Ratio (M‐H, Fixed, 95% CI) | 0.70 [0.57, 0.84] |
| 10.3 dizziness | 1 | 176 | Risk Ratio (M‐H, Fixed, 95% CI) | 0.56 [0.39, 0.81] |
| 10.4 tachycardia | 1 | 176 | Risk Ratio (M‐H, Fixed, 95% CI) | 0.57 [0.45, 0.71] |
| 11 Adverse effects: 4. Average endpoint scores (TESS, high = poor) ‐ short term Show forest plot | 2 | Mean Difference (IV, Random, 95% CI) | Subtotals only | |
| 11.1 total | 2 | 266 | Mean Difference (IV, Random, 95% CI) | ‐3.99 [‐5.75, ‐2.24] |
| 11.2 subscore ‐ behavioural toxicity | 1 | 176 | Mean Difference (IV, Random, 95% CI) | 1.00 [‐1.51, ‐0.49] |
| 11.3 subscore ‐ vegetative nervous system | 1 | 176 | Mean Difference (IV, Random, 95% CI) | ‐0.90 [‐1.61, ‐0.19] |
| 11.4 subscore ‐ cardiovascular system | 1 | 176 | Mean Difference (IV, Random, 95% CI) | ‐0.60 [‐0.98, ‐0.22] |
| 12 Leaving the study early Show forest plot | 3 | 270 | Risk Ratio (M‐H, Random, 95% CI) | 0.35 [0.06, 2.21] |
| 12.1 any reason: short term | 1 | 176 | Risk Ratio (M‐H, Random, 95% CI) | 0.0 [0.0, 0.0] |
| 12.2 any reason: medium term | 1 | 34 | Risk Ratio (M‐H, Random, 95% CI) | 0.20 [0.01, 3.88] |
| 12.3 specific reason: short term | 1 | 60 | Risk Ratio (M‐H, Random, 95% CI) | 0.5 [0.05, 5.22] |