Doza klozapina za primjenu kod shizofrenije
Abstract
Background
Schizophrenia and related disorders such as schizophreniform and schizoaffective disorder are serious mental illnesses characterised by profound disruptions in thinking and speech, emotional processes, behaviour and sense of self. Clozapine is useful in the treatment of schizophrenia and related disorders, particularly when other antipsychotic medications have failed. It improves positive symptoms (such as delusions and hallucinations) and negative symptoms (such as withdrawal and poverty of speech). However, it is unclear what dose of clozapine is most effective with the least side effects.
Objectives
To compare the efficacy and tolerability of clozapine at different doses and to identify the optimal dose of clozapine in the treatment of schizophrenia, schizophreniform and schizoaffective disorders.
Search methods
We searched the Cochrane Schizophrenia Group's Study‐Based Register of Trials (August 2011 and 8 December 2016).
Selection criteria
All relevant randomised controlled trials (RCTs), irrespective of blinding status or language, that compared the effects of clozapine at different doses in people with schizophrenia and related disorders, diagnosed by any criteria.
Data collection and analysis
We independently inspected citations from the searches, identified relevant abstracts, obtained full articles of relevant abstracts, and classified trials as included or excluded. We included trials that met our inclusion criteria and reported useable data. For dichotomous data, we calculated the relative risk (RR) and the 95% confidence interval (CI) on an intention‐to‐treat basis based on a random‐effects model. For continuous data, we calculated mean differences (MD) again based on a random‐effects model. We assessed risk of bias for included studies and created 'Summary of findings' tables using GRADE.
Main results
We identified five studies that could be included. Each compared the effects of clozapine at very low dose (up to 149 mg/day), low dose (150 mg/day to 300 mg/day) and standard dose (301 mg/day to 600 mg/day). Four of the five included studies were based on a small number of participants. We rated all the evidence reported for the main outcomes of interest as low or very low quality. No data were available for the main outcomes of global state, service use or quality of life.
Very low dose compared to low dose
We found no evidence of effect on mental state between low and very low doses of clozapine in terms of average Brief Psychiatric Rating Scale‐Anchored (BPRS‐A) endpoint score (1 RCT, n = 31, MD 3.55, 95% CI −4.50 to 11.60, very low quality evidence). One study found no difference between groups in body mass index (BMI) in the short term (1 RCT, n = 59, MD −0.10, 95% CI −0.95 to 0.75, low‐quality evidence).
Very low dose compared to standard dose
We found no evidence of effect on mental state between very low doses and standard doses of clozapine in terms of average BPRS‐A endpoint score (1 RCT, n = 31, MD 6.67, 95% CI −2.09 to 15.43, very low quality evidence). One study found no difference between groups in BMI in the short term (1 RCT, n = 58, MD 0.10, 95% CI −0.76 to 0.96, low‐quality evidence)
Low dose compared to standard dose
We found no evidence of effect on mental state between low doses and standard doses of clozapine in terms of both clinician‐assessed clinical improvement (2 RCTs, n = 141, RR 0.76, 95% CI 0.36 to 1.61, medium‐quality evidence) and clinically important response as more than 30% change in BPRS score (1 RCT, n = 176, RR 0.93, 95% CI 0.78 to 1.10, medium‐quality evidence). One study found no difference between groups in BMI in the short term (1 RCT, n = 57, MD 0.20, 95% CI −0.84 to 1.24, low‐quality evidence).
We found some evidence of effect for other adverse effect outcomes; however, the data were again limited.
Very low dose compared to low dose
There was limited evidence that serum triglycerides were lower at low‐dose clozapine compared to very low dose in the short term (1 RCT, n = 59, MD 1.00, 95% CI 0.51 to 1.49).
Low dose compared to standard dose
Weight gain was lower at very low dose compared to standard dose (1 RCT, n = 27, MD −2.70, 95% CI −5.38 to −0.02). Glucose level one hour after meal was also lower at very lose dose (1 RCT, n = 58, MD −1.60, 95% CI −2.90 to −0.30). Total cholesterol levels were higher at very low compared to standard dose (1 RCT, n = 58, n = 58, MD 1.00, 95% CI 0.20 to 1.80).
Low dose compared to standard dose
There was evidence of fewer adverse effects, measured as lower TESS scores, in the low‐dose group in the short term (2 RCTs, n = 266, MD −3.99, 95% CI −5.75 to −2.24); and in one study there was evidence that the incidence of lethargy (RR 0.77, 95% CI 0.60 to 0.97), hypersalivation (RR 0.70, 95% CI 0.57 to 0.84), dizziness (RR 0.56, 95% CI 0.39 to 0.81) and tachycardia (RR 0.57, 95% CI 0.45 to 0.71) was less at low dose compared to standard dose.
Authors' conclusions
We found no evidence of effect on mental state between standard, low and very low dose regimes, but we did not identify any trials on high or very high doses of clozapine. BMI measurements were similar between groups in the short term, although weight gain was less at very low dose compared to standard dose in one study. There was limited evidence that the incidence of some adverse effects was greater at standard dose compared to lower dose regimes. We found very little useful data and the evidence available is generally of low or very low quality. More studies are needed to validate our findings and report on outcomes such as relapse, remission, social functioning, service utilisation, cost‐effectiveness, satisfaction with care, and quality of life. There is a particular lack of medium‐ or long‐term outcome data, and on dose regimes above the standard rate.
PICO
Laički sažetak
Najučinkovitija doza klozapina za liječenje shizofrenije
Dosadašnje spoznaje
Shizofrenija je teška mentalna bolest koja utječe na razmišljanje i percepciju. Osobe sa shizofrenijom često doživljavaju temeljite poremećaje govora, emocionalnih procesa, ponašanja i svijesti o sebi. Antipsihotici mogu biti od pomoći u liječenju shizofrenije; međutim, uzimanje antipsihotika može imati i neugodne posljedice. Klozapin je antipsihotik koji može biti koristan u liječenju shizofrenije, osobito kada drugi antipsihotici nisu djelotvorni. Međutim, nije jasno koja je doza klozapina najučinkovitija s najmanje nuspojava. Ovaj Cochrane sustavni pregled istražuje učinke primjene klozapina u četiri različite doze (visoka doza, standardna doza, niska doza, vrlo niska doza).
Pretraživanje literature
Elektroničko pretraživanje studija koje su nasumično rasporedile osobe sa shizofrenijom kako bi primile različite doze klozapina, započelo je u kolovozu 2011 te se ponovilo 8 prosinca 2016.
Rezultati
Pronašli smo pet studija s 452 sudionika koje su odgovarale našim kriterijima uključivanja. Sve su studije uspoređivale učinke primjene klozapina u vrlo niskoj dozi (do 149 mg/dan), niskoj dozi (150 mg/dan 300 mg/dan) i standardnoj dozi (301 mg/dan do 600 mg/dan). Nijedna studija nije ispitivala učinke klozapina u dozi većoj od standardne. Ništa se nije koristilo u svrhu odabira između standardnih, niskih i vrlo niskih doza u smislu mjerenja indeksa tjelesne mase (engl. body mass index, BMI) u kratkom roku. U svakom slučaju, dobivanje na težini je bilo veće u bolesnika koji su primali standardne doze u odnosu na one koji su primali niske doze. Incidencija neugodnih nuspojava (koje su uključivale osjećaj letargije, preveliku proizvodnju sline i osjećaj omaglice) bila je manja kod niskih doza u odnosu na standardne doze.
Kvaliteta dokaza
Za glavne ishode kvaliteta dokaza je bila niska ili vrlo niska.
Zaključak
Nismo pronašli dokaze koji bi mogli ukazivati na najbolju dozu klozapina u bolesnika sa shizofrenijom. Potrebno je pažljivo razmatranje tijekom balansiranja prednosti i nedostataka različitih doza po pitanju dobivanja na težini i drugih nuspojava. Sve u svemu mjerenja BMI bila su slična između ispitivanih skupina; međutim, neke su se nuspojave pojavljivale rjeđe pri nižim dozama. Sve u svemu, ovaj pregled ističe nedostatak dokaza temeljenih na dostupnim informacijama za rješavanje pitanja koja je doza klozapina najučinkovitija s najmanje nuspojava. Potrebno je provesti veliko, dobro ustrojeno i dobro dokumentirano nasumično kliničko ispitivanje kako bi se riješilo ovo pitanje. Tu je posebno važno da takve studije ispituju dugoročne ishode i istražuju učinke primjene klozapina u dozama većim od standardne doze.
Authors' conclusions
Summary of findings
| CLOZAPINE: VERY LOW DOSE (up to 149 mg/day) versus LOW DOSE (150‐300 mg/day) for schizophrenia | ||||||
| Patient or population: patients with schizophrenia | ||||||
| Outcomes | Illustrative comparative risks* (95% CI) | Relative effect | No of Participants | Quality of the evidence | Comments | |
| Assumed risk | Corresponding risk | |||||
| Control | Clozapine: very low dose (up to 149 mg/day) versus low dose (150 mg/day to 300 mg/day) | |||||
| Global state: clinically important response, as defined by individual studies | See comment | See comment | Not estimable | 0 | See comment | No study reported this outcome. |
| Mental state: clinically important response, as defined by individual studies * Follow‐up: 16 weeks | The mean clinical response: mental state ‐ average scores ‐ medium term endpoint (BPRS‐A, high = worse) in the intervention group was | 31 | ⊕⊝⊝⊝ | * Pre‐defined outcome not reported: Mental state measured as average endpoint scores (BPRS‐A, high = worse). | ||
| Functioning: clinically important change in general functioning, as defined by individual studies | See comment | See comment | Not estimable | 0 | See comment | No study reported this outcome. |
| Adverse effect: clinically important adverse effect (weight ‐ BMI) | The mean adverse effect ‐ any clinically important specific adverse effects ‐ BMI in the intervention group was | 59 | ⊕⊕⊝⊝ | |||
| Service use: number of days hospitalised | See comment | See comment | Not estimable | 0 | See comment | No study reported this outcome. |
| Service use: time to hospitalisation | See comment | See comment | Not estimable | 0 | See comment | No study reported this outcome. |
| Quality of life: clinically important change in general quality of life | See comment | See comment | Not estimable | 0 | See comment | No study reported this outcome. |
| *The basis for the assumed risk (e.g. the median control group risk across studies) is provided in footnotes. The corresponding risk (and its 95% CI) is based on the assumed risk in the comparison group and the relative effect of the intervention (and its 95% CI). | ||||||
| GRADE Working Group grades of evidence | ||||||
| 1 Risk of bias: rated as 'serious' (downgraded by 1) due to attrition bias, reporting bias, and sponsorship by Novartis Pharmaceuticals. | ||||||
| CLOZAPINE: VERY LOW DOSE (up to 149 mg/day) versus STANDARD DOSE (301‐600 mg/day) for schizophrenia | ||||||
| Patient or population: patients with schizophrenia | ||||||
| Outcomes | Illustrative comparative risks* (95% CI) | Relative effect | No of Participants | Quality of the evidence | Comments | |
| Assumed risk | Corresponding risk | |||||
| Control | Clozapine: very low dose (up to 149 mg/day) versus standard dose (301 mg/day to 600 mg/day) | |||||
| Global state: clinically important response, as defined by individual studies | See comment | See comment | Not estimable | 0 | See comment | No study reported this outcome. |
| Mental state: clinically important response, as defined by individual studies * Follow‐up: 16 weeks | The mean clinical response: mental state ‐ average scores ‐ medium term endpoint (BPRS‐A, high = worse) in the intervention group was | 31 | ⊕⊝⊝⊝ | * Pre‐defined outcome not reported: Mental state measured as average endpoint scores (BPRS‐A, high = worse). | ||
| Functioning: clinically important change in general functioning, as defined by individual studies | See comment | See comment | Not estimable | 0 | See comment | No study reported this outcome. |
| Adverse effect: clinically important adverse effect (weight ‐ BMI) | The mean adverse effect ‐ any clinically important specific adverse effects ‐ BMI in the intervention group was | 58 | ⊕⊕⊝⊝ | |||
| Service use: number of days hospitalised | See comment | See comment | Not estimable | 0 | See comment | No study reported this outcome. |
| Service use: time to hospitalisation | See comment | See comment | Not estimable | 0 | See comment | No study reported this outcome. |
| Quality of life: clinically important change in general quality of life | See comment | See comment | Not estimable | 0 | See comment | No study reported this outcome. |
| *The basis for the assumed risk (e.g. the median control group risk across studies) is provided in footnotes. The corresponding risk (and its 95% confidence interval) is based on the assumed risk in the comparison group and the relative effect of the intervention (and its 95% CI). | ||||||
| GRADE Working Group grades of evidence | ||||||
| 1 Risk of bias: rated as 'serious' (downgraded by 1) due to attrition bias, reporting bias, and sponsorship by Novartis Pharmaceuticals. | ||||||
| Clozapine: low dose (150 mg/day to 300 mg/day) versus standard dose (301 mg/day to 600 mg/day) for schizophrenia | ||||||
| Patient or population: patients with schizophrenia | ||||||
| Outcomes | Illustrative comparative risks* (95% CI) | Relative effect | No of Participants | Quality of the evidence | Comments | |
| Assumed risk | Corresponding risk | |||||
| Control | Clozapine: low dose (150 mg/day to 300 mg/day) versus standard dose (301 mg/day to 600 mg/day) | |||||
| Global state: clinically important response, as defined by individual studies | See comment | See comment | Not estimable | 0 | See comment | No study reported this outcome. |
| Mental state: clinically important response in mental state | Low1 | RR 0.93 | 176 | ⊕⊕⊝⊝ | ||
| 200 per 1000 | 186 per 1000 | |||||
| Moderate1 | ||||||
| 500 per 1000 | 465 per 1000 | |||||
| High1 | ||||||
| 800 per 1000 | 744 per 1000 | |||||
| Functioning: clinically important change in general functioning, as defined by individual studies | See comment | See comment | Not estimable | 0 | See comment | No study reported this outcome. |
| Adverse effect: clinically important adverse effect ( weight ‐ BMI) | The mean adverse effect ‐ any clinically important specific adverse effects ‐ BMI in the intervention group was | 57 | ⊕⊕⊝⊝ | |||
| Service use: number of days hospitalised | See comment | See comment | Not estimable | 0 | See comment | No study reported this outcome. |
| Service use: time to hospitalisation | See comment | See comment | Not estimable | 0 | See comment | No study reported this outcome. |
| Quality of life: clinically important change in general quality of life | See comment | See comment | Not estimable | 0 | See comment | No study reported this outcome. |
| *The basis for the assumed risk (e.g. the median control group risk across studies) is provided in footnotes. The corresponding risk (and its 95% confidence interval) is based on the assumed risk in the comparison group and the relative effect of the intervention (and its 95% CI). | ||||||
| GRADE Working Group grades of evidence | ||||||
| 1 Risk of bias rated as 'serious' (downgraded by 1) as allocation concealment, blinding status and trial sponsorship unclear 3 Imprecision: rated as 'serious' (downgraded by 1) as only one study providing data, small number of participants (less than 200) | ||||||
Background
Schizophrenia is a serious mental illness characterised by profound disruptions in thinking and speech, emotional processes, behaviour and sense of self (WHO 2013). It can have great impact in terms of both human suffering and societal expenditure (van Os 2009). It is among the world's top ten causes of long‐term disability, leading to problems in social and occupational functioning and self‐care (Meuser 2004). Before the introduction of clozapine, doctors largely relied on first generation (typical) antipsychotics, such as chlorpromazine, to control persisting symptoms and to prevent further exacerbations or relapse of illness (Kane 1990). Clozapine is the first second generation (atypical) antipsychotic drug introduced to the market. Arnt suggested that second generation antipsychotics are those that do not cause movement disorders (catalepsy) in rats at clinically effective doses (Arnt 1998). When clozapine was introduced it proved to be superior in controlling treatment‐resistant illness, with fewer extrapyramidal side effects (EPSEs) than typical antipsychotics such as chlorpromazine (Kane 1988). However, clozapine was largely withdrawn from use in 1975 following the death of some patients due to the development of agranulocytosis. This withdrawal, however, was not followed worldwide. For example, Scandinavia, Germany and China continued to use clozapine. Subsequent studies demonstrated that clozapine could be administered safely when patients are carefully monitored for side effects such as agranulocytosis (Kane 1988; Naheed 2001). Following this, clozapine was reintroduced in the USA in 1990 with hopes that it would improve quality of life, cognitive functioning and movement disorders, and also reduce negative symptoms such as poverty of speech, blunting of affect, lack of volition and social withdrawal in the management of treatment‐resistant schizophrenia. During this reintroduction, some safeguards were put in place; for example, clozapine is recommended to be used only in treatment‐resistant schizophrenia along with regular monitoring for side effects such as agranulocytosis.
Description of the condition
1. Schizophrenia
WHO 2013 estimates that about 24 million people worldwide are affected by schizophrenia. The symptoms typically emerge in late adolescence or early adulthood. It is unclear as to what exactly causes schizophrenia, but both genetic and environmental factors are thought to play a role. WHO 2013 identified a low incidence of 3 per 100,000, whereas McGrath 2008 identified the median incidence of schizophrenia as 15.2 per 100,000 people. Saha 2005 found no significant difference in prevalence between urban, rural, and mixed sites. The prevalence of schizophrenia in migrants is higher compared to native‐born individuals and is lower in poorer countries than in richer countries. Saha 2005 identified the median point prevalence of schizophrenia (the proportion of people who suffer from schizophrenia at a specific point in time) as 4.6 per 1000; the median lifetime prevalence for persons (the number of people in the population who have ever manifested the disease) was 4.0 per 1000; and the lifetime morbid risk (the likelihood of a particular individual developing schizophrenia in their lifetime) as 7.2 per 1000. Acute schizophrenia predominantly manifests itself with positive symptoms such as abnormal experiences; these include abnormal perceptions in the absence of a stimulus (hallucinations), false fixed beliefs (delusions), and disordered thinking. Chronic schizophrenia typically manifests itself with negative symptoms. Though there is no complete agreement as to the specification of negative symptoms, it is generally agreed that they include poverty of speech, blunting of affect, lack of volition and social withdrawal (Gelder 2001). More than 50% of people with schizophrenia are not receiving appropriate care and about 90% of people with untreated schizophrenia live in developing countries (WHO 2013). Most cases of schizophrenia can be treated and those affected can lead a productive life and be integrated in society. The incidence of treatment resistance in schizophrenia is about 20% (Kerwin 2005). Clozapine reduces psychotic symptoms in 30% to 60% of such schizophrenia patients who have failed to respond to adequate trials of other antipsychotics (Buchanan 1995).
2. Schizophreniform disorder
According to the Diagnostic and Statistical Manual of Mental Disorders, Fourth Edition, schizophreniform disorder is a condition with symptoms similar to schizophrenia but lasting less than six months (DSM‐IV). In 1937 and 1939, follow‐up studies were undertaken on patients who initially presented with symptoms similar to schizophrenia. Two different outcomes were identified in those patients. One group, whose symptoms were typical of schizophrenia, were identified as having a poor prognosis. The other group, whose symptoms were similar to those of schizophrenia but who had prominent affective symptoms, had a better outcome; Langfeldt introduced the concept of schizophreniform psychoses to describe this latter group (Noreik 1967; Guldberg 1991). Langfeldt’s original schizophreniform cases were reviewed by other researchers using DSM‐III and International Statistical Classification of Diseases and Related Health Problems, Ninth Revision (ICD‐9) criteria. They concluded that most of the original schizophreniform cases described by Langfeldt possibly appeared to more closely resemble affective disorders with psychoses, rather than schizophrenia‐like illness (Bergem 1990; Guldberg 1991). DSM‐IV uses schizophreniform disorder to define a disorder that would otherwise meet the diagnostic criteria for schizophrenia but lasts less than six months (Gelder 2001). There are currently no reliable data on prevalence rates of schizophreniform disorder (Kaplan 2005). Treatment is similar to that of schizophrenia. Good prognostic factors for schizophreniform illness include episodic illness, recurrent course and a family history of mood disorders (Benazzi 2003).
3. Schizoaffective disorder
In 1933 Jacob Kasanin coined the term schizoaffective psychosis (Kasanin 1933). Schizoaffective psychosis can be considered as a syndrome on the continuum between schizophrenia and mood disorders (such as depression and bipolar affective disorder) and presents with symptoms of both these illnesses (Danileviciūte 2002). ICD‐10 considers schizoaffective disorder as an episodic disorder in which both affective and schizophrenic symptoms are prominent but which does not justify a diagnosis of either schizophrenia or a depressive or manic episode. Studies on schizoaffective disorder suggest that it is relatively common in clinical settings. Among admissions to inpatient mental health facilities for functional psychosis, 10% to 30% comprise schizoaffective disorder. The lifetime prevalence of schizoaffective disorder is estimated to be between 0.5% and 0.8% and the illness typically presents with an episodic course (Azorin 2005). Psychotic features may include both positive and negative symptoms along with affective symptoms. Outcome is predicted by premorbid functioning, number of past episodes, persistence of psychotic features and degree of cognitive impairment. Vieta 2010 suggests that bipolar‐type schizoaffective illness can be treated with second generation antipsychotics, either alone or in conjunction with a mood stabiliser. The depressive type of schizoaffective disorder can be treated with a second generation antipsychotic in conjunction with either an antidepressant or a mood stabiliser. Electroconvulsive therapy (ECT) can be considered in refractory cases. Prognosis appears to be better than for schizophrenia, but worse than for affective disorder (Azorin 2005).
Description of the intervention
Prescribing of clozapine requires a number of preparatory steps. For example, before initiation of clozapine a base line physical examination should be performed with an ECG and base line blood tests, including full blood count. Patients must be registered with the clozapine patient monitoring services, and full blood count must be monitored once a week for the first 18 weeks, thereafter fortnightly for 34 weeks and then once in every four weeks for the period of time clozapine is taken. For adults over 16 years of age, clozapine should be started at a very low dose, e.g. 12.5 mg once or twice a day. On the second day, 25 mg to 50 mg is given, and, if well tolerated, the dose can be gradually increased in steps of 25 mg to 50 mg daily over 14 to 21 days up to 300 mg daily in divided doses. If necessary, the dose can be increased further. Elderly people may need slower titration. During initiation and titration, pulse and blood pressure (in standing and lying position) should be monitored regularly to identify persistent tachycardia and postural hypotension. If clozapine, for whatever reason, was omitted for a period of 48 hours, it should be restarted from lowest dose and titrated upwards. Adverse effects of clozapine include constipation, troublesome hypersalivation, tachycardia, ECG changes, hypertension, drowsiness, dizziness, headache, tremor, seizures, fatigue, impaired temperature regulation, urinary incontinence, urinary retention, leukopenia, eosinophilia, leucocytosis, and, less commonly, agranulocytosis, and other cardiovascular and respiratory side effects (BNF 2012).
Accessibility of clozapine
Upon reintroduction of clozapine in the USA in 1990, clozapine was recommended to be used only in treatment‐resistant schizophrenia, along with regular monitoring for side effects such as agranulocytosis. The British National Formulary currently recommends clozapine be used only in "schizophrenia (including psychosis in Parkinson’s disease) in patients unresponsive to, or intolerant of, conventional antipsychotic drugs" (BNF 2012). The National Institute for Health and Care Excellence recommends clozapine in people suffering from schizophrenia who did not respond adequately to sequential use of adequate doses of at least two different antipsychotic drugs, at least one of which should be a non‐clozapine second‐generation antipsychotic (NICE). Clozapine is made available only through the manufacturer's proprietary monitoring system, and all the UK manufacturers of clozapine such as Novartis (Clozaril), Merz (Denzapine), and Teva (Zaponex) require that the patients, prescribers and supplying pharmacists be registered with their relevant patient monitoring service. Through shared care arrangements with local community pharmacies dispensing clozapine, it is possible in the UK to initiate clozapine treatment in the community after registration with the patient monitoring services is completed (CMHP). However, general practitioners generally do not prescribe clozapine in the UK. Aitchison 1997 suggested that the costs of prescribing clozapine could be recouped on savings in future inpatient care. Wang 2004 indicated that if clozapine was made available as a first‐line antipsychotic, it might possibly lead to small gains in life expectancy, at moderate but acceptable costs. Kane 2011 opined that clozapine still remains strikingly under‐utilised and that many practitioners across the world and across different clinical settings do not use clozapine even when indicated.
How the intervention might work
Clozapine (Figure 1) was the first atypical antipsychotic to show definite benefit in treatment of patients where symptoms failed to respond to typical agents. Clozapine has the highest affinity for dopamine D4, 5‐HT1C, 5‐HT2, alpha 1, muscarinic and histamine H1 receptors, but moderate affinity is also seen for many other receptor subtypes (Coward 1992). Clozapine causes fewer extrapyramidal side effects (EPSEs) than typical antipsychotics (Kane 1988). Clozapine appears to be more active at the limbic site than the striatal site and this might explain its low extrapyramidal side effect profile. It is metabolized mainly in the liver. Norclozapine is an active metabolite of clozapine. Monitoring the plasma levels of clozapine and norclozapine helps to assess compliance. It is suggested that the therapeutic response is associated with clozapine blood levels between 200 ng/ml and 400 ng/ml (Kronig 1995). Chemicals that affect cytochrome enzymes can reduce or increase plasma clozapine concentration.

Clozapine structure
Why it is important to do this review
Different guidelines suggest different dosing for clozapine. For example, BNF 2012 recommends a usual dose of 200 mg/day to 450 mg/day and the maximum daily dose of 900 mg. Merz, the UK manufacturer of Denzapine, also advises the prescription of clozapine at a dose between 200 mg/day and 450 mg/day, with maximum doses up to 900 mg/day. Novartis, the UK manufacturer of Clozaril, suggests that while many patients may respond adequately at doses between 300 mg/day and 600 mg/day, it may be necessary to raise the dose to the 600 mg/day to 900 mg/day range to obtain an acceptable response. Kaplan 2005 suggests that daily doses between 250 mg/day and 450 mg/day are usually considered adequate and daily dosage above 600 mg/day is seldom indicated. Semple 2007 advises that usual doses of 200 mg to 450 mg daily can be used, and that an increase in frequency of seizures occurs at doses greater than 600 mg/day. Stahl 2006 suggests using 300 mg/day to 450 mg/day with a maximum of 900 mg/day, and that doses of more than 550 mg/day may require concomitant anticonvulsant medications to reduce the risk of seizures. Plasma levels may help guide dosing, with studies suggesting that maximal clinical efficacy may be achieved when plasma levels of clozapine are between 200 ng/ml and 400 ng/ml (typically associated with a dose of 300 mg/day to 400 mg/day (Kronig 1995; Simpson 1999). However, it is important to note that the relationship between the dose of clozapine and the resulting serum level is weak (Taylor 1995). This could be a reason why there is wide variation of the clinically effective dose in different individuals. It is still unclear as to what dose of clozapine is most effective with the least side effects. It must be borne in mind as well that patient non‐compliance can be as high as 50% under outpatient conditions and this could be due to drug‐related side effects (Gaebel 1997), and lead to relapse. Clozapine produces severe adverse effects. Hence we will review the evidence for doses of clozapine that are both tolerable and effective in the management of schizophrenia, schizophreniform and schizoaffective disorders. This is one of a series of reviews on the effects of clozapine (Table 1).
| Title | Reference |
| Clozapine versus other atypical antipsychotics for schizophrenia | |
| Clozapine combined with different antipsychotic drugs for treatment resistant schizophrenia | |
| Clozapine versus typical neuroleptic medication for schizophrenia | |
| Pharmacological interventions for clozapine‐induced hypersalivation |
Objectives
To compare the efficacy and tolerability of clozapine at different doses and to identify the optimal dose of clozapine in the treatment of schizophrenia, schizophreniform and schizoaffective disorders.
Methods
Criteria for considering studies for this review
Types of studies
We included all relevant randomised controlled trials, reporting useable data, that compared different doses of clozapine, irrespective of blinding status and published language. Where people were given additional treatments along with clozapine, we included the trial only if the adjunct treatment was equal in both groups and only the clozapine doses were randomised. We included studies on treatment‐resistant illnesses and took the opportunity to examine clozapine’s effect on the course of the illness (for example acute, partial remission, remission, first episode). We excluded case series and non‐randomised trials, and quasi‐randomised trials where, for example, allocation is undertaken on alternate days of the week or by alphabetical order.
Types of participants
We included studies on people with schizophrenia, schizophreniform disorder and schizoaffective disorder diagnosed by any criteria. We decided to include schizophreniform and schizoaffective disorders as these conditions may be caused by similar disease processes and may require similar treatment approaches (Carpenter 1994).
Types of interventions
We compared the efficacy of different doses of clozapine in different arms in the same trial. We did not compare efficacy of clozapine to any other antipsychotic or to placebo or to any other medications. The intervention of interest was clozapine: oral formulation, any dose, comparison of different doses. We predefined the dosage categories as follows.
1. Very low dose clozapine: up to 149 mg/day.
2. Low‐dose clozapine: 150 mg/day to 300 mg/day.
3. Standard‐dose clozapine: 301 mg/day to 600 mg/day.
4. High‐dose clozapine: 601 mg/day to 900 mg/day.
5. Very high dose clozapine: 901 mg/day and above.
Types of outcome measures
We grouped outcomes into short term (up to 12 weeks), medium term (13 to 26 weeks) and long term (more than 26 weeks).
Primary outcomes
1. Global state
Clinically important response as defined by the individual studies (e.g. global impression "much improved" or 50% reduction on a rating scale).
Secondary outcomes
1. Global state
1.1 Relapse (as defined by the individual studies).
1.2 Average endpoint global state score.
1.3 Average change in global state scores.
1.4 Needing additional medication.
2. Mental state
2.1 Clinically important change in general mental state score.
2.2 Average endpoint general mental state score.
2.3 Average change in general mental state scores.
2.4 Clinically important change in specific symptoms (e.g. positive symptoms of schizophrenia, negative symptoms of schizophrenia).
2.5 Average endpoint specific symptom score.
2.6 Average change in specific symptom scores.
2.7 Healthy days.
3. Death
3.1 Suicide.
3.2 Natural causes.
4. Leaving the studies early
4.1 Any reason.
4.2 Specific reason (as described by individual studies; for example: adverse events, treatment inefficacy).
5. Behaviour
5.1 Clinically important change in general behaviour.
5.2 Average endpoint general behaviour score.
5.3 Average change in general behaviour scores.
5.4 Clinically important change in specific aspects of behaviour.
5.5 Average endpoint specific aspects of behaviour.
5.6 Average change in specific aspects of behaviour.
6. Functioning
6.1 Clinically important change in general functioning.
6.2 Average endpoint general functioning score.
6.3 Average change in general functioning scores.
6.4 No clinically important change in specific aspects of functioning, such as social or life skills.
6.5 Average endpoint specific aspects of functioning, such as social or life skills.
6.6 Average change in specific aspects of functioning, such as social or life skills.
7. Cognitive functioning
7.1 Clinically important change in overall cognitive functioning.
7.2 Average endpoint overall cognitive functioning score.
7.3 Average change in overall cognitive functioning score.
7.4 Clinically important change in specific aspects of cognitive functioning.
7.5 Average endpoint specific aspects of cognitive functioning.
7.6 Average change in specific aspects of cognitive functioning.
8. Quality of life
8.1 Clinically important change in general quality of life.
8.2 Average endpoint general quality of life score.
8.3 Average change in general quality of life score.
8.4 Clinically important change in specific aspects of quality of life.
8.5 Average endpoint specific aspects of quality of life.
8.6 Average change in specific aspects of quality of life.
9. Adverse effects
9.1 Number of participants with at least one adverse effect.
9.2 Clinically important specific adverse effects (such as effects on white blood cell count, cardiac effects, movement disorders, hypersalivation, seizures, prolactin increase and metabolic side effects (such as weight gain, hyperlipidaemia and hyperglycaemia)).
9.3 Clinically important general adverse effects.
9.4 Average endpoint general adverse effect score.
9.5 Average change in general adverse effect score.
9.6 Average endpoint specific adverse effect score.
9.7 Average change in specific adverse effect score.
9.8 Use of any drugs for adverse effects.
10. Satisfaction with treatment
10.1 Recipient of care not satisfied with treatment.
10.2 Recipient of care average satisfaction score.
10.3 Recipient of care average change in satisfaction score.
10.4 Carer not satisfied with treatment.
10.5 Carer average satisfaction score.
10.6 Carer average change in satisfaction score.
11. Service use
11.1 Number of patients hospitalised.
11.2 Number of days hospitalised.
11.3 Time to hospitalisation.
11.4 Number of patients discharged or readmitted (as defined in individual trial).
12. Economic outcomes
12.1 Direct costs.
12.2 Indirect costs.
13. 'Summary of findings' table
We used the GRADE approach to interpret findings (Schünemann 2011); and GRADE Profiler (GRADEpro GDT) to import data from Review Manager 5 (RevMan 5) to create 'Summary of findings' tables. These tables provide outcome‐specific information concerning the overall quality of evidence from each included study in the comparison, the magnitude of effect of the interventions examined and the sum of available data on all outcomes we rated as important to patient care and decision making. We selected the following outcomes for inclusion in the summary of findings Table for the main comparison; summary of findings Table 2; summary of findings Table 3.
-
Global state: clinically important response, as defined by individual studies.
-
Mental state: clinically important response, as defined by individual studies.
-
Functioning: clinically important change in general functioning, including social or life skills, as defined by individual studies.
-
Adverse effect: clinically important adverse effect.
-
Service use: number of days hospitalised.
-
Service use: time to hospitalisation.
-
Quality of life: clinically important change in general quality of life.
Search methods for identification of studies
Electronic searches
Cochrane Schizophrenia Group’s Study‐Based Register of Trials
On 8 December 2016, the information specialist searched the register using the following search strategy:
Dosage ‐ Clozapine in Intervention Field of STUDY
In a study‐based register such as this, searching the major concept retrieves all the synonyms and relevant studies because all the studies have already been organised based on their interventions and linked to the relevant topics.
This register is compiled by systematic searches of major resources (including AMED, BIOSIS, CINAHL, Embase, MEDLINE, PsycINFO, PubMed, and registries of clinical trials) and their monthly updates, handsearches, grey literature, and conference proceedings (see Group’s Module). There is no language, date, document type, or publication status limitations for inclusion of records in the register.
For previous searches, please see Appendix 1.
Searching other resources
1. Reference searching
We searched the reference lists of each included paper, but failed to find any new studies.
2. Personal contact
Where possible, we contacted the first author of trials or citations for missing information on unpublished data or trials. Where contact with the first author was not possible through the Cochrane Schizophrenia Group, we attempted to contact the other authors. At the time of writing, we have not received any of the missing data we requested, though one author indicated he will send the requested information at a future date. We have discussed this in detail under relevant Results sections.
Data collection and analysis
Selection of studies
One review author (SS) inspected citations from the searches, identified relevant abstracts, obtained full articles of all relevant abstracts, and classified studies as 'included', 'excluded', or 'with information missing'. We placed the last under 'pending classification' and contacted the authors for further clarification. A second review author (BV) independently inspected a random 20% of citations to ensure reliability.
Data extraction and management
1.1 Data extraction
One review author (SS) extracted data from all included reports. To ensure reliability, a second review author (BV) independently extracted data from a random 25% sample of these reports. There was no disagreement. Had there been disagreement, we would have documented decisions and contacted authors of studies for clarification where necessary. We extracted data presented in graphs and figures only, whenever possible. We attempted to contact authors in order to obtain missing information or clarification whenever necessary.
1.2 Forms
We extracted data onto standard forms.
2. Data management
2.1 Scale‐derived data
We included continuous data from rating scales only if (a) the psychometric properties of the measuring instrument had been described in a peer‐reviewed journal (Marshall 2000), and (b) the measuring instrument had not been written or modified by one of the trialists for that particular trial. Ideally the measuring instrument should either be:
(a) a self‐report;
(b) an instrument completed by an independent rater or relative (not the therapist);
(c) a global assessment of an area of functioning and not sub‐scores which are not, in themselves, validated or shown to be reliable. However there are exceptions: we included sub‐scores from mental state scales measuring positive and negative symptoms of schizophrenia.
We realise that this is not often reported clearly and we note in Description of studies if this was the case or not.
2.2 Endpoint versus change data
There are advantages of both endpoint and change data. Change data can remove a component of between‐person variability from the analysis. On the other hand, calculation of change needs two assessments (baseline and endpoint) which can be difficult in unstable and difficult‐to‐measure conditions such as schizophrenia. We primarily used endpoint data, and only used change data if the former were not available. We combined endpoint and change data in the analysis by the use throughout of mean differences (MD) rather than standardised mean differences (Deeks 2011).
2.3 Skewed data
Continuous data on clinical and social outcomes are often not normally distributed. To avoid the pitfall of applying parametric tests to non‐parametric data, we aimed to apply the following standards to all data before inclusion: a) standard deviations and means are reported in the paper or obtainable from the authors; b) when a scale starts from the finite number zero, the standard deviation, when multiplied by two, is less than the mean (as otherwise the mean is unlikely to be an appropriate measure of the centre of the distribution (Altman 1996); c) if a scale started from a positive value (such as the PANSS which can have values from 30 to 210), the calculation described above was modified to take the scale starting point into account. In these cases skew is present if 2SD > (S −S min), where S is the mean score and S min is the minimum score. Endpoint scores on scales often have a finite start and end point and the above rules can be applied. We did not come across skewed endpoint data in our review, but if we had then we would have entered skewed endpoint data from studies of fewer than 200 participants as other data within the Data and analyses section rather than into a statistical analysis. Skewed endpoint data would pose fewer problems when looking at means if the sample size is large, and we would have then entered these into syntheses.
When continuous data are presented on a scale that includes a possibility of negative values (such as change data), it is difficult to tell whether data are skewed or not, and we would have entered skewed change data into statistical analysis.
2.4 Common measure
To facilitate comparison between trials, where possible we tried to convert variables reported in different metrics (e.g. days spent in hospital as mean days per year or per week or per month) to a common metric (e.g. mean days per month).
2.5 Conversion of continuous to binary
Where possible, we would have converted outcome measures to dichotomous data. This would have been done by identifying cut‐off points on rating scales and dividing participants accordingly into 'clinically improved' or 'not clinically improved'. It is generally assumed that if there is a 50% reduction in a scale‐derived score such as the Brief Psychiatric Rating Scale (BPRS, Overall 1962) or the Positive and Negative Syndrome Scale (PANSS, Kay 1986), this could be considered as a clinically significant response (Leucht 2005a; Leucht 2005b). If data based on these thresholds had not been available, we would have used the primary cut‐off presented by the original authors. Where data on clinical improvement was presented as 'very effective', 'effective' and 'no improvement', we grouped these to form the dichotomous outcome of 'effective'/'no improvement'.
2.6 Direction of graphs
Where possible, we entered data in such a way that the area to the left of the line of no effect indicates a favourable outcome for lower dose of clozapine.
Assessment of risk of bias in included studies
One review author (SS) independently assessed risk of bias by using criteria described in the Cochrane Handbook for Systematic Reviews of Interventions to assess trial quality (Higgins 2011b). A second review author (BV) randomly checked 25% to ensure reliability. This set of criteria is based on evidence of associations between overestimate of effect and high risk of bias of the article such as sequence generation, allocation concealment, blinding, incomplete outcome data and selective reporting. There was no disagreement. If there had been disagreement, we would have resolved it by further discussion. The level of risk of bias is noted in both the text of the review and in the 'Summary of findings' table.
Measures of treatment effect
1. Binary data
For binary outcomes we calculated a standard estimation of the risk ratio (RR) and its 95% confidence interval (CI). It has been shown that RR is more intuitive than odds ratios (Boissel 1999); and that odds ratios tend to be interpreted as RR by clinicians (Deeks 2000). The number needed to treat for an additional beneficial outcome/harmful outcome (NNTB/NNTH) statistic with its confidence intervals is intuitively attractive to clinicians but is problematic both in its accurate calculation in meta‐analyses and interpretation (Hutton 2009). For binary data presented in the 'Summary of findings' table/s, where possible we calculated illustrative comparative risks.
2. Continuous data
We estimated mean difference (MD) between groups for continuous outcomes. We preferred not to calculate effect size measures (standardised mean difference (SMD)). However, if very similar scales had been used, we would have presumed there was a small difference in measurement and would have calculated effect size and transformed the effect back to the units of one or more of the specific instruments.
Unit of analysis issues
1. Cluster trials
Studies increasingly employ 'cluster randomisation' (such as randomisation by clinician or practice) but analysis and pooling of clustered data poses problems. Firstly, authors often fail to account for intra‐class correlation in clustered studies, leading to a 'unit of analysis' error (Divine 1992), whereby P values are spuriously low, confidence intervals unduly narrow and statistical significance overestimated. This causes type I errors (Bland 1997; Gulliford 1999).
There were no cluster trials included in our review. If there had been cluster studies, then where clustering was not accounted for in primary studies we would have presented data in a table, with a (*) symbol to indicate the presence of a probable unit of analysis error. In subsequent versions of this review we will contact first authors of studies to obtain intra‐class correlation coefficients for their clustered data and adjust for this by using accepted methods (Gulliford 1999).
If clustering had been incorporated into the analysis of primary studies, we would have presented these data as if from a non‐cluster randomised study, but would have adjusted for the clustering effect. Statistical advice has been sought in the past: it was advised that binary data should be presented in a report and divided by a 'design effect'. This is calculated using the mean number of participants per cluster (m) and the intra‐class correlation coefficient (ICC): [Design effect = 1 + (m − 1) * ICC] (Donner 2002). If the ICC had not been reported we would have assumed it to be 0.1 (Ukoumunne 1999). If cluster studies had been appropriately analysed taking into account intra‐class correlation coefficients and relevant data documented in the report, synthesis with other studies might have been possible using the generic inverse variance technique.
2. Cross‐over trials
We only used data from the first phase of cross‐over studies. A major concern of cross‐over trials is the carry‐over effect. It occurs if an effect (e.g. pharmacological, physiological or psychological) of the treatment in the first phase is carried over to the second phase. As a consequence, on entry to the second phase participants can differ systematically from their initial state despite a wash‐out phase. For the same reason cross‐over trials are not appropriate if the condition of interest is unstable (Elbourne 2002). Because both these effects are very likely in severe mental illness, we decided to use data from the first phase of cross‐over studies only. In our review, the Simpson 1999 trial was conducted in three phases of 16 weeks each, lasting for a total of 48 weeks with the last two phases being crossed over. For this trial we included the data from the first 16 weeks only (i.e. before cross‐over occurred).
3. Studies with multiple treatment groups
There was no relevant additional treatment in any of the included trials. If a study had involved additional treatment arms, we would have presented the additional arms in comparisons only if relevant and would not have reproduced data from irrelevant arms. For binary data, we would simply have added these and combined within a two‐by‐two table. For continuous data, we would have combined the data following the formula in the Cochrane Handbook for Systematic Reviews of Interventions (Higgins 2011a). In cases where a study had two intervention arms which both fell within a single‐dosage category defined in Types of interventions (for example, in Chen 2013 where both the 301 mg/day to 400 mg/day intervention and the 401 mg/day to 500 mg/day intervention fell within the ‘standard’ dose category), means and standard deviations were combined for continuous outcomes using methods described in section 7.7.3.8 of Higgins 2011a.
Dealing with missing data
1. Overall loss of credibility
At some degree of loss of follow‐up, data must lose credibility (Xia 2009). If more than 50% of data had been unaccounted for in any particular outcome, we had decided neither to reproduce these data nor to use them within our analyses. In this review, however, loss of data was never more than 50% for any outcome or in any arm. If the loss of data had been more than 50% but the total loss had been less than 50%, we would have marked such data with (*) to indicate that the result might have been prone to bias.
2. Binary
Those who left the study early were all assumed to have the same outcome as those who completed, with the exception of the outcomes of death and adverse effects.
3. Continuous
3.1 Attrition
Had attrition for a continuous outcome been between 0% and 50% and completer‐only data had been reported, we would have reproduced these data.
3.2 Standard deviations
In our review, there were few data whose standard deviations (SDs) were missing. We tried to obtain the missing values from the authors, but were unsuccessful. Where there are missing measures of variance for continuous data, but an exact standard error (SE) and confidence intervals available for group means, and either P value or t value available for differences in mean, we can calculate them according to the rules described in the Cochrane Handbook for Systematic reviews of Interventions (Higgins 2011a): When only the standard error (SE) is reported, SDs are calculated by the formula SD = SE * square root (n). The Cochrane Handbook for Systematic reviews of Interventions (Higgins 2011a) present detailed formulae for estimating SDs from P values, t or F values, confidence intervals, ranges or other statistics. If these formulae do not apply, we could calculate the SDs according to a validated imputation method which is based on the SDs of the other included studies (Furukawa 2006). Although some of these imputation strategies can introduce error, the alternative would be to exclude a given study’s outcome and thus to lose information. We examined the validity of the imputations in a sensitivity analysis excluding imputed values. In our review we needed to exclude some outcome data as suggested by this last option.
3.3 Last observation carried forward
We anticipated that in some studies the method of last observation carried forward (LOCF) would have been reported. As with all methods of imputation to deal with missing data, LOCF introduces uncertainty about the reliability of the results (Leucht 2007). We found no cases where less than 50% of the LOCF data were available; if we had, we would have reproduced these data and indicated that they were based on LOCF assumptions.
Assessment of heterogeneity
1. Clinical heterogeneity
We considered all included studies initially, without seeing comparison data to judge clinical heterogeneity. We inspected all studies for clearly outlying people or situations which we had not predicted would arise, but we did not come across any such outlying conditions.
2. Methodological heterogeneity
We considered all included studies initially without seeing comparison data to judge methodological heterogeneity. We simply inspected all studies for clearly outlying methods which we had not predicted would arise, but we did not come across any such outlying methods.
3. Statistical heterogeneity
3.1 Visual inspection
We visually inspected the graphs to investigate the possibility of statistical heterogeneity.
3.2 Employing the I² statistic
We investigated heterogeneity between studies by considering the I² method alongside the Chi² P value. The I² provides an estimate of the percentage of inconsistency thought to be due to chance (Higgins 2003). The importance of the observed value of I² depends on (i) magnitude and direction of effects, and (ii) strength of evidence for heterogeneity (e.g. P value from Chi² test, or a confidence interval for I²). I² estimates greater than or equal to 50% and accompanied by a statistically significant Chi² statistic are interpreted as evidence of substantial levels of heterogeneity (Deeks 2011). If substantial levels of heterogeneity had been found in the primary outcome, we would have explored reasons for heterogeneity (Subgroup analysis and investigation of heterogeneity).
Assessment of reporting biases
1. Protocol versus full study
We attempted to locate protocols of the included randomised trials but were unsuccessful. We therefore compared the outcomes listed in the Methods section of the trial report with those actually reported in the results.
2. Funnel plot
Reporting biases arise when the dissemination of research findings is influenced by the nature and direction of results (Egger 1997). These are described in Chapter 10 of the Cochrane Handbook for Systematic Reviews of Interventions (Sterne 2011). We are aware that funnel plots may be useful in investigating reporting biases but have limited power to detect small‐study effects. We did not use funnel plots as there were only three randomised controlled studies included in this review.
Data synthesis
We understand that there is no closed argument in favour of either a fixed‐effect or a random‐effects model. The random‐effects method incorporates an assumption that the different studies are estimating different, yet related, intervention effects. This often seems to be true to us and the random‐effects model takes into account differences between studies even if there is no statistically significant heterogeneity. There is, however, a disadvantage to the random‐effects model: it adds weight to small studies, which often are the most biased ones. Depending on the direction of effect, these studies can either inflate or deflate the effect size. We chose a random‐effects model for all analyses. The reader is, however, able to choose to inspect the data using the fixed‐effect model by opening this review in RevMan 5 format and selecting to view by "fixed effect" model under the properties section of each graph.
Subgroup analysis and investigation of heterogeneity
1. Subgroup analyses
We had planned to report data on subgroups of participants (for example, those who received additional medications or had additional diagnoses), but we did not encounter such subgroups.
1.1 Clinical state, stage or problem
This review provides an overview of the effects of clozapine for people with schizophrenia, schizophreniform and schizoaffective disorder. Our aim was also to report data on subgroups of people in the same clinical state, stage and with similar problems (for example patients in agitated state, partial remission, remission or first episode), but we did not come across any such subgroups.
2. Investigation of heterogeneity
We report if inconsistency was high. First, we investigated whether data were entered correctly. Secondly, if the data were correct, we visually inspected the graphs and successively removed outlying studies to see if heterogeneity was restored. For this review we decided that we would present the data if this occurred in no more than 10% of the total weighting of the summary findings. If not, we would not pool data but would only discuss the issues. If unanticipated clinical or methodological heterogeneity had been obvious, we would have stated the hypotheses regarding these for future reviews or versions of this review and would not have undertaken analyses relating to these.
Sensitivity analysis
1. Implication of randomisation
We would have included in a sensitivity analysis primary outcomes data from studies where randomisation was implied but was not clearly described, but we did not come across such studies. If there had been no substantive difference when the implied randomised studies were added to those with better description of randomisation, then we would have employed all data from these studies.
2. Assumptions for lost binary data
Where assumptions were made regarding participants lost to follow‐up (see Dealing with missing data) we would have compared the findings of the primary outcomes when we used our assumption compared with completer data only. If there had been a substantial difference, we would have reported the results and discussed them but would have continued to employ our assumption. Where assumptions were made regarding missing SDs data (see Dealing with missing data), we would have compared the findings on primary outcomes when we used our assumption compared with completer data only. We would have undertaken a sensitivity analysis testing as to how prone results would have been to change with completer data only compared to the imputed data using the above assumption. If there would have been a substantial difference, we would have reported these results and discussed them but would have continued to employ our assumption. We did not have to make such assumptions in our review.
3. Risk of bias
We analysed the effects of excluding trials that were judged to be at high risk of bias across one or more of the domains — randomisation, allocation concealment, blinding and outcome reporting and other bias — for the meta‐analyses of the primary outcome. If the exclusion of trials at high risk of bias did not substantially alter the direction of effect or the precision of the effect estimates, then we included data from these trials in the analysis.
4. Imputed values
We did not include any cluster trials. If any had been included, we would have undertaken sensitivity analysis to assess the effects of including data from trials where we had used imputed values for ICCs in calculating the design effect. If substantial differences in the direction or precision of effect estimates in any of the sensitivity analyses had been noted, we would not have pooled data, but would have presented them separately.
5. Fixed‐effect and random‐effects
We synthesised all data using a random‐effects model.
Results
Description of studies
For substantive description of studies please also see Characteristics of included studies, Characteristics of excluded studies and Characteristics of ongoing studies.
Results of the search
The search strategy yielded 122 citations. One was a duplicate. We closely inspected 23 full‐text reports; and after excluding 18 full‐text reports, we included five studies in the review. A random 20% of the citations were independently reviewed by one review author (BV) to increase reliability. Details of the search results are illustrated in the PRISMA table (Figure 2).

Study flow diagram.
Included studies
We included five studies with a total of 452 participants.
1. Study length
Chen 1998 and Chen 2013 were short‐term trials lasting six weeks. Sheng 1990 and Liu 2005 were also short term (12 weeks). The Simpson 1999 trial was originally conducted in three phases of 16 weeks each, lasting for a total of 48 weeks. However, after the first 16 weeks, the non‐responders in the trial were crossed over to other arms and hence they were not randomised anymore after the initial 16 weeks. So, as per protocol, we included the results of only the first 16 weeks (medium term: 13 to 26 weeks) from these citations. There were no long‐term studies (> 26 weeks).
2. Design
All included studies were randomised controlled trials. Chen 1998 is a randomised controlled trial comparing the efficacy of clozapine at doses of 200 mg and 500 mg; details of blinding status and of any sponsorship are unclear. Liu 2005 is a randomised controlled trial comparing clozapine at doses of less than 150 mg/day, 150 mg/day to 300 mg/day and more than 300 mg/day, in which participants were allocated using a random number table; details of blinding status and of any sponsorship are unclear. Chen 2013 is a randomised trial comparing doses of 200 mg/day to 300 mg/day, 301 mg/day to 400 mg/day and 401 mg/day to 500 mg/day. Sheng 1990 is a randomised trial comparing doses of 300 mg/day and 600 mg/day. Simpson 1999 is an implied randomised controlled trial comparing the efficacy of clozapine at different doses of 100 mg/day, 300 mg/day and 600 mg/day in 50 patients. The trial was sponsored by Novartis Pharmaceuticals and conducted between 1992 and 1995; the participants stayed in the research centre for four weeks for adaptation (naturalistic baseline with no modification in their treatment regimen) and underwent a four‐week haloperidol treatment followed by a one‐week wash out before the first phase of clozapine treatment.
3. Participants
A total of 452 participants were included in the five trials. Chen 1998 conducted their study on a total of 176 male and female patients, aged between 17 and 55 years, suffering from schizophrenia and with illness duration of 8 (± 11 months) on average. Liu 2005 included 87 male patients aged between 18 and 45 years and used CCMD‐3 to diagnose patients suffering from schizophrenia. Chen 2013 and Sheng 1990 randomised 90 and 51 patients with schizophrenia, respectively. Simpson 1999 was conducted on a total of 22 males and 28 females with a mean age of 44.8 years (range 35 to 54) suffering from schizophrenia, treatment refractory or schizoaffective disorder, diagnosed by DSM‐III‐R criteria. Mean illness duration was 25.1 years (range 1 to 38 years) and the median number of psychiatric hospitalisations was five (range 1 to 25). Patients had not shown a satisfactory clinical response to treatment with at least three neuroleptic drugs (each given for at least six weeks in doses equivalent to 1000 mg/day of chlorpromazine).
4. Settings
Simpson 1999 used a research ward inpatient setting in a State hospital in the USA. Liu 2005 was conducted in an inpatient setting in a medical college. The settings for Chen 1998, Chen 2013 and Sheng 1990 were unclear.
5. Interventions
We classified interventions into five groups according to clozapine dosage. Liu 2005 administered clozapine at less than 150 mg/day (very low dose), at 150 mg/day to 300 mg/day (low dose) and at more than 300 mg/day (standard dose). Simpson 1999 administered clozapine at 100 mg/day (very low dose), 300 mg/day (low dose) and 600 mg/day (standard dose). Chen 1998 administered clozapine at 200 mg/day (low dose) and at 500 mg/day (standard dose). Chen 2013 administered doses of 200 mg/day to 300 mg/day, 301 mg/day to 400 mg/day and 401 mg/day to 500 mg/day. Sheng 1990 administered doses of 300 mg/day and 600 mg/day. No trial administered clozapine at more than 601 mg/day (high dose) or more than 901 mg/day (very high dose).
6. Outcomes
6.1 Rating scales
Details of the scales that provided usable data are shown below. Reasons for exclusions of data and/or scales are given under ‘Outcomes’ in the Characteristics of included studies table.
6.1.1 Mental state
6.1.1.1 Brief Psychiatric Rating Scale ‒ BPRS (Overall 1962)
The BPRS is an 18‐item scale measuring positive symptoms, general psychopathology and affective symptoms. High scores indicate more severe symptoms. The original scale has 16 items that are rated in interview format using Likert scale ratings from 1 (‘absent’) to 7 (‘very severe’) with scores ranging from 0 to 112. A revised 18‐item scale is commonly used with scores ranging from 0 to 126. The BPRS‐A is an anchored version of the BPRS. It describes expected symptoms and problems for each of the seven rating options for each item. As such, it is thought that the BPRS‐A anchor points provide an increased level of standardisation, leading to an improvement in rater reliability (Woerner 1988). The BPRS‐A and its subscales have been validated (Lachar 2001). Chen 1998 and Simpson 1999 reported data on the BPRS‐A.
6.1.2 Adverse events
6.1.2.1 Treatment‐Emergent Signs and Symptoms ‐ TESS (NIMH 1985)
This checklist assesses a variety of characteristics for each adverse event, including severity, relationship to the drug, temporal characteristics (timing after a dose, duration and pattern during the day), contributing factors, course, and action taken to counteract the effect. Symptoms can be listed a priori or can be recorded as observed by the investigator. A low score indicates low levels of adverse effects. Chen 1998 and Chen 2013 reported data on this outcome.
Excluded studies
Of the 122 references identified using the search strategy, one was a duplicate. We closely inspected 28 reports and excluded 23. Liu 2005a and Tang 2000 were not randomised trials. All data were missing in de Leon 1995a and de Leon 2004 and we contacted the author who confirmed that no further data were available. de Leon 2003 was excluded as the data on serum antimuscarinic activity was missing at 16 weeks before the cross‐over point. Potkin 1993 and Potkin 1994 also had all data missing from the reports and no data were useable; we contacted the author regarding the missing data but no response has been received at the time of writing. We excluded Han 2001 as different doses of sulpiride were prescribed in the clozapine arms. VanderZwaag 1996 and VanderZwaag 1997 compared the effectiveness of different serum clozapine levels, but not the effects of different doses of clozapine. Nair 1998 and Nair 1999 were excluded because the authors compared those with and without probable tardive dyskinesia in subgroups of 23 and 33 participants respectively from the Simpson 1999 trial, but provided no additional data relevant to this review.
Studies awaiting classification
Abraham 1997 is a report of a trial conducted from 1992 to 1995, reported in detail in Simpson 1999 where it is mentioned that global state was measured using the Clinical Global Impression (CGI) and these data would be discussed in Abraham 1997. However, Abraham 1997 only retrospectively analysed the data on responders and non‐responders; four participants responded, but it was unclear from the report which groups they belonged to and the CGI data for the dosage groups were also missing. We contacted the main trialist who indicated he would provide the missing data, but this has not been received at the time of writing. If we receive this subsequently, we will include it in an update of this review.
Ongoing studies
We did not identify any ongoing studies.
Risk of bias in included studies
None of the studies explicitly described the allocation process fully. Some of the studies were selective in presenting their data on outcomes. Some of the outcomes in the trials could not be used and we have not received missing data we requested from the authors of the trials. Simpson 1999 was a trial sponsored by a clozapine drug company. See Figure 3, Figure 4.
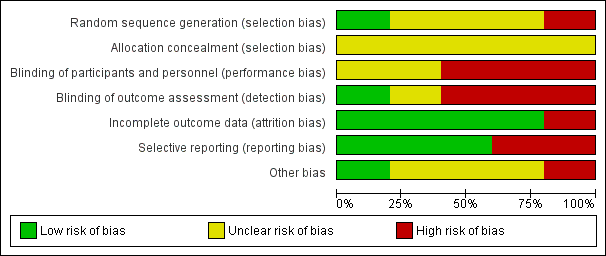
Risk of bias graph: review authors' judgements about each risk of bias item presented as percentages across all included studies.

Risk of bias summary: review authors' judgements about each risk of bias item for each included study.
Allocation
All five studies were described as randomised. Allocation in Liu 2005 was via a random number generator. Simpson 1999, Sheng 1990, Chen 2013 and Chen 1998 did not describe the methods used to generate the allocation sequence. None of the studies reported on how the results of allocation were concealed.
Blinding
Simpson 1999 was described as a double‐blind trial with assessors blinded and all patients receiving the same number of identical capsules every time, although the authors appear not to have tested the success of blinding for participants or evaluators. This may increase the risk of observer bias with potential for overestimation of positive effects and underestimation of negative ones. Chen 1998 and Liu 2005 did not report if their trials were blinded. Chen 2013 and Sheng 1990 did not report how blinding took place. Blinding may be less important for objective outcomes such as death, but the studies included here reported only subjective outcomes.
Incomplete outcome data
Chen 1998, Chen 2013 and Sheng 1990 appear to have had no loss to follow up. Liu 2005 reported on three participants who left the study early with clear reasons for doing so. Simpson 1999 reported the number leaving the study early and explicitly described that their last observations were carried forward; however, data on the scale for the Assessment of Negative Symptoms (SANS) were not reported. de Leon 2007 reported data on patients who completed the Simpson 1999 trial. However the number of patients on whom measures were reported differed slightly from week to week, and it is unclear why the number of patients on whom measurements were reported at each week differed, who had missed their measurements and why the measurements were not taken.
Selective reporting
Simpson 1999 did not report on SANS. Sheng 1990 did not report BPRS or TESS scores. Simpson 1999 reported responders' and non‐responders' data only at 48 weeks, which is after the cross‐over point at 16 weeks. No data is reported before the cross‐over.
Effects of interventions
See: Summary of findings for the main comparison Clozapine: very low dose (up to 149 mg/day) versus low dose (150 mg/day to 300 mg/day) for schizophrenia; Summary of findings 2 Clozapine: very low dose (up to 149 mg/day) versus standard dose (301 mg/day to 600 mg/day) for schizophrenia; Summary of findings 3 Clozapine: low dose (150 mg/day to 300 mg/day) versus standard dose (301 mg/day to 600 mg/day) for schizophrenia
In the text below, data from Simpson 1999 have been adjusted in accordance with the published corrections (Simpson 2001). Specifically, the standard errors for BPRS‐A endpoint scores which were originally reported by the authors as if they were standard deviations have been converted to standard deviations.
Comparison 1: clozapine: very low dose (up to 149 mg/day) versus low dose (150 mg/day to 300 mg/day)
1.1 Mental state: average endpoint scores (BPRS‐A, high = poor) – medium term
Simpson 1999 found no significant difference in endpoint mental state scores at 16 weeks measured using the BPRS‐A (n = 31, MD 3.55, 95% CI −4.50 to 11.60; Analysis 1.1).
1.2 Adverse effects: 1a. weight ‐ BMI (kg/m²) – short term
Liu 2005 found no significant difference in BMI at the end of six weeks in the very low dose group compared to the low dose group (n = 59, MD −0.10, 95% CI −0.95 to 0.75; Analysis 1.2).
1.3 Adverse effects: 1b. weight gain (kg; average)
Simpson 1999 (reported in de Leon 2007) found no significant difference between the groups in weight gain at week 12 (n = 27, 1 RCT, MD −1.10, 95% CI −3.93 to 1.73; Analysis 1.3). There was similarly no significant difference between the groups in weight gain at 16 weeks (n = 28, 1 RCT, MD −1.30, 95% CI −4.86 to 2.26; Analysis 1.3).
1.4 Adverse effects: 1c. weight – body weight at endpoint (kg; average) – short term
Liu 2005 found no significant difference in body weight between the groups at the end of six weeks (n = 59, 1 RCT, MD 0.00, 95% CI −3.92 to 3.92; Analysis 1.4).
One study, Liu 2005, reported on two other adverse effects.
1.5 Adverse effects: 2a. metabolic – blood glucose – before and after meal
No difference between the groups were found before a meal (n = 59, 1 RCT, MD −0.40, 95% CI −1.06 to 0.26), one hour after meal (n = 59, 1 RCT, MD −0.70, 95% CI −2.01 to 0.61), two hours after meal (n = 59, 1 RCT, MD 0.30, 95% CI −0.98 to 1.58) and three hours after meal (n = 59, 1 RCT, MD −0.70, 95% CI −1.59 to 0.19). There was no significant difference in the overall analysis (n = 59, 1 RCT, MD −0.43, 95% CI −0.89 to 0.03; Analysis 1.5).
1.6 Adverse effects: 2b. metabolic ‐ lipid profile ‐ short term
Participants on low‐dose clozapine had significantly lower serum triglycerides than those on a very low dose (n = 59, 1 RCT, MD 1.00, 95% CI 0.51 to 1.49). Otherwise there was no significant difference between the groups in terms of serum total cholesterol (n = 59, 1 RCT, MD 0.50, 95% CI −0.12 to 1.12), high density lipoprotein (HDL) (n = 59, 1 RCT, MD 0.04, 95% CI −0.14 to 0.22), low density lipoprotein (LDL) (n = 59, 1 RCT, MD 0.10, 95% CI −0.36 to 0.56), Apo‐A1 (n = 59, 1 RCT, MD 0.05, 95% CI −0.10 to 0.20) and Apo‐B (n = 59, 1 RCT, MD 0.13, 95% CI −0.16 to 0.42). All Analysis 1.6.
1.7 Leaving the study early
Simpson 1999 found no significant difference in numbers leaving the study early between the groups in the medium term for any reason (n = 31, 1 RCT, RR 6.00, 95% CI 0.31 to 115.56; Analysis 1.7). Liu 2005 reported no significant difference between the groups in the short term due to specific side effects (n = 60, 1 RCT, RR 0.33, 95% CI 0.01 to 7.87; Analysis 1.7). The overall analysis showed no significant difference in the numbers leaving the study early between the very low dose and the low‐dose groups in the short and medium term (n = 91, 2 RCTs, RR 1.50, 95% CI 0.09 to 25.41; Analysis 1.7).
Missing outcomes
For this comparison, no studies reported on global state, death, behaviour, functioning, quality of life, satisfaction with treatment, service use and economic costs.
Comparison 2: clozapine: very low dose (up to 149 mg/day) versus standard dose (301 mg/day to 600 mg/day)
2.1 Mental state: average endpoint scores (BPRS‐A, high = poor) – medium term
Simpson 1999 found no significant difference in mean endpoint BPRS‐A scores at 16 weeks (n = 31, 1 RCT, MD 6.67, 95% CI −2.09 to 15.43; Analysis 2.1).
2.2 Adverse effects: 1a. weight – BMI (in kg/m²) – short term
Liu 2005 found no significant difference in body mass index (BMI) at the end of six weeks in the very low dose group compared to the standard‐dose group (n = 58, 1 RCT, MD 0.10, 95% CI −0.76 to 0.96; Analysis 2.2).
2.3 Adverse effects: 1b. weight – weight gain (kg; average)
Simpson 1999 (reported by de Leon 2007) found significantly lower weight gain in the very low dose group at 12 weeks (n = 27, 1 RCT, MD −2.70, 95% CI −5.38 to −0.02), although no significant difference between the groups at 16 weeks (n = 28, 1 RCT, MD −3.10, 95% CI −6.73 to 0.53; Analysis 2.3).
2.4 Adverse effects: 1c. body weight at endpoint – short term (kg; average)
Liu 2005 found no significant difference in body weight between the groups at six weeks (n = 58, 1 RCT, MD 1.00, 95% CI −2.66 to 4.66; Analysis 2.4).
2.5 Adverse effects: 2a. metabolic – blood glucose – short term
Liu 2005 found that glucose level one hour after a meal was significantly less in the very low dose group (n = 58, 1 RCT, MD −1.60, 95% CI −2.90 to −0.30). There was no significant difference between the groups before meal (n = 58, 1 RCT, MD −0.10, 95% CI −0.68 to 0.48), two hours after meal (n = 58, 1 RCT, MD −0.60, 95% CI −1.89 to 0.69) or three hours after meal (n = 58, 1 RCT, MD −0.30, 95% CI −1.55 to 0.95). There was no significant difference in the overall analysis between the groups (n = 58, 1 RCT, MD −0.49, 95% CI −1.12 to 0.13). All Analysis 2.5.
2.6 Adverse effects: 2b. lipid profile – short term
Liu 2005 found that standard dose was associated with significantly lower serum levels of total cholesterol (n = 58, 1 RCT, MD 1.00, 95% CI 0.20 to 1.80), triglycerides (n = 58, 1 RCT, MD 1.30, 95% CI 0.81 to 1.79) and Apo‐B (n = 58, 1 RCT, MD 0.23, 95% CI 0.01 to 0.45). No significant difference was found between the groups in high density lipoprotein (HDL) (n = 58, 1 RCT, MD 0.10, 95% CI −0.13 to 0.33), low density lipoprotein (LDL) (n = 58, 1 RCT, MD 0.00, 95% CI −0.39 to 0.39) or Apo‐A1 levels (n = 58, 1 RCT, MD 0.04, 95% CI −0.10 to 0.18). All Analysis 2.6.
2.7 Leaving the study early
Simpson 1999 found no significant difference in numbers leaving the study early for any reason between the groups in the medium term (n = 31, 1 RCT, RR 1.21, 95% CI 0.20 to 7.55). Liu 2005 reported no significant difference between the groups in numbers leaving the study early due to specific physical side effects in the short term (n = 60, 1 RCT, RR 0.20, 95% CI 0.01 to 4.00). The overall analysis showed no significant difference between the groups (n = 91, 2 RCTs, RR 0.73, 95% CI 0.14 to 3.72; Analysis 2.7).
Missing outcomes
For this comparison, no studies reported on global state, death, behaviour, functioning, quality of life, satisfaction with treatment, service use and economic costs.
Comparison 3: clopazine: low dose (150 mg/day to 300 mg/day) versus standard dose (301 mg/day to 600 mg/day)
3.1 Mental state: 1a. clinically important response (BPRS score > 30% change)
Chen 1998 found no significant difference in curative rate between the groups (n = 176, 1 RCT, RR 0.93, 95% CI 0.78 to 1.10; Analysis 3.1).
3.2 Mental state: 1b. average endpoint score (BPRS‐A total, high = poor)
Chen 1998 reported no significant difference between the groups for total scores at week 6 (n = 176, 1 RCT, MD 1.70, 95% CI −1.26 to 4.66; Analysis 3.2). Simpson 1999 reported no significant difference between the groups for total scores at 16 weeks (n = 34, 1 RCT, MD 3.12, 95% CI −4.20 to 10.44; Analysis 3.2).
3.3 Mental state: 1c. average endpoint score (BPRS‐A, subscores, high = poor)
3.3.1 Anxiety
Chen 1998 found no significant difference between the groups at week 6 (n = 176, 1 RCT, MD 0.00, 95% CI −0.09 to 0.09; Analysis 3.3).
3.3.2 Blunted Affect
Chen 1998 found no significant difference between the groups at week 6 (n = 176, 1 RCT, MD 0.00, 95% CI −0.18 to 0.18; Analysis 3.3).
3.3.3 Conceptual Disorganisation
Chen 1998 found no significant difference between the groups at week 6 (n = 176, 1 RCT, MD 0.20, 95% CI −0.02 to 0.42, Analysis 3.2.5).
3.3.4 Excitement
Chen 1998 found no significant difference between the groups at week 6 (n = 176, 1 RCT, MD 0.00, 95% CI −0.10 to 0.10; Analysis 3.3).
3.3.5 Uncooperativeness
Chen 1998 found no significant difference between the groups at week 6 (n = 176, 1 RCT, MD 0.00, 95% CI −0.21 to 0.21; Analysis 3.3).
3.4 Mental state: 1d. clinical improvement (clinician assessed)
There was no significant difference between groups at 12 weeks (Chen 1998; Chen 2013) (n = 141, 2 RCTs, RR 0.76, 95% CI 0.36 to 1.61; Analysis 3.4).
3.5 Adverse effects: 1a. weight – BMI (in kg/m²) – short term
Liu 2005 found no significant difference in body mass index at the end of six weeks in the low dose group compared to the standard dose group (n = 57, 1 RCT, MD 0.20, 95% CI −0.84 to 1.24; Analysis 3.5)
3.6 Adverse effects: 1b. weight – weight gain (kg; average)
Simpson 1999 (reported in de Leon 2007) found no significant difference in weight gain between the groups at week 12 (n = 30, 1 RCT, MD −1.60, 95% CI −4.47 to 1.27) or week 16 (n = 30, MD −1.80, 95% CI −5.38 to 1.78; Analysis 3.6).
3.7 Adverse effects: 1c. body weight at endpoint (kg; average) – short term
Liu 2005 found no significant difference in body weight between the groups in the short term (n = 57, 1 RCT, MD 1.00, 95% CI −3.42 to 5.42; Analysis 3.5.4).
3.8 Adverse effects: 2a. metabolic – blood glucose – short term
Liu 2005 found no significant difference in glucose levels between the groups before meal (n = 57, 1 RCT, MD 0.30, 95% CI −0.23 to 0.83; Analysis 3.8), one hour after meal (n = 57, 1 RCT, MD −0.90, 95% CI −2.33 to 0.53; Analysis 3.8), two hours after meal (n = 57, 1 RCT, MD −0.90, 95% CI −2.14 to 0.34; Analysis 3.8), three hours after meal (n = 57, 1 RCT, MD 0.40, 95% CI −0.84 to 1.64; Analysis 3.8). There was no difference between the groups in the overall analysis (1 RCT, MD −0.12, 95% CI −0.79 to 0.56; Analysis 3.8).
3.9 Adverse effects: 2b. metabolic – lipid profile – short term
Liu 2005 found no significant difference between the groups in serum total cholesterol (n = 57, 1 RCT, MD 0.50, 95% CI −0.29 to 1.29; Analysis 3.9), triglycerides (n = 57, 1 RCT, MD 0.30, 95% CI −0.12 to 0.72; Analysis 3.9), high density lipoprotein (HDL) (n = 57, 1 RCT, MD 0.06, 95% CI −0.16 to 0.28; Analysis 3.9), low density lipoprotein (LDL) (n = 57, 1 RCT, MD −0.10, 95% CI −0.50 to 0.30; Analysis 3.9), Apo A‐1 (n = 57, 1 RCT, MD −0.01, 95% C −0.14 to 0.12; Analysis 3.9) and Apo‐B levels (n = 57, 1 RCT, MD 0.10, 95% CI −0.14 to 0.34; Analysis 3.9).
3.10 Adverse effects: 3. various effects – short term
Chen 1998 found a significantly greater incidence in the standard compared to the low dose group for lethargy (n = 176, RR 0.77, 95% CI 0.60 to 0.97; Analysis 3.10), hypersalivation (n = 176, RR 0.70, 95% CI 0.57 to 0.84; Analysis 3.10), dizziness (n = 176, RR 0.56, 95% CI 0.39 to 0.81; Analysis 3.10) and tachycardia (n = 176, RR 0.57, 95% CI 0.45 to 0.71; Analysis 3.10).
3.11 Adverse effects: 4. average endpoint score (TESS, high = poor) – short term
Meta‐analysis of two studies, Chen 1998 and Chen 2013, found total TESS scores were significantly lower in the low‐dose group compared to standard dose (n = 124, 2 RCTs, MD −3.99, 95% CI −5.75 to −2.24; Analysis 3.11). Chen 1998 found that TESS scores were significantly lower in the low‐dose group compared to standard dose on sub scores for behavioural toxicity (n = 176, 1 RCT, MD −1.00, 95% CI −1.51 to −0.49; Analysis 3.11), vegetative nervous system (n = 176, 1 RCT, MD −0.90, 95% CI −1.61 to −0.19; Analysis 3.11) and cardiovascular system (n = 176, 1 RCT, MD −0.60, 95% CI −0.98 to −0.22; Analysis 3.11).
3.12 Leaving the study early
For this comparison, no participant left the study early in Chen 1998. Simpson 1999 found no significant difference in numbers leaving the study early for any reason between the groups in the medium term (n = 34, 1 RCT, RR 0.20, 95% CI 0.01 to 3.88; Analysis 3.12). Liu 2005 found no significant difference in numbers leaving the study early between the groups in the short term due to specific side effects (n = 60, 1 RCT, RR 0.50, 95% CI 0.05 to 5.22; Analysis 3.12). There was no difference between the groups in the overall analysis (n = 47, 2 RCTs, RR 0.35, 95% CI 0.06 to 2.21; Analysis 3.12).
Missing outcomes
For this comparison, no studies reported on global state, death, behaviour, functioning, quality of life, satisfaction with treatment, service use and economic costs.
Discussion
Summary of main results
We included five studies with data from 452 participants suffering from schizophrenia and schizoaffective disorders diagnosed by any criteria. We categorised doses of clozapine into five categories: very low dose clozapine: up to 149 mg/day; low‐dose clozapine: 150 mg/day to 300 mg/day; standard‐dose clozapine: 301 mg/day to 600 mg/day; high‐dose clozapine: 601 mg/day to 900 mg/day; and very high dose clozapine: 901 mg/day and above. Simpson 1999 compared the effects of clozapine at doses of 100 mg/day (very low), 300 mg/day (low dose) and 600 mg/day (standard dose) over both short term (up to 12 weeks) and medium term (16 weeks). Chen 2013 compared doses of 200 mg/day to 300 mg/day, 301 mg/day to 400 mg/day, and 401 mg/day to 500 mg/day over 12 weeks. Sheng 1990 compared doses of 300 mg/day and 600 mg/day over 12 weeks. Liu 2005 compared effects of three different doses of clozapine: less than 150 mg/day (very low dose); 150 mg/day to 300 mg/day (low dose); and more than 300 mg/day (standard) over short term.
Liu 2005 reported over six weeks on outcomes including leaving the study early, body weight, body mass index (BMI), lipid profile and blood glucose levels measured before meals, and one hour, two hours and three hours after meals. Chen 2013 reported on mental state as clinical improvement (clinician assessed), and on TESS scale scores. Outcomes reported by Sheng 1990 were mental state as clinical improvement (clinician assessed), but the authors did not report BPRS scores or TESS scale scores.
Chen 1998 compared clozapine at doses of 200 mg/day (low dose) and 500 mg/day (standard dose) in short‐term and reported data over six weeks on outcomes including global state on clinically important response as defined by individual studies (curative rate: BPRS score < 30% change = no improvement), mental state on the Brief Psychiatric Rating scale‐Anchored (BPRS‐A) and subscores of this scale, and adverse reaction using the TESS scale and the incidence of lethargy, hypersalivation, dizziness, and tachycardia.
Simpson 1999 reported on leaving the study early, BPRS‐A total scores. Though their report stated that they measured CGI and SANS, these data were not reported in the paper. Data on end body weight, weight gain and BMI over shorter term and medium term were reported in de Leon 2007. Data on BMI could not be used as it was not presented according to doses. We also could not use data on “clinically important response as defined by individual studies” as the details of responders were presented only at 48 weeks and not at 16 weeks (before cross‐over). In addition, it is reported that four people responded at end of 16 weeks, but it is unclear which dosage group these four patients belonged to. Simpson 1999 stated that data on CGI would be discussed in Abraham 1997, but we found this was not the case. We contacted the author for data on CGI, SANS, data on responders at 16 weeks and the details on which arm the four responders belonged to but we have not received the data at the time of writing.
There were no studies comparing high dose or very high dose of clozapine and none of the reports identified presented outcomes in the longer term.
1 Comparison: clozapine: very low dose (up to 149 mg/day) versus low dose (150 mg/day to 300 mg/day)
Short term
We found no evidence relating to clinical response. In terms of adverse effects, in one RCT of 59 participants there was no difference between the groups in BMI at endpoint with the very low dose group only 0.1 lower (0.95 lower to 0.75 higher) (Liu 2005). On other outcomes, the same study found low‐dose clozapine associated with lower serum triglycerides compared to very low dose, but no differences between the groups in other elements of the lipid profile, in blood glucose levels, in body weight at endpoint or in leaving the study early.
Medium term
We found no evidence relating to clinical response. In one small RCT of 31 participants (Simpson 1999), there was no difference between the groups in average BPRS‐A scores and no difference on change in mental state score. On other outcomes, no difference was found between the groups in terms of weight gain or number leaving the study early (Simpson 1999).
2 Comparison: clozapine: very low (up to 149 mg/day) versus standard dose (301 mg/day to 600 mg/day)
Short term
We found no evidence relating to clinical response in the short term. In terms of adverse effects, in one RCT of 58 participants there was no difference between the groups in BMI at endpoint with the very low dose group only 0.1 higher (0.76 lower to 0.96 higher) (Liu 2005). There was no difference in body weight at endpoint in the same study, although the very low dose group had less weight gain than the standard‐dose group at six and 12 weeks. On other outcomes, we found evidence in one study that the very low dose group had lower glucose levels one hour post meal compared to the standard‐dose group, but otherwise there was no difference between the groups in blood glucose measurements (Liu 2005); and no difference between the groups in numbers leaving the study early. In the same study, at six weeks standard dose was associated with lower serum triglycerides, serum total cholesterol and Apo‐B, but otherwise there was no difference between the groups in terms of lipid profile (Liu 2005). These results should be interpreted with caution as this trial was conducted only for six weeks with a small number of participants.
Medium term
We found no evidence relating to clinical response in the medium term. On other outcomes, no differences between the groups were found in the medium term for weight gain or numbers leaving the study early (Simpson 1999).
3. Comparison: clozapine: low dose (150 mg/day to 300 mg/day) versus standard dose (301 mg/day to 600 mg/day)
Short term
We found no evidence relating to clinical response or to clinically significant response in global state in the short term. In one RCT of 57 participants there was no difference between the groups in BMI at endpoint with the low‐dose group only 0.2 higher (0.84 lower to 1.24 higher) (Liu 2005). On other outcomes, there was no difference between the groups on body weight at endpoint, lipid profile or blood glucose measurements. Side effects measured by TESS were less in the low‐dose group in two studies (Chen 1998; Chen 2013), and the incidence of lethargy, hypersalivation, dizziness and tachycardia were also less in the low‐dose group in one study (Chen 1998).
Medium term
We found no evidence from one RCT of 34 participants that mental state at endpoint, numbers leaving the study early or weight gain differed between the groups (Simpson 1999).
4. Missing outcomes
There was no information available on other important outcomes such as clinically significant response in social or life skills, relapse, prolactin increase, service use, satisfaction with care or quality of life.
5. Summary
We identified just three randomised controlled trials that met our inclusion criteria. We looked at a range of different doses including very low (up to 149 mg/day), low (150 mg/day to 300 mg/day), standard (301 mg/day to 600 mg/day), high (601 mg/day to 900 mg/day) and very high (901 mg/day and above). All trials identified compared very low dose, low dose and standard dose only. No trials were identified comparing high dose or very high dose to standard dose. Two studies were only of six weeks' and two were of 12 weeks' duration; one study relates to a trial of 48 weeks, but only for a 16‐week period before crossing over. The data for a number of outcomes could not be extracted. Four of the five included studies were based on a small number of participants.
The quality of the evidence available was judged very low to low, and the following findings should be interpreted cautiously. We found no evidence relating to clinical response in the short or medium term. At the end of six weeks, incidence of lethargy, hypersalivation, dizziness and tachycardia was lower at low‐ compared to standard‐dose regimes; also side effects as measured by the Treatment Emergent Side Effect Scale (TESS) were less at low compared to standard dose. At six weeks, very low dose was associated with lower levels of blood glucose one hour post meal than standard dose and weight gain was the least in this group. At six weeks, standard dose was associated with lower serum triglycerides, serum total cholesterol and Apo‐B than very low dose, and low‐dose recipients had lower serum triglycerides than those on very low dose. This might suggest that the lipid variation may not be associated with doses of clozapine in the short term, such as six weeks' duration, but more trials are needed to validate the side effects of clozapine long term
Overall completeness and applicability of evidence
Completeness
We suggest that the studies identified are insufficient to clearly identify what dose of clozapine is optimal for people suffering from schizophrenia and schizophreniform psychosis to gain a desired response to illness, attain remission and experience an improved quality of life. Important information on outcomes relevant to clinicians, consumers and policy makers (such as relapse, remission, social functioning and quality of life, service utilisation, cost‐effectiveness, satisfaction with care, and quality of life) is not currently available.
Applicability
The five studies in our review reported on 14 outcomes and only on short‐term and medium‐term durations. We could not identify any studies which compared high and very high doses of clozapine or which considered outcomes long term. This can lead to difficulties in generalising our findings in the management of chronic illness such as schizophrenia. The evidence appears to be incomplete and there are various limitations in the applicability of the results from our review.
Quality of the evidence
The quality of the evidence was poor. Only one of the included studies was clearly described as a double blind trial; the other studies were not clear about blinding status. In addition, data were selectively reported in some papers, which raises the possibility of bias. The quality of the evidence was also limited by the small number of participants reported on by Simpson 1999 (n = 31), Chen 2013 (n = 90), Sheng 1990 (n = 51) and Liu 2005 (n = 59). It is also of concern that two trials were conducted only for six weeks. Schizophrenia is a chronic illness and medications such as clozapine would need to be prescribed for a longer period of time so that these results may not generalise in the longer term. More good‐quality trials are therefore needed to allow findings to be substantiated and firm conclusions to be drawn.
Potential biases in the review process
We are not aware of any flaws in our review process. The search for trials was thorough and the review authors followed the criteria prespecified in the protocol. It is always possible, however, that we could have failed to identify relevant studies.
Agreements and disagreements with other studies or reviews
To our knowledge there has been no other systematic review or meta‐analysis comparing different doses of clozapine.

Clozapine structure

Study flow diagram.

Risk of bias graph: review authors' judgements about each risk of bias item presented as percentages across all included studies.

Risk of bias summary: review authors' judgements about each risk of bias item for each included study.
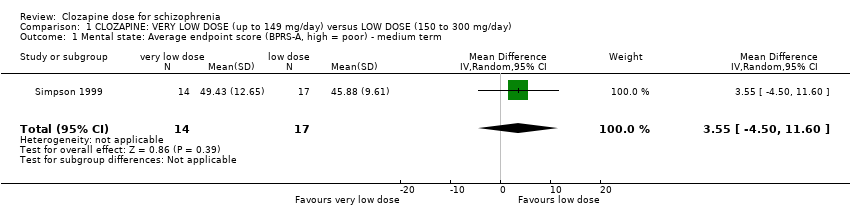
Comparison 1 CLOZAPINE: VERY LOW DOSE (up to 149 mg/day) versus LOW DOSE (150 to 300 mg/day), Outcome 1 Mental state: Average endpoint score (BPRS‐A, high = poor) ‐ medium term.

Comparison 1 CLOZAPINE: VERY LOW DOSE (up to 149 mg/day) versus LOW DOSE (150 to 300 mg/day), Outcome 2 Adverse effects: 1a. Weight ‐ BMI ‐ short term.

Comparison 1 CLOZAPINE: VERY LOW DOSE (up to 149 mg/day) versus LOW DOSE (150 to 300 mg/day), Outcome 3 Adverse effects: 1b. Weight ‐ weight gain.

Comparison 1 CLOZAPINE: VERY LOW DOSE (up to 149 mg/day) versus LOW DOSE (150 to 300 mg/day), Outcome 4 Adverse effects: 1c. Weight ‐ body weight at endpoint ‐ short term.
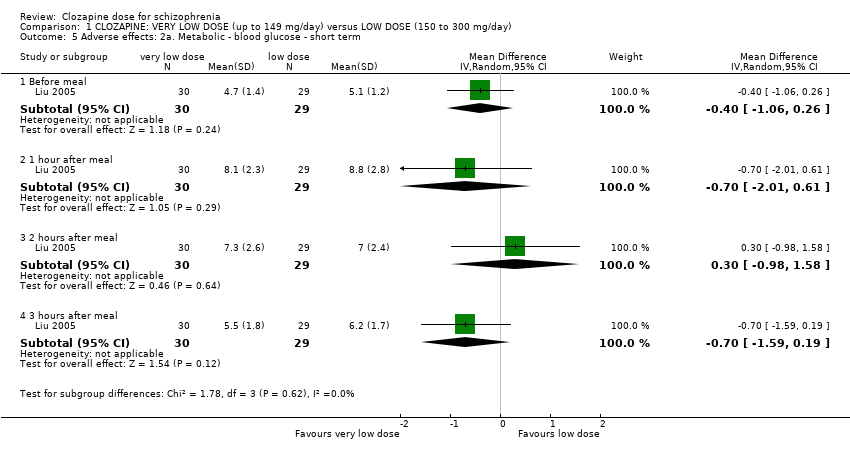
Comparison 1 CLOZAPINE: VERY LOW DOSE (up to 149 mg/day) versus LOW DOSE (150 to 300 mg/day), Outcome 5 Adverse effects: 2a. Metabolic ‐ blood glucose ‐ short term.

Comparison 1 CLOZAPINE: VERY LOW DOSE (up to 149 mg/day) versus LOW DOSE (150 to 300 mg/day), Outcome 6 Adverse effects: 2b. Metabolic ‐ lipid profile ‐ short term.
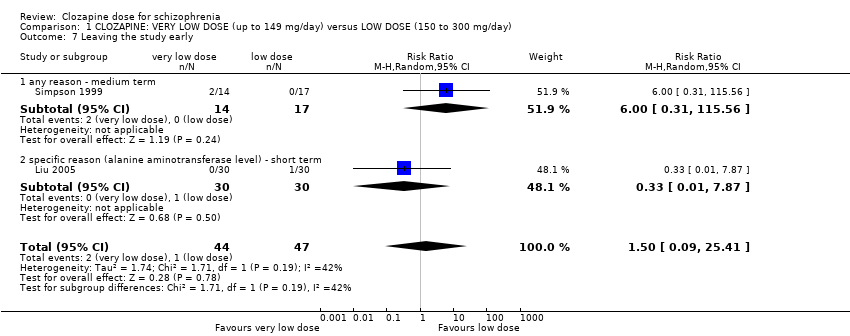
Comparison 1 CLOZAPINE: VERY LOW DOSE (up to 149 mg/day) versus LOW DOSE (150 to 300 mg/day), Outcome 7 Leaving the study early.
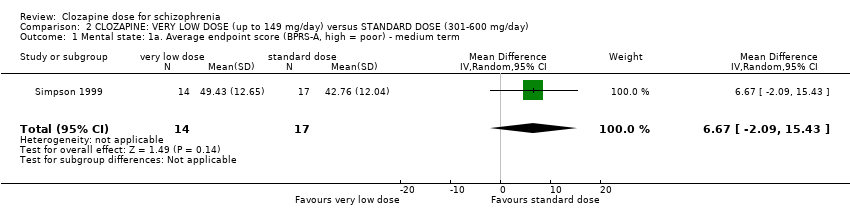
Comparison 2 CLOZAPINE: VERY LOW DOSE (up to 149 mg/day) versus STANDARD DOSE (301‐600 mg/day), Outcome 1 Mental state: 1a. Average endpoint score (BPRS‐A, high = poor) ‐ medium term.

Comparison 2 CLOZAPINE: VERY LOW DOSE (up to 149 mg/day) versus STANDARD DOSE (301‐600 mg/day), Outcome 2 Adverse effects: 1a. Weight ‐ BMI ‐ short term.

Comparison 2 CLOZAPINE: VERY LOW DOSE (up to 149 mg/day) versus STANDARD DOSE (301‐600 mg/day), Outcome 3 Adverse effects: 1b. Weight ‐ weight gain.
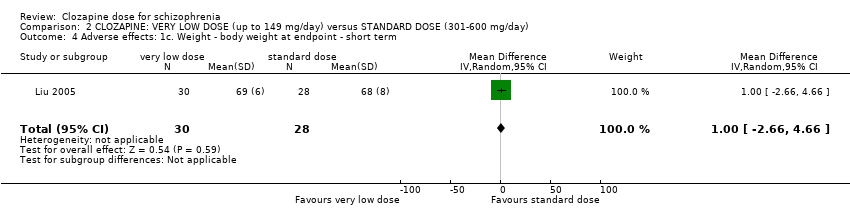
Comparison 2 CLOZAPINE: VERY LOW DOSE (up to 149 mg/day) versus STANDARD DOSE (301‐600 mg/day), Outcome 4 Adverse effects: 1c. Weight ‐ body weight at endpoint ‐ short term.

Comparison 2 CLOZAPINE: VERY LOW DOSE (up to 149 mg/day) versus STANDARD DOSE (301‐600 mg/day), Outcome 5 Adverse effects: 2a. Metabolic ‐ blood glucose ‐ short term.

Comparison 2 CLOZAPINE: VERY LOW DOSE (up to 149 mg/day) versus STANDARD DOSE (301‐600 mg/day), Outcome 6 Adverse effects: 2b. Metabolic ‐ lipid profile ‐ short term.

Comparison 2 CLOZAPINE: VERY LOW DOSE (up to 149 mg/day) versus STANDARD DOSE (301‐600 mg/day), Outcome 7 Leaving the study early.

Comparison 3 CLOZAPINE: LOW DOSE (150 to 300 mg/day) versus STANDARD DOSE (301 to 600 mg/day), Outcome 1 Mental state: 1a. Clinically important response as (BPRS score > 30% change).

Comparison 3 CLOZAPINE: LOW DOSE (150 to 300 mg/day) versus STANDARD DOSE (301 to 600 mg/day), Outcome 2 Mental state: 1b. Average endpoint score (BPRS‐A total, high = poor).

Comparison 3 CLOZAPINE: LOW DOSE (150 to 300 mg/day) versus STANDARD DOSE (301 to 600 mg/day), Outcome 3 Mental state: 1c. Average endpoint score (BPRS‐A subscores, high = poor) ‐ short term.
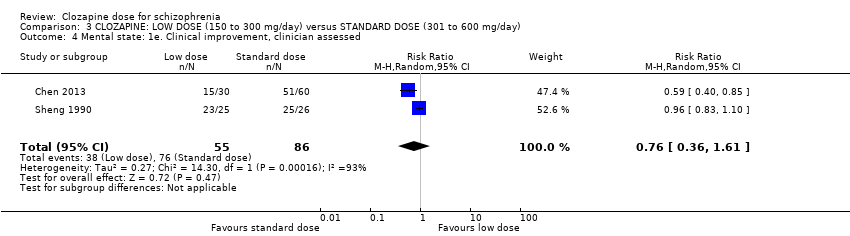
Comparison 3 CLOZAPINE: LOW DOSE (150 to 300 mg/day) versus STANDARD DOSE (301 to 600 mg/day), Outcome 4 Mental state: 1e. Clinical improvement, clinician assessed.

Comparison 3 CLOZAPINE: LOW DOSE (150 to 300 mg/day) versus STANDARD DOSE (301 to 600 mg/day), Outcome 5 Adverse effects: 1a. Weight ‐ BMI ‐ short term.
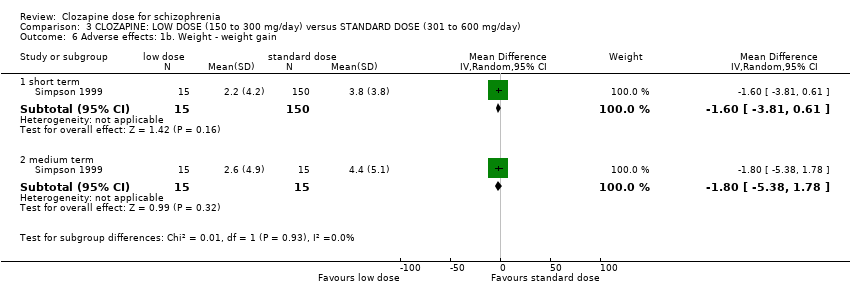
Comparison 3 CLOZAPINE: LOW DOSE (150 to 300 mg/day) versus STANDARD DOSE (301 to 600 mg/day), Outcome 6 Adverse effects: 1b. Weight ‐ weight gain.

Comparison 3 CLOZAPINE: LOW DOSE (150 to 300 mg/day) versus STANDARD DOSE (301 to 600 mg/day), Outcome 7 Adverse effects: 1c. Weight ‐ body weight at endpoint ‐ short term.

Comparison 3 CLOZAPINE: LOW DOSE (150 to 300 mg/day) versus STANDARD DOSE (301 to 600 mg/day), Outcome 8 Adverse effects: 2a. Metabolic ‐ blood glucose ‐ short term.
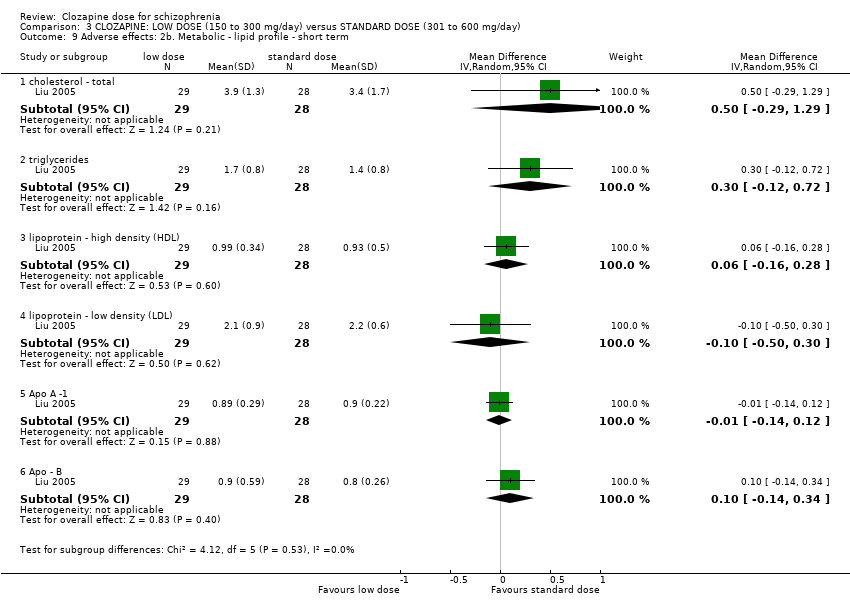
Comparison 3 CLOZAPINE: LOW DOSE (150 to 300 mg/day) versus STANDARD DOSE (301 to 600 mg/day), Outcome 9 Adverse effects: 2b. Metabolic ‐ lipid profile ‐ short term.
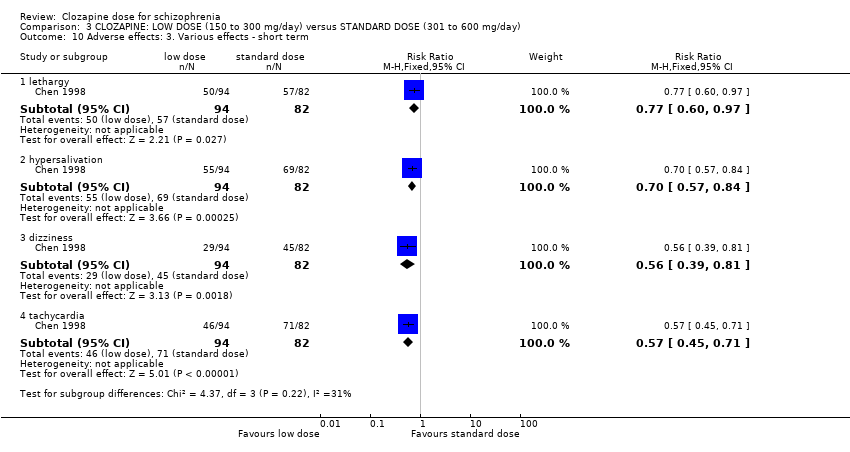
Comparison 3 CLOZAPINE: LOW DOSE (150 to 300 mg/day) versus STANDARD DOSE (301 to 600 mg/day), Outcome 10 Adverse effects: 3. Various effects ‐ short term.
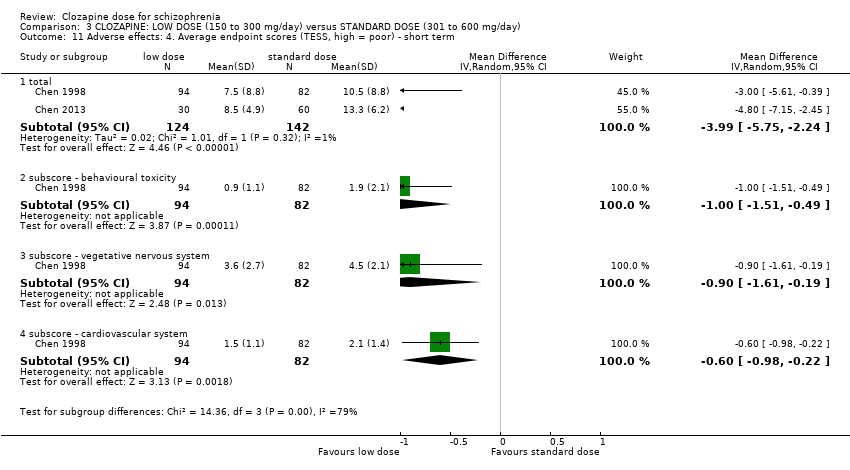
Comparison 3 CLOZAPINE: LOW DOSE (150 to 300 mg/day) versus STANDARD DOSE (301 to 600 mg/day), Outcome 11 Adverse effects: 4. Average endpoint scores (TESS, high = poor) ‐ short term.
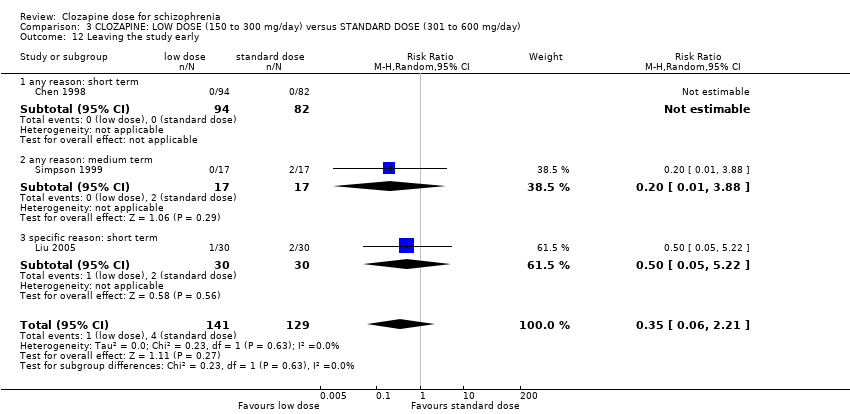
Comparison 3 CLOZAPINE: LOW DOSE (150 to 300 mg/day) versus STANDARD DOSE (301 to 600 mg/day), Outcome 12 Leaving the study early.
| CLOZAPINE: VERY LOW DOSE (up to 149 mg/day) versus LOW DOSE (150‐300 mg/day) for schizophrenia | ||||||
| Patient or population: patients with schizophrenia | ||||||
| Outcomes | Illustrative comparative risks* (95% CI) | Relative effect | No of Participants | Quality of the evidence | Comments | |
| Assumed risk | Corresponding risk | |||||
| Control | Clozapine: very low dose (up to 149 mg/day) versus low dose (150 mg/day to 300 mg/day) | |||||
| Global state: clinically important response, as defined by individual studies | See comment | See comment | Not estimable | 0 | See comment | No study reported this outcome. |
| Mental state: clinically important response, as defined by individual studies * Follow‐up: 16 weeks | The mean clinical response: mental state ‐ average scores ‐ medium term endpoint (BPRS‐A, high = worse) in the intervention group was | 31 | ⊕⊝⊝⊝ | * Pre‐defined outcome not reported: Mental state measured as average endpoint scores (BPRS‐A, high = worse). | ||
| Functioning: clinically important change in general functioning, as defined by individual studies | See comment | See comment | Not estimable | 0 | See comment | No study reported this outcome. |
| Adverse effect: clinically important adverse effect (weight ‐ BMI) | The mean adverse effect ‐ any clinically important specific adverse effects ‐ BMI in the intervention group was | 59 | ⊕⊕⊝⊝ | |||
| Service use: number of days hospitalised | See comment | See comment | Not estimable | 0 | See comment | No study reported this outcome. |
| Service use: time to hospitalisation | See comment | See comment | Not estimable | 0 | See comment | No study reported this outcome. |
| Quality of life: clinically important change in general quality of life | See comment | See comment | Not estimable | 0 | See comment | No study reported this outcome. |
| *The basis for the assumed risk (e.g. the median control group risk across studies) is provided in footnotes. The corresponding risk (and its 95% CI) is based on the assumed risk in the comparison group and the relative effect of the intervention (and its 95% CI). | ||||||
| GRADE Working Group grades of evidence | ||||||
| 1 Risk of bias: rated as 'serious' (downgraded by 1) due to attrition bias, reporting bias, and sponsorship by Novartis Pharmaceuticals. | ||||||
| CLOZAPINE: VERY LOW DOSE (up to 149 mg/day) versus STANDARD DOSE (301‐600 mg/day) for schizophrenia | ||||||
| Patient or population: patients with schizophrenia | ||||||
| Outcomes | Illustrative comparative risks* (95% CI) | Relative effect | No of Participants | Quality of the evidence | Comments | |
| Assumed risk | Corresponding risk | |||||
| Control | Clozapine: very low dose (up to 149 mg/day) versus standard dose (301 mg/day to 600 mg/day) | |||||
| Global state: clinically important response, as defined by individual studies | See comment | See comment | Not estimable | 0 | See comment | No study reported this outcome. |
| Mental state: clinically important response, as defined by individual studies * Follow‐up: 16 weeks | The mean clinical response: mental state ‐ average scores ‐ medium term endpoint (BPRS‐A, high = worse) in the intervention group was | 31 | ⊕⊝⊝⊝ | * Pre‐defined outcome not reported: Mental state measured as average endpoint scores (BPRS‐A, high = worse). | ||
| Functioning: clinically important change in general functioning, as defined by individual studies | See comment | See comment | Not estimable | 0 | See comment | No study reported this outcome. |
| Adverse effect: clinically important adverse effect (weight ‐ BMI) | The mean adverse effect ‐ any clinically important specific adverse effects ‐ BMI in the intervention group was | 58 | ⊕⊕⊝⊝ | |||
| Service use: number of days hospitalised | See comment | See comment | Not estimable | 0 | See comment | No study reported this outcome. |
| Service use: time to hospitalisation | See comment | See comment | Not estimable | 0 | See comment | No study reported this outcome. |
| Quality of life: clinically important change in general quality of life | See comment | See comment | Not estimable | 0 | See comment | No study reported this outcome. |
| *The basis for the assumed risk (e.g. the median control group risk across studies) is provided in footnotes. The corresponding risk (and its 95% confidence interval) is based on the assumed risk in the comparison group and the relative effect of the intervention (and its 95% CI). | ||||||
| GRADE Working Group grades of evidence | ||||||
| 1 Risk of bias: rated as 'serious' (downgraded by 1) due to attrition bias, reporting bias, and sponsorship by Novartis Pharmaceuticals. | ||||||
| Clozapine: low dose (150 mg/day to 300 mg/day) versus standard dose (301 mg/day to 600 mg/day) for schizophrenia | ||||||
| Patient or population: patients with schizophrenia | ||||||
| Outcomes | Illustrative comparative risks* (95% CI) | Relative effect | No of Participants | Quality of the evidence | Comments | |
| Assumed risk | Corresponding risk | |||||
| Control | Clozapine: low dose (150 mg/day to 300 mg/day) versus standard dose (301 mg/day to 600 mg/day) | |||||
| Global state: clinically important response, as defined by individual studies | See comment | See comment | Not estimable | 0 | See comment | No study reported this outcome. |
| Mental state: clinically important response in mental state | Low1 | RR 0.93 | 176 | ⊕⊕⊝⊝ | ||
| 200 per 1000 | 186 per 1000 | |||||
| Moderate1 | ||||||
| 500 per 1000 | 465 per 1000 | |||||
| High1 | ||||||
| 800 per 1000 | 744 per 1000 | |||||
| Functioning: clinically important change in general functioning, as defined by individual studies | See comment | See comment | Not estimable | 0 | See comment | No study reported this outcome. |
| Adverse effect: clinically important adverse effect ( weight ‐ BMI) | The mean adverse effect ‐ any clinically important specific adverse effects ‐ BMI in the intervention group was | 57 | ⊕⊕⊝⊝ | |||
| Service use: number of days hospitalised | See comment | See comment | Not estimable | 0 | See comment | No study reported this outcome. |
| Service use: time to hospitalisation | See comment | See comment | Not estimable | 0 | See comment | No study reported this outcome. |
| Quality of life: clinically important change in general quality of life | See comment | See comment | Not estimable | 0 | See comment | No study reported this outcome. |
| *The basis for the assumed risk (e.g. the median control group risk across studies) is provided in footnotes. The corresponding risk (and its 95% confidence interval) is based on the assumed risk in the comparison group and the relative effect of the intervention (and its 95% CI). | ||||||
| GRADE Working Group grades of evidence | ||||||
| 1 Risk of bias rated as 'serious' (downgraded by 1) as allocation concealment, blinding status and trial sponsorship unclear 3 Imprecision: rated as 'serious' (downgraded by 1) as only one study providing data, small number of participants (less than 200) | ||||||
| Title | Reference |
| Clozapine versus other atypical antipsychotics for schizophrenia | |
| Clozapine combined with different antipsychotic drugs for treatment resistant schizophrenia | |
| Clozapine versus typical neuroleptic medication for schizophrenia | |
| Pharmacological interventions for clozapine‐induced hypersalivation |
| Outcome or subgroup title | No. of studies | No. of participants | Statistical method | Effect size |
| 1 Mental state: Average endpoint score (BPRS‐A, high = poor) ‐ medium term Show forest plot | 1 | 31 | Mean Difference (IV, Random, 95% CI) | 3.55 [‐4.50, 11.60] |
| 2 Adverse effects: 1a. Weight ‐ BMI ‐ short term Show forest plot | 1 | 59 | Mean Difference (IV, Random, 95% CI) | ‐0.10 [‐0.95, 0.75] |
| 3 Adverse effects: 1b. Weight ‐ weight gain Show forest plot | 1 | Mean Difference (IV, Random, 95% CI) | Subtotals only | |
| 3.1 short term | 1 | 27 | Mean Difference (IV, Random, 95% CI) | ‐1.1 [‐3.93, 1.73] |
| 3.2 medium term | 1 | 28 | Mean Difference (IV, Random, 95% CI) | ‐1.3 [‐4.86, 2.26] |
| 4 Adverse effects: 1c. Weight ‐ body weight at endpoint ‐ short term Show forest plot | 1 | 59 | Mean Difference (IV, Random, 95% CI) | 0.0 [‐3.92, 3.92] |
| 5 Adverse effects: 2a. Metabolic ‐ blood glucose ‐ short term Show forest plot | 1 | Mean Difference (IV, Random, 95% CI) | Subtotals only | |
| 5.1 Before meal | 1 | 59 | Mean Difference (IV, Random, 95% CI) | ‐0.40 [‐1.06, 0.26] |
| 5.2 1 hour after meal | 1 | 59 | Mean Difference (IV, Random, 95% CI) | ‐0.70 [‐2.01, 0.61] |
| 5.3 2 hours after meal | 1 | 59 | Mean Difference (IV, Random, 95% CI) | 0.30 [‐0.98, 1.58] |
| 5.4 3 hours after meal | 1 | 59 | Mean Difference (IV, Random, 95% CI) | ‐0.70 [‐1.59, 0.19] |
| 6 Adverse effects: 2b. Metabolic ‐ lipid profile ‐ short term Show forest plot | 1 | Mean Difference (IV, Random, 95% CI) | Subtotals only | |
| 6.1 triglycerides | 1 | 59 | Mean Difference (IV, Random, 95% CI) | 1.00 [0.51, 1.49] |
| 6.2 cholesterol ‐ total | 1 | 59 | Mean Difference (IV, Random, 95% CI) | 0.50 [‐0.12, 1.12] |
| 6.3 lipoprotein ‐ high density (HDL) | 1 | 59 | Mean Difference (IV, Random, 95% CI) | 0.04 [‐0.14, 0.22] |
| 6.4 lipoprotein ‐ low density (LDL) | 1 | 59 | Mean Difference (IV, Random, 95% CI) | 0.10 [‐0.36, 0.56] |
| 6.5 Apo A‐1 | 1 | 59 | Mean Difference (IV, Random, 95% CI) | 0.05 [‐0.10, 0.20] |
| 6.6 Apo‐B | 1 | 59 | Mean Difference (IV, Random, 95% CI) | 0.13 [‐0.16, 0.42] |
| 7 Leaving the study early Show forest plot | 2 | 91 | Risk Ratio (M‐H, Random, 95% CI) | 1.50 [0.09, 25.41] |
| 7.1 any reason ‐ medium term | 1 | 31 | Risk Ratio (M‐H, Random, 95% CI) | 6.0 [0.31, 115.56] |
| 7.2 specific reason (alanine aminotransferase level) ‐ short term | 1 | 60 | Risk Ratio (M‐H, Random, 95% CI) | 0.33 [0.01, 7.87] |
| Outcome or subgroup title | No. of studies | No. of participants | Statistical method | Effect size |
| 1 Mental state: 1a. Average endpoint score (BPRS‐A, high = poor) ‐ medium term Show forest plot | 1 | 31 | Mean Difference (IV, Random, 95% CI) | 6.67 [‐2.09, 15.43] |
| 2 Adverse effects: 1a. Weight ‐ BMI ‐ short term Show forest plot | 1 | 58 | Mean Difference (IV, Random, 95% CI) | 0.10 [‐0.76, 0.96] |
| 3 Adverse effects: 1b. Weight ‐ weight gain Show forest plot | 1 | Mean Difference (IV, Random, 95% CI) | Subtotals only | |
| 3.1 short term | 1 | 27 | Mean Difference (IV, Random, 95% CI) | ‐2.70 [‐5.38, ‐0.02] |
| 3.2 medium term | 1 | 28 | Mean Difference (IV, Random, 95% CI) | ‐3.10 [‐6.73, 0.53] |
| 4 Adverse effects: 1c. Weight ‐ body weight at endpoint ‐ short term Show forest plot | 1 | 58 | Mean Difference (IV, Random, 95% CI) | 1.0 [‐2.66, 4.66] |
| 5 Adverse effects: 2a. Metabolic ‐ blood glucose ‐ short term Show forest plot | 1 | Mean Difference (IV, Random, 95% CI) | Subtotals only | |
| 5.1 one hour after meal | 1 | 58 | Mean Difference (IV, Random, 95% CI) | ‐1.60 [‐2.90, ‐0.30] |
| 5.2 before meal | 1 | 58 | Mean Difference (IV, Random, 95% CI) | ‐0.10 [‐0.68, 0.48] |
| 5.3 two hours after meal | 1 | 58 | Mean Difference (IV, Random, 95% CI) | ‐0.60 [‐1.89, 0.69] |
| 5.4 three hours after meal | 1 | 58 | Mean Difference (IV, Random, 95% CI) | ‐0.30 [‐1.55, 0.95] |
| 6 Adverse effects: 2b. Metabolic ‐ lipid profile ‐ short term Show forest plot | 1 | Mean Difference (IV, Random, 95% CI) | Subtotals only | |
| 6.1 cholesterol ‐ total | 1 | 58 | Mean Difference (IV, Random, 95% CI) | 1.00 [0.20, 1.80] |
| 6.2 triglycerides | 1 | 58 | Mean Difference (IV, Random, 95% CI) | 1.30 [0.81, 1.79] |
| 6.3 Apo ‐ B | 1 | 58 | Mean Difference (IV, Random, 95% CI) | 0.23 [0.01, 0.45] |
| 6.4 lipoprotein ‐ high density (HDL) | 1 | 58 | Mean Difference (IV, Random, 95% CI) | 0.10 [‐0.13, 0.33] |
| 6.5 lipoprotein ‐ low density (LDL) | 1 | 58 | Mean Difference (IV, Random, 95% CI) | 0.0 [‐0.39, 0.39] |
| 6.6 Apo A ‐1 | 1 | 58 | Mean Difference (IV, Random, 95% CI) | 0.04 [‐0.10, 0.18] |
| 7 Leaving the study early Show forest plot | 2 | 91 | Risk Ratio (M‐H, Random, 95% CI) | 0.73 [0.14, 3.72] |
| 7.1 any reason ‐ medium term | 1 | 31 | Risk Ratio (M‐H, Random, 95% CI) | 1.21 [0.20, 7.55] |
| 7.2 specific reason (neutropenia and tachycardia) ‐ short term | 1 | 60 | Risk Ratio (M‐H, Random, 95% CI) | 0.2 [0.01, 4.00] |
| Outcome or subgroup title | No. of studies | No. of participants | Statistical method | Effect size |
| 1 Mental state: 1a. Clinically important response as (BPRS score > 30% change) Show forest plot | 1 | 176 | Risk Ratio (M‐H, Fixed, 95% CI) | 0.93 [0.78, 1.10] |
| 2 Mental state: 1b. Average endpoint score (BPRS‐A total, high = poor) Show forest plot | 2 | Mean Difference (IV, Random, 95% CI) | Subtotals only | |
| 2.1 short term | 1 | 176 | Mean Difference (IV, Random, 95% CI) | 1.70 [‐1.26, 4.66] |
| 2.2 medium term | 1 | 34 | Mean Difference (IV, Random, 95% CI) | 3.12 [‐4.20, 10.44] |
| 3 Mental state: 1c. Average endpoint score (BPRS‐A subscores, high = poor) ‐ short term Show forest plot | 1 | Mean Difference (IV, Fixed, 95% CI) | Subtotals only | |
| 3.1 anxiety | 1 | 176 | Mean Difference (IV, Fixed, 95% CI) | 0.0 [‐0.09, 0.09] |
| 3.2 blunted affect | 1 | 176 | Mean Difference (IV, Fixed, 95% CI) | 0.0 [‐0.18, 0.18] |
| 3.3 conceptual disorganisation | 1 | 176 | Mean Difference (IV, Fixed, 95% CI) | 0.20 [‐0.02, 0.42] |
| 3.4 excitement | 1 | 176 | Mean Difference (IV, Fixed, 95% CI) | 0.0 [‐0.10, 0.10] |
| 3.5 uncooperativeness | 1 | 176 | Mean Difference (IV, Fixed, 95% CI) | 0.0 [‐0.21, 0.21] |
| 4 Mental state: 1e. Clinical improvement, clinician assessed Show forest plot | 2 | 141 | Risk Ratio (M‐H, Random, 95% CI) | 0.76 [0.36, 1.61] |
| 5 Adverse effects: 1a. Weight ‐ BMI ‐ short term Show forest plot | 1 | 57 | Mean Difference (IV, Random, 95% CI) | 0.20 [‐0.84, 1.24] |
| 6 Adverse effects: 1b. Weight ‐ weight gain Show forest plot | 1 | Mean Difference (IV, Random, 95% CI) | Subtotals only | |
| 6.1 short term | 1 | 165 | Mean Difference (IV, Random, 95% CI) | ‐1.60 [‐3.81, 0.61] |
| 6.2 medium term | 1 | 30 | Mean Difference (IV, Random, 95% CI) | ‐1.80 [‐5.38, 1.78] |
| 7 Adverse effects: 1c. Weight ‐ body weight at endpoint ‐ short term Show forest plot | 1 | 57 | Mean Difference (IV, Random, 95% CI) | 1.0 [‐3.42, 5.42] |
| 8 Adverse effects: 2a. Metabolic ‐ blood glucose ‐ short term Show forest plot | 1 | Mean Difference (IV, Random, 95% CI) | Subtotals only | |
| 8.1 before meal | 1 | 57 | Mean Difference (IV, Random, 95% CI) | 0.30 [‐0.23, 0.83] |
| 8.2 one hour after meal | 1 | 57 | Mean Difference (IV, Random, 95% CI) | ‐0.90 [‐2.33, 0.53] |
| 8.3 two hours after meal | 1 | 58 | Mean Difference (IV, Random, 95% CI) | ‐0.90 [‐2.14, 0.34] |
| 8.4 three hours after meal | 1 | 57 | Mean Difference (IV, Random, 95% CI) | 0.40 [‐0.84, 1.64] |
| 9 Adverse effects: 2b. Metabolic ‐ lipid profile ‐ short term Show forest plot | 1 | Mean Difference (IV, Random, 95% CI) | Subtotals only | |
| 9.1 cholesterol ‐ total | 1 | 57 | Mean Difference (IV, Random, 95% CI) | 0.5 [‐0.29, 1.29] |
| 9.2 triglycerides | 1 | 57 | Mean Difference (IV, Random, 95% CI) | 0.30 [‐0.12, 0.72] |
| 9.3 lipoprotein ‐ high density (HDL) | 1 | 57 | Mean Difference (IV, Random, 95% CI) | 0.06 [‐0.16, 0.28] |
| 9.4 lipoprotein ‐ low density (LDL) | 1 | 57 | Mean Difference (IV, Random, 95% CI) | ‐0.10 [‐0.50, 0.30] |
| 9.5 Apo A ‐1 | 1 | 57 | Mean Difference (IV, Random, 95% CI) | ‐0.01 [‐0.14, 0.12] |
| 9.6 Apo ‐ B | 1 | 57 | Mean Difference (IV, Random, 95% CI) | 0.10 [‐0.14, 0.34] |
| 10 Adverse effects: 3. Various effects ‐ short term Show forest plot | 1 | Risk Ratio (M‐H, Fixed, 95% CI) | Subtotals only | |
| 10.1 lethargy | 1 | 176 | Risk Ratio (M‐H, Fixed, 95% CI) | 0.77 [0.60, 0.97] |
| 10.2 hypersalivation | 1 | 176 | Risk Ratio (M‐H, Fixed, 95% CI) | 0.70 [0.57, 0.84] |
| 10.3 dizziness | 1 | 176 | Risk Ratio (M‐H, Fixed, 95% CI) | 0.56 [0.39, 0.81] |
| 10.4 tachycardia | 1 | 176 | Risk Ratio (M‐H, Fixed, 95% CI) | 0.57 [0.45, 0.71] |
| 11 Adverse effects: 4. Average endpoint scores (TESS, high = poor) ‐ short term Show forest plot | 2 | Mean Difference (IV, Random, 95% CI) | Subtotals only | |
| 11.1 total | 2 | 266 | Mean Difference (IV, Random, 95% CI) | ‐3.99 [‐5.75, ‐2.24] |
| 11.2 subscore ‐ behavioural toxicity | 1 | 176 | Mean Difference (IV, Random, 95% CI) | 1.00 [‐1.51, ‐0.49] |
| 11.3 subscore ‐ vegetative nervous system | 1 | 176 | Mean Difference (IV, Random, 95% CI) | ‐0.90 [‐1.61, ‐0.19] |
| 11.4 subscore ‐ cardiovascular system | 1 | 176 | Mean Difference (IV, Random, 95% CI) | ‐0.60 [‐0.98, ‐0.22] |
| 12 Leaving the study early Show forest plot | 3 | 270 | Risk Ratio (M‐H, Random, 95% CI) | 0.35 [0.06, 2.21] |
| 12.1 any reason: short term | 1 | 176 | Risk Ratio (M‐H, Random, 95% CI) | 0.0 [0.0, 0.0] |
| 12.2 any reason: medium term | 1 | 34 | Risk Ratio (M‐H, Random, 95% CI) | 0.20 [0.01, 3.88] |
| 12.3 specific reason: short term | 1 | 60 | Risk Ratio (M‐H, Random, 95% CI) | 0.5 [0.05, 5.22] |