Traitement de l’hypersalivation par des médicaments anticholinergiques, autres que la clozapine, chez les patients atteints de schizophrénie
Résumé scientifique
Contexte
Le traitement de la schizophrénie dépend fortement des médicaments neuroleptiques. L’hypersalivation est un effet secondaire courant lorsque les patients atteints de schizophrénie sont traités avec des médicaments neuroleptiques. L’hypersalivation peut être un problème stigmatisant et embarrassant et peut affecter la qualité de vie et entraîner un arrêt du traitement à base de neuroleptiques. Elle peut également être difficile à traiter.
Objectifs
Résumer les meilleures preuves disponibles concernant les effets des anticholinergiques dans le traitement de l’hypersalivation par des neuroleptiques, autres que la clozapine chez les patients atteints de schizophrénie. L'hypersalivation due à la clozapine a été examinée dans une autre revue Cochrane.
Stratégie de recherche documentaire
Nous avons effectué des recherches dans le registre des essais du groupe Cochrane sur la schizophrénie (15 novembre 2012) et examiné les références bibliographiques de toutes les études identifiées pour obtenir des études pertinentes. Nous avons contacté le premier auteur de chaque étude incluse pour obtenir des informations concernant des essais non publiés.
Critères de sélection
Tous les essais contrôlés randomisés comparant un médicament anticholinergique à un placebo, l'absence de traitement, un autre médicament anticholinergique ou toute autre intervention.
Recueil et analyse des données
Nous avons examiné les résultats de la recherche pour identifier les études pertinentes. Nous avons extrait des données au moyen de formulaires standards et simples. Les désaccords ont été résolus par discussion. Le risque de biais a été évalué à l'aide de l’instrument Cochrane évaluant le risque. Pour les résultats binaires, l’estimation standard du risque relatif (RR) et son intervalle de confiance (IC) à 95 % ont été calculé. Pour les résultats continus, nous avons estimé la différence moyenne entre les groupes.
Résultats principaux
Les recherches ont identifié quatre études potentielles ; après inspection, elles ont toutes été exclues. Trois études ont été exclues car elles portaient sur des patients atteints d'hypersalivation due à la clozapine ‐ un sujet évoqué dans une autre revue Cochrane. La quatrième étude a été exclue car elle portait sur des patients atteints de schizophrénie, de troubles de l'humeur ou d'autres troubles mentaux et qui souffraient d'hypersalivation due ou non à la clozapine et qui étaient traités avec la médecine chinoise utilisant des formules anticholinergiques inconnues. Les patients dans le groupe témoin recevaient un médicament anticholinergique (Trihexyphénidyle) ou un antihistaminique (prométhazine). Il n'a pas été possible de séparer les patients traités par la clozapine a ceux qui n’étaient pas traités par la clozapine dans le groupe d'intervention, ou de séparer les patients traités par Trihexyphénidyle de ceux traités par prométhazine dans le groupe témoin.
Conclusions des auteurs
Nous n'avons pas été en mesure d'identifier toutes les études sur la question soulevée dans cette revue. En conséquence, cette revue incomplète souligne un problème clinique important qui doit être examiné grâce à des essais randomisés bien conçus et bien conduits. Les cliniciens et les patients sont susceptibles de continuer de dépendre de l'avis clinique et de l'expérience personnelle. Les décideurs politiques n’ont aucune preuve fondée sur les essais pour guider les recommandations pour le traitement de l'hypersalivation induit par les neuroleptiques autres que la clozapine. Ils sont susceptibles de continuer de fonder leurs recommandations sur les opinions et les habitudes. Les financeurs des études pourraient souhaiter faire passer cet important sous‐groupe de personnes en priorité dans les recherches futures.
PICO
Résumé simplifié
Médicaments anticholinergiques pour traiter la salivation excessive causée par l'utilisation d'antipsychotiques autres que la clozapine
Les médicaments antipsychotiques sont généralement le traitement de première intention de la schizophrénie. Ces médicaments sont utiles dans le traitement des « symptômes positifs » de la schizophrénie, tels que le fait d'entendre des voix, voir des choses et croire en d’étranges croyances. Néanmoins, ces médicaments ont souvent de graves effets secondaires, tels que la prise de poids, la rigidité musculaire, la fatigue, l'apathie et le manque de dynanisme. Le fait de baver et de saliver (hypersalivation) est un autre effet secondaire courant, qui se produit souvent la nuit lorsque la personne est endormie. Ce peut être un problème stigmatisant et embarrassant qui peut affecter la qualité de vie et amener les personnes à arrêter leur traitement, ce qui peut entraîner des rechutes et un retour à l'hôpital. Le fait de baver et de saliver peut être difficile à traiter ; cependant, des médicaments anticholinergiques peuvent réduire la production de salive et le fait de baver et de saliver. Cette revue a évalué les preuves concernant les bénéfices ou les effets néfastes de médicaments anticholinergiques utilisés dans le traitement de l'hypersalivation due à des médicaments antipsychotiques ou neuroleptiques. La revue a exclu la clozapine, un antipsychotique, car son rôle dans l'apparition d'hypersalivation a fait l'objet d'une autre revue Cochrane.
La recherche a été effectuée le 15 novembre 2012 et a entraîné l'identification de quatre études potentielles, mais aucune n'a pu être incluse. Trois de ces études ont été exclues car elles portaient sur la clozapine liée à l'hypersalivation. La quatrième étude a été exclue car elle portait sur des patients atteints de troubles de l'humeur ou d'autres troubles mentaux et sur la médecine chinoise. Le fait de baver ou l’hypersalivation est un problème important qui doit être examiné dans des recherches et des essais randomisés bien conçus. Entre‐temps, les psychiatres et les patients sont susceptibles de poursuivre le traitement pour l'hypersalivation sur la base de jugement clinique et d’expériences quotidiennes personnelles plutôt que sur des preuves probantes. Le traitement de l'hypersalivation, causée par des antipsychotiques ou des neuroleptiques autres que la clozapine, ne semble pas avoir reçu une recherche adéquate pour aider à guider la pratique clinique. Les auteurs de la revue concluent que l'utilisation d'anticholinergiques pour traiter l'hypersalivation causée par les médicaments antipsychotiques autres que la clozapine ne peut être justifiée sans études supplémentaires.
Ce résumé en langage simplifié a été rédigé par Benjamin Gray, utilisateur et expert du service : L'association Rethink Mental Illness : par courrier électronique : [email protected]
Authors' conclusions
Background
Description of the condition
Schizophrenia is a serious, disabling, enduring and relapsing mental illness, the onset of which frequently occurs relatively early in life. It can cause a person to experience problems with the ability to think, feel and perceive things clearly (Carpenter 1994). The worldwide lifetime prevalence of the disorder is about 1% (Almeida‐Filho 1997).
Treatment of schizophrenia depends heavily on neuroleptic drugs, which usually are classified into first‐generation 'typical' and second‐generation 'atypical' drugs (Miyamoto 2005). Hypersalivation (or sialorrhoea or drooling) is a significant adverse effect of both typical and atypical neuroleptic drugs. It is most commonly seen in people with schizophrenia treated with clozapine, among whom it affects approximately 31% of patients, usually developing early in the course of treatment, and is more prominent at night (Safferman 1991). Clozapine has been confirmed as a potent cause of hypersalivation in a systematic overview of Cochrane reviews on anticholinergic effects of antipsychotic drugs (Ozbilen 2009). In the short term (up to 12 weeks), only zotepine was more potent than clozapine in inducing hypersalivation. However, the second‐generation 'atypical' drugs tend to cause this problem less frequently than the first‐generation 'typical' drugs, with the exception of perphenazine (Table 1).
| Compound | n | RCTs | % (95% CI) |
| Placebo | 403 | 10 | 7.7 (5 to 11) |
| Clozapine | 559 | 16 | 32.7 (29 to 37) |
| Zotepine | 53 | 1 | 41.5 (29 to 55) |
| Zuclopenthixol hydrochloride | 66 | 2 | 24.2 (16 to 36) |
| Haloperidol | 1115 | 12 | 18.4 (16 to 21) |
| Thioridazine | 66 | 2 | 15.2 (8 to 26) |
| Chlorpromazine | 499 | 12 | 14.2 (11 to 18) |
| Trifluoperazine | 44 | 6 | 13.6 (6 to 27) |
| Molindone | 42 | 2 | 9.5 (4 to 22) |
| Bromperidol depot | 27 | 1 | 3.7 (1 to 18) |
| Olanzapine | 1857 | 5 | 8.2 (7 to 10) |
| Fluphenazine hydrochloride | 110 | 2 | 8.2 (4 to 15) |
| Amisulpride | 115 | 1 | 7.8 (4 to 14) |
| Sulpiride | 154 | 6 | 7.1 (4 to 12) |
| Risperidone depot | 317 | 2 | 5.7 (4 to 9) |
| Perphenazine | 74 | 3 | 5.4 (2 to 13) |
| Risperidone | 325 | 3 | 3.7 (2 to 6) |
Description of the intervention
Hypersalivation seems paradoxical because antipsychotic drugs tend to cause a dry mouth as a result of anticholinergic adverse effects (Hori 2006). However, several studies suggest that different receptors located on the salivary glands, including adrenergic and muscarinic receptors, can alter salivary flow (Mandel 1975; Ukai 1989; Zorn 1994; Corrigan 1995). Muscarinic and adrenergic receptors have been targeted by pharmacological intervention of neuroleptic‐induced hypersalivation. This review will focus on muscarinic anticholinergic antagonists such as pirenzepine (Fritz 1995), benzhexol (trihexyphenidyl) (Spivak 1997), benztropine (Reinstein 1999), atropine (Antonello 1999), hyoscine hydrobromide and ipratropium bromide (Calderon 2000).
How the intervention might work
Anticholinergic medication for neuroleptic‐induced hypersalivation may work by blocking muscarinic receptors. The combination of an antimuscarinic agent (benztropine) and an adrenergic alpha1 receptor antagonist (terazosin) may be more successful in controlling hypersalivation than either drug alone (Reinstein 1999).
Why it is important to do this review
Hypersalivation is a common effect when people with schizophrenia are treated with neuroleptic drugs (Table 1, Hori 2006). Hypersalivation can be an embarrassing and stigmatising problem, can affect quality of life and can result in discontinuation of neuroleptic treatment. It can also be difficult to treat. Another Cochrane review has focused on the treatment of clozapine‐induced hypersalivation (Syed 2008). This review is important because it aims to evaluate the quality of evidence for the benefit and harm of anticholinergic drugs used in treating hypersalivation induced by neuroleptics other than clozapine.
Objectives
To summarise the best available evidence of the effects of anticholinergic drugs in the treatment of non‐clozapine neuroleptic‐induced hypersalivation in people with schizophrenia. Clozapine‐induced hypersalivation has been addressed in another Cochrane review.
Methods
Criteria for considering studies for this review
Types of studies
All relevant randomised controlled trials. If a trial was described as 'double blind' but implied randomisation, we were to include such trials in a sensitivity analysis (see Sensitivity analysis). If inclusion of such trials did not result in a substantive difference, they would have remained in the analyses. If their inclusion did result in statistically significant differences, we were not to add the data from these lower‐quality studies to the results of the better trials but rather would present such data within a subcategory. We were to exclude quasi‐randomised studies, such as those allocating by alternate days of the week. When people were given additional treatments with an anticholinergic medication, we would have included data only if the adjunct treatment was evenly distributed between groups and if it was only the anticholinergic medication that had been randomly assigned.
Types of participants
Adults, however defined, with schizophrenia or related disorders, including schizophreniform disorder, schizoaffective disorder and delusional disorder, again, by any means of diagnosis with non‐clozapine neuroleptic‐induced hypersalivation, however identified (including recipient, carer and clinician).
We are interested in making sure that information is as relevant to the current care of people with schizophrenia as possible, so we proposed that if possible, we would clearly highlight the current clinical state (acute, early post‐acute, partial remission, remission), as well as the stage (prodromal, first episode, early illness, persistent), and would ascertain whether the studies primarily focused on people with particular problems (e.g. negative symptoms, treatment‐resistant illnesses).
Types of interventions
1. Anticholinergic drugs
Any anticholinergic drug at any dose and by any route of administration. Such drugs include pirenzepine, benzhexol (trihexyphenidyl), benztropine, atropine, hyoscine hydrobromide and ipratropium bromide. We proposed to compare the effects of these with the following.
2. Placebo
This includes placebo or no treatment.
3. Any another anticholinergic drug
4. Any other intervention
Types of outcome measures
All outcomes were to be divided into short‐term (within three months), medium‐term (3 to 12 months) and long‐term (longer than one year).
Primary outcomes
1. Measurement of salivation
1.1 Cured
1.2 Clinically important improvement in hypersalivation
2. Adverse effects-general and specific
2.1 Clinically important general adverse effects
Secondary outcomes
1. Measurement of salivation
1.1 Average endpoint hypersalivation score
1.2 Average change in hypersalivation scores
2. Quality of life (recipient of care or informal carers or professional carers)
2.1 Clinically important change in quality of life
2.2 Average endpoint quality of life score
2.3 Average change in quality of life scores
2.4 Clinically important change in specific aspects of quality of life
2.5 Average endpoint specific aspects of quality of life
2.6 Average change in specific aspects of quality of life
3. Adverse effects-general and specific
3.1 Average endpoint general adverse effect score
3.2 Average change in general adverse effect scores
3.3 Clinically important specific adverse effects
3.4 Average endpoint specific adverse effects
3.5 Average change in specific adverse effects
3.6 Sudden and unexpected death
4. Global state
4.1 Relapse
4.2 Clinically important change in global state (as defined by individual studies)
4.3 Average endpoint global state score
4.4 Average change in global state scores
4.5 Use of other medications
5. Service outcomes
5.1 Hospitalisation
5.2 Time to hospitalisation
6. Mental state (with particular reference to the positive and negative symptoms of schizophrenia)
6.1 Clinically important change in general mental state
6.2 Average endpoint general mental state score
6.3 Average change in general mental state scores
6.4 Clinically important change in specific symptoms (positive symptoms of schizophrenia, negative symptoms of schizophrenia, depression, mania)
6.5 Average endpoint specific symptom score
6.6 Average change in specific symptom scores
7. General functioning
7.1 Clinically important change in general functioning
7.2 Average endpoint general functioning score
7.3 Average change in general functioning scores
7.4 Clinically important change in specific aspects of functioning, such as social or life skills
7.5 Average endpoint specific aspects of functioning, such as social or life skills
7.6 Average change in specific aspects of functioning, such as social or life skills
8. Behaviour
8.1 Clinically important change in general behaviour
8.2 Average endpoint general behaviour score
8.3 Average change in general behaviour scores
8.4 Clinically important change in specific aspects of behaviour
8.5 Average endpoint specific aspects of behaviour
8.6 Average change in specific aspects of behaviour
9. Satisfaction with treatment
9.1 Leaving the studies early
9.2 Recipient of care satisfied with treatment
9.3 Recipient of care average satisfaction score
9.4 Recipient of care average change in satisfaction scores
9.5 Carer satisfaction with treatment
9.6 Carer average satisfaction score
9.7 Carer average change in satisfaction scores
10. Economic outcomes
10.1 Direct costs
10.2 Indirect costs
11. Summary of findings table
We were to use the GRADE approach to interpret findings (Schünemann 2008) and to use the GRADE profiler (GRADE PRO) to import data from RevMan 5.1 (Review Manager) to create 'Summary of findings' tables. These tables provide outcome‐specific information concerning the overall quality of evidence from each included study in the comparison, the magnitude of effect of the interventions examined, and the sum of available data on all outcomes that we will rate as important to patient‐ care and decision making. We were to select the following main outcomes for inclusion in a 'Summary of findings' table.
1. Measurement of salivation (binary)
2. Quality of life
3. Adverse effects
4. Satisfaction with treatment
5. Economic outcome
Search methods for identification of studies
Electronic searches
1. Cochrane Schizophrenia Group Trials Register (November 2012)
We searched the register using the phrase:
[((*hypersaliv* or *drool* or * saliva* or *ptyalism* or *sialism* or *sailorr* in title abstract or index terms of REFERENCE or outcomes of STUDY) or (*hypersaliv* in Helath care conditions of STUDY)) AND (*anticholinergic* OR *atropine* OR *benzatropine* OR *benzhexol* OR *hyoscine hydrobromide* OR *ipratropium bromide* OR *muscarinic* OR *pirenzepine* OR *trihexyphenidyl* in interventions of STUDY)]
This register is compiled by systematic searches of major databases, handsearches and searches of conference proceedings (see group module).
Searching other resources
1. Reference searching
We were to inspect references of all included studies for further relevant studies.
2. Personal contact
We were to contact the first author of each included study for information regarding unpublished trials.
Data collection and analysis
Selection of studies
Review authors AR, MFA, BA and AT independently inspected citations from the searches to identify relevant abstracts. AE and NAH were to independently re‐inspect a random 20% sample to ensure reliability, but this was not needed as the number of studies was low. Full reports of abstracts meeting review criteria or of references/abstracts about which review authors disagreed were to be obtained and inspected by AR, MFA, BA and AT. Again, AE and NAH were to re‐inspect a random 20% of reports to ensure reliable selection. Where it was not possible to resolve disagreement by discussion, we contacted the authors of the study for clarification.
Data extraction and management
1. Extraction
Review authors AR, MFA, BA and AT were to extract data from all included studies. In addition, to ensure reliability, AE and NAH were to independently extract data from a random sample of these studies, constituting 50% of the total. Again, any disagreement would have been discussed and decisions documented, and, if necessary, we were to contact the authors of studies for clarification. With remaining problems, AE and NAH would have helped to clarify issues, and we would have documented these final decisions. We were to extract data presented only in graphs and figures whenever possible, but we were to include the data only if two review authors independently achieved the same result. We would have attempted to contact authors through an open‐ended request to obtain missing information or for clarification whenever necessary. If studies were multi‐centre, where possible, we were to extract data relevant to each component centre separately.
2. Management
2.1 Forms
We extracted data onto standard, simple forms.
2.2 Scale‐derived data
We were to include continuous data from rating scales only if:
a. the psychometric properties of the measuring instrument had been described in a peer‐reviewed journal (Marshall 2000); and
b. the measuring instrument had not been written or modified by one of the trialists for that particular trial.
Ideally the measuring instrument should be a self‐report or should be completed by an independent rater or relative (not the therapist). We realise that this often is not reported clearly; in 'Description of studies', we will note whether or not this is the case.
2.3 Endpoint versus change data
Both endpoint and change data provide advantages. Change data can remove a component of between‐person variability from the analysis. On the other hand, calculation of change needs two assessments (baseline and endpoint), which can be difficult to perform in unstable and difficult to measure conditions such as schizophrenia. We have decided to use primarily endpoint data and to use change data only if the former are not available. We were to combine endpoint and change data in the analysis, as we were to use mean differences (MDs) rather than standardised mean differences (SMDs) throughout (Higgins 2011).
2.4 Skewed data
Continuous data on clinical and social outcomes often are not normally distributed. To avoid the pitfall of applying parametric tests to non‐parametric data, we aimed to apply the following standards to all data before inclusion: (a) standard deviations (SDs) and means are reported in the paper or are obtainable from the authors; (b) when a scale starts from the finite number zero, the SD, when multiplied by two, is less than the mean (as otherwise, the mean is unlikely to be an appropriate measure of the centre of the distribution (Altman 1996)); and (c) if a scale started from a positive value (such as the Positive and Negative Syndrome Scale (PANSS), which can have values from 30 to 210), we will modify the calculation described above to take the scale starting point into account. In these cases, skew is present if 2 SD > (S - S min), where S is the mean score and S min is the minimum score. Endpoint scores on scales often have finite start and end points, and these rules can be applied. We were to enter skewed endpoint data from studies of fewer than 200 participants as other data within the data and analyses section rather than into a statistical analysis. Skewed endpoint data pose less of a problem when means are used if the sample size is large and if we synthesise such data.
When continuous data are presented on a scale that includes a possibility of negative values (such as change data), it is difficult to tell whether or not data are skewed. We were to enter skewed change data into analyses.
2.5 Common measure
To facilitate comparison between trials, we intended to convert variables that can be reported in different metrics, such as days in hospital (mean days per year, per week or per month), to a common metric (e.g. mean days per month).
2.6 Conversion of continuous to binary
Where possible, efforts were to be made to convert outcome measures to dichotomous data. This can be done by identifying cut‐off points on rating scales and dividing participants accordingly into 'clinically improved' and 'not clinically improved'. It is generally assumed that if a 50% reduction is seen in a scale‐derived score such as the Brief Psychiatric Rating Scale (BPRS; Overall 1962) or the PANSS (Kay 1986), this could be considered a clinically significant response (Leucht 2005, Leucht 2005a). If data based on these thresholds were not available, we were to use the primary cut‐off presented by the original authors.
2.7 Direction of graphs
Where possible, we were to enter data in such a way that the area to the left of the line of no effect indicates a favourable outcome for anticholinergic medication. Where keeping to this makes it impossible to avoid outcome titles with clumsy double‐negatives (e.g. 'Not improved'), we were to report data in such a way that the area to the left of the line indicates an unfavourable outcome. We were to note this in the relevant graphs.
Assessment of risk of bias in included studies
Again AR, MFA, BA and AT worked independently to assess risk of bias by using criteria described in the Cochrane Handbook for Systematic Reviews of Interventions (Higgins 2011) to assess trial quality. This set of criteria is based on evidence of associations between overestimate of effect and high risk of bias of the article, such as sequence generation, allocation concealment, blinding, incomplete outcome data and selective reporting.
If the raters disagreed, we were to make the final rating by consensus, with the involvement of AE and NAH. Where inadequate details of randomisation and other characteristics of trials were provided, we contacted the authors of the studies to obtain further information. We were to report non‐concurrence in quality assessment, but if disputes arose regarding to which category a trial was to be allocated, we were to resolve them by discussion.
We were to note the level of risk of bias in both the text of the review and 'Summary of findings' table.
Measures of treatment effect
1. Binary data
For binary outcomes, we were to calculate a standard estimation of the risk ratio (RR) and its 95% confidence interval (CI). It has been shown that RR is more intuitive (Boissel 1999) than odds ratios (ORs) and that ORs tend to be interpreted as RR by clinicians (Deeks 2000).
2. Continuous data
For continuous outcomes, we were to estimate the MD between groups. We preferred not to calculate effect size measures (SMD). However, if scales of very considerable similarity were used, we would have presumed a small difference in measurement, and we would have calculated effect size and transformed the effect back to the units of one or more of the specific instruments.
Unit of analysis issues
1. Cluster trials
Studies increasingly employ 'cluster randomisation' (such as randomisation by clinician or practice), but analysis and pooling of clustered data can pose problems. First, authors often fail to account for intraclass correlation in clustered studies, leading to a 'unit of analysis' error (Divine 1992) whereby P values are spuriously low, CIs unduly narrow and statistical significance overestimated. This causes type I errors (Bland 1997; Gulliford 1999).
If clustering was not accounted for in primary studies, we would have presented data in a table, with an (*) symbol to indicate the presence of a probable unit of analysis error. In subsequent versions of this review, we will seek to contact the first authors of such studies to obtain intraclass correlation coefficients (ICCs) for their clustered data and to adjust for these by using accepted methods (Gulliford 1999).
If clustering had been incorporated into the analysis of primary studies, we would have presented these data as if from a non‐cluster randomised study with adjustment for the clustering effect.
We have sought statistical advice and have been advised that the binary data as presented in a report should be divided by a 'design effect'. This is calculated by using the mean number of participants per cluster (m) and the ICC [Design effect = 1 + (m - 1) * ICC] (Donner 2002). If the ICC was not reported, we were to assume that it was 0.1 (Ukoumunne 1999).
If cluster studies had been appropriately analysed by taking into account ICCs and relevant data documented in the report, synthesis with other studies would have been possible through the generic inverse variance technique.
2. Cross‐over trials
A major concern of cross‐over trials is the carry‐over effect. It occurs if an effect (e.g. pharmacological, physiological, psychological) of the treatment in the first phase is carried over to the second phase. As a consequence, on entry to the second phase, participants can differ systematically from their initial state despite a wash‐out phase. For the same reason, cross‐over trials are not appropriate if the condition of interest is unstable (Elbourne 2002). As both effects are very likely in severe mental illness, we were to use only data from the first phase of cross‐over studies.
3. Studies with multiple treatment groups
Where a study involved more than two treatment arms, if relevant, we were to present the additional treatment arms in comparisons. If data were binary, we were to simply add and combine them within the two‐by‐two table. If data were continuous, we were to combine data in accordance with the formula in Section 7.7.3.8 (Combining groups) of the Cochrane Handbook for Systematic Reviews of Interventions. Where the additional treatment arms were not relevant, we were not to reproduce the data.
Dealing with missing data
1. Overall loss of credibility
At some degree of loss of follow‐up, data must lose credibility (Xia 2009). We chose that for any particular outcome, should more than 50% of data be unaccounted for, we would not have reproduced these data or used them within analyses, except for the outcome of leaving the study early. If, however, more than 50% of those in one arm of a study were lost, but the total loss was less than 50%, we would have marked such data with an (*) to indicate that such a result may well be prone to bias.
2. Binary
In the case where attrition for a binary outcome was between 0% and 50% and where these data were not clearly described, we were to present the data on a 'once‐randomised‐always‐analyse' basis (an intention‐to‐treat analysis). All of those leaving the study early would have been assumed to have the same rates of negative outcome as those who completed the study. We were to undertake a sensitivity analysis to test how prone the primary outcomes were to change when 'completer' data only were compared with the intention‐to‐treat analysis using the above assumptions.
3. Continuous
3.1 Attrition
In cases where attrition for a continuous outcome was between 0% and 50% and completer‐only data were reported, we were to reproduce these data.
3.2 Standard deviations
If SDs were not reported, we were to try first to obtain the missing values from the authors. If these data were not available and measures of variance for continuous data were missing, but an exact standard error (SE) and CIs were available for group means, and either P or t values were available for differences in mean, we were to calculate them according to the rules described in the Cochrane Handbook for Systematic Reviews of Interventions (Higgins 2011): When only the SE is reported, SDs are calculated by the formula SD = SE * square root (n). Chapters 7.7.3 and 16.1.3 of the Cochrane Handbook for Systematic Reviews of Interventions (Higgins 2011) present detailed formulas for estimating SDs from P values, t or F values, CIs, ranges or other statistics. If these formula did not apply, we were to calculate the SDs according to a validated imputation method based on the SDs of the other included studies (Furukawa 2006). Although some of these imputation strategies can introduce error, the alternative would be to exclude a given study’s outcome and thus to lose information. We nevertheless were to examine the validity of the imputations in a sensitivity analysis while excluding imputed values.
3.3 Last observation carried forward
We anticipated that in some studies, the method of last observation carried forward (LOCF) would have been employed within the study report. As with all methods of imputation used to deal with missing data, LOCF introduces uncertainty about the reliability of the results (Leucht 2007). Therefore, where LOCF data had been used in the trial, if less than 50% of the data had been assumed, we would have reproduced these data and indicated that they are the product of LOCF assumptions.
Assessment of heterogeneity
1. Clinical heterogeneity
We were to consider all included studies initially, without seeing comparison data, to judge clinical heterogeneity. We were simply to inspect all studies for clearly outlying people or situations that we had not predicted would arise. When such situations or participant groups were noted, they were to be fully discussed.
2. Methodological heterogeneity
We were to consider all included studies initially, without seeing comparison data, to judge methodological heterogeneity. We were simply to inspect all studies for clearly outlying methods that we had not predicted would arise. When such methodological outliers were noted, they were to be fully discussed.
3. Statistical heterogeneity
3.1 Visual inspection
We were to visually inspect graphs to investigate the possibility of statistical heterogeneity.
3.2 Employing the I2 statistic
We were to investigate heterogeneity between studies by considering the I2 method alongside the Chi2 P value. The I2 statistic provides an estimate of the percentage of inconsistency thought to be due to chance (Higgins 2003). The importance of the observed value of I2 depends on the magnitude and direction of effects and the strength of the evidence for heterogeneity (e.g. P value from Chi2 test, or CI for I2). We will interpret an I2 estimate greater than or equal to around 50% accompanied by a statistically significant Chi2 statistic as evidence of substantial levels of heterogeneity (Section 9.5.2-Higgins 2011). When substantial levels of heterogeneity were found in the primary outcome, we were to explore reasons for heterogeneity (Subgroup analysis and investigation of heterogeneity).
Assessment of reporting biases
1. Protocol versus full study
Reporting biases arise when the dissemination of research findings is influenced by the nature and direction of results. These are described in Section 10.1 of the Cochrane Handbook for Systematic Reviews of Interventions (Higgins 2011). We were to try to locate protocols of included randomised trials. If the protocol was available, we would have compared the outcomes in the protocol with those in the published report. If the protocol was not available, we would have compared outcomes listed in the methods section of the trial report with actual reported results.
2. Funnel plot
Publication biases arise when the dissemination of research findings is influenced by the nature and direction of results (Egger 1997). These again are described in Section 10 of the Cochrane Handbook for Systematic Reviews of Interventions (Higgins 2011). We are aware that funnel plots may be useful in investigating publication biases but are of limited power for detecting small study effects. We were not to use funnel plots for outcomes where 10 or fewer studies were included, or where all studies were of similar size. In other cases, where funnel plots were possible, we were to seek statistical advice in their interpretation.
Data synthesis
We understood that there was no closed argument regarding preference for use of fixed‐effect or random‐effects models. The random‐effects method incorporates an assumption that different studies are estimating different, yet related, intervention effects. This often seems to be true to us, and the random‐effects model takes into account differences between studies even if no statistically significant heterogeneity is noted. However, the random‐effects model provides a disadvantage. It puts added weight onto small studies, which often are the most biased ones. Depending on the direction of effect, these studies can inflate or deflate the effect size. We intended to use a fixed‐effect model for all analyses.
Subgroup analysis and investigation of heterogeneity
1. Subgroup analyses-only primary outcomes
1.1 Intervention
We anticipated subgroup analyses to investigate the use of anticholinergic drugs in combination with other drugs for hypersalivation.
1.2 Clinical state, stage or problem
We proposed to undertake this review and provide an overview of the effects of anticholinergic medication among people with schizophrenia in general. In addition, we were to try to report data on subgroups of people in the same clinical state or stage and with similar problems.
2. Investigation of heterogeneity
If inconsistency was high, we were to report it. First, we would have investigated whether data had been entered correctly. Second, if data were correct, we would have visually inspected the graph and removed outlying studies to see whether heterogeneity could be restored. For this review, we had decided that should this occur with data contributing to the summary finding of no more than around 10% of the total weighting, we would have presented the data. If not, we would not have pooled data but would have discussed the relevant issues in the text. We knew of no supporting research for this 10% cut‐off but were investigating the use of prediction intervals as an alternative to this unsatisfactory state.
When unanticipated clinical or methodological heterogeneity was obvious, we simply would have stated hypotheses regarding this for future reviews or future versions of this review. We did not anticipate undertaking analyses related to these.
Sensitivity analysis
1. Implication of randomisation
We aimed to include trials in a sensitivity analysis if they were described in some way as to imply randomisation. For primary outcomes, we were to include these studies; if no substantive difference was noted when the implied randomised studies would have been added to those with better descriptions of randomisation, we were to use all data from these studies.
2. Assumptions for lost binary data
Where assumptions have to be made regarding people lost to follow‐up (see Dealing with missing data), we were to compare the findings of primary outcomes when we use our assumption with completer data only. If a substantial difference was noted, we were to report results and discuss them but continue to employ our assumption.
Where assumptions have to be made regarding missing SD data (see Dealing with missing data), we were to compare the findings of primary outcomes when we use our assumption with completer data only. We were to undertake a sensitivity analysis to test how prone results were to change when 'completer' data only are compared with imputed data using the above assumption. If a substantial difference was noted, we were to report results and discuss them but continue to employ our assumption.
3. Risk of bias
We were to analyse the effects of excluding trials that had been judged to be at high risk of bias across one or more of the domains of randomisation (implied as randomised with no further details available), allocation concealment, blinding and outcome reporting for the meta‐analysis of the primary outcome. If the exclusion of trials at high risk of bias did not substantially alter the direction of effect or the precision of effect estimates, we would have included data from these trials in the analysis.
4. Imputed values
We were to undertake a sensitivity analysis to assess the effects of including data from trials where we used imputed values for ICC in calculating the design effect in cluster‐randomised trials.
If substantial differences were noted in the direction or precision of effect estimates in any of the sensitivity analyses listed above, we would have not pooled data from the excluded trials with those of other trials contributing to the outcome but would have presented them separately.
5. Fixed‐effect and random‐effects models
We were to synthesise all data using a fixed‐effect model; however, we were also to synthesise data for the primary outcome using a random‐effects model to evaluate whether the greater weight assigned to larger trials with greater event rates altered the significance of the results compared with more evenly distributed weight in the random‐effects model.
Results
Description of studies
Results of the search
The search yielded only four references, all of which were randomised controlled studies. See also Figure 1.
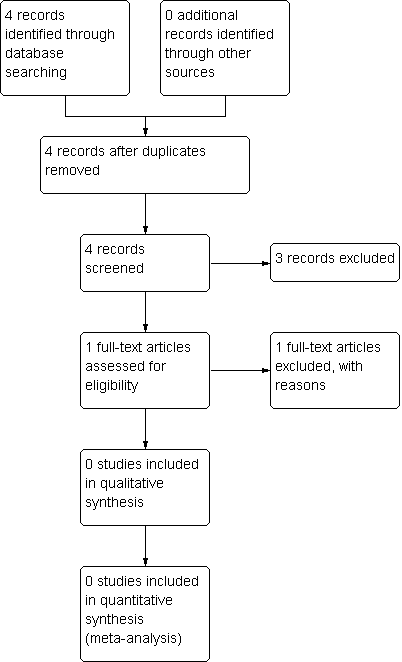
Study flow diagram.
Included studies
No included studies are provided in this review.
Excluded studies
Three studies (Reinstein 1999; Bai 2001; ISRCTN47146067 2010) were excluded because they involved people with clozapine‐induced hypersalivation ‐ a topic covered in another Cochrane review (Syed 2008). The fourth study (Hui 2002) was excluded because it investigated people with schizophrenia, mood disorders or other mental disorders who were suffering from clozapine‐ and non‐clozapine‐induced hypersalivation and were treated with Chinese medicines with unknown anticholinergic properties. People in the control group received an anticholinergic drug (artane) or an antihistamine (phenergan). It was not possible to separate clozapine‐ from non‐clozapine‐treated people in the intervention group or to separate artane‐treated people from phenergan‐treated people in the control group. We have sought this information but have not yet received an answer.
Risk of bias in included studies
No included studies are provided in this review.
Allocation
No included studies are provided in this review.
Blinding
No included studies are provided in this review.
Incomplete outcome data
No included studies are provided in this review.
Selective reporting
No included studies are provided in this review.
Other potential sources of bias
No included studies are provided in this review.
Effects of interventions
No included studies are provided in this review.
Discussion
Treatment of schizophrenia depends heavily on neuroleptic drugs. Hypersalivation is a common side effect when people with schizophrenia are treated with neuroleptic drugs. Hypersalivation can be an embarrassing and stigmatising problem, can affect quality of life and can result in discontinuation of neuroleptic treatment. It can also be difficult to treat. The aim of this review was to evaluate the quality of evidence for the benefit and harm of anticholinergic drugs used in treating hypersalivation induced by neuroleptics other than clozapine.
We have been unable to locate any studies addressing the question raised in this review. Accordingly, this may be considered an "empty review", pointing at an important clinical problem that needs to be investigated (Yaffe 2012). Well‐designed and well‐conducted RCTs in the treatment of hypersalivation induced by neuroleptics other than clozapine are needed. Such trials are feasible as demonstrated by the excluded studies described in this review.
Summary of main results
The main result is that no randomised controlled trials have investigated the effects of anticholinergic drugs for non‐clozapine neuroleptic‐induced hypersalivation.
Overall completeness and applicability of evidence
No included studies are provided in this review. The evidence is not complete, and no randomised controlled trials could guide treatment decisions in this area.
Quality of the evidence
No included studies are provided in this review.
Potential biases in the review process
No included studies are provided in this review. We might have missed some studies, but this is unlikely because we searched the Schizophrenia Group Trial Register, which is compiled by systematic searches of major databases, handsearches and searches of conference proceedings
Agreements and disagreements with other studies or reviews
We were unable to locate any studies, and we are not aware of another systematic review that has addressed the effects of anticholinergic medication for non‐clozapine neuroleptic‐induced hypersalivation.

Study flow diagram.
| Compound | n | RCTs | % (95% CI) |
| Placebo | 403 | 10 | 7.7 (5 to 11) |
| Clozapine | 559 | 16 | 32.7 (29 to 37) |
| Zotepine | 53 | 1 | 41.5 (29 to 55) |
| Zuclopenthixol hydrochloride | 66 | 2 | 24.2 (16 to 36) |
| Haloperidol | 1115 | 12 | 18.4 (16 to 21) |
| Thioridazine | 66 | 2 | 15.2 (8 to 26) |
| Chlorpromazine | 499 | 12 | 14.2 (11 to 18) |
| Trifluoperazine | 44 | 6 | 13.6 (6 to 27) |
| Molindone | 42 | 2 | 9.5 (4 to 22) |
| Bromperidol depot | 27 | 1 | 3.7 (1 to 18) |
| Olanzapine | 1857 | 5 | 8.2 (7 to 10) |
| Fluphenazine hydrochloride | 110 | 2 | 8.2 (4 to 15) |
| Amisulpride | 115 | 1 | 7.8 (4 to 14) |
| Sulpiride | 154 | 6 | 7.1 (4 to 12) |
| Risperidone depot | 317 | 2 | 5.7 (4 to 9) |
| Perphenazine | 74 | 3 | 5.4 (2 to 13) |
| Risperidone | 325 | 3 | 3.7 (2 to 6) |