Antimikrobno liječenje cistične fibroze vođeno bronhoskopijom
Abstract
Background
Early diagnosis and treatment of lower respiratory tract infections are the mainstay of management of lung disease in cystic fibrosis. When sputum samples are unavailable, treatment relies mainly on cultures from oropharyngeal specimens; however, there are concerns regarding the sensitivity of these to identify lower respiratory organisms.
Bronchoscopy and related procedures (including bronchoalveolar lavage) though invasive, allow the collection of lower respiratory specimens from non‐sputum producers. Cultures of bronchoscopic specimens provide a higher yield of organisms compared to those from oropharyngeal specimens. Regular use of bronchoscopy and related procedures may help in a more accurate diagnosis of lower respiratory tract infections and guide the selection of antimicrobials, which may lead to clinical benefits.
This is an update of a previous review.
Objectives
To evaluate the use of bronchoscopy‐guided antimicrobial therapy in the management of lung infection in adults and children with cystic fibrosis.
Search methods
We searched the Cochrane Cystic Fibrosis Trials Register, compiled from electronic database searches and handsearching of journals and conference abstract books. We also searched two registries of ongoing studies and the reference lists of relevant articles and reviews.
Date of latest search: 28 August 2015.
Selection criteria
We included randomized controlled studies including people of any age with cystic fibrosis, comparing outcomes following therapies guided by the results of bronchoscopy (and related procedures) with outcomes following therapies guided by the results of any other type of sampling (including cultures from sputum, throat swab and cough swab).
Data collection and analysis
Two review authors independently selected studies, assessed their risk of bias and extracted data. We contacted study investigators for further information.
Main results
The search identified nine studies, but only one study with data from 157 participants (170 people were enrolled) was eligible for inclusion in the review. This study compared outcomes following therapy directed by bronchoalveolar lavage for pulmonary exacerbations during the first five years of life with standard treatment based on clinical features and oropharyngeal cultures. The study enrolled infants with CF who were under six months of age and diagnosed through newborn screening and followed them until they were five years old.
We considered this study to have a low risk of bias; however, the statistical power to detect a significant difference in the prevalence of Pseudomonas aeruginosa was limited due to the prevalence (of Pseudomonas aeruginosa isolation in bronchoalveolar lavage samples at five years age) being much lower in both the groups compared to that which was expected and which was used for the power calculation. The sample size was adequate to detect a difference in high‐resolution computed tomography scoring. The quality of evidence for the key parameters was graded as moderate except high‐resolution computed tomography scoring and cost of care analysis, which were graded as high quality.
At five years of age, there was no clear benefit of bronchoalveolar lavage‐directed therapy on lung function z scores or nutritional parameters. Evaluation of total and component high‐resolution computed tomography scores showed no significant difference in evidence of structural lung disease in the two groups.
In addition, this study did not show any difference between the number of isolates of Pseudomonas aeruginosa per child per year diagnosed in the bronchoalveolar lavage‐directed therapy group compared to the standard therapy group. The eradication rate following one or two courses of eradication treatment was comparable in the two groups, as were the number of pulmonary exacerbations. However, the number of hospitalizations was significantly higher in the bronchoalveolar lavage‐directed therapy group, but the mean duration of hospitalizations was significantly less compared to the standard therapy group.
Mild adverse events were reported in a proportion of participants, but these were generally well‐tolerated. The most common adverse event reported was transient worsening of cough after 29% of procedures. Significant clinical deterioration was documented during or within 24 hours of bronchoalveolar lavage in 4.8% of procedures.
Authors' conclusions
This review, limited to a single, well designed randomized‐controlled study, shows no clear evidence to support the routine use of bronchoalveolar lavage for the diagnosis and management of pulmonary infection in pre‐school children with cystic fibrosis compared to the standard practice of providing treatment based on results of oropharyngeal culture and clinical symptoms. No evidence was available for adult and adolescent populations.
PICO
Laički sažetak
Korištenje uzoraka dobivenih bronhoskopijom pri odlučivanju kako liječiti plućne infekcije u oboljelih od cistične fibroze
Istraživačko pitanje
U ovom Cochrane sustavnom pregledu literature analizirani su dokazi o tome je li dobro koristiti uzorke dobivene bronhoskopijom pri odlučivanju kako liječiti plućne infekcije u oboljelih od cistične fibroze.
Dosadašnje spoznaje
Probleme s disanjem u oboljelih od cistične fibroze uglavnom uzrokuju ponavljajuće plućne infekcije. Laboratorijsko uzgajanje uzročnika bolesti iz uzorka sluzi iskašljanog iz donjih dišnih putova često omogućuje liječnicima brzo prepoznavanje uzročnika infekcije i rani početak liječenja. Ako pacijenti ne mogu iskašljati sluz, brisevi se uzimaju iz gornjeg dijela grla radi otkrivanja uzročnika infekcije u donjim dišnim putovima – ali ni to ne mora biti najpouzdanija metoda.
Bronhoskopija je pretraga kojom liječnici ispituju donje dišne putove rabeći dugu, usku, fleksibilnu cijev sa svjetlom i kamerom na jednom kraju. Ti uređaji također mogu uzeti uzorak sluzi. Osoba mora biti sedirana ili pod općom anestezijom. Ne zna se je li liječenje temeljeno na uzorcima uzetima tijekom bronhoskopije bolje od liječenja koje se temelji na brisu grla. Ovo je obnovljena verzija ranije objavljenog Cohrane sustavnoga pregleda.
Datum pretraživanja literature
Ovaj sustavni pregled uključuje istraživanja objavljena do 28. kolovoza 2015.
Obilježja studija
U literaturi su tražene sudije u kojima su sudjelovali ispitanici svih dobnih skupina. Međutim, ovaj Cohrane sustavni pregled uključio je samo jednu studiju u kojoj je sudjelovalo 170 novorođenčadi i dojenčadi oboljele od cistične fibroze. Djeca su bila mlađa od šest mjeseci, a podijeljena su u dvije skupine, potpuno nasumično. Jedna skupina je liječena antibioticima temeljem uzoraka uzetih bronhoskopijom, a drugoj skupini su davani antibiotici na temelju uzoraka uzetih brisom grla. Istraživači su mjerili rezultate u dobi od 5 godina. Ukupno je 157 djece dovršilo istraživanje.
Ključni rezultati
Ovo ispitivanje nije pokazalo nikakvu razliku među skupinama u pogledu plućne funkcije, težine, indeksa tjelesne težine ili u rezultatima izračunatim CT pretragom pluća u dobi od 5 godina. Nije bilo razlike u tome koliko djece je bilo zaraženo Pseudomonasaeruginosom u dobi od 5 godina, ili po godini praćenja, ili koliko često su djeca imala pogoršanje dišnih simptoma. Djeca u skupini s bronhoskopijom su bila češće primana u bolnicu, iako su ta liječenja u bolnici trajala kraće nego u drugoj skupini. Nije bilo razlike u ukupnoj cijeni troškova dvaju skupina.
Nuspojave opisane tijekom i nakon bronhoskopije nisu bile ozbiljne. Najčešća neželjena popratna pojava bila je pojačanje kašlja (u trećine djece).
Trenutno nema dovoljno dokaza koji bi opravdali uporabu bronhoskopije u dijagnosticiranju i liječenju plućnih infekcija u djece s cističnom fibrozom.
Kvaliteta dokaza
Dokazi su ograničeni samo na jedno dobro organizirano ispitivanje. Ukupna kvaliteta dokaza bila je od umjerene (za većinu ishoda) do visoke (za CT visoke razlučivosti i analizu cijene troškova). Manje djece je sudjelovalo u ispitivanju nego li su statističari mislili da je potrebno za neke ishode. Budući da je liječenje prve infekcije Pseudomonas aeruginosom dosta uspješno, potrebna su veća i dulja ispitivanja za otkrivanje malih razlika među skupinama. Vođenje takvih velikih ispitivanja je jako teško.
Authors' conclusions
Summary of findings
| BAL‐directed therapy versus standard therapy for cystic fibrosis | ||||||
| Patient or population: people with pulmonary exacerbations in cystic fibrosis | ||||||
| Outcomes | Illustrative comparative risks* (95% CI) | Relative effect | No of Participants | Quality of the evidence | Comments | |
| Assumed risk | Corresponding risk | |||||
| Standard therapy | BAL‐directed therapy | |||||
| Z score FEV1 | The mean z score for FEV1 in the standard therapy group was ‐0.41 (SD 1.23). | The mean z score FEV1 in the intervention group ‐0.56 (SD 1.25) that was 0.15 lower (0.54 lower to 0.24 higher) than the standard therapy group. | 157 | ⊕⊕⊕⊝ | FEV1 and FVC were measured using standard spirometer after bronchodilatation. The mean difference between the two groups represents the difference in the mean z scores for each parameter. Z scores for FEV1, FVC were calculated from British reference values (www.lungfunction.org/growinglungs). | |
| Z score FVC | The mean z score for FVC in the standard therapy group was 0.01 (SD 1.2). | The mean z score FVC in the intervention groups was ‐0.04 (SD 1.31) that was 0.05 higher (0.44 lower to 0.34 higher) than the standard therapy group. | 157 | ⊕⊕⊕⊝ | FEV1 and FVC were measured using standard spirometer after bronchodilatation. The mean difference between the two groups represents the difference in the mean z scores for each parameter. Z scores for FEV1, FVC were calculated from British reference values (www.lungfunction.org/growinglungs). | |
| HRCT score (Brody‐II) | The mean HRCT score in the standard therapy group was 2.83 (SD 3.5). | The mean HRCT score (Brody‐II) in the intervention group was 3.02 (SD 3.48) 0.19 higher (0.93 lower to 1.31 higher) than the standard therapy group. | 152 | ⊕⊕⊕⊕ | The study had adequate power to detect a difference in HRCT score. HRCT scans were assesses by an independent assessor who was blinded to subject allocation using an updated version of Brody‐II score. | |
| Z score for weight | The mean z score for weight was ‐0.21 (SD 0.82) in the standard therapy group. | The mean z score for weight in the intervention group was ‐0.15 that was 0.06 higher (0.21 lower to 0.33 higher) than the standard therapy group. | 157 | ⊕⊕⊕⊝ | The z scores for weight and BMI were calculated from the 2000 CDC Growth Reference Charts (http://cdc.gov/growthcharts). The mean difference between the two groups represents the difference in their z scores for each parameter. | |
| Z score BMI | The mean z score for BMI was 0.01 (SD 0.83) in the standard therapy group. | The mean z score BMI in the intervention group was 0.03 (SD0.93) that was 0.02 higher (0.26 lower to 0.30 higher) than the standard therapy group. | 157 | ⊕⊕⊕⊝ | The z scores for weight and BMI were calculated from the 2000 CDC Growth Reference Charts (http://cdc.gov/growthcharts). The mean difference between the two groups represents the difference in their z scores for each parameter. | |
| Number of hospitalizations per participant per year | The number of hospitalizations per participant per year was 1.08 in the standard therapy group. | The number of hospitalizations per participant per year in the intervention group was 1.52 that was 1.4 times higher (1.08 lower to 1.82 higher) than the standard therapy group. | 157 | ⊕⊕⊕⊝ | ||
| Overall cost of care per participant (AUD) Follow up: 5 years | The total cost of care for each participant was 90,958 AUD (SD 110,255) in the standard therapy group. | The total cost of care in the intervention group was 92,860 AUD (SD 73,378) that was 1902 AUD higher (27,508.98 lower to 31,312.98 higher) than the standard therapy group. | 157 (1 study) | ⊕⊕⊕⊕ | The cost of hospital admissions per participant over the total study duration in the intervention group was 9288 AUD lower in the intervention group (34,996.37 lower to 16,420.37 higher). | |
| *The basis for the assumed risk (e.g. the median control group risk across studies) is provided in footnotes. The corresponding risk (and its 95% confidence interval) is based on the assumed risk in the comparison group and the relative effect of the intervention (and its 95% CI). | ||||||
| GRADE Working Group grades of evidence | ||||||
| 1 The study had low statistical power and research is needed to provide definitive answers. | ||||||
Background
Please note: there is a glossary of terms provided in the appendices (Appendix 1)
Description of the condition
Cystic fibrosis (CF) is one of the most common life‐shortening autosomal recessive disorders. The prevalence is highest in Caucasian populations, with around 1 in 2500 in the UK (Dodge 2007) and the condition is increasingly being recognised as being important in other populations (Bobadilla 2002; Heim 2001). It affects multiple systems including the lungs, intestines and the digestive system. Respiratory disease is the cause of most morbidity and is a major contributor towards mortality related to CF. Respiratory disease is characterised by repeated episodes of pulmonary infections, termed as exacerbations, which manifest as acute deterioration of respiratory symptoms or signs. These exacerbations are usually related to infection and associated with worsening of lung function or loss of weight (Rabin 2004). Over a period of time, these exacerbations lead to progressive structural lung damage and poor lung function.
Respiratory infections in CF are caused by a limited range of organisms. At an early age, the commonest organisms are Staplylococcus aureus (S. aureus) and Haemophilus influenzae (H. influenzae) which are followed very soon after by Pseudomonas aeruginosa (P. aeruginosa). Over a period of time, the initial intermittent infections by P. aeruginosa establish into chronic infection (Li 2005), which is the case with more than 60% of the adult CF population (UK CF Trust 2004). Chronic P. aeruginosa infection is associated with increased morbidity and mortality (Frederiksen 1997; Gibson 2003; Li 2005; Nixon 2001; UK CF Trust 2004).
The management of CF‐lung disease incorporates different aspects such as the prevention and treatment of infections, chest physiotherapy and mucus clearance techniques. The isolation of infecting organisms is important as these are more readily eradicated at an early stage in the infectious process. For example, eradication of an initial infection with P. aeruginosa can be achieved (Langton Hewer 2009; Stuart 2010) and is recommended in guidelines (UK CF Trust 2004). However, chronic pulmonary infection with P. aeruginosa cannot be eradicated. Eradication has become a major treatment goal in people who are P. aeruginosa‐naïve as it delays the onset of chronic infection (Hansen 2008). To achieve early identification of organisms, routine surveillance is conducted which includes regular two‐ to three‐monthly microbiological cultures with isolation of organisms mainly from the cultures of respiratory specimens; these include either spontaneously produced or induced sputum. Very young children, many older children and even some adults are unable to expectorate sputum. In such cases, the standard practice has been to use upper respiratory swabs including throat or oropharyngeal swabs (a cotton‐tipped swab is rotated in the back of the throat or tonsils) or 'cough swabs' (a cough swab is taken by holding a sterile swab at the back of the throat and asking the individual, who is often a child, to cough). The same methods are used to guide the treatment of infective exacerbations.
Description of the intervention
Bronchoscopy is an endoscopic procedure which helps visualize the upper and lower airways using a bronchoscope. A bronchoscope is a slender tubular instrument with a light at the end; it can be either flexible or rigid. Flexible bronchoscopy was first introduced by Ikeda in 1968 (Ikeda 1968) and was first reported to be used in children in 1978 (Wood 1978). Since then the technique has been significantly improved and safety of the procedure has been described (de Blic 2002; Nussbaum 2002; Picard 2000).
Several special bronchoscopic procedures are used to aid diagnosis. Bronchoalveolar lavage (BAL) and protected bronchial brush (PBB) sampling have been used to obtain specimens from the lower respiratory tract. The use of BAL involves the instillation of small aliquots of saline into bronchi followed by its recovery by suction; whereas PBB sampling allows direct sampling from the airway mucosal surface.
How the intervention might work
The newborn screening programme was started for CF with one of its aims being the improvement of clinical outcome for people with CF by diagnosing them soon after birth and by providing early interventions. It has been shown to have an effect on nutritional status (Farrell 1997a), but no significant difference has been documented in the status of the lung disease (Dankert‐Roelse 2009; Farrell 1997b; Southern 2009).
There is an increasing recognition that the onset of lung disease happens very early in the course of CF and infection and inflammation have been documented in BAL in the first few months of life by many groups, including asymptomatic infection with P. aeruginosa (Armstrong 1995; Khan 1995; Sly 2009). Early identification of the correct organism should allow appropriate treatment and the use of eradication regimens (where appropriate e.g. for P. aeruginosa), with the aim of avoiding chronic infection and related morbidity. Improving the accuracy of microbiological testing is therefore a logical goal.
Traditional surveillance methods to guide the treatment of acute exacerbations and to prevent the development of chronic infection include the identification of pathological organisms from sputum and, in non‐expectorating patients, of organisms from the oropharynx, e.g. from a throat swab or a 'cough swab'. However, the upper respiratory tract is inhabited by a large number of bacteria as normal commensals (passive inhabitants which do not cause active disease); this leads to contamination of the upper respiratory specimens and can affect the culture results. It has been shown that oropharyngeal cultures, particularly in very young children, have poor sensitivity for lower respiratory tract infection (Rosenfeld 1999). The most reliable method for obtaining lower respiratory secretions is BAL; and some studies have shown cultures based on these samples have a higher yield of organisms as compared to standard methods (Baughman 1997; Hilliard 2007; Rosenfeld 1999; Stafler 2011). This could potentially be useful in routine surveillance for people with CF, but it comes with the drawback of being an invasive procedure with the need for anaesthesia and a hospital visit.
Why it is important to do this review
There has been a change in practice in many CF centres, based on the need for early identification of infections; and bronchoscopy has been used to collect lower respiratory specimens routinely from young children and from adults in some specific situations. Studies have suggested that this practice has led to the identification of new organisms and use of different antibiotics in situations where bronchoscopy has been performed both in symptomatic individuals (Baughman 1997) and in asymptomatic individuals (Sly 2009). No systematic review has been undertaken to assess the effect of routine bronchoscopy‐guided antimicrobial management of acute and chronic respiratory disease in children and adults with CF compared to standard management (which is directed by culture of oropharyngeal swab or sputum, as described above).
This is an update of a previously published review (Jain 2013).
Objectives
To evaluate the use of bronchoscopy‐guided antimicrobial therapy in the management of lung infection in people (both adults and children) with CF.
Methods
Criteria for considering studies for this review
Types of studies
Randomized controlled studies.
Types of participants
Children and adults with CF (according to standard definitions, clinical features of CF plus a positive sweat test or the presence of two genes known to be associated with CF (Rosenstein 1998).
Types of interventions
We included studies comparing outcomes following therapies guided by the results of bronchoscopy (with BAL or PBB sampling) with outcomes following therapies guided by the results of any other type of sampling (including but not limited to cultures from sputum, throat swab and cough swab).
Types of outcome measures
Primary outcomes
-
Lung function
-
conventional spirometry
-
per cent predicted forced expiratory volume at one second (FEV1) change and absolute values in litres
-
per cent predicted forced vital capacity (FVC) change and absolute values in litres
-
-
infant lung function‐squeeze
-
per cent predicted FEV0.5, forced expiratory flow from 25% to 75% of vital capacity (FEF25‐75) and FEF75 changes and absolute values in litres
-
per cent predicted FVC change and absolute values in litres
-
-
lung clearance index (LCI)
-
-
High‐resolution computed tomography (HRCT) appearances using a recognised scoring system (e.g. Brody 2004; Loeve 2009)
-
Nutritional parameters
-
weight (in kg or percentile)
-
body mass index (BMI) percentile
-
Secondary outcomes
-
Number of positive isolates per child per year of follow‐up (for BAL defined as a positive culture of the growths from 1000 CFU/ml)
-
P. aeruginosa
-
S. aureus
-
H. influenza
-
Burkholderia cepacia complex
-
Stenotrophomonous maltophilia (S. maltophilia)
-
Achromobacter xylosoxidans (A. xylosoxidans)
-
non‐tuberculous mycobacteria
-
Aspergillus species
-
any other organism
-
-
Clearance of the organism from the cultures
-
Time to first infection with P. aeruginosa*
-
Time to chronic infection using any recognized definition e.g. (Lee 2003)*
-
with P. aeruginosa
-
withS. aureus
-
-
Complications and adverse effects related to bronchoscopy (e.g. fever, hypoxaemia and increased cough, unplanned admissions and other serious adverse events etc.)
-
Quality of life (QoL) measured using a validated tool such as Cystic Fibrosis Questionnaire‐Revised version (CFQ‐R) (Quittner 2009) and Cystic Fibrosis Quality of Life Questionnaire (CFQoL) (Gee 2000)
-
Hospitalisations
-
number of hospitalisations per participant per year
-
days as inpatient per participant per year
-
cost of care
-
-
Number of courses of antibiotics prescribed per participant per year (not including prophylactic antibiotics)
-
intravenous
-
oral
-
-
Number of pulmonary exacerbations (requiring oral or intravenous antibiotics) per participant per year (diagnosis based on clinical judgement or any approved or published definition e.g. Rabin 2004, Rosenfeld 2001)
* In the studies where the follow up was started just after the birth, we considered the age of first acquisition of infection and age of establishing chronic infection. In studies in older people where follow up is started later in life, we considered time to acquire the first infection and time to acquire chronic infection.
Search methods for identification of studies
Electronic searches
We identified relevant studies from the Cochrane Cystic Fibrosis and Genetic Disorders Group's Cystic Fibrosis Trials Register using the term: sampling techniques.
The Cystic Fibrosis Trials Register is compiled from electronic searches of the Cochrane Central Register of Controlled Trials (CENTRAL) (updated each new issue of The Cochrane Library), quarterly searches of MEDLINE, a search of Embase to 1995 and the prospective handsearching of two journals ‐ Pediatric Pulmonology and the Journal of Cystic Fibrosis. Unpublished work is identified by searching the abstract books of three major cystic fibrosis conferences: the International Cystic Fibrosis Conference; the European Cystic Fibrosis Conference and the North American Cystic Fibrosis Conference.
For full details of all searching activities for the register, please see the relevant sections of the Cochrane Cystic Fibrosis and Genetic Disorders Group Module.
Date of the latest search of the Group's Cystic Fibrosis Trials Register: 28 August 2015.
We also searched the ongoing study registers: clinicaltrials.gov and International Standard Randomised Controlled Trial Number (ISRCTN) Register (www.isrctn.org) using the search terms: cystic fibrosis AND bronchoscopy, cystic fibrosis AND bronchoalveolar lavage, cystic fibrosis AND sampling technique.
Date of the latest search of the ongoing study registers: 02 November 2015.
Searching other resources
We checked the reference lists of primary studies and review articles for additional references.
Data collection and analysis
We conducted the review according to the recommendations from theCochrane Handbook of Systematic Reviews of Interventions (Higgins 2011a).
Selection of studies
Two review authors (KJ and CW) independently screened the titles and abstracts of all the studies identified by the primary search and then obtained the full text of relevant studies. Both authors independently went through the studies while considering inclusion criteria to decide whether to include or exclude the studies. The authors planned to contact the investigators for more information for any study where the criteria for inclusion were unclear. They planned to resolve any disagreement by discussion, referral to the third review author and consensus. They have described the reasons for exclusion of the studies, initially considered eligible for inclusion according to title and abstract.
Data extraction and management
One review author (KJ ) extracted the data from the only included study; the second review author (CW) was familiar with the data (being the author of the study). They completed a pre‐decided data extraction form. They resolved any disagreements by discussion, referral to the third review author and consensus. Extracted information included:
-
administrative details including authors, year of publication, country of study;
-
participant characteristics including number of participants in each group, age, gender, weight, BMI, concomitant morbidities and other baseline characteristics mentioned in the studies;
-
study characteristics including design of study, inclusion and exclusion criteria, duration of follow up, co‐morbidities, primary and secondary outcome measures;
-
details of intervention techniques used for the collection of specimens and the description of any adverse effects;
-
data for primary and secondary outcome measures.
The review authors created a study flow diagram following the template described in the PRISMA statement (Moher 2009). They also completed a table of 'Characteristics of included studies' including information about study design, relevant information on the demographics and health of participants and a list of interventions and outcome measures.
If suitable data were available, they would have undertaken a meta‐analysis for each outcome. Where possible, they have presented the results in a graph, or otherwise in a narrative way.
The authors planned to report data at two weeks (after finishing the antibiotic course), three months, six months, one year and annually thereafter. If there were studies reporting data at other time points, they would have considered reporting those as well. In the current version of the review, the authors have presented data at the five‐year time‐point.
Assessment of risk of bias in included studies
Two authors independently assessed the studies fulfilling the inclusion criteria for risk of bias as per guidelines from theCochrane Handbook of Systematic Reviews of Interventions (Higgins 2011b). They assessed studies for risk of bias according to a standardised set of questions covering the following domains:
-
random sequence generation;
-
allocation concealment;
-
blinding of outcome assessment for the primary outcomes for HRCT assessment and lung function parameters;
-
incomplete data outcome;
-
selective reporting bias;
-
other sources of bias.
They classified the responses from each category into one of three grades (low risk of bias, high risk of bias and unclear risk of bias) and generated a risk of bias graph.
Measures of treatment effect
The authors planned to analyse binary data using risk ratio (RR) and 95% confidence intervals (CIs). They used the mean difference (MD) with 95% CIs to analyse continuous data. The MD measures the absolute difference between the mean value in two groups when outcome measurements in all studies use the same scale; they would have used the standardized MD when the studies were assessing the same outcome but measuring it in a variety of ways. We used time‐to‐event analysis using hazard ratios (HRs) with 95% CIs, e.g. for time to acquisition of chronic infection with P. aeruginosa. With reference to count data, e.g. for the number of isolates of organisms, we treated the data as continuous data and measured the intervention effect using the MD and 95% CIs between the groups. By convention, the changes during the study were reported as the effect measured post‐intervention minus that measured pre‐intervention; and differences between the study arms were reported as treatment arm effects minus control arm effects.
Unit of analysis issues
If the review authors identify further studies in the future, they plan to include cluster‐randomised studies if the clustering has been taken into account and the intra‐cluster coefficient is included. For the analysis process they will calculate the design effect to allow calculation of an effective sample size or an inflated standard error. They will consider estimates from an appropriately analysed cluster‐randomised controlled study, e.g. effects from a mixed model. They plan to use generic inverse variance output method in these contexts.
The review authors planned not to include cross‐over studies in the review, since CF is a chronic disorder with progressive worsening of lung disease following repeated infections. Some of the infections like P. aeruginosa, once established, cannot be eradicated and are associated with worse outcome. In addition, for outcome measures such as change in lung function and structural lung damage, it may not be possible to revert completely to the same level, even with treatment. In view of this, the authors felt it was justified not to include cross‐over studies.
For events happening multiple times, such as pulmonary infections, the unit of analysis will be individual participants (except in some cases e.g. the number of isolates of organisms per year, where we will analyse the number of events).
Dealing with missing data
In the included study, there were no outcome data available for fewer than 10% of the recruited participants. In future, when the authors include more studies, in case of missing data, they will attempt to contact the primary author of any such studies and if they do not receive any responses, they will perform an intention‐to‐treat analysis where possible.
Assessment of heterogeneity
If the authors identify more studies in future, they will use the chi2 test in the forest plot and also the I2 test for assessing the heterogeneity of results (Higgins 2003).
According to chapter 9 of theCochrane Handbook of Systematic Reviews of Interventions (Deeks 2011), a rough guide to interpretation of thresholds for the I2 statistic is as follows:
-
0% to 40%: might not be important;
-
30% to 60%: may represent moderate heterogeneity*;
-
50% to 90%: may represent substantial heterogeneity*:
-
75% to 100%: considerable heterogeneity*.
* The importance of the observed value of I2depends on (i) magnitude and direction of effects and (ii) strength of evidence for heterogeneity (e.g. P value of chi2 test or a CI for I2).
Assessment of reporting biases
Two review authors (KJ and AS) examined the included study for any evidence of selective outcome reporting bias by comparing the outcomes described in the protocol with the results published. In future, when they include more studies, they will construct a matrix indicating which outcomes were recorded in each study to establish if any studies omitted any key outcomes. They will compare the protocols (if available) or the 'Methods' section of published articles fulfilling the inclusion criteria with their 'Results' sections to establish selective reporting of outcomes that were pre‐specified. When there is suspicion of, or direct evidence of, selective outcome reporting, they will contact the study authors to provide the study protocol and full information for the outcomes reported inadequately.
If there are a sufficient number of studies included (at least 10), then the review authors will construct a funnel plot and assess this to help identify evidence of publication bias or any other type of bias.
Data synthesis
The authors followed the guidelines from theCochrane Handbook of Systematic Reviews of Interventions to conduct the comparison between the bronchoscopy‐guided and the standard treatment groups covering all the primary and secondary outcome measures (Higgins 2011a).
If they had combined more than a single data set and had identified no heterogeneity or only mild to moderate heterogeneity based on I2 test results (Higgins 2003), they would have used a fixed‐effect analysis model; if the value of I2 had been between 50% and 75% they would have performed a random‐effects analysis. If the I2 values had been greater than 75%, they would not have considered it suitable to pool the studies together.
For each outcome for which the authors were able to extract suitable data, they constructed a forest plot to display effect estimates and 95% CIs using a fixed‐effect model of analysis.
Summary of findings and quality of the evidence
Sarah ‐ do you have any brief magic text? Have drafted the following text, is it ok?
In a post hoc change, and in line with latest Cochrane guidance, the authors have summarized the evidence in a summary of findings table (summary of findings Table for the main comparison). They have presented the primary outcomes lung function, HRCT and nutritional parameters along with the secondary outcomes of hospitalisations and cost of care after five years of follow‐up. The authors determined the quality of the evidence using the GRADE approach; and downgraded evidence for most outcomes as for those the study had low statistical power and more research is needed to provide definitive answers. High quality evidence was available for effect of BAL directed therapy on radiological features (HRCT) and cost of care.
Subgroup analysis and investigation of heterogeneity
In future, if the authors include sufficient studies (at least 10), they plan to undertake the following subgroup analyses:
-
age groups: 0 to 5 years, 6 to 16 years and 17 years and above;
-
chronic or intermittent isolation of P. aeruginosa versus no P. aeruginosa;
-
different methods of sampling, e.g. BAL versus PBB or sputum culture versus throat swab.
Sensitivity analysis
In future, if the authors include sufficient studies (at least 10), they plan to undertake the following sensitivity analyses:
-
to analyse the effect of bias including effects of sequence generation, allocation concealment, intention‐to‐treat analysis and reporting bias which are not resolved after contacting the authors;
-
to assess the differences between fixed‐effect and random‐effects analysis on the results.
Results
Description of studies
Results of the search
The searches identified a total of 29 references to nine separate studies. Of these, only one study (nine references) met our inclusion criteria and we excluded eight studies (20 references). The process of assessing the search results is shown in the PRISMA diagram (Figure 1).
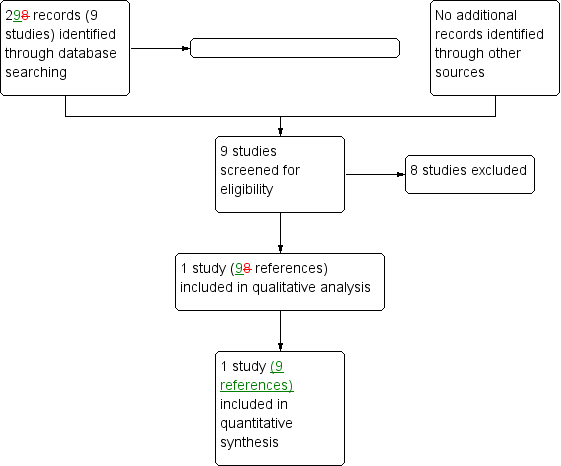
Study flow diagram.
Included studies
Methods
The only included study was a multicentre, randomized controlled study of parallel design (Wainwright 2011). This study was conducted across eight CF centres in Australia and New Zealand and recruited infants between June 1999 to April 2005. After consent, the participants were randomly assigned in a 1:1 ratio to two groups. The study was completed in December 2009.
Participants
Infants younger than six months, diagnosed with CF through the newborn screening program with a confirmed diagnosis of classic CF (two of the following: two CF mutations; sweat chloride level over 60 mEq/L; pancreatic insufficiency; or meconium ileus) were eligible for inclusion.
Of the total 267 infants eligible for study, 170 infants were recruited. Eighty‐four infants were randomized to receive BAL‐directed therapy and 86 randomized to receive standard therapy. All the participants randomized to the BAL group received the intended therapy, however, 4 out of 84 participants did not complete the study and were excluded from the primary analysis. Of the 86 participants randomized to standard therapy group, 84 participants received the intended therapy and 77 of these (92%) completed the study to be included in the primary analysis.
The mean (SD) age of the participants was 3.8 (1.6) months in the BAL‐directed therapy group and 3.7 (1.7) months in the standard therapy group. In both the groups, 44 participants were male. Mean (SD) weight at enrolment was 5.7 (1.40) kg in BAL‐directed therapy group and 5.6 (1.5) kg in the standard therapy group. The number of participants with homozygous ΔF508 mutation was 57 (68%) in the BAL‐directed therapy group and 54 (64%) in the standard therapy group. The number of participants with pancreatic insufficiency was 73 (87%) in the BAL‐directed therapy group and 71 (85%) in the standard therapy group. The number of participants with meconium ileus was 17 (20%) in the BAL‐directed therapy group and 16 (19%) in the standard therapy group. The number of participants born pre‐term (under 37 week gestation) was eight (10%) in the BAL‐directed therapy group and nine (11%) in the standard therapy group. History of exposure to tobacco smoke during pregnancy was present in 22 (26%) and 13 (15%) participants from the BAL‐directed therapy group and standard therapy group respectively. History of concurrent smoking in the household was present in 30 (36%) participants in the BAL‐directed therapy and 23 (28%) of participants from standard therapy group.
Interventions
Participants received treatment of pulmonary exacerbations directed either by results of BAL or according to standard policy of treatment (based on clinical features and oropharyngeal cultures).
The standard therapy included oropharyngeal swabs at following time points:
-
when a child was unwell with a change in respiratory symptoms from baseline (pulmonary exacerbation);
-
at the end of the antibiotic eradication treatment for P. aeruginosa.
In addition, the participants in the BAL‐directed therapy groups also underwent BAL at following times:
-
before six months of age when well;
-
when hospitalised for a pulmonary exacerbation (unwell with change in respiratory symptoms from baseline);
-
if P. aeruginosa was cultured from oropharyngeal specimens;
-
following P. aeruginosa eradication therapy.
At five years of age, all the participants underwent BAL, HRCT scan (to compute CF‐CT scores), pulmonary function testing and anthropometric assessments.
Outcomes
The primary outcome measures were prevalence of P. aeruginosa infection (defined as greater than or equal to 103 colony forming units (CFU)/ml) in the BAL cultures) and evidence of structural lung disease assessed by total CF‐CT score (as percentage of a maximum score) on HRCT at age five years. Secondary outcome measures, also assessed at five years age, included z scores for weight, height and BMI; lung function parameters; CF‐CT components; respiratory exacerbation rate; number and duration of hospitalizations for respiratory exacerbations not associated with P. aeruginosa infection; number of episodes of P. aeruginosa infection per child per year; and final BAL microbiology and inflammatory indices.
Excluded studies
We excluded eight studies (20 references) after screening. Four studies were excluded as they were investigating a different intervention which was not relevant to this review: cough plates (Jyothish 2005; Maiya 2004); induced sputum (Chmiel 2007); and throat swabs and nasopharyngeal suction (Taylor 2006). One study looked at the effect of dornase alfa on the surface of the lungs using BAL (Paul 2004) and one study was to establish levels of tobramycin, not a comparison of therapy depending on sampling technique (Rosenfeld 2006). One study compared sputum induction, BAL and expectorated sputum to identify pathogens, but did not lead to a comparison of treatment (Henig 2001). The remaining study was excluded as it had a cross‐over design to compare inflammatory marker in the samples obtained by sputum induction and bronchoscopy but did not follow any comparison of treatment (McGarvey 2002).
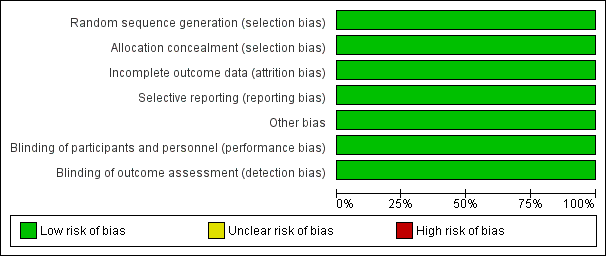
Risk of bias in included studies
A summary of the risk of bias for the included study is shown in the figures (Figure 2).
Risk of bias graph: review authors' judgements about each risk of bias item presented as percentages across all included studies.
Allocation
Sequence generation
A central computer‐generated sequence was used to randomise the participants to either group in blocks that were stratified by CF centre and gender. A randomisation number was generated centrally, away from the local investigators. This domain was judged to have a low risk of bias.
Concealment of allocation
The randomization key was concealed and held remotely; and allocation was disclosed on the telephone after confirmation of recruitment to the study. The procedure was judged to have low risk of bias.
Blinding
The participants and the personnel were not blinded to the randomization; however, the risk of bias was judged to be low for this item because the primary outcome measures were unlikely to be influenced by the lack of blinding. These were evaluated by the assessors who were blinded to treatment allocation and were not directly involved in participant care (a microbiologist assessed BAL and an expert scientist scored the HRCT).
Incomplete outcome data
Although, the study was set up to be analysed on an intention‐to‐treat basis, the primary analysis was based only on the participants who provided final outcome data, analysed according to randomized groups. The risk of bias was considered moderate to low as less than 10% of the data were missing, and the number of participants with missing outcome data and the reasons of their exclusion were balanced across both treatment arms. In the BAL‐directed therapy group, 4 out of 84 participants did not complete the study (three protocol violations and one withdrawal); and of the 86 participants randomized to standard therapy group, 77 participants (92%) completed the study (four protocol violations and three withdrawals).
Selective reporting
The outcomes reported in the study protocol were compared with the reported results. Only the difference in cost between treatment arms was not reported; however, study investigators informed us that economic analysis would be reported in a separate paper in future. The review will monitor published literature for this promised publication.
Other potential sources of bias
No other potential sources of bias could be identified for the study.
Effects of interventions
Primary outcomes
1. Lung function
a. conventional spirometry
i. per cent predicted FEV1 (change and absolute values in litres)
Wainwright reported z score for FEV1 and no significant difference was found between the groups for this outcome, MD ‐0.15 (95% CI ‐0.54 to 0.24) (Analysis 1.1) (summary of findings Table for the main comparison).
ii. per cent predicted FVC (change and absolute values in litres)
The study reported z score for FVC. There was no significant difference between the groups, MD ‐0.05 (95% CI ‐0.44 to 0.34) (Analysis 1.2) (summary of findings Table for the main comparison).
b. infant lung function‐squeeze
i. per cent predicted FEV0.5, FEF25‐75 and FEF75 (changes and absolute values in litres)
Infant lung function was not assessed in this study.
ii. per cent predicted FVC (change and absolute values in litres)
Infant lung function was not assessed in this study.
c. lung clearance index (LCI)
This outcome was not measured in this study.
2. HRCT appearances
Wainwright scored HRCT appearances according to an upgraded version of Brody‐II score (referred to as CF‐CT score) (Wainwright 2011). Five different components were used to calculate the total CF‐CT score; four were calculated on inspiratory images (bronchiectasis score, parenchymal disease score, mucous plugging score, airway wall thickening score) and air trapping score was assessed on expiratory images. The results were reported as percentages of the total possible score for each component and for the maximum total score. The components were scored according to the distribution of changes into the following groups: 0%, 0% to 5% and more than 5% for inspiratory images; 0%, 0% to 20% and more than 20% for expiratory images.
There was no significant difference between the groups for total CF‐CT score, MD 0.19 (95% CI ‐0.93 to 1.31) (Analysis 1.3) (summary of findings Table for the main comparison). The scores across different components did not show any significant difference between the two groups with the risk of having a score of more than 5% for inspiratory images and more than 20% for expiratory images being the following: bronchiectasis score, MD ‐0.10 (95% CI ‐1.53 to 1.33); parenchymal disease score, MD ‐0.49 (95% CI ‐1.36 to 0.38); mucous plugging score, MD 1.38 (95% CI ‐0.36 to 3.12); airway wall thickening score, MD 0.71 (95% CI ‐0.16 to 1.58); air trapping score, MD 0.43 (95% CI ‐4.82 to 5.68) (Analysis 1.4).
3. Nutritional parameters
a. weight (in kg or percentile)
Wainwright reported z score for weight (Wainwright 2011). There was no significant difference between the groups, MD 0.06 (95% CI ‐0.21 to 0.33) (Analysis 1.5) (summary of findings Table for the main comparison).
b. BMI percentile
The study found no significant difference in the z score for BMI between the two groups, MD 0.02 ( 95% CI ‐0.26 to 0.30) (Analysis 1.6) (summary of findings Table for the main comparison).
Secondary outcomes
1. Number of positive isolates per child per year of follow up
a. P. aeruginosa
The number of positive isolates of P. aeruginosa per participant per year of follow up was reported using the intervention specific to the randomizations, i.e. using BAL cultures for the BAL‐directed group and oropharyngeal cultures for the standard therapy group. There was no significant difference between the groups, RR 0.77 (95% CI 0.52 to 1.16) (Analysis 1.7).
At age five years, P. aeruginosa infection was diagnosed in BAL of 8 out of 79 (10%) participants and 9 out of 76 (12%) participants from BAL directed therapy group and standard therapy groups respectively, RR 0.86 (95% CI 0.35 to 2.10) (Analysis 1.8). We conducted a sensitivity analysis after including the missing data in the respective groups and assessed the influence on P. aeruginosa prevalence considering hypothetical situations where the risk of excluded participants being positive at five years was 40% for the BAL‐directed therapy group and and 5% for the standard therapy group (Analysis 1.9) and vice versa (Analysis 1.10). In both cases the result was not significant, RR 1.11 (95% CI 0.48 to 2.60) and RR 0.67 (95% CI 0.29 to 1.55) respectively.
b. Other organisms
Data specific to the number of positive isolates per participant per year of follow up were not available for S. aureus, H. influenza, B. cepacia, S maltophilia, A. xylosidans, non‐tuberculous mycobacteria, aspergillus species or any other organisms.
2. Clearance of the organism from the cultures
There was no significant difference between the two groups in the proportion of children who were cleared of P. aeruginosa infection following one or two courses of eradication treatment, RR 1.08 (95% CI 0.96 to 1.21) (Wainwright 2011) (Analysis 1.11).
3. Time to first infection with P. aeruginosa
There was no statistically significant difference in the age of first acquisition of P. aeruginosa infection between the two groups, RR 0.81 (95% CI 0.53 to 1.23) (Analysis 1.12).
4. Time to chronic infection
a. with P. aeruginosa
There was no statistical analysis of the number of children who developed chronic infection in either group. Only one child in the BAL‐directed therapy group developed chronic infection (confirmation by BAL) at 56 months of age. In the standard therapy group, four children developed chronic infection (confirmed by cough swab) between 33 months and 61 months of age (however, the BAL at five years age was negative for P. aeruginosa in all four participants) (Wainwright 2011).
b. with S. aureus
Data specific to the time to chronic infection with S. aureus were not available in this study.
5. Complications and adverse effects
At present data are not available for adverse events except those relating to BAL or use of medications. These data were collected and have been recorded, but not yet published. The review authors have requested the relevant information from the statisticians working on the included study and will include these in a future update of the review.
A number of adverse events could be attributed to both bronchoscopy and general anaesthesia. Significant clinical deterioration was noted during or following the BAL in 25 of 524 procedures (4.8%). During the procedure, seven children developed haemoglobin desaturation of less than 90% which lasted for more than 60 seconds and needed intervention. Post‐operatively, six children required supplemental oxygen, one required noninvasive ventilation and three developed stridor. The most common adverse event was transient worsening of cough noted in 96 children after 151 of 524 procedures (29%); however, this was a temporary effect and did not lead to hospitalizations. Fever with a temperature higher than 38.5°C which occurred within 24 hours of BAL was reported following 40 (7.6%) procedures and fever with a temperature below 38.5°C following 52 (9.9%) procedures. In the post‐BAL period, 12 (2.3%) participants required unplanned hospital admissions. Contamination of bronchoscope was reported on two incidences. Overall, the procedure was well‐tolerated with mild adverse effects to the participants; however, these were in addition to the inconvenience associated with hospitalizations and fasting pre‐ and post‐procedure.
6. QoL
Data specific to QoL were not available for this study.
7. Hospitalisations
a. number of hospitalisations per participant per year
The total number of hospital admissions per participant per year were higher in the BAL‐directed therapy group compared to the standard therapy group, RR 1.40 (95% CI 1.08 to 1.82) (Analysis 1.13) (data not published but provided by the authors) (summary of findings Table for the main comparison). For non‐P.aeruginosa exacerbations, the children in BAL‐directed therapy group had 218 hospitalisations (0.57 per person‐year), whereas the children in the standard therapy group had fewer admissions reported as 140 admissions (0.37 per person‐year), RR 1.52 (95% CI 0.98 to 2.35) (Analysis 1.14).
b. days as inpatient per participant per year
Mean duration of hospital admissions for non‐P.aeruginosa respiratory exacerbations was reported to be significantly shorter in the BAL‐directed therapy group compared to standard therapy, MD ‐3.50 days (95% CI ‐5.67 to ‐1.33) (Analysis 1.15). However, there was no significant difference between the hospital admission days per participant per year for each group, risk difference 0.08 (95% CI ‐3.31 to 3.47) (Analysis 1.16) (data not published, provided by the authors).
c. cost of care
There was no difference in the total cost of care for the children in each group over the study duration (five years), MD 1902.00 Australian dollars (AUD) (95% CI 27508.98 to 31312.98) (Analysis 1.17). There was no difference in the total cost of hospital admissions per child over the five‐year study duration (Wainwright 2011), MD ‐9288.00 AUD (95% CI 34996.37 to 16420.37) (Analysis 1.18) (summary of findings Table for the main comparison).
8. Number of courses of antibiotics prescribed per participant per year (not including prophylactic antibiotics)
a. intravenous
Data for the number of courses of intravenous antibiotics prescribed per participant per year were not available.
b. oral
Data for the number of courses of oral antibiotics prescribed per participant per year were not available.
9. Number of pulmonary exacerbations (requiring oral or intravenous antibiotics) per participant per year
There was no significant difference in the number of pulmonary exacerbations diagnosed in either group, RR 1.01 (95% CI 0.85 to 1.19) (Analysis 1.19).
Discussion
Summary of main results
Our review included one randomized controlled study comparing outcomes following BAL‐directed therapy with standard therapy. At age five years, there was no clear benefit of BAL‐directed therapy on lung function or nutritional parameters; and there was no significant difference between the two groups regarding evidence of structural lung disease diagnosed by HRCT scan. The number of positive isolates for P. aeruginosa per child per year as well as the age at development of first infection were similar in the two groups. In addition, the overall morbidity concerning the number of pulmonary exacerbations was similar and there was no difference in the proportion of participants who cleared the infection after one or two courses of eradication therapy. A higher number of hospital admissions in the BAL‐directed therapy group was balanced by the shorter duration of hospitalisations in this group. There was no difference in the overall cost of care and cost of hospital admissions.
Overall completeness and applicability of evidence
As only one study could be included in the review, a meta‐analysis could not be conducted but this study provided highly relevant evidence to answer the review question. Although, no evidence was available for adults with CF, this study did include infants and young children, which is the group mostly unable to provide sputum samples. Moderate quality evidence was available for most outcomes; however, regarding the microbiological outcomes, we should be aware that two different treatment goals were compared (e.g. clearance of P. aeruginosa from throat swab versus clearance from BAL). None of the four children who were defined to have developed chronic P. aeruginosa infection by sampling via throat swabs, had the organism isolated from the BAL at the five‐year time‐point. While this highlights the difference in sensitivities of the methods involved, it also indicates that we should be relying more on highly sensitive clinical parameters rather than microbiological outcomes for such studies. Most adults who do not expectorate spontaneously and many, quite young, children respond to hypertonic saline to provide satisfactory sputum samples. This process is less invasive as well as more acceptable than repeated BAL. No randomized controlled studies were available which compared treatment outcomes following induced sputum with bronchoscopy and BAL from single or multiple lobes. The available evidence was mainly relevant to P. aeruginosa infection. This is the most significant infection associated with CF lung disease, however, many other organisms are also increasingly being implicated in the disease progression. No study is available regarding the effect of the intervention on other organisms.
As there is no difference in the number of pulmonary exacerbations and the number of P. aeruginosa isolates per participant per year between the two treatment arms, the significant difference observed with regards to the number and duration of hospital admissions appears to be mainly protocol‐driven and related to short admissions for BALs at different stages of the study. Data on the economic impact of conducting repeated bronchoscopies and frequent hospital admissions, however, did not show any difference between the two groups.
Quality of the evidence
The main strengths of the study were the quality of methods and also the low attrition rate (despite a prolonged follow‐up period and invasive intervention procedure). Though the study was set up for analysis on an intention‐to‐treat basis, it was analysed on an available‐case basis as the outcome data were available for more than 90% of participants. A sensitivity analysis for prevalence of P. aeruginosa at five years of age, based on best and worst‐case scenarios, led to similar results. The prevalence of P. aeruginosa and the establishment of chronic infection are clinically relevant outcomes considering the influence that chronic infection with this organism can have on progressive CF lung disease. However, this study highlights the difficulties with prolonged longitudinal studies, particularly when the outlook is changing consistently as with CF.
The main limitation of the study was its reduced statistical power for its primary microbiological outcome. The study was designed with an anticipated prevalence of P. aeruginosa infection at five years of age to be 30% in the control group. The sample size of the study was revised during the study; the current sample size was predicted to provide adequate statistical power for HRCT scoring and prevalence of P. aeruginosa observed during the middle of the study. However, the latter was found to be only 12% at five years age. Many other centres have also reported reduced prevalence of P. aeruginosa infection and a delay in the onset of chronic infection following improved management practices and the institution of early eradication therapy against P. aeruginosa. Defining time to onset of chronic infection was difficult in this study as the comparison was between different methods of diagnosis, i.e. BAL‐based cultures versus oropharyngeal cultures. The participants diagnosed with chronic infection (by using only oropharyngeal cultures to define it) were very low in number, too low to allow any meaningful comparison; only one participant in the BAL‐directed therapy group developed chronic infection compared to four in the standard therapy group. The overall quality of evidence for the key parameters was graded as moderate, except HRCT scoring and cost of care analysis, which was graded as high quality (summary of findings Table for the main comparison).
Only 64% of the eligible participants could be recruited to the study; however, the age and sex distribution of the eligible participants who could not be enrolled in the study was similar to those who participated. In addition, the prevalence of bronchiectasis in the study participants was similar to that reported in other parts of Australia. These points suggest generalizability of the results to the Australian CF population.
A crucial point that can act as a confounding factor while carrying out multicentre studies is the practice of different treatment protocols at different centres. As the issue of an effect of anti‐staphylococcal prophylaxis on acquisition of P. aeruginosa infection is not yet resolved, it is important to mention that participants from three of the eight centres were using oral flucloxacillin prophylactic therapy until their first birthday. However, this study randomized and stratified the participants by site to equalize the bias for both the groups, hence the aforementioned difference is unlikely in practice to have affected the validity of the comparison.
A very detailed economic analysis of the cost of care for participants in the two groups was presented which took into account various aspects such as pharmaceutical cost (both hospital and home treatment), cost of procedures and investigations, cost of hospital admission and professional attendances. Acknowledging the difficulties of obtaining such large amount of data from various centres for a period spanning half a decade, a potential confounding factor in the economic analysis was the use of assumption and estimates for costs of some aspects of care (such as cost of professional attendances or consultations from some centres). However, this was a small part of the overall picture and is likely to have been balanced over the two arms to some extent.
Potential biases in the review process
One of the review authors was also the lead author of the only included study. To avoid any influence of this fact on the interpretation of bias in the study, the remaining two review authors (KJ and AS) assessed the study for all potential sources of biases and agreed on the interpretations used to generate risk of bias graph and any related comments.
Agreements and disagreements with other studies or reviews
In many non‐randomized studies, bronchoscopy‐based cultures have been found to give a higher yield of microorganisms. However, this review, which is limited to the evidence from a single study raises several questions.
On the one hand, oropharyngeal cultures have been shown to have a low positive predictive value but a high negative predictive value for a lower airway P. aeruginosa infection. Does that imply that by taking oropharyngeal swabs more frequently, we are successful at ruling out positive cases while treating (or may be over‐treating) some people who are negative?
On the other hand, BAL has been described as a 'gold standard' method to diagnose lower airway infections. However, there is still no evidence‐based answer to the question of what constitutes an infection for a BAL culture and whether the presence of any number of organisms in BAL specimens from young people who are P. aeruginosa‐naïve should be considered as evidence of infection. This study used a cut‐off point of greater than 103organisms which was a balanced approach between the two extremes of detection of any organisms and greater than 105organisms. In children younger than five years age, the sensitivity of oropharyngeal cultures to detect lower respiratory infections improves as the lower limit of bacterial density to define a positive culture is increased (Rosenfeld 1999).
Could the lack of effect be related to the sensitivity of BAL for diagnosing lower airway infections? There is evidence to suggest that sampling two lobes for BAL is better than sampling only one; however, the microbiological yield is shown to improve further if samples are taken from all the lobes (Gilchrist 2011). It is uncertain whether this will make a real difference to the overall outcome for all people with CF. Analysis of the microbiology of airway cultures during pulmonary exacerbations suggests negative CF‐related bacterial cultures in a significant proportion of exacerbations. Does a negative BAL culture indicate no infection or signify the lack of ability to detect the complex range of organisms comprising the CF airway microbial community?
Eradication therapy for P. aeruginosa in CF is highly effective. To achieve still greater and more prolonged efficacy in eradication, more sensitive diagnostic tests for P. aeruginosa will be needed, particularly for children and individuals who do not produce sputum. The Wainwright study used HRCT score as one outcome measure, which is shown to be a highly sensitive parameter for detecting structural lung disease at the cost of increased radiation exposure. Though pre‐school children are able to provide reliable lung function results, the LCI detects abnormal lung function more readily compared to spirometry (Aurora 2005). It is shown to act in a complementary fashion to HRCT and can be a better alternative to spirometry to investigate early differences in lung function. However, even if a minor improvement in outcome was to be disclosed with these measures, it has to be enough to justify subjecting all patients to an invasive procedure with the potential risk of mild adverse effects.

Study flow diagram.

Risk of bias graph: review authors' judgements about each risk of bias item presented as percentages across all included studies.

Comparison 1 BAL‐directed therapy versus standard therapy, Outcome 1 Z score FEV1.

Comparison 1 BAL‐directed therapy versus standard therapy, Outcome 2 Z score FVC.
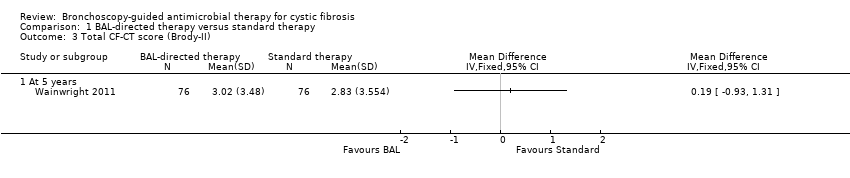
Comparison 1 BAL‐directed therapy versus standard therapy, Outcome 3 Total CF‐CT score (Brody‐II).

Comparison 1 BAL‐directed therapy versus standard therapy, Outcome 4 Individual CF‐CT scores (at 5 years).

Comparison 1 BAL‐directed therapy versus standard therapy, Outcome 5 Z score for weight.
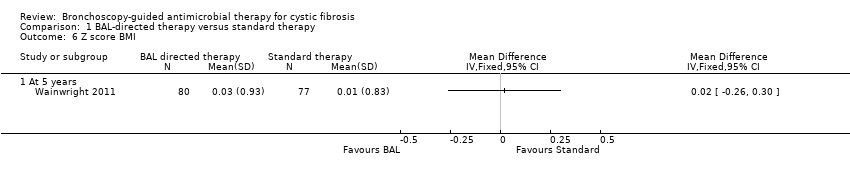
Comparison 1 BAL‐directed therapy versus standard therapy, Outcome 6 Z score BMI.

Comparison 1 BAL‐directed therapy versus standard therapy, Outcome 7 Positive P.aeruginosa isolates per patient per year.

Comparison 1 BAL‐directed therapy versus standard therapy, Outcome 8 Prevalence of P. aeruginosa in BAL at 5 years age.

Comparison 1 BAL‐directed therapy versus standard therapy, Outcome 9 Sensitivity analysis ‐ Prevalence of P. aeruginosa in BAL at 5 years age (40% vs 5%).

Comparison 1 BAL‐directed therapy versus standard therapy, Outcome 10 Sensitivity analysis ‐ Prevalence of P. aeruginosa in BAL at 5 years age (5% vs 40%).

Comparison 1 BAL‐directed therapy versus standard therapy, Outcome 11 Clearance of P.aeruginosa after 1 or 2 eradication treatments.

Comparison 1 BAL‐directed therapy versus standard therapy, Outcome 12 Age at first acquisition of P. aeruginosa infection.

Comparison 1 BAL‐directed therapy versus standard therapy, Outcome 13 Number of hospital admissions per patient per year.

Comparison 1 BAL‐directed therapy versus standard therapy, Outcome 14 Number of hospitalizations per person per year due to non‐P. aeruginosa exacerbations.

Comparison 1 BAL‐directed therapy versus standard therapy, Outcome 15 Duration of hospital admissions due to non‐P.aeruginosa exacerbations.

Comparison 1 BAL‐directed therapy versus standard therapy, Outcome 16 Days as hospital inpatient per patient per year.

Comparison 1 BAL‐directed therapy versus standard therapy, Outcome 17 Total cost of care per participant (Australian Dollars).

Comparison 1 BAL‐directed therapy versus standard therapy, Outcome 18 Mean hospital admissions cost per patient.

Comparison 1 BAL‐directed therapy versus standard therapy, Outcome 19 Number of pulmonary exacerbations (requiring oral or intravenous antibiotics) per patient per year.
| BAL‐directed therapy versus standard therapy for cystic fibrosis | ||||||
| Patient or population: people with pulmonary exacerbations in cystic fibrosis | ||||||
| Outcomes | Illustrative comparative risks* (95% CI) | Relative effect | No of Participants | Quality of the evidence | Comments | |
| Assumed risk | Corresponding risk | |||||
| Standard therapy | BAL‐directed therapy | |||||
| Z score FEV1 | The mean z score for FEV1 in the standard therapy group was ‐0.41 (SD 1.23). | The mean z score FEV1 in the intervention group ‐0.56 (SD 1.25) that was 0.15 lower (0.54 lower to 0.24 higher) than the standard therapy group. | 157 | ⊕⊕⊕⊝ | FEV1 and FVC were measured using standard spirometer after bronchodilatation. The mean difference between the two groups represents the difference in the mean z scores for each parameter. Z scores for FEV1, FVC were calculated from British reference values (www.lungfunction.org/growinglungs). | |
| Z score FVC | The mean z score for FVC in the standard therapy group was 0.01 (SD 1.2). | The mean z score FVC in the intervention groups was ‐0.04 (SD 1.31) that was 0.05 higher (0.44 lower to 0.34 higher) than the standard therapy group. | 157 | ⊕⊕⊕⊝ | FEV1 and FVC were measured using standard spirometer after bronchodilatation. The mean difference between the two groups represents the difference in the mean z scores for each parameter. Z scores for FEV1, FVC were calculated from British reference values (www.lungfunction.org/growinglungs). | |
| HRCT score (Brody‐II) | The mean HRCT score in the standard therapy group was 2.83 (SD 3.5). | The mean HRCT score (Brody‐II) in the intervention group was 3.02 (SD 3.48) 0.19 higher (0.93 lower to 1.31 higher) than the standard therapy group. | 152 | ⊕⊕⊕⊕ | The study had adequate power to detect a difference in HRCT score. HRCT scans were assesses by an independent assessor who was blinded to subject allocation using an updated version of Brody‐II score. | |
| Z score for weight | The mean z score for weight was ‐0.21 (SD 0.82) in the standard therapy group. | The mean z score for weight in the intervention group was ‐0.15 that was 0.06 higher (0.21 lower to 0.33 higher) than the standard therapy group. | 157 | ⊕⊕⊕⊝ | The z scores for weight and BMI were calculated from the 2000 CDC Growth Reference Charts (http://cdc.gov/growthcharts). The mean difference between the two groups represents the difference in their z scores for each parameter. | |
| Z score BMI | The mean z score for BMI was 0.01 (SD 0.83) in the standard therapy group. | The mean z score BMI in the intervention group was 0.03 (SD0.93) that was 0.02 higher (0.26 lower to 0.30 higher) than the standard therapy group. | 157 | ⊕⊕⊕⊝ | The z scores for weight and BMI were calculated from the 2000 CDC Growth Reference Charts (http://cdc.gov/growthcharts). The mean difference between the two groups represents the difference in their z scores for each parameter. | |
| Number of hospitalizations per participant per year | The number of hospitalizations per participant per year was 1.08 in the standard therapy group. | The number of hospitalizations per participant per year in the intervention group was 1.52 that was 1.4 times higher (1.08 lower to 1.82 higher) than the standard therapy group. | 157 | ⊕⊕⊕⊝ | ||
| Overall cost of care per participant (AUD) Follow up: 5 years | The total cost of care for each participant was 90,958 AUD (SD 110,255) in the standard therapy group. | The total cost of care in the intervention group was 92,860 AUD (SD 73,378) that was 1902 AUD higher (27,508.98 lower to 31,312.98 higher) than the standard therapy group. | 157 (1 study) | ⊕⊕⊕⊕ | The cost of hospital admissions per participant over the total study duration in the intervention group was 9288 AUD lower in the intervention group (34,996.37 lower to 16,420.37 higher). | |
| *The basis for the assumed risk (e.g. the median control group risk across studies) is provided in footnotes. The corresponding risk (and its 95% confidence interval) is based on the assumed risk in the comparison group and the relative effect of the intervention (and its 95% CI). | ||||||
| GRADE Working Group grades of evidence | ||||||
| 1 The study had low statistical power and research is needed to provide definitive answers. | ||||||
| Outcome or subgroup title | No. of studies | No. of participants | Statistical method | Effect size |
| 1 Z score FEV1 Show forest plot | 1 | Mean Difference (IV, Fixed, 95% CI) | Totals not selected | |
| 1.1 At 5 years | 1 | Mean Difference (IV, Fixed, 95% CI) | 0.0 [0.0, 0.0] | |
| 2 Z score FVC Show forest plot | 1 | Mean Difference (IV, Fixed, 95% CI) | Totals not selected | |
| 2.1 At 5 years | 1 | Mean Difference (IV, Fixed, 95% CI) | 0.0 [0.0, 0.0] | |
| 3 Total CF‐CT score (Brody‐II) Show forest plot | 1 | Mean Difference (IV, Fixed, 95% CI) | Totals not selected | |
| 3.1 At 5 years | 1 | Mean Difference (IV, Fixed, 95% CI) | 0.0 [0.0, 0.0] | |
| 4 Individual CF‐CT scores (at 5 years) Show forest plot | 1 | Mean Difference (IV, Fixed, 95% CI) | Totals not selected | |
| 4.1 Bronchiectstasis | 1 | Mean Difference (IV, Fixed, 95% CI) | 0.0 [0.0, 0.0] | |
| 4.2 Parencymal disease | 1 | Mean Difference (IV, Fixed, 95% CI) | 0.0 [0.0, 0.0] | |
| 4.3 Mucus plugging | 1 | Mean Difference (IV, Fixed, 95% CI) | 0.0 [0.0, 0.0] | |
| 4.4 Airway wall thickening | 1 | Mean Difference (IV, Fixed, 95% CI) | 0.0 [0.0, 0.0] | |
| 4.5 Air trapping | 1 | Mean Difference (IV, Fixed, 95% CI) | 0.0 [0.0, 0.0] | |
| 5 Z score for weight Show forest plot | 1 | Mean Difference (IV, Fixed, 95% CI) | Totals not selected | |
| 5.1 At 5 years | 1 | Mean Difference (IV, Fixed, 95% CI) | 0.0 [0.0, 0.0] | |
| 6 Z score BMI Show forest plot | 1 | Mean Difference (IV, Fixed, 95% CI) | Totals not selected | |
| 6.1 At 5 years | 1 | Mean Difference (IV, Fixed, 95% CI) | 0.0 [0.0, 0.0] | |
| 7 Positive P.aeruginosa isolates per patient per year Show forest plot | 1 | Rate Ratio (Fixed, 95% CI) | Totals not selected | |
| 7.1 At 5 years | 1 | Rate Ratio (Fixed, 95% CI) | 0.0 [0.0, 0.0] | |
| 8 Prevalence of P. aeruginosa in BAL at 5 years age Show forest plot | 1 | Risk Ratio (M‐H, Fixed, 95% CI) | Totals not selected | |
| 9 Sensitivity analysis ‐ Prevalence of P. aeruginosa in BAL at 5 years age (40% vs 5%) Show forest plot | 1 | Risk Ratio (M‐H, Fixed, 95% CI) | Totals not selected | |
| 10 Sensitivity analysis ‐ Prevalence of P. aeruginosa in BAL at 5 years age (5% vs 40%) Show forest plot | 1 | Risk Ratio (M‐H, Fixed, 95% CI) | Totals not selected | |
| 11 Clearance of P.aeruginosa after 1 or 2 eradication treatments Show forest plot | 1 | Risk Ratio (M‐H, Fixed, 95% CI) | Totals not selected | |
| 11.1 At 5 years | 1 | Risk Ratio (M‐H, Fixed, 95% CI) | 0.0 [0.0, 0.0] | |
| 12 Age at first acquisition of P. aeruginosa infection Show forest plot | 1 | Rate Ratio (Fixed, 95% CI) | Totals not selected | |
| 12.1 At 5 years | 1 | Rate Ratio (Fixed, 95% CI) | 0.0 [0.0, 0.0] | |
| 13 Number of hospital admissions per patient per year Show forest plot | 1 | Rate Ratio (Fixed, 95% CI) | Totals not selected | |
| 13.1 At 5 years | 1 | Rate Ratio (Fixed, 95% CI) | 0.0 [0.0, 0.0] | |
| 14 Number of hospitalizations per person per year due to non‐P. aeruginosa exacerbations Show forest plot | 1 | Rate Ratio (Fixed, 95% CI) | Totals not selected | |
| 14.1 At 5 years | 1 | Rate Ratio (Fixed, 95% CI) | 0.0 [0.0, 0.0] | |
| 15 Duration of hospital admissions due to non‐P.aeruginosa exacerbations Show forest plot | 1 | Mean Difference (IV, Fixed, 95% CI) | Totals not selected | |
| 15.1 New Subgroup | 1 | Mean Difference (IV, Fixed, 95% CI) | 0.0 [0.0, 0.0] | |
| 16 Days as hospital inpatient per patient per year Show forest plot | 1 | Risk Difference (Fixed, 95% CI) | Totals not selected | |
| 16.1 New Subgroup | 1 | Risk Difference (Fixed, 95% CI) | 0.0 [0.0, 0.0] | |
| 17 Total cost of care per participant (Australian Dollars) Show forest plot | 1 | Mean Difference (IV, Fixed, 95% CI) | Totals not selected | |
| 18 Mean hospital admissions cost per patient Show forest plot | 1 | Mean Difference (IV, Fixed, 95% CI) | Totals not selected | |
| 19 Number of pulmonary exacerbations (requiring oral or intravenous antibiotics) per patient per year Show forest plot | 1 | Rate Ratio (Fixed, 95% CI) | Totals not selected | |
| 19.1 At 5 years | 1 | Rate Ratio (Fixed, 95% CI) | 0.0 [0.0, 0.0] | |