การผ่าตัดรังไข่เพื่อลดอาการในสตรีที่มีภาวะถุงน้ำรังไข่หลายใบ
บทคัดย่อ
บทนำ
ภาวะถุงน้ำรังไข่หลายใบ (PCOS) เป็นความผิดปกติทางต่อมไร้ท่อที่พบได้บ่อย พบในสตรีประมาณ 1 ใน 10 ราย PCOS วินิจฉัยโดยใช้เกณฑ์ สองในสามข้อของลักษณะดังนี้: oligo‐ or anovulation, clinical or biochemical hyperandrogenism หรือทั้งสองอย่าง, หรือลักษณะ polycystic ovaries จากการทำอัลตราซาวน์
สตรีที่มีภาวะ PCOS มีปัญหาสุขภาพที่หลากหลาย ประกอบด้วยความไม่สม่ำเสมอของรอบประจำเดือน ภาวะขนขึ้นและสิว และภาวะมีบุตรยาก ผลกระทบต่อสุขภาพในระยะยาว ประกอบด้วยความเสี่ยงที่เพิ่มขึ้นของโรคหัวใจ เบาหวาน และการเกิดเยื่อบุโพรงมดลูกผิดปกติก่อนเป็นมะเร็ง
วัตถุประสงค์
เพื่อประเมินประสิทธิภาพและผลกระทบจากการผ่าตัดรังไข่เพื่อบรรเทาอาการของภาวะขนขึ้น สิว และประจำเดือนผิดปกติในสตรีที่มี PCOS
วิธีการสืบค้น
ผู้ทบทวนวรรณกรรมนี้ได้ค้นฐานข้อมูล Cochrane Gynaecology and Fertility Group specialized register, CENTRAL, MEDLINE, Embase and PsycINFO (from inception to 17 October 2016) และยังได้ handsearched เอกสารอ้างอิง วิจัยที่กำลังอยู่ระหว่างศึกษา และงานประชุม
เกณฑ์การคัดเลือก
เราได้รวบรวมการศึกษา RCTs ในสตรีที่ได้รับการผ่าตัด ovarian drilling เทียบกับไม่รักษา รักษาด้วยยา หรือการผ่าตัดอื่นๆสำหรับรักษาอาการ PCOS
การรวบรวมและวิเคราะห์ข้อมูล
เราใช้ระเบียบวิธีวิจัยมาตรฐานในการดำเนินการศึกษาตาม Cochrane วัตถุประสงค์หลักของการศึกษาคือ ความสม่ำเสมอของรอบประจำเดือนที่ดีขึ้น และอาการที่เกิดจากฮอร์โมนเพศชายที่ลดลง (ภาวะขนขึ้น,สิว); วัตถุประสงค์รองคือ ผลกระทบจากการรักษา การเปลี่ยนแปลงของดัชนีมวลกาย (BMI) รอบเอว ระดับฮอร์โมนเพศชาย การเปลี่ยนแปลงของระบบเมตาบอลิสึม และคุณภาพชีวิต เราได้ประเมินคุณภาพของหลักฐานที่ได้โดยวิธีการของเกรด (GRADE)
ผลการวิจัย
เรารวบรวม 22 RCTs (สตรี 2278 คน) ซึ่งผู้เข้าร่วมวิจัยมีภาวะ PCOS และอาการของสิว ขนขึ้น หรือรอบประจำเดือนที่ไม่สม่ำเสมอ ทุกงานวิจัยมีการผ่าตัด LOD เป็นหนึ่งในการรักษา
มีสองงานวิจัยบอกแหล่งทุนสนับสนุน (Farquhar 2002 ‐ supported in part by the Auckland Medical Research Foundation; Sarouri 2015 ‐ the authors thank the Vice Chancellor for Research of Guilan University of Medical Sciences for funding this project)
คุณภาพของงานวิจัยอยู่ในระดับปานกลางถึงต่ำ (very low to moderate quality) ข้อจำกัดหลักคือ imprecision ที่สัมพันธ์กับจำนวนงานศึกษาวิจัยที่น้อย inconsistency และ risk of bias ที่เกิดจากการไม่สามารถปกปิดผู้เข้าร่วมงานวิจัยได้ การศึกษาวิจัยมีจำนวนที่น้อยเกินไปในการประเมิน risk of publication bias
ความสม่ำเสมอของรอบประจำเดือน
มีสองงานวิจัยเปรียบเทียบระหว่าง การผ่าตัด LOD กับ ยา metformin (n=226) แต่ไม่สามารถสรุปเกี่ยวกับผลต่อความสม่ำเสมอของรอบประจำเดือนได้ เนื่องจากผลการศึกษาไม่สอดคล้องกัน ดูเหมือนว่า มีความแตกต่างที่น้อยมากหรือไม่ต่างกันในอัตราของสตรีที่มีรอบประจำเดือนที่สม่ำเสมอขึ้น เมื่อเปรียบเทียบ การผ่าตัด LOD กับการใช้ยาอื่นๆ คือ metformin+clomiphene (OR 1.02, 95% CI 0.64 to 1.64, การศึกษา 2เรื่อง สตรี, 332 คน, I2= 13% หลักฐานคุณภาพต่ำ), letrozole (OR 1.08, 95% CI 0.64 ถึง 1.84, การศึกษา 1 เรื่อง, สตรี 260 คน หลักฐานคุณภาพต่ำ), หรือ metformin + letrozole (OR 0.95, 95% CI 0.49 ถึง 1.81, การศึกษา 1 เรื่อง, สตรี 146 คน หลักฐานคุณภาพต่ำ) อย่างไรก็ดี, มีหนึ่งงานวิจัยรายงานว่า การผ่าตัด LOD เหนือกว่ายา gonadotrophin (OR 19.2, 95% CI 3.17 to 116.45, การศึกษา 1 เรื่อง สตรี 35 คน หลักฐานคุรภาพต่ำมาก)
ดูเหมือนว่า มีความแตกต่างที่น้อยมากหรือไม่ต่างกันในอัตราของสตรีที่มีรอบประจำเดือนที่สม่ำเสมอขึ้น เมื่อการผ่าตัด LOD โดยใช้จี้ unipolar ของรังไข่ทั้งสองข้าง เปรียบเทียบกับข้างเดียว (OR 1.51, 95% CI 0.62 ถึง 3.71, การศึกษา 2 เรื่อง, สตรี 104 คน I2= 0%, หลักฐานคุณภาพปานกลาง) เทียบกับ transvaginal ultrasound‐guided LOD (OR 1.23, 95% CI 0.64 ถึง 2.37, การศึกษา 1 เรื่อง สตรี 147 คน หลักฐานคุณภาพต่ำ) เทียบกับ LOD ซึ่งปรับพลังงานของจี้ให้สอดคล้องกับขนาดของรังไข่ (OR 0.42, 95% CI 0.16 ถึง 1.14, การศึกษา 1 เรื่อง สตรี 115 คน, หลักฐานคุณภาพต่ำ) หรือเมื่อเปรียบเทียบกับการผ่าตัด LOD โดยใช้จี้ bipolar (OR 1.00, 95% CI 0.05 ถึง 18.57, การศึกษา 1 เรื่อง สตรี 18 คน หลักฐานคุณภาพต่ำ)
การผ่าตัดโดยเจาะรูรังไข่สี่ หรือ ห้าตำแหน่งต่อหนึ่งข้างอาจจะเพิ่มสัดส่วนของสตรีที่มีความสม่ำเสมอของรอบประจำเดือนมากขึ้นเมื่อเทียบกับ สองตำแหน่งหรือน้อยกว่านั้น (OR 16.04, 95% CI 4.19 ถึง 61.34, การศึกษา 2 เรื่อง สตรี 73 คน, I 2 = 0% หลักฐานคุณภาพต่ำ)
อาการจากฮอร์โมนเพศชาย
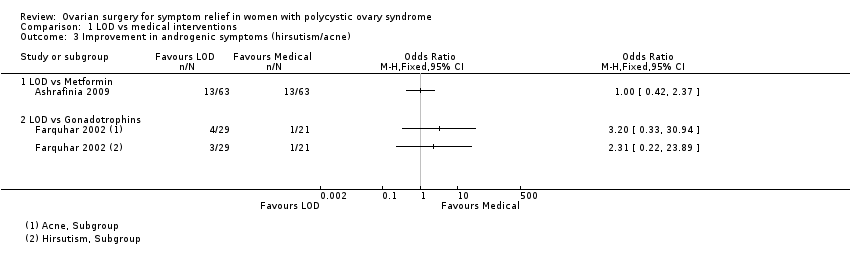
ดูเหมือนว่า มีความแตกต่างที่น้อยมากหรือไม่ต่างกันในการทำให้อาการจากฮอร์โมนเพศชายดีขึ้น เมื่อเปรียบเทียบการผ่าตัด LOD กับ metformin (OR 1.00, 95% CI 0.42 ถึง 2.37, การศึกษา 1 เรื่อง สตรี 126 คน หลักฐานคุณภาพปานกลาง) หรือกับ gonadotrophins; ภาวะสิว(OR 3.20, 95% CI 0.33 ถึง 30.94 การศึกษา 1 เรื่อง สตรี 25 คน หลักฐานคุณภาพต่ำ) ภาวะขนขึ้น (OR 2.31, 95% CI 0.22 ถึง 23.89 การศึกษา 1 เรื่อง สตรี 25 คน หลักฐานคุรภาพต่ำ)
ดูเหมือนว่า มีความแตกต่างที่น้อยมากหรือไม่ต่างกันในการทำให้อาการจากฮอร์โมนเพศชายดีขึ้น เมื่อเปรียบเทียบการผ่าตัด LOD กับ transvaginal ultrasound‐guided LOD, เมื่อดูเรื่องภาวะขนขึ้น (OR 1.09, 95% CI 0.30 ถึง 3.91 การศึกษา 1 เรื่อง สตรี 39 คน หลักฐานคุณภาพต่ำ) หรือ ภาวะสิว (OR 0.84, 95% CI 0.20 ถึง 3.50, การศึกษา 1 เรื่อง สตรี 31 คน คุณภาพหลักฐานต่ำ)
ผลข้างเคียง
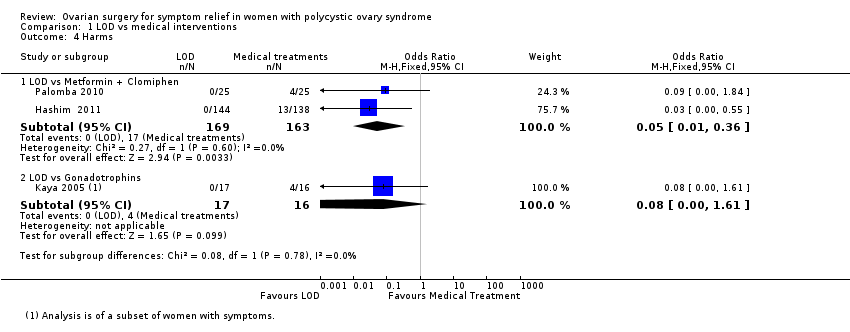
การผ่าตัด LOD มีผลข้างเคียงต่อระบบทางเดินอาหารน้อยกว่า เมื่อเทียบกับ metformin และ clomiphene (OR 0.05, 95% CI 0.01 ถึง 0.36 การศึกษา 2 เรื่อง สตรี 332 คน I2= 0% หลักฐานคุณภาพปานกลาง) มีหนึ่งการศึกษาวิจัยรายงานว่า ไม่มีความแตกต่างหรือมีน้อยมากในอัตราของการเกิดภาวะรังไข่ถูกกระตุ้นมากเกินไป (OHSS) ระหว่างการรักษาโดย LOD และ gonadotrophins (OR 0.08, 95% CI 0.00 ถึง 1.61 การศึกษา 1 เรื่อง สตรี 33 คน หลักฐานคุรภาพต่ำ)
การเกิดพังผืดจะน้อยกว่าเมื่อผ่าตัดด้วยวิธี transvaginal hydrolaparoscopy เมื่อเทียบกับ LOD (OR 0.10, 95% CI 0.05 ถึง 0.18 การศึกษา 1 เรื่อง สตรี 246 คน หลักฐานคุณภาพปานกลาง) ไม่มีความแตกต่างของการเกิดพังผืดหรือมีน้อยมาก เมื่อใช้พลังงานการจี้ในการทำ LOD ที่แตกต่างกัน เทียบกับมาตรฐานที่ใช้ (OR 0.96, 95% CI 0.32 ถึง 2.88 การศึกษา 1 เรื่อง สตรี 64 คน หลักฐานคุณภาพต่ำ) มีหนึ่งการศึกษาวิจัย (ในสตรี 44 คน) รายงานว่าในคนที่กลับมารับการผ่าตัดซ้ำ หลังทำ LOD ทั้งแบบมาตรฐานหรือข้างเดียว ไม่พบพังผืด
ข้อสรุปของผู้วิจัย
ไม่มีหลักฐานวิจัยที่ชัดเจน ซึี่งบ่งบอกว่าการผ่าตัดรังไข่ (LOD) ช่วยทำให้ความสม่ำเสมอของรอบประจำเดือนดีขึ้นหรือลดอาการที่เกิดจากฮอร์โมนเพศชายในสตรีที่มี PCOS, เมื่อเทียบกับการรักษาด้วยยาอื่นๆ การผ่าตัด LOD มีผลข้างเคียงต่อระบบทางเดินอาหารน้อยกว่า เมื่อเทียบกับ metformin และ clomiphene
และไม่มีหลักฐานวิจัยที่ชัดเจน ที่จะบอกความแตกต่างของประสิทธิภาพในการผ่าตัดที่แตกต่างวิธี ยกเว้นในเรื่องของการทำ LOD โดยเจาะรูรังไข่สี่ หรือ ห้าตำแหน่งต่อหนึ่งข้างอาจจะมีประสิทธิภาพที่ดีกว่าเมื่อเทียบกับ สองตำแหน่งหรือน้อยกว่านั้น มีการศึกษาวิจัยที่น้อยเกินไปที่จะเปรียบเทียบการผ่าตัด LOD กับการผ่าตัดวิธีอื่นๆ ถึงแม้จะมีหนึ่งการวิจัยที่สรุปว่า การเกิดพังผืดจะน้อยกว่าเมื่อผ่าตัดด้วยวิธี transvaginal hydrolaparoscopy เมื่อเทียบกับ LOD
มีหนึ่งการศึกษาวิจัยขนาดเล็กที่พบว่า การผ่าตัด LOD มีประโยชน์ในการทำให้รอบประจำเดือนสม่ำเสมอเมื่อเทียบกับ gonadotrophins อย่างไรก็ดี, gonadotrophins ไม่ค่อยถูกนำมาใช้ในกรณีนี้
PICO
ข้้อสรุปภาษาธรรมดา
การผ่าตัดรังไข่เพื่อลดอาการในสตรีที่มีภาวะถุงน้ำรังไข่หลายใบ
คำถามของการทบทวนวรรณกรรม
ผู้วิจัยได้ทบทวนหลักฐานการวิจัยเกี่ยวกับผลของการผ่าตัดรังไข่ต่ออาการของภาวะถุงน้ำรังไข่หลายใบ (PCOS) เราพบ 22 การศึกษาที่เปรียบเทียบการรักษาโดยวิธีผ่าตัด และไม่ผ่าตัด และรูปแบบต่างๆของเทคนิคการผ่าตัด ตัวชี้วัดหลักที่ศึกษาคือ ความสม่ำเสมอของรอบประจำเดือนที่ดีขึ้น และการลดลงของขนและสิว (อาการจากฮอร์โมนเพศชาย) ผู้วิจัยยังได้ศึกษาผลข้างเคียงของการรักษา การเปลี่ยนแปลงของน้ำหนักตัว การเปลี่ยนแปลงของฮอร์โมนเทสโทสเทอโรน การเปลี่ยนแปลงของระบบเมตาบอลิสึม และคุณภาพชีวิต
ความเป็นมา
สตรีที่มีภาวะ PCOS มีปัญหาสุขภาพที่หลากหลาย ประกอบด้วยความไม่สม่ำเสมอของรอบประจำเดือน ภาวะขนขึ้นและสิว และภาวะมีบุตรยาก ผลกระทบต่อสุขภาพในระยะยาว ประกอบด้วยความเสี่ยงที่เพิ่มขึ้นของโรคหัวใจ เบาหวาน และการเกิดเยื่อบุโพรงมดลูกผิดปกติก่อนเป็นมะเร็ง
การศึกษาวิจัยส่วนใหญ่ในปัจจุบันดูผลของการผ่าตัดรังไข่ที่มีต่อภาวะเจริญพันธุ์ในสตรีที่มี PCOS การทบทวนวรรณกรรมนี้ต้องการดูผลของการผ่าตัดรังไข่โดยวิธีส่องกล้อง (LOD) ต่ออาการของ PCOS
วันที่สืบค้นข้อมูล
หลักฐานงานวิจัยถึงตุลาคม 2016
ลักษณะของการศึกษา
การทบทวนนี้รวบรวมข้อมูลการศึกษาแบบสุ่มที่มีกลุ่มเปรียบเทียบ (RCT) 22 การศึกษา รวมสตรีจำนวน 2278 คน การศึกษาแบบสุ่มที่มีกลุ่มเปรียบเทียบ (RCT) เป็นงานวิจัยทางการแพทย์ชนิดหนึ่งซึ่งผู้เข้าร่วมงานวิจัยจะได้รับการสุ่มให้ได้รับการรักษาที่แตกต่างกันไป ผู้เข้าร่วมงานวิจัยมีภาวะ PCOS และมาจากถิ่นที่หลากหลาย
สิบจาก 22 RCTs เปรียบเทียบผลของการผ่าตัดรังไข่โดยวิธีส่องกล้อง (LOD) กับการรักษาด้วยยาอื่นๆ ยาเหล่านี้ประกอบด้วย metformin, clomiphene, gonadotrophins, letrozole และ rosiglitazone สิบจาก 22 RCTs เปรียบเทียบผลของการผ่าตัดรังไข่โดยวิธีส่องกล้อง (LOD)แบบดั้งเดิม กับการผ่าตัดด้วยเทคนิคอื่นๆ สิบจาก 22 RCTs ศึกษาผลของการใช้พลังงานจี้ในระดับต่างๆ หรือจำนวนของ ovarian drill holes ใน LOD
แหล่งเงินทุนการวิจัย
สองงานวิจัยบอกแหล่งทุนสนับสนุน (Farquhar 2002 ‐ supported in part by the Auckland Medical Research Foundation; Sarouri 2015 ‐ the authors thank the Vice Chancellor for Research of Guilan University of Medical Sciences for funding this project)
ผลการศึกษา
LOD อาจจะมีประสิทธิภาพดีกว่า gonadotrophins ในการทำให้รอบประจำเดือนสม่ำเสมอ อย่างไรก็ดี แพทย์ส่วนใหญ่มักพิจารณาทางเลือกอื่นๆเป็นการรักษาแรก LOD โดยเจาะรูรังไข่ สี่หรือห้าตำแหน่ง อาจจะมีประสิทธิภาพดีกว่าเมื่อเทียบกับสองตำแหน่งหรือน้อยกว่า ต่อรังไข่หนึ่งข้าง ในการทำให้รอบประจำเดือนสม่ำเสมอ
ไม่มีหลักฐานเพียงพอที่จะบอกว่ามีความแตกต่างระหว่าง LOD และการรักษาด้วยยาอื่นๆหรือเทคนิคอื่นๆในการผ่าตัด ต่อผลของรอบประจำเดือนหรืออาการจากฮอร์โมนเพศชาย
LOD มีผลข้างเคียงต่อระบบทางเดินอาหารน้อยกว่า เมื่อเทียบกับ metformin และ clomiphene แต่ต้องมีการผ่าตัดและไม่ใช่การรักษามาตรฐานสำหรับประจำเดือนที่ผิดปกติและภาวะขนขึ้น แผลเป็นของเนื้อเยื่อจะน้อยกว่าเมื่อผ่าตัดด้วยวิธี transvaginal hydrolaparoscopy เมื่อเทียบกับ LOD
เมื่อพิจารณาโดยรวมแล้ว LOD ถือว่ามีผลข้างเคียงที่ต่ำ และเป็นทางเลือกหนึ่งในการรักษาอาการที่เกิดจาก PCOS
คุณภาพของหลักฐานงานวิจัย
คุณภาพของงานวิจัยอยู่ในระดับปานกลางถึงต่ำ (very low to moderate quality) ข้อจำกัดหลักคือ imprecision ที่สัมพันธ์กับจำนวนงานศึกษาวิจัยที่น้อย inconsistency และ risk of bias ที่เกิดจากการไม่สามารถปกปิดผู้เข้าร่วมงานวิจัยได้ การศึกษาวิจัยมีจำนวนที่น้อยเกินไปในการประเมิน risk of publication bias
Authors' conclusions
Summary of findings
| LOD compared to medical interventions for symptom relief in women with polycystic ovary syndrome | ||||||
| Patient or population: Women with symptoms of PCOS | ||||||
| Outcomes | Relative effect | Anticipated absolute effects* (95% CI) | Quality of the evidence | What happens | ||
| Without LOD | With LOD | Difference | ||||
| Menstrual regularity at 6 months LOD vs metformin LOD vs metformin + clomiphene LOD vs gonadotropins LOD vs letrozole LOD vs metformin + letrozole | Findings inconsistent and data unsuitable for pooling | Not calculable | ⊕⊝⊝⊝ | |||
| OR 1.02 | 70.6% | 71.0% | 0.4% more | ⊕⊕⊝⊝ | ||
| OR 19.20 | 11.1% | 70.6% | 59.5% more | ⊕⊕⊝⊝ | ||
| OR 1.08 | 68.8% | 70.4% | 1.6% more | ⊕⊕⊝⊝ | ||
| OR 0.95 | 52.1% | 50.8% | 1.3% fewer | ⊕⊕⊝⊝ | ||
| Improvement in androgenic symptoms at 6 months (hirsutism/acne) ‐ LOD vs metformin | OR 1.00 | 79.4% | 79.4% | 0.0% fewer | ⊕⊕⊝⊝ | |
| Improvement in androgenic symptoms at 6 months (hirsutism/acne) ‐ LOD vs gonadotrophins | Acne: OR 3.20 (0.33 to 30.94) Hirsutism: OR 2.31, (0.22 to 23.89) | See comments | ⊕⊝⊝⊝VERY LOW 1, 4 | Acne: 4/29 without LOD, 1/21 with LOD Hirsutism: 3/29 without LOD, 1/21 with LOD | ||
| Harms: GI Upset at 6 months ‐ LOD vs metformin + clomiphene Harms: OHSS rates at 6 months ‐ LOD vs gonadotrophins | OR 0.05 | 10.4% | 0.6% | 9.9% fewer | ⊕⊕⊕⊝ | |
| OR 0.08 | 25.0% | 2.6% | 22.4% fewer | ⊕⊕⊝⊝ | ||
| *The risk in the intervention group (and its 95% confidence interval) is based on the mean risk in the comparison group and the relative effect of the intervention (and its 95% CI). | ||||||
| GRADE Working Group grades of evidence | ||||||
| 1Downgraded one level for serious risk of bias: Included studies not double‐blinded, and in some cases methods of randomization unclear. | ||||||
| LOD compared to other surgical interventions for symptom relief in women with polycystic ovary syndrome | ||||||
| Patient or population: Women with symptoms of PCOS | ||||||
| Outcomes | Relative effect | Anticipated absolute effects* (95% CI) | Quality of the evidence | What happens | ||
| Without LOD | With LOD | Difference | ||||
| Menstrual regularity ‐ LOD vs unilateral LOD | OR 1.51 | 71.2% | 78.8% | 7.7% more | ⊕⊕⊕⊝ | 1 study follow‐up at 3 months. 1 study follow‐up at 12 months |
| Menstrual regularity at 6 months ‐ LOD vs ultrasound‐guided transvaginal ovarian drilling | OR 1.23 | 54.7% | 59.7% | 5.1% more | ⊕⊕⊝⊝ | |
| Menstrual regularity at 12 months | OR 2.13 | 88.2% | 94.1% | 5.9% more | ⊕⊕⊝⊝ | Note control group is NdYAG Laser |
| Improvement in androgenic symptoms at 6 months (Acne) ‐ LOD vs USS guided | OR 0.84 (0.20 to 3.5) | 47.1% | 42.7% | 4.3% fewer | ⊕⊕⊝⊝ | |
| Improvement in androgenic symptoms at 6 months (Hirsutism) ‐ LOD vs USS‐guided | OR 1.09 | 40.0% | 42.1% (16.7 to 72.3) | 2.1% more (23.3 fewer to 32.3 more) | ⊕⊕⊝⊝ | |
| Harms: Adhesions at 6 months ‐ LOD vs THL | OR 0.10 | 59.3% | 12.7% | 46.6% fewer | ⊕⊝⊝⊝ | |
| *The risk in the intervention group (and its 95% confidence interval) is based on the assumed risk in the comparison group and the relative effect of the intervention (and its 95% CI). | ||||||
| GRADE Working Group grades of evidence | ||||||
| 1Downgraded one level for serious risk of bias: Included studies not double‐blinded or unclear allocation concealment or unclear randomization method. | ||||||
| LOD 4 ‐ 5 punctures compared to 2 or fewer punctures for symptom relief in women with polycystic ovary syndrome | ||||||
| Patient or population: Women with symptoms of PCOS | ||||||
| Outcomes | Relative effect | Anticipated absolute effects* (95% CI) | Quality of the evidence | What happens | ||
| Without LOD 4‐5 | With LOD 4‐5 | Difference | ||||
| Menstrual regularity at 6 months ‐ LOD 4 ‐ 5 coagulation points compared to 2 or fewer | OR 16.04 | 13.9% | 72.1% | 58.2% more | ⊕⊕⊝⊝ | |
| Menstrual regularity at 6 months ‐ LOD (4 ‐ 5 laser coagulation points) vs 1 laser coagulation point per ovary | OR 19.00 | 5.0% | 50.0% | 45.0% more | ⊕⊕⊝⊝ | |
| Menstrual regularity at 6 months ‐ LOD 4 punctures vs 2 punctures per ovary | OR 14.00 | 25.0% | 82.4% | 57.4% more | ⊕⊕⊝⊝ | |
| Improvement in androgenic symptoms | No data available | |||||
| Harms LOD 4 ‐ 5 versus fewer punctures | No data available | |||||
| *The risk in the intervention group (and its 95% confidence interval) is based on the assumed risk in the comparison group and the relative effect of the intervention (and its 95% CI). | ||||||
| GRADE Working Group grades of evidence | ||||||
| 1Downgraded one level for serious risk of bias: Included studies not double‐blinded or methods of randomization unclear. | ||||||
| LOD compared to LOD variable energy for symptom relief in women with polycystic ovary syndrome | ||||||
| Patient or population: Women with symptoms of PCOS | ||||||
| Outcomes | Relative effect | Anticipated absolute effects* (95% CI) | Quality of the evidence | What happens | ||
| Without LOD | With LOD | Difference | ||||
| Menstrual regularity at 6 months ‐ LOD vs adjusted thermal dose | OR 0.42 | 87.9% | 75.4% | 12.6% fewer | ⊕⊝⊝⊝ | |
| Menstrual regularity at 3 months ‐ LOD unipolar vs LOD bipolar | OR 1.00 | 90.0% | 90.0% | 0.0% fewer | ⊕⊝⊝⊝ | Groups had different metabolic characteristics at baseline |
| Improvement in androgenic symptoms | No data available | |||||
| Harms: Adhesions at 6 months | OR 0.96 | 28.6% | 27.7% | 0.8% fewer | ⊕⊝⊝⊝ VERY LOW1, 2 | Women that remained enrolled for second‐look laparoscopy |
| *The risk in the intervention group (and its 95% confidence interval) is based on the assumed risk in the comparison group and the relative effect of the intervention (and its 95% CI). | ||||||
| GRADE Working Group grades of evidence | ||||||
| 1Downgraded one level for serious risk of bias: Included studies not double‐blinded or unclear allocation concealment. | ||||||
Background
Description of the condition
Polycystic ovary syndrome (PCOS) is one of the most common endocrine disorders in women of childbearing age. Typically, women will have menstrual disturbances, increased hair growth (hirsutism), acne, infrequent or absent menstrual periods and subfertility. PCOS affects approximately 10% of women worldwide (Adams 1986; Homburg 2008).
A proportion of women with PCOS will present clinically with hirsutism, acne and androgen‐dependent alopecia. Hirsutism in women is defined as an increased growth of terminal hair in a male pattern. The prevalence of clinical signs of hyperandrogenism in women of reproductive age is around 5% to 25% (Azziz 2000). It is characterised biochemically by raised serum concentrations of androgens, particularly testosterone and androstenedione. These features are associated with hypersecretion of luteinising hormone (LH) but with normal or low serum concentrations of follicle stimulating hormone (FSH). In 80% of women with PCOS, the testosterone concentration will exceed the upper limit of 2.4 nmol/l (Taylor 2003).
Women with PCOS also often present with menstrual disorders such as heavy menstrual bleeding and oligomenorrhoea. It is estimated that 30% to 70% of women with PCOS are obese (Vrbikova 2009), and many will develop type 2 diabetes, metabolic disorders and cardiovascular disease (Giallauria 2008; Kiddy 1992).
The Rotterdam meeting in 2003 endorsed a consensus regarding the diagnosis of the syndrome (ESHRE/ASRM PCOS Consensus 2004a; ESHRE/ASRM PCOS Consensus 2004b). This defines PCOS, after the exclusion of related disorders, as a clinical condition exhibiting at least two of the following three features: oligo‐ or anovulation (infrequent or absent menstrual periods); clinical or biochemical, or both, signs of hyperandrogenism (typically, hirsutism or acne); or polycystic ovaries seen on ultrasound.
A further meeting in Greece in 2007 proposed evidence‐based management for the treatment of PCOS‐related subfertility (Thessaloniki ESHRE/ASRM PCOS Consensus 2008). However, very little consensus guidance addresses the management of the non‐fertility‐related symptoms of this condition.
Conservative management with advice on lifestyle changes such as acupuncture (Lim 2016), dieting and weight loss has variable effectiveness. Medical treatment with statins (Raval 2011), hormonal therapy or insulin sensitising agents (Costello 2007) can be associated with significant side effects and is often contraindicated in women wishing to conceive. Laparoscopic ovarian drilling (LOD) is a surgical alternative to medical treatment of anovulation in women with PCOS and subfertility. However, whilst studies have examined the effectiveness of LOD in relation to the improvement of conception, reports on the effect of LOD on non‐fertility‐related PCOS symptoms are contradictory.
Description of the intervention
Ovarian wedge resection was first described in 1935 by Stein and Leventhal (Homburg 2008). This surgery was primarily aimed at reducing ovarian mass by bilateral ovarian wedge resections. With the advent of laparoscopic surgery, a variant of the traditional wedge resection was developed using this technique. During LOD, uni‐ or bipolar electrocautery at various energy levels for a variable duration is used to puncture the ovary. These are typically 2 to 4 mm deep, penetrating into the cortex. The number of puncture holes, the type of energy source and the duration of treatment vary between practitioners. Recent advances in transvaginal hydrolaparoscopy have also allowed ovarian drilling to be performed by the transvaginal route (Gordts 2009), using a hydrolaparoscope or fertiloscope. Ovarian surgery is traditionally performed to induce ovulation in anovulatory women with PCOS. The documented advantage of LOD compared with hormone treatment is the reduction in complication rates associated with ovarian hyperstimulation syndrome (OHSS) and a decreased risk of multiple pregnancy (Farquhar 2007).
How the intervention might work
The mechanism of action of ovarian surgery, wedge resection or more commonly LOD is largely unexplained. Compared to medical treatment, where the treatment effect is dependent on continuous administration of the medication, many LOD‐induced effects appear to be long‐term. It is, however, not known whether LOD exerts its action through a direct effect on the ovary or through a systemic endocrine mechanism. LOD has been shown to reduce long‐term androgen serum levels through a number of mechanisms (Amer 2002). The destruction of androgen‐producing ovarian stroma and the subsequent reduction in substrate for steroid aromatisation may contribute to an overall reduction in androgen production, with improvements in acne and hirsutism. High testosterone levels increase terminal hair growth, and therefore 5α‐reductase inhibitors are implemented in the treatment of hirsutism. A more generalised increased 5α‐reductase activity may be important for increased cortisol metabolism in PCOS (Glintborg 2010). In LOD, it has been hypothesised that the drilling of punctures within the androgen‐producing stroma may depress serum androgen concentrations and offer symptomatic relief. A further possible mechanism is an impact of LOD on insulin resistance. Whilst there is currently very little evidence which documents the effect of LOD on metabolic changes and insulin levels in women with PCOS, small studies have shown that LOD (by electrocautery) can reduce insulin resistance in women with PCOS through decreased IRS‐1 Ser312 phosphorylation (Seow 2007). Other more recent studies have also suggested that LOD can decrease anti‐müllerian hormone (AMH) concentrations and ovarian stroma blood flow in women with PCOS compared with controls (Elmashad 2011).
Why it is important to do this review
The aim of this review is to evaluate the impact of ovarian surgery on symptomatic control of PCOS. Whilst much research has focused on the effect of ovarian surgery in improving fertility in clomiphene‐resistant women with PCOS, the impact of LOD on symptoms of PCOS has not been reviewed.
Objectives
To assess the effectiveness and harms of ovarian surgery as a treatment for symptomatic relief of hirsutism, acne and menstrual disturbances in women with PCOS.
Methods
Criteria for considering studies for this review
Types of studies
We include only randomized controlled trials (RCTs) of surgical interventions for the treatment of symptoms associated with PCOS. Only pre‐crossover data from cross‐over studies was to be included in this study. Other data from cross‐over studies would not be included, even if there was a wash‐out period, as the effect of LOD is long term (for example some women will ovulate regularly after one year).
Types of participants
Women with PCOS (as defined by the Rotterdam Criteria) who are symptomatic with acne, hirsutism or irregular menstrual cycles. Oligomennorhoea is here defined as a menstrual cycle lasting more than 45 days.
Types of interventions
Ovarian surgical interventions for the symptomatic treatment of women with PCOS. Types of comparisons include the following:
1. Surgical (laparotomy or laparoscopy) versus non‐surgical intervention (including placebo or non‐treatment).
2. Comparison between various surgical methods or techniques, e.g.:
-
Comparing the number of drill holes administered.
-
Comparison of various energy modalities for the ovarian drilling procedure (e.g. uni‐ versus bipolar electrocautery, or electrocautery versus laser versus harmonic scalpel).
-
Laparotomy versus laparoscopy.
Types of outcome measures
Primary outcomes
1. Rates of women reporting an improvement in menstrual regularity as defined by the number of cycles per year (or other time frame, e.g. six months) and recorded as regular or irregular.
2. Improvement in androgenic symptoms of PCOS or rates of androgenic symptoms: improvements in hirsutism or acne, as defined by scoring systems such as the Ferriman Gallwey Score (FGS), Global Acne Grading Score (GAGS) or the Leeds revised Acne Grading system (LRAGS).
-
FGS divides the body into nine areas identified for assessment: upper lip, chin, chest, upper back, lower back, upper abdomen, lower abdomen, upper arms and thighs. Each area is assigned a score between 0 and 4 based on hair growth, giving a potential score of 0 to 36. In white populations a score over seven indicates hyperandrogenism. There is ethnic variation of 'normal'.
-
GAGS divides the face, chest and back into six areas identified for assessment: forehead, each cheek, nose, chin, chest and back. Each area is assigned a factor of 1, 2 or 3 based on area. Acne lesions are given a value based on severity: no lesions = 0, comedones = 1, papules = 2, pustules = 3 and nodules = 4. Scores of 1 to 18 are considered mild, 19 to 30 are considered moderate, 31 to 38 are severe, and more than 39 very severe.
-
LRAGS assesses acne on the face, chest and back. A scale of 1 to 10 is used.
Secondary outcomes
1. Harms of surgical and non‐surgical interventions
2. Change in body weight or body mass index
3. Change in waist circumference
4. Testosterone levels, free testosterone or free androgen index
5. Metabolic measures: fasting glucose or insulin levels or haemoglobin A1C (HbA1C)
6. Changes in quality of life
Search methods for identification of studies
We sought all published and unpublished RCTs on surgery for PCOS, using the following search strategy, without language restriction and in consultation with the Gynaecology and Fertility Group (CGF) Information Specialist.
Electronic searches
We searched the following electronic databases, trials registers and websites:
Cochrane Gynaecology and Fertility Group (CGF) Specialised Register (from inception to 17 October 2016, Procite platform) (Appendix 1).
Central Register of Studies Online (CRSO) (searched 17 October 2016, web platform) (Appendix 2).
Ovid MEDLINE® In‐Process & Other Non‐Indexed Citations, Ovid MEDLINE® Daily and Ovid MEDLINE® (from 1946 to 17 October 2016, Ovid platform) (Appendix 3).
Ovid Embase (from 1980 to 17 October 2016, Ovid platform) (Appendix 4).
Ovid PsycINFO (from 1806 to 17 October 2016, Ovid platform) (Appendix 5).
We searched other electronic sources of trials 17 October 2016, including:
Database of Abstracts of Reviews of Effects (DARE) in the Cochrane Library (www.cochrane.org/index.htm);
ClinicalTrials.gov (clinicaltrials.gov/ct2/home);
World Health Organization International Clinical Trials Registry Platform search portal (apps.who.int/trialsearch/);
OpenSigle for grey literature from Europe (opensigle.inist.fr/);
China Academic Journal Electronic full text Database in China National Knowledge Infrastructure;
Index to Chinese Periodical Literature.
LILACS and other Spanish and Portuguese language databases (LatinAmerican and Caribbean Health Science Information database). This is in the Virtual Health library Regional Portal (VHL) (bvsalud.org/portal/?lang=en).
There were no language or date restrictions in these searches. The search strategies are in the appendices.
Searching other resources
We handsearched the reference lists of articles retrieved by the search and made personal contact with experts in the field. We handsearched ESHRE conference abstracts that were not covered in the CGF Specialised Register, in collaboration with the Information Specialist.
Data collection and analysis
Selection of studies
The four review authors undertook the selection of studies. We used the search strategy described above to obtain titles and, where possible, abstracts of studies that were potentially relevant to the review. We were overly inclusive rather than risk losing relevant studies. All review authors independently assessed whether the studies were eligible for inclusion, with disagreements planned for consultation with a third author, although this was not required. Where papers had insufficient information to enable an accurate assessment of eligibility for inclusion, we sought further information from authors.
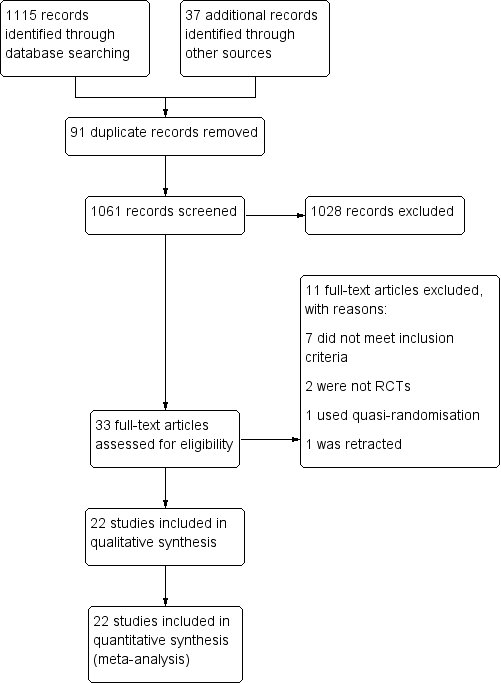
The selection process is documented with a PRISMA flow chart in Figure 1.
Data extraction and management
Two review authors independently extracted data and assessed risks of bias using forms designed according to Cochrane guidelines. We resolved disagreements about study eligibility by discussion, without requiring referral to a third review author. Where studies had multiple publications, we used the main trial report as the primary reference and derived additional details from secondary papers. We corresponded with study investigators to clarify further data on methods and results.
Assessment of risk of bias in included studies
Two review authors independently assessed the included studies for risks of bias, using the Cochrane 'Risk of bias' assessment tool (Higgins 2011) to evaluate: selection (random sequence generation and allocation concealment); performance (blinding of participants and personnel); detection (blinding of outcome assessors); attrition (incomplete outcome data); reporting (selective reporting); and other potential bias. We assigned judgements as recommended in the Cochrane Handbook for Systematic Reviews of Interventions Section 8.5 (Higgins 2011), resolving disagreements by discussion.
We present our judgements in a 'Risk of bias' table, which we incorporate into the interpretation of review findings by means of sensitivity analyses (see below).
Measures of treatment effect
We performed statistical analysis in accordance with the guidelines and methods developed by Cochrane (Higgins 2011). We expressed dichotomous data results as a Mantel‐Haenszel odds ratio (OR) and continuous data results as a mean difference (MD). We present a 95% confidence interval (CI) for all outcomes.
Unit of analysis issues
The primary analysis was by each woman randomized. Data reported that did not allow valid analysis (e.g. "per cycle" rather than "per woman" where women contributed more than one cycle) were to be briefly summarized in an additional table and would not be meta‐analysed.
Dealing with missing data
In the event that data were missing or not available, we planned to contact the authors to provide further assistance. Where we could obtain no further information, the review authors state this in the review. The review authors determined the individual weight of missing data. We conducted an intention‐to‐treat analysis as far as possible, but otherwise we analyzed only the available data.
Assessment of heterogeneity
We assessed heterogeneity using the I2 statistic, according to the guidelines set out in the Cochrane Handbook for Systematic Reviews of Interventions (Higgins 2011). An I2 value greater than 50% indicates substantial heterogeneity. Where we detected substantial heterogeneity we have explored possible explanations in subgroup analyses (e.g. differing populations) and sensitivity analyses (e.g. differing risks of bias). We have taken heterogeneity in to account in our interpretation of the results.
Assessment of reporting biases
In view of the difficulty in detecting and correcting for publication bias and other reporting bias, we minimised their potential impact by ensuring a comprehensive search for eligible studies and by being aware of duplicated data. In the case where 10 or more studies contributed to our analysis, we planned to use a funnel plot to explore the possibility of a small‐study effect.
Data synthesis
We used a fixed‐effect model inverse variance meta‐analysis for combining data where trials examined the same intervention, and where we judged the trial populations and methods to be sufficiently similar.
An increase in the odds of a particular outcome which was beneficial (for example, return of regular menses) or detrimental (for example, surgical complications) is displayed graphically in the meta‐analyses. The aim was to define analyses that were comprehensive and mutually exclusive so that all eligible study results could be fitted into only one of the strata.
Subgroup analysis and investigation of heterogeneity
We planned, where data allowed, to carry out subgroup analyses to explore possible sources of heterogeneity (for example, differences between participants, interventions and study quality).
Sensitivity analysis
We intended to conduct sensitivity analyses for the primary outcomes to explore the effect of risks of bias assessed by adequate methodology versus poor methodology, where adequate methodology was defined a: adequate randomization method, adequate allocation concealment, analysis by intention‐to‐treat, and losses to follow‐up of less than 20%. However, sensitivity analysis in this respect was not necessary and therefore not performed.
These analyses also included consideration of whether the review conclusions would have differed if:
1. A random‐effects model had been adopted.
2. The summary effect measure had been relative risk rather than odds ratio.
Overall quality of the body of evidence: 'Summary of findings' table
We have prepared a 'Summary of findings' table using GRADEpro and Cochrane methods. This table evaluates the overall quality of the body of evidence for the main review outcomes (improvement in menstrual regularity, improvement in androgenic symptoms of PCOS, harms of medical and surgical intervention) for the main review comparison (LOD versus medical intervention). summary of findings Table for the main comparison.
We prepared additional 'Summary of findings' tables for the main review outcomes for other important comparisons (LOD versus other surgical interventions, LOD four to five versus two or fewer punctures, LOD versus variable energy source). summary of findings Table 2; summary of findings Table 3; summary of findings Table 4.
We assessed the quality of the evidence using GRADE criteria: risk of bias, consistency of effect, imprecision, indirectness and publication bias. Two review authors working independently judged evidence quality (high, moderate, low or very low), with disagreements resolved by discussion. Judgements were justified, documented, and incorporated into the reporting of results for each outcome.
Results
Description of studies
Only pre‐cross‐over data from cross‐over studies were to be included in this review. We do not include other data from cross‐over studies, even if there is a wash‐out period, as the effect of LOD is long‐term (for example, some women will ovulate regularly after one year).
Results of the search
The search retrieved 1115 articles. Thirty‐one studies were potentially eligible and retrieved in full text, with 22 meeting our inclusion criteria and included in the final analysis. See study tables: Characteristics of included studies; Characteristics of excluded studies.
See Figure 1.

Study flow diagram
Included studies
Study Design and setting
22 randomized controlled trials included in this review were set in the high‐, middle‐ and low‐income countries, in private, public and university hospitals. All trials had a parallel design, and all but one were single‐centre studies.
Participants
The studies included 2278 women. All the participants had polycystic ovary syndrome. The characteristics of the participants can be found in the table for each included study. Participants were included regardless of whether their treatment goal was symptom management of PCOS or, more commonly, fertility outcomes.
Interventions
Ten of the 22 studies were designed to assess the impact of LOD on the outcome measures specified earlier, compared to a medical treatment. The comparisons were as follows:
Traditional LOD compared to;
-
Metformin (Ashrafinia 2009; Hamed 2010)
-
Metformin + clomiphene (Hashim 2011; Palomba 2010)
-
Gonadotrophins for ovulation induction (Kaya 2005; Farquhar 2002)
-
Letrozole (Hashim 2010)
-
Gonadotrophin analogue + the oral contraceptive pill (Taskin 1996)
-
Metformin + letrozole (Elgafor 2013)
-
Rosiglitazone (Roy 2010)
Ten of 22 studies were designed to assess the impact of LOD on the outcome measures specified compared to a different surgical technique/method of ovarian drilling. The comparisons were as follows:
Traditional LOD compared to;
-
Transvaginal ultrasound‐guided LOD (Badawy 2009)
-
Minilaparoscopic LOD (Zullo 2000)
-
Bipolar LOD (as opposed to unipolar) (Sharma 2006)
-
Unilateral LOD (Abdelhafeez 2013; Roy 2009; Sarouri 2015; Youssef 2007)
-
Harmonic scalpel LOD (Takeuchi 2002)
-
Transvaginal hydrolaparoscopy (THL) (Giampaolino 2016)
-
LOD using adjusted thermal dose in accordance with the ovarian volume (Zakherah 2011)
Two of 22 studies were head‐to‐head comparisons between different dosage/number of punctures of LOD (Selim 2011; Zhu 2010)
No studies compared LOD with no treatment/placebo, or laparotomy. No studies compared LOD to wedge resection.
Outcomes
The following studies reported on the specified outcome measures in this review:
1. Menstrual regularity: Abdelhafeez 2013; Ashrafinia 2009; Badawy 2009; Elgafor 2013; Hamed 2010; Hashim 2010; Hashim 2011; Kaya 2005; Palomba 2010; Roy 2009; Selim 2011; Takeuchi 2002; Zakherah 2011; Zhu 2010
2. Androgenic symptoms: Ashrafinia 2009; Badawy 2009; Farquhar 2002
3. Harms of surgical intervention: short‐ and long‐term surgical complications:
-
Adverse events relating to surgery: Zullo 2000; Zhu 2010
-
Ovarian hyperstimulation syndrome (OHSS): Kaya 2005; Roy 2010
-
Post‐surgical adhesions: Giampaolino 2016; Roy 2009; Zakherah 2011
-
Gastrointestinal side effects of metformin + clomiphene: Hashim 2011; Palomba 2010
4. Body weight or body mass index (kg/m2): Elgafor 2013; Hamed 2010; Farquhar 2002; Zakherah 2011
5. Change in waist circumference: None of the studies reported on waist circumference.
6. Testosterone levels (nmol/l), free testosterone (pg/ml) or free androgen index: Ashrafinia 2009; Badawy 2009; Elgafor 2013; Hamed 2010; Roy 2009; Roy 2010; Sarouri 2015; Selim 2011; Sharma 2006; Takeuchi 2002; Taskin 1996; Youssef 2007; Zakherah 2011; Zhu 2010; Zullo 2000
7. Metabolic measures: fasting glucose (nmol/L) or insulin levels (pmol/L) or haemoglobin A1C (HbA1C): Elgafor 2013; Hamed 2010; Roy 2010
8. Quality of life: Farquhar 2002 provided a questionnaire on the acceptability and convenience of both procedures.
Excluded studies
We excluded nine studies from the review. Reasons for exclusion include studies not being RCTs (three studies), one study was retracted, one study did not measure testosterone as planned, and the remainder did not meet our inclusion criteria.
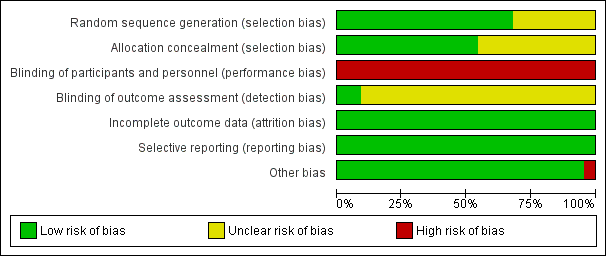
Risk of bias in included studies
Risk of bias assessment focused on seven main domains: random sequence generation, allocation concealment, blinding, incomplete data outcome, selective reporting and other potential bias. The findings are summarized in Figure 2 and Figure 3, and details appear in individual 'Risk of bias' included studies tables.

Risk of bias graph: review authors' judgements about each risk of bias item presented as percentages across all included studies.
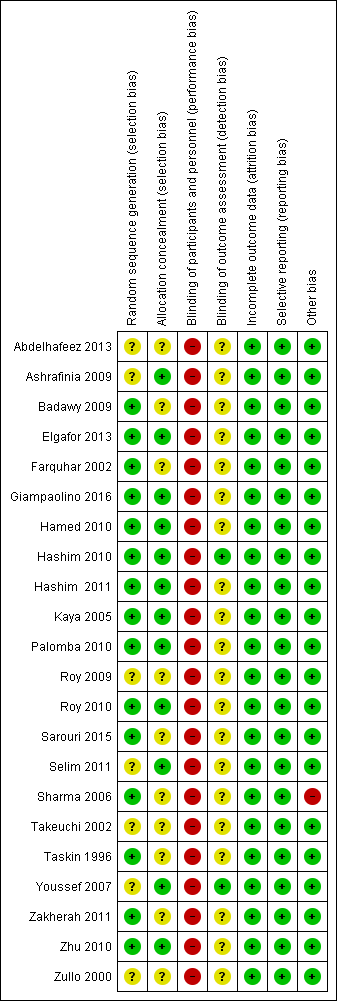
Risk of bias summary: review authors' judgements about each risk of bias item for each included study.
Allocation
Sequence generation
Eighteen trials were at low risk of selection bias related to sequence generation. Four studies had unclear risk due to a lack of detail about their methods of sequence generation.
Allocation concealment
Twelve trials were at low risk of bias for allocation concealment, with the other 10 trials at unclear risk of bias.
Blinding
Blinding of participants
Due to the nature of the studies, blinding was often not possible. Fourteen trials had no means of blinding due to the surgical study design and so were at high risk of performance and detection bias; the remaining eight trials were deemed to be at high risk as they stated a lack of participant blinding.
Blinding of assessment
Most of the studies (20/22) were at unclear risk of assessment blinding. Two studies were at low risk, as they specified that the assessors were blinded.
Incomplete outcome data
Attrition rates in all studies were low and hence we rated all studies at low risk for this domain. One study (Giampaolino 2016) had attrition rates of 45/246, with 19 lost from one arm and 26 from the other.
Selective reporting
All the studies reported on the outcome specified.
Other potential sources of bias
One study (Sharma 2006) showed a statistically significant difference in baseline levels of glucose between the control and intervention groups.
Effects of interventions
See: Summary of findings for the main comparison LOD compared to medical interventions for symptom relief in women with polycystic ovary syndrome; Summary of findings 2 LOD compared to other surgical interventions for symptom relief in women with polycystic ovary syndrome; Summary of findings 3 LOD 4‐5 compared to 2 or fewer punctures for symptom relief in women with polycystic ovary syndrome; Summary of findings 4 LOD compared to LOD variable energy for symptom relief in women with polycystic ovary syndrome
We include 22 studies in this review.
As the studies were sufficiently similar, we combined the data using a fixed‐effect model in the following comparisons:
-
LOD versus medical interventions (stratified by type of medication)
-
LOD versus other surgical interventions (stratified by type of surgery)
-
LOD with four to five punctures versus LOD with two or fewer punctures
-
LOD versus variable energy
1. LOD versus medical treatments
Primary outcomes
1.1 Improvement of menstrual regularity
Seven studies reported this outcome. We did not pool studies comparing different medications, as this resulted in high statistical heterogeneity (I2 = 66%). We interpret the underlying cause of the heterogeneity to be attributable to the differences between the interventions.
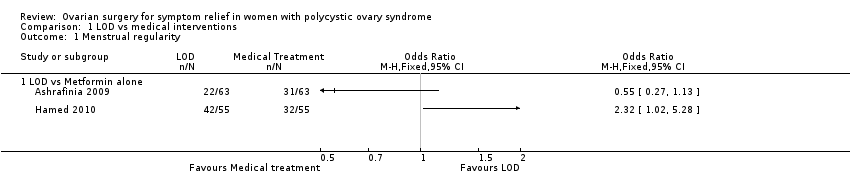
1.1.1. LOD versus metformin: Two studies reported this comparison. Findings were inconsistent and the data were unsuitable for pooling due to high statistical heterogeneity (I2=85%). There was no obvious difference between the studies that might explain the heterogeneity. One study (Hamed 2010) suggested a benefit in the LOD arm (OR 2.32, 95% CI 1.02 to 5.28, 110 women) while the other study (Ashrafinia 2009) had the opposite direction of effect but found no conclusive evidence of a difference between the groups (OR 0.55, 95% CI 0.27 to 1.13, 126 women). See Analysis 1.1; Figure 4.
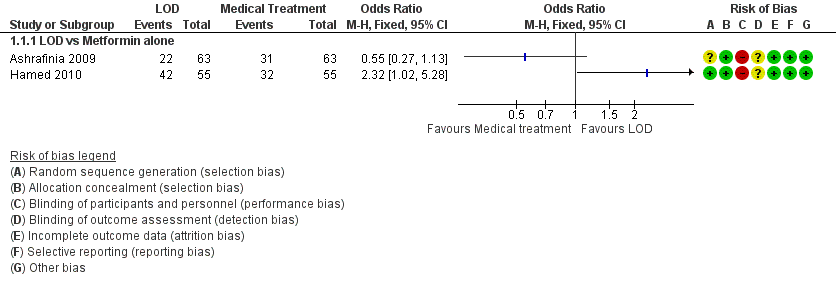
Forest plot of comparison: 1 LOD vs medical interventions, outcome: 1.1 Menstrual regularity.
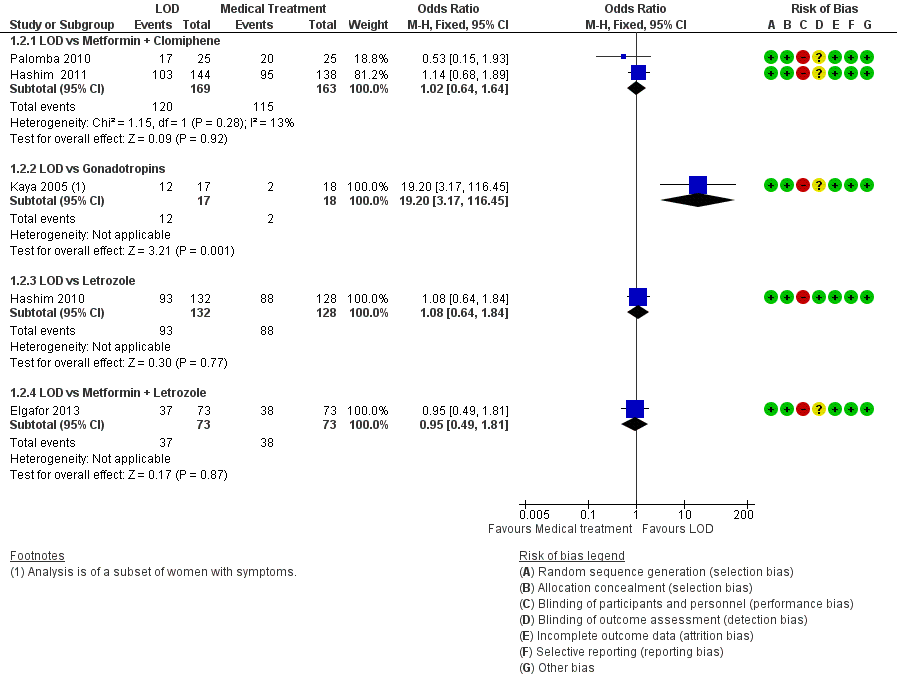
1.1.2. LOD versus metformin + clomiphene: There was no clear evidence of a difference between the groups at six months (OR 1.02, 95% CI 0.64 to 1.64, 2 RCTs, n = 332, I2 = 13%, low‐quality evidence) (Hashim 2011; Palomba 2010).
1.1.3 LOD versus gonadotrophin: One study showed evidence of benefit of LOD over gonadotrophin at six months (OR 19.20, 95% CI 3.17 to 116.45, 1 RCT, n = 35, low‐quality evidence) (Kaya 2005).
1.1.4. LOD versus letrozole: There was no clear evidence of a difference between the groups at six months (OR 1.08, 95% CI 0.64 to 1.84, 1 RCT, n = 260, moderate‐quality evidence) (Hashim 2010).
1.1.5. LOD versus metformin + letrozole: There was no clear evidence of a difference between the groups at six months (OR 0.95, 95% CI 0.49 to 1.81, 1 RCT, n = 146, moderate‐quality evidence) (Elgafor 2013).
See Analysis 1.2; Figure 5

Forest plot of comparison: 1 LOD vs medical interventions, outcome: 1.2 Menstrual regularity.
1.2 Improvement of androgenic symptoms (hirsutism or acne, or both)
1.2.1. LOD versus metformin: There was no clear evidence of a difference between the groups at six months (OR 1.00, 95% CI 0.42 to 2.37, 1 RCT, n = 126, moderate‐quality evidence) (Ashrafinia 2009).
1.2.2. LOD versus gonadotrophins: There was no clear evidence of a difference between the groups in improvement of acne (OR 3.20, 95% CI 0.33 to 30.94, 1 RCT, n = 25, low‐quality evidence) or hirsutism at six months (OR 2.31, 95% CI 0.22 to 23.89, 1 RCT, n = 25, very low‐quality evidence) (Farquhar 2002).
Secondary outcomes
1.3 Harms
1.3.1. LOD versus metformin + clomiphene: There were more gastrointestinal side effects in the metformin + clomiphene group at six months (OR 0.05, 95% CI 0.01 to 0.36, 2 RCTs, n = 332 I2 = 0%, moderate‐quality evidence) (Hashim 2011; Palomba 2010).
1.3.2. LOD versus gonadotrophin: There was no clear evidence of a difference between the groups in OHSS rate at six months (OR 0.08, 95% CI 0.00 to 1.61, 1 study, n = 33, low‐quality evidence) (Kaya 2005).
1.3.3. LOD versus rosiglitazone: There was no occurrence of OHSS in either group at six months (Roy 2010).
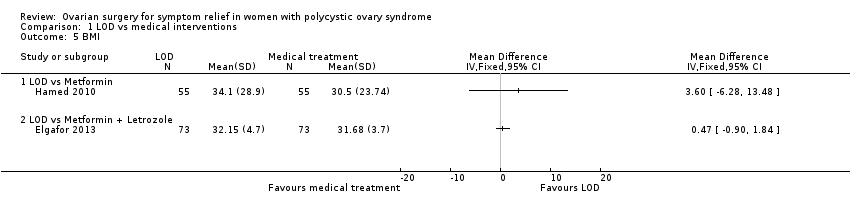
1.4 Body weight or body mass index (kg/m2)
1.4.1. LOD versus metformin: There was a higher body mass index (BMI) at six months follow‐up in the LOD group compared to the metformin group (MD 3.60, 95% CI ‐6.28 to 13.48, 1 RCT, n = 110) (Hamed 2010).
1.4.2. LOD versus metformin + letrozole: There was no clear evidence of a difference in BMI at six months follow‐up between groups (MD 0.47, 95% CI ‐0.90 to 1.84, 1 RCT, n = 146) (Elgafor 2013).
1.5 Waist circumference
None of the studies reported on waist circumference.
1.6 Testosterone levels (nmol/L), free testosterone (pg/ml) or free androgen index
1.6.1. LOD versus metformin: There was no clear evidence of a difference in free testosterone levels post‐surgery at six months follow‐up, (MD ‐0.34, 95% CI ‐0.46 to ‐0.22; n = 126 ; 1 RCT) (Ashrafinia 2009) There was no clear evidence of a difference in mean testosterone levels post‐surgery at six months follow‐up, (MD 0.20, 95% CI ‐0.61 to 1.01, 1 RCTs, n = 110) Hamed 2010).
1.6.2. LOD versus gonadotropin‐releasing hormone antagonist (GnRHa) + oral contraceptive pill (OCP): There was a higher testosterone level one week post‐surgery or at the first menstruation after treatment in the LOD group compared to the GnRHa + OCP group (MD 0.3, 95% CI 0.01 to 0.59, 1 RCT, n = 17) (Taskin 1996).
1.6.3. LOD versus metformin + letrozole: There was a higher testosterone level after LOD compared to metformin + letrozole use (MD 0.60, 95% CI 0.23 to 0.97, 1 RCT, n = 146) (Elgafor 2013).
1.6.4. LOD versus rosiglitazone: There was no clear evidence of a difference between the groups in testosterone levels between rosiglitazone and LOD (MD 0.08, 95% CI ‐0.11 to 0.27, 1 RCT, n = 43) (Roy 2010).
1.7 Metabolic measures: fasting glucose or insulin levels or ratios or haemoglobin A1C (HbA1C)
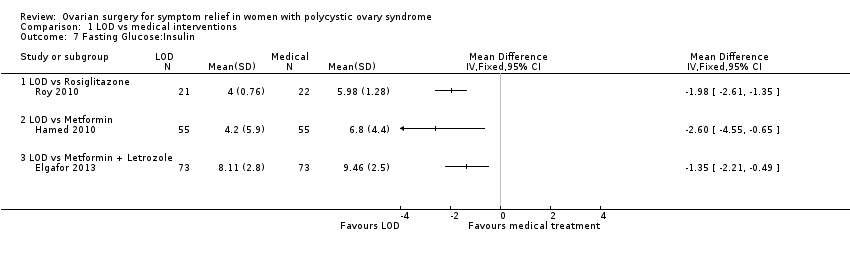
1.7.1. LOD versus rosiglitazone: There was a lower glucose/insulin ratio in the LOD group compared to the rosiglitazone group (MD ‐1.98, 95% CI ‐2.61 to ‐1.35, 1 RCT, n = 43) (Roy 2010).
1.7.2. LOD versus metformin: There was a lower glucose/insulin ratio in the LOD group compared to the metformin group (MD ‐2.60, 95% CI ‐4.55 to ‐0.65, 1 RCT, n = 110) (Hamed 2010).
1.7.3. LOD versus metformin + letrozole: There was a lower glucose/insulin ratio in the LOD group compared to the metformin + letrozole group (MD ‐1.35, 95% CI ‐2.21 to ‐0.49, 1 RCT, n = 146) (Elgafor 2013).
1.8 Quality of life
1.8.1. LOD versus gonadotrophins: Farquhar 2002 provided a questionnaire to the 19 women who underwent both LOD and gonadotrophins regarding the acceptability and convenience of both procedures. Seventeen returned the questionnaire; 15 women preferred LOD and two preferred gonadotrophins. LOD was described as "less traumatic".
2. Bilateral LOD versus other surgical techniques
Primary outcomes
2.1 Improvement of menstrual regularity
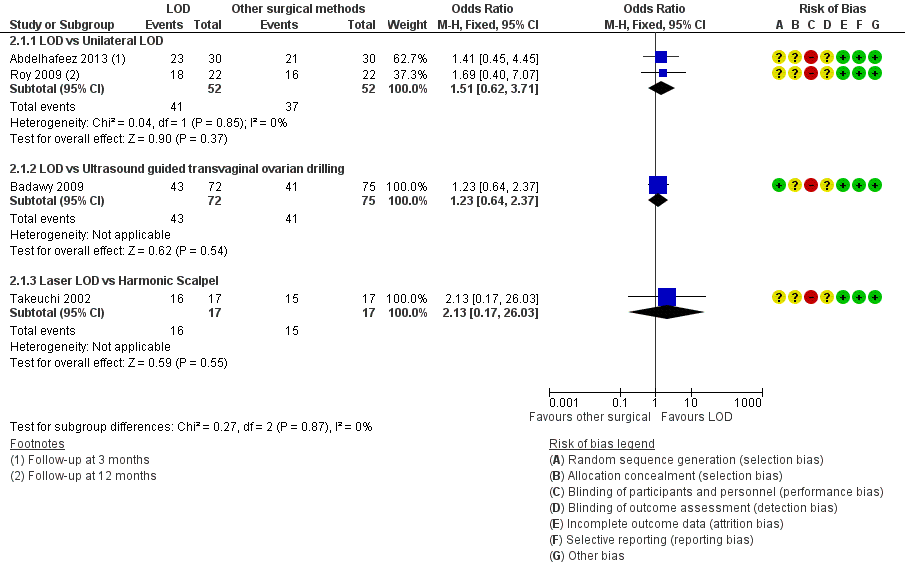
2.1.1. LOD versus unilateral LOD: There was no clear evidence of a difference between the groups (OR 1.51, 95% CI 0.62 to 3.71, 2 RCTs, n = 104, I2 = 0%, moderate‐quality evidence) (Abdelhafeez 2013; Roy 2009). Abdelhafeez 2013 reported at follow‐up of three months (OR 1.41, 95% CI 0.45 to 4.45, 1 RCT, n = 60), while Roy 2009 reported at follow‐up of 12 months (OR 1.69, 95% CI 0.40 to 7.07, 1 RCT, n = 44). We have pooled these data, as they are otherwise similar studies.
2.1.2. LOD versus transvaginal ultrasound‐guided LOD: There was no clear evidence of a difference between the groups at six months (OR 1.23, 95% CI 0.64 to 2.37, 1 RCT, n = 147, low‐quality evidence) (Badawy 2009).
2.1.3. LOD with Hd‐YAG laser versus LOD with harmonic scalpel: There was no clear evidence of a difference between the groups at 12 months (OR 2.13, 95% CI 0.17 to 26.03, 1 RCT, n = 34, low‐quality evidence) (Takeuchi 2002).
See Analysis 2.1; Figure 6.

Forest plot of comparison: 2 LOD vs other surgical interventions, outcome: 2.1 Menstrual regularity.
2.2 Improvement of androgenic symptoms (hirsutism or acne, or both)
LOD versus transvaginal ultrasound‐guided LOD: There was no clear evidence of a difference between the groups in hirsutism (OR 1.09, 95% CI 0.30 to 3.91, 1 RCT, n = 39, low‐quality evidence) or acne at six months (OR 0.84, 95% CI 0.20 to 3.50, 1 RCT, n = 31, low‐quality evidence) (Badawy 2009).
Secondary outcomes
2.3 Harms
2.3.1. LOD versus unilateral LOD: There were no post‐surgical peri‐ovarian adhesions found in a subgroup of women who returned for repeat laparoscopy or caesarean section up to 12 months post‐intervention (Roy 2009).
2.3.2. LOD versus minilaparoscopic LOD under local anaesthetic and conscious sedation: There were no complications from local anaesthetic (Zullo 2000).
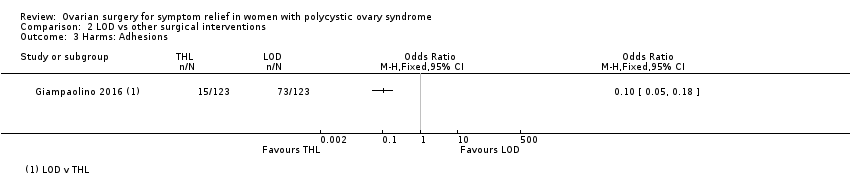
2.3.3 LOD versus transvaginal hydrolaparoscopy: There were significantly fewer women with post‐procedure adhesions with THL compared to LOD at six months (OR 0.10, 95% CI 0.05 to 0.18, 1 RCT, n = 246, very low‐quality evidence) (Giampaolino 2016).
2.4 Body weight or body mass index (kg/m2)
None of the studies reported on this outcome.
2.5 Waist circumference
None of the studies reported on this outcome.
2.6 Testosterone levels (nmol/L), free testosterone (pg/ml) or free androgen index
2.4.1. LOD versus transvaginal ultrasound‐guided LOD: The mean testosterone levels were found to be higher in the LOD group compared to the ultrasound‐guided transvaginal LOD group (MD 0.30, 95% CI 0.13 to 0.47, 1 RCT, n = 163) (Badawy 2009).
2.4.2. LOD versus minilaparoscopic LOD under local anaesthetic and conscious sedation: There was no clear evidence of a difference between the groups (MD 0.00, 95% CI ‐0.43 to 0.43, 1 RCT, n = 62) (Zullo 2000).
2.4.3. LOD versus unilateral LOD: There was no clear evidence of a difference in mean testosterone between the groups (MD 0.03, 95% CI ‐0.04 to 0.09, 2 RCTs, n = 112, I2 = 0%) (Roy 2009; Youssef 2007). There was no clear evidence in free testosterone between the groups (MD ‐0.30, 95% CI ‐0.84 to 0.24, 1 RCTs, n = 90) (Sarouri 2015).
2.4.4. LOD with Hd‐YAG Laser versus LOD with harmonic scalpel: There was no clear evidence of difference between the groups (MD 0.0, 95% CI ‐0.28 to 0.28, 1 RCT, n = 34) (Takeuchi 2002).
2.7 Metabolic measures: fasting glucose or insulin levels or ratio or haemoglobin A1C (Hb1AC)
None of the studies reported on this outcome.
2.8 Quality of life
None of the studies reported on this outcome.
3. LOD with different numbers of punctures per ovary
Primary outcomes
3.1 Improvement of menstrual regularity
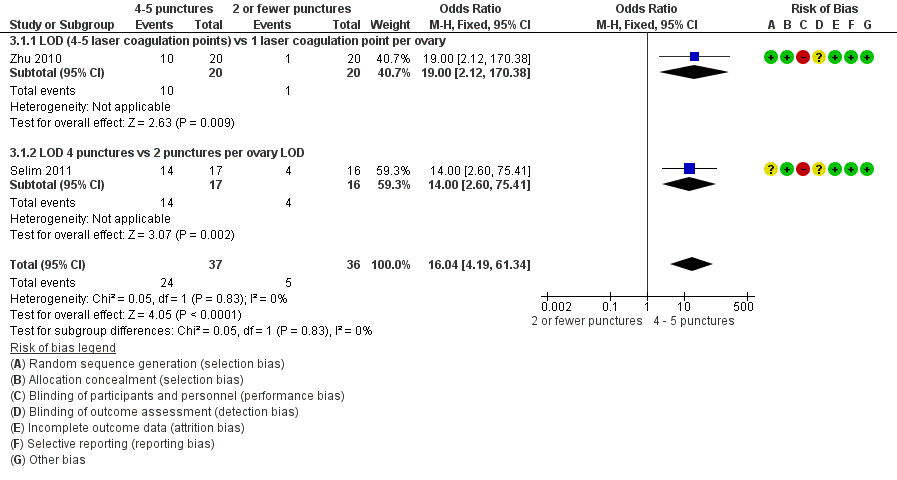
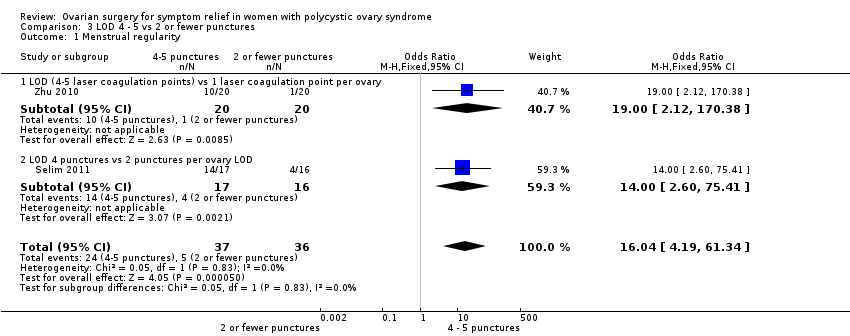
LOD four to five punctures versus two or fewer punctures per ovary: There is evidence of benefit of applying four or five punctures per ovary compared to two or fewer punctures at six months (OR 16.04, 95% CI 4.19 to 61.34, 2 RCTs, n = 73, I2 = 0%, low‐quality evidence) (Zhu 2010; Selim 2011).
See Analysis 3.1; Figure 7.

Forest plot of comparison: 3 LOD 4 ‐ 5 vs 2 or fewer punctures, outcome: 3.1 Menstrual regularity.
3.2 Improvement of androgenic symptoms (hirsutism or acne, or both)
None of the studies reported on this outcome.
Secondary outcomes
3.3 Harms
LOD four to five punctures versus two or fewer punctures: There were no surgical adverse events in any group (Zhu 2010).
3.4 Body weight or body mass index (kg/m2)
None of the studies reported on this outcome.
3.5 Waist circumference
None of the studies reported on this outcome.
3.6 Testosterone levels (nmol/L) or free androgen index
Testosterone
3.6.1. LOD four to five punctures versus two or fewer punctures: There is evidence of a difference in applying more punctures per ovary compared to two or fewer punctures (MD ‐0.90, 95% CI ‐1.12 to ‐0.68, 2 RCTs, n = 73, I2 = 0%) (Selim 2011; Zhu 2010) (Analysis 3.2).
Free androgen index (FAI)
3.6.2. LOD four to five punctures versus two or fewer punctures: There was no clear evidence of a difference between the groups (MD ‐1.50, 95% CI ‐3.21 to 0.21, 1 RCT, n = 33) (Selim 2011) (Analysis 3.2).
3.7 Metabolic measures: fasting glucose or insulin levels or haemoglobin A1C (HbA1C)
None of the studies reported on this outcome.
3.8 Quality of life
None of the studies reported on this outcome.
4. LOD with various energy modalities
Primary outcomes
4.1 Improvement of menstrual regularity
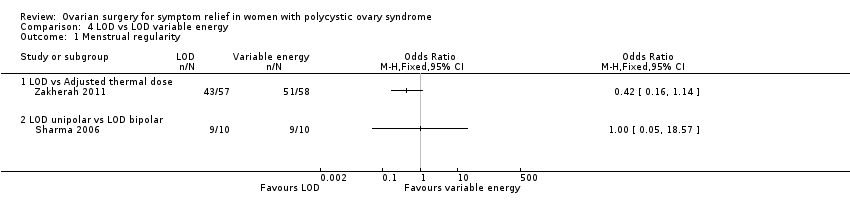
4.1.1. LOD versus LOD using adjusted thermal dose in accordance with the ovarian volume: There was no clear evidence of a difference between the groups at six months (OR 0.42, 95% CI 0.16 to 1.14, 1 RCT, n = 115, very low‐quality evidence) (Zakherah 2011).
4.1.2. Unipolar LOD versus bipolar LOD: There was no clear evidence of a difference between the groups at three months (OR 1.00, 95% CI 0.05 to 18.57, 1 RCT, n = 20, very low‐quality evidence) (Sharma 2006).
See Analysis 4.1; Figure 8.

Forest plot of comparison: 4 LOD vs LOD variable energy, outcome: 4.1 Menstrual regularity.
4.2 Improvement of androgenic symptoms (hirsutism or acne, or both)
None of the studies reported on this outcome.
Secondary outcomes
4.3 Harms
LOD versus LOD using adjusted thermal dose in accordance with ovarian volume: There was no clear evidence of a difference between the groups in the adhesions found at second‐look laparoscopy at six months (OR 0.96, 95% CI 0.32 to 2.88, 1 RCT, n = 64, very low‐quality evidence) (Zakherah 2011).
4.4 Body weight or body mass index (kg/m2)
LOD versus LOD using adjusted thermal dose in accordance with ovarian volume: There was no clear evidence of a difference between the groups (MD 0.20, 95% CI ‐0.71 to 1.11, 1 RCT, n = 115) (Zakherah 2011).
4.5 Waist circumference
None of the studies reported on this outcome.
4.6 Testosterone levels (nmol/L) or free androgen index
4.6.1. LOD versus LOD using adjusted thermal dose in accordance with ovarian volume: Testosterone levels were lower in the thermal dose group (MD 0.70, 95% CI 0.57 to 0.83, 1 RCT, n = 115) (Zakherah 2011) (Analysis 4.4).
4.6.2. Unipolar LOD versus bipolar LOD: There was no clear evidence of a difference between the groups in the testosterone levels (MD 0.30, 95% CI ‐2.01 to 2.61, 1 RCT, n = 20) (Sharma 2006) (Analysis 4.4).
4.7 Metabolic measures: fasting glucose or insulin levels or haemoglobin A1C (HbA1C)
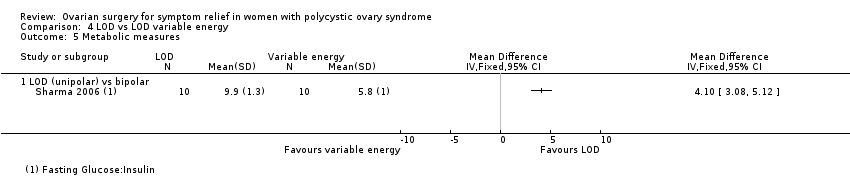
4.5.1. Unipolar LOD versus bipolar LOD: There was a significantly lower glucose insulin ratio at three months after surgery in the group who had unipolar LOD compared to those with bipolar LOD (MD 4.10, 95% CI 3.08 to 5.12, 1 RCT, n = 20) (Sharma 2006). However, in this study there was a significant disparity between the baseline characteristics of the glucose insulin ratio between the two groups.
4.8 Quality of life
None of the studies reported on this outcome.
5. LOD versus laparotomy
There were no studies that investigated this.
Other analyses
Upon completing study selection and data extraction we considered no subgroups to be relevant to our analysis.
We conducted sensitivity analyses as planned. The sensitivity analyses resulted in no significant modification of the results or the strength of associations after applying the above considerations to our data. No imputation of data was required. We are unable to address publication bias in this review.
Discussion
Summary of main results
For women with menstrual irregularity, acne or hirsutism due to PCOS there was evidence of benefit of LOD over gonadotrophin, and for high puncture number versus low puncture number in menstrual regularity. These outcomes were based on one and two RCTs respectively. As gonadotrophins are unlikely to be prescribed solely for these indications, it is important to note that these outcomes are secondary.
There was no clear evidence of a difference in the rates of improvement of menstrual regularity or androgenic symptoms when LOD was compared to other medical or other surgical interventions.
Studies reported low adverse effects with LOD, and metformin and clomiphene is associated with greater gastrointestinal side effects compared to LOD. Given the evidence supporting metformin as beneficial in the improvement of menstrual regularity (Tang 2012), LOD may be considered a non‐inferior but invasive alternative in those unable to tolerate metformin.
There were significantly fewer post‐procedure adhesions with transvaginal hydrolaparoscopy when compared with LOD, but this was based on a single RCT.
Overall completeness and applicability of evidence
The studies included addressed the review question, and the participants and outcomes were all relevant. Certain comparisons of surgical technique will not be relevant in centres where the equipment is not available. There were no studies comparing LOD versus no treatment and hence our conclusions can only be drawn from head‐to‐head comparisons of LOD with medical or surgical treatments. Current evidence is largely limited by data obtained from single or small numbers of randomised controlled studies. When confronted with a woman with symptoms of PCOS, this evidence needs to be applied in the wider context of their symptoms and goals, as neither LOD nor the medical interventions are considered first‐line treatments. There may be additional benefit, however, if these interventions are otherwise indicated; they should form part of patient counselling and may guide certain decisions.
Quality of the evidence
The quality of the evidence ranged from very low to moderate quality. The main limitations were imprecision associated with the low number of studies, inconsistency and risk of bias associated with the inability to blind participants (see summary of findings Table for the main comparison; summary of findings Table 2; summary of findings Table 3; summary of findings Table 4). The risk of performance bias in individual studies was high, due to a lack of blinding of outcome assessors, which can be expected with surgical comparisons. There were too few studies to assess risk of publication bias. Other bias was rare, with the exception of Sharma 2006 which we rated at high risk of other bias due to a significant disparity in the baseline characteristics of glucose/insulin ratio.
Potential biases in the review process
We executed an inclusive search, minimising as far as possible incomplete identification of studies and the risk of reporting bias. We made every effort to identify all potentially eligible studies, and sought additional data from study authors as necessary. However, it is possible that there are unpublished studies that we did not retrieve.
Agreements and disagreements with other studies or reviews
We found no other studies or reviews on this topic.
Study flow diagram
Risk of bias graph: review authors' judgements about each risk of bias item presented as percentages across all included studies.

Risk of bias summary: review authors' judgements about each risk of bias item for each included study.

Forest plot of comparison: 1 LOD vs medical interventions, outcome: 1.1 Menstrual regularity.
Forest plot of comparison: 1 LOD vs medical interventions, outcome: 1.2 Menstrual regularity.
Forest plot of comparison: 2 LOD vs other surgical interventions, outcome: 2.1 Menstrual regularity.
Forest plot of comparison: 3 LOD 4 ‐ 5 vs 2 or fewer punctures, outcome: 3.1 Menstrual regularity.

Forest plot of comparison: 4 LOD vs LOD variable energy, outcome: 4.1 Menstrual regularity.
Comparison 1 LOD vs medical interventions, Outcome 1 Menstrual regularity.

Comparison 1 LOD vs medical interventions, Outcome 2 Menstrual regularity.
Comparison 1 LOD vs medical interventions, Outcome 3 Improvement in androgenic symptoms (hirsutism/acne).
Comparison 1 LOD vs medical interventions, Outcome 4 Harms.
Comparison 1 LOD vs medical interventions, Outcome 5 BMI.

Comparison 1 LOD vs medical interventions, Outcome 6 Testosterone and free androgen index.
Comparison 1 LOD vs medical interventions, Outcome 7 Fasting Glucose:Insulin.

Comparison 2 LOD vs other surgical interventions, Outcome 1 Menstrual regularity.

Comparison 2 LOD vs other surgical interventions, Outcome 2 Improvement in androgenic symptoms (hirsutism/acne).
Comparison 2 LOD vs other surgical interventions, Outcome 3 Harms: Adhesions.

Comparison 2 LOD vs other surgical interventions, Outcome 4 Testosterone and free androgen index.
Comparison 3 LOD 4 ‐ 5 vs 2 or fewer punctures, Outcome 1 Menstrual regularity.

Comparison 3 LOD 4 ‐ 5 vs 2 or fewer punctures, Outcome 2 Testosterone and free androgen index.
Comparison 4 LOD vs LOD variable energy, Outcome 1 Menstrual regularity.

Comparison 4 LOD vs LOD variable energy, Outcome 2 Harms.

Comparison 4 LOD vs LOD variable energy, Outcome 3 BMI.

Comparison 4 LOD vs LOD variable energy, Outcome 4 Testosterone and free androgen index.
Comparison 4 LOD vs LOD variable energy, Outcome 5 Metabolic measures.
| LOD compared to medical interventions for symptom relief in women with polycystic ovary syndrome | ||||||
| Patient or population: Women with symptoms of PCOS | ||||||
| Outcomes | Relative effect | Anticipated absolute effects* (95% CI) | Quality of the evidence | What happens | ||
| Without LOD | With LOD | Difference | ||||
| Menstrual regularity at 6 months LOD vs metformin LOD vs metformin + clomiphene LOD vs gonadotropins LOD vs letrozole LOD vs metformin + letrozole | Findings inconsistent and data unsuitable for pooling | Not calculable | ⊕⊝⊝⊝ | |||
| OR 1.02 | 70.6% | 71.0% | 0.4% more | ⊕⊕⊝⊝ | ||
| OR 19.20 | 11.1% | 70.6% | 59.5% more | ⊕⊕⊝⊝ | ||
| OR 1.08 | 68.8% | 70.4% | 1.6% more | ⊕⊕⊝⊝ | ||
| OR 0.95 | 52.1% | 50.8% | 1.3% fewer | ⊕⊕⊝⊝ | ||
| Improvement in androgenic symptoms at 6 months (hirsutism/acne) ‐ LOD vs metformin | OR 1.00 | 79.4% | 79.4% | 0.0% fewer | ⊕⊕⊝⊝ | |
| Improvement in androgenic symptoms at 6 months (hirsutism/acne) ‐ LOD vs gonadotrophins | Acne: OR 3.20 (0.33 to 30.94) Hirsutism: OR 2.31, (0.22 to 23.89) | See comments | ⊕⊝⊝⊝VERY LOW 1, 4 | Acne: 4/29 without LOD, 1/21 with LOD Hirsutism: 3/29 without LOD, 1/21 with LOD | ||
| Harms: GI Upset at 6 months ‐ LOD vs metformin + clomiphene Harms: OHSS rates at 6 months ‐ LOD vs gonadotrophins | OR 0.05 | 10.4% | 0.6% | 9.9% fewer | ⊕⊕⊕⊝ | |
| OR 0.08 | 25.0% | 2.6% | 22.4% fewer | ⊕⊕⊝⊝ | ||
| *The risk in the intervention group (and its 95% confidence interval) is based on the mean risk in the comparison group and the relative effect of the intervention (and its 95% CI). | ||||||
| GRADE Working Group grades of evidence | ||||||
| 1Downgraded one level for serious risk of bias: Included studies not double‐blinded, and in some cases methods of randomization unclear. | ||||||
| LOD compared to other surgical interventions for symptom relief in women with polycystic ovary syndrome | ||||||
| Patient or population: Women with symptoms of PCOS | ||||||
| Outcomes | Relative effect | Anticipated absolute effects* (95% CI) | Quality of the evidence | What happens | ||
| Without LOD | With LOD | Difference | ||||
| Menstrual regularity ‐ LOD vs unilateral LOD | OR 1.51 | 71.2% | 78.8% | 7.7% more | ⊕⊕⊕⊝ | 1 study follow‐up at 3 months. 1 study follow‐up at 12 months |
| Menstrual regularity at 6 months ‐ LOD vs ultrasound‐guided transvaginal ovarian drilling | OR 1.23 | 54.7% | 59.7% | 5.1% more | ⊕⊕⊝⊝ | |
| Menstrual regularity at 12 months | OR 2.13 | 88.2% | 94.1% | 5.9% more | ⊕⊕⊝⊝ | Note control group is NdYAG Laser |
| Improvement in androgenic symptoms at 6 months (Acne) ‐ LOD vs USS guided | OR 0.84 (0.20 to 3.5) | 47.1% | 42.7% | 4.3% fewer | ⊕⊕⊝⊝ | |
| Improvement in androgenic symptoms at 6 months (Hirsutism) ‐ LOD vs USS‐guided | OR 1.09 | 40.0% | 42.1% (16.7 to 72.3) | 2.1% more (23.3 fewer to 32.3 more) | ⊕⊕⊝⊝ | |
| Harms: Adhesions at 6 months ‐ LOD vs THL | OR 0.10 | 59.3% | 12.7% | 46.6% fewer | ⊕⊝⊝⊝ | |
| *The risk in the intervention group (and its 95% confidence interval) is based on the assumed risk in the comparison group and the relative effect of the intervention (and its 95% CI). | ||||||
| GRADE Working Group grades of evidence | ||||||
| 1Downgraded one level for serious risk of bias: Included studies not double‐blinded or unclear allocation concealment or unclear randomization method. | ||||||
| LOD 4 ‐ 5 punctures compared to 2 or fewer punctures for symptom relief in women with polycystic ovary syndrome | ||||||
| Patient or population: Women with symptoms of PCOS | ||||||
| Outcomes | Relative effect | Anticipated absolute effects* (95% CI) | Quality of the evidence | What happens | ||
| Without LOD 4‐5 | With LOD 4‐5 | Difference | ||||
| Menstrual regularity at 6 months ‐ LOD 4 ‐ 5 coagulation points compared to 2 or fewer | OR 16.04 | 13.9% | 72.1% | 58.2% more | ⊕⊕⊝⊝ | |
| Menstrual regularity at 6 months ‐ LOD (4 ‐ 5 laser coagulation points) vs 1 laser coagulation point per ovary | OR 19.00 | 5.0% | 50.0% | 45.0% more | ⊕⊕⊝⊝ | |
| Menstrual regularity at 6 months ‐ LOD 4 punctures vs 2 punctures per ovary | OR 14.00 | 25.0% | 82.4% | 57.4% more | ⊕⊕⊝⊝ | |
| Improvement in androgenic symptoms | No data available | |||||
| Harms LOD 4 ‐ 5 versus fewer punctures | No data available | |||||
| *The risk in the intervention group (and its 95% confidence interval) is based on the assumed risk in the comparison group and the relative effect of the intervention (and its 95% CI). | ||||||
| GRADE Working Group grades of evidence | ||||||
| 1Downgraded one level for serious risk of bias: Included studies not double‐blinded or methods of randomization unclear. | ||||||
| LOD compared to LOD variable energy for symptom relief in women with polycystic ovary syndrome | ||||||
| Patient or population: Women with symptoms of PCOS | ||||||
| Outcomes | Relative effect | Anticipated absolute effects* (95% CI) | Quality of the evidence | What happens | ||
| Without LOD | With LOD | Difference | ||||
| Menstrual regularity at 6 months ‐ LOD vs adjusted thermal dose | OR 0.42 | 87.9% | 75.4% | 12.6% fewer | ⊕⊝⊝⊝ | |
| Menstrual regularity at 3 months ‐ LOD unipolar vs LOD bipolar | OR 1.00 | 90.0% | 90.0% | 0.0% fewer | ⊕⊝⊝⊝ | Groups had different metabolic characteristics at baseline |
| Improvement in androgenic symptoms | No data available | |||||
| Harms: Adhesions at 6 months | OR 0.96 | 28.6% | 27.7% | 0.8% fewer | ⊕⊝⊝⊝ VERY LOW1, 2 | Women that remained enrolled for second‐look laparoscopy |
| *The risk in the intervention group (and its 95% confidence interval) is based on the assumed risk in the comparison group and the relative effect of the intervention (and its 95% CI). | ||||||
| GRADE Working Group grades of evidence | ||||||
| 1Downgraded one level for serious risk of bias: Included studies not double‐blinded or unclear allocation concealment. | ||||||
| Outcome or subgroup title | No. of studies | No. of participants | Statistical method | Effect size |
| 1 Menstrual regularity Show forest plot | 2 | Odds Ratio (M‐H, Fixed, 95% CI) | Totals not selected | |
| 1.1 LOD vs Metformin alone | 2 | Odds Ratio (M‐H, Fixed, 95% CI) | 0.0 [0.0, 0.0] | |
| 2 Menstrual regularity Show forest plot | 5 | Odds Ratio (M‐H, Fixed, 95% CI) | Subtotals only | |
| 2.1 LOD vs Metformin + Clomiphene | 2 | 332 | Odds Ratio (M‐H, Fixed, 95% CI) | 1.02 [0.64, 1.64] |
| 2.2 LOD vs Gonadotropins | 1 | 35 | Odds Ratio (M‐H, Fixed, 95% CI) | 19.2 [3.17, 116.45] |
| 2.3 LOD vs Letrozole | 1 | 260 | Odds Ratio (M‐H, Fixed, 95% CI) | 1.08 [0.64, 1.84] |
| 2.4 LOD vs Metformin + Letrozole | 1 | 146 | Odds Ratio (M‐H, Fixed, 95% CI) | 0.95 [0.49, 1.81] |
| 3 Improvement in androgenic symptoms (hirsutism/acne) Show forest plot | 2 | Odds Ratio (M‐H, Fixed, 95% CI) | Totals not selected | |
| 3.1 LOD vs Metformin | 1 | Odds Ratio (M‐H, Fixed, 95% CI) | 0.0 [0.0, 0.0] | |
| 3.2 LOD vs Gonadotrophins | 1 | Odds Ratio (M‐H, Fixed, 95% CI) | 0.0 [0.0, 0.0] | |
| 4 Harms Show forest plot | 3 | Odds Ratio (M‐H, Fixed, 95% CI) | Subtotals only | |
| 4.1 LOD vs Metformin + Clomiphen | 2 | 332 | Odds Ratio (M‐H, Fixed, 95% CI) | 0.05 [0.01, 0.36] |
| 4.2 LOD vs Gonadotrophins | 1 | 33 | Odds Ratio (M‐H, Fixed, 95% CI) | 0.08 [0.00, 1.61] |
| 5 BMI Show forest plot | 2 | Mean Difference (IV, Fixed, 95% CI) | Totals not selected | |
| 5.1 LOD vs Metformin | 1 | Mean Difference (IV, Fixed, 95% CI) | 0.0 [0.0, 0.0] | |
| 5.2 LOD vs Metformin + Letrozole | 1 | Mean Difference (IV, Fixed, 95% CI) | 0.0 [0.0, 0.0] | |
| 6 Testosterone and free androgen index Show forest plot | 5 | Mean Difference (IV, Fixed, 95% CI) | Totals not selected | |
| 6.1 LOD vs Metformin | 2 | Mean Difference (IV, Fixed, 95% CI) | 0.0 [0.0, 0.0] | |
| 6.2 LOD vs GnRHa + OCP | 1 | Mean Difference (IV, Fixed, 95% CI) | 0.0 [0.0, 0.0] | |
| 6.3 LOD vs Metformin + Letrozole | 1 | Mean Difference (IV, Fixed, 95% CI) | 0.0 [0.0, 0.0] | |
| 6.4 LOD versus Rosiglitazone | 1 | Mean Difference (IV, Fixed, 95% CI) | 0.0 [0.0, 0.0] | |
| 7 Fasting Glucose:Insulin Show forest plot | 3 | Mean Difference (IV, Fixed, 95% CI) | Totals not selected | |
| 7.1 LOD vs Rosiglitazone | 1 | Mean Difference (IV, Fixed, 95% CI) | 0.0 [0.0, 0.0] | |
| 7.2 LOD vs Metformin | 1 | Mean Difference (IV, Fixed, 95% CI) | 0.0 [0.0, 0.0] | |
| 7.3 LOD vs Metformin + Letrozole | 1 | Mean Difference (IV, Fixed, 95% CI) | 0.0 [0.0, 0.0] | |
| Outcome or subgroup title | No. of studies | No. of participants | Statistical method | Effect size |
| 1 Menstrual regularity Show forest plot | 4 | Odds Ratio (M‐H, Fixed, 95% CI) | Subtotals only | |
| 1.1 LOD vs Unilateral LOD | 2 | 104 | Odds Ratio (M‐H, Fixed, 95% CI) | 1.51 [0.62, 3.71] |
| 1.2 LOD vs Ultrasound guided transvaginal ovarian drilling | 1 | 147 | Odds Ratio (M‐H, Fixed, 95% CI) | 1.23 [0.64, 2.37] |
| 1.3 Laser LOD vs Harmonic Scalpel | 1 | 34 | Odds Ratio (M‐H, Fixed, 95% CI) | 2.13 [0.17, 26.03] |
| 2 Improvement in androgenic symptoms (hirsutism/acne) Show forest plot | 1 | Odds Ratio (M‐H, Fixed, 95% CI) | Totals not selected | |
| 2.1 Hirsutism | 1 | Odds Ratio (M‐H, Fixed, 95% CI) | 0.0 [0.0, 0.0] | |
| 2.2 Acne | 1 | Odds Ratio (M‐H, Fixed, 95% CI) | 0.0 [0.0, 0.0] | |
| 3 Harms: Adhesions Show forest plot | 1 | Odds Ratio (M‐H, Fixed, 95% CI) | Totals not selected | |
| 4 Testosterone and free androgen index Show forest plot | 6 | Mean Difference (IV, Fixed, 95% CI) | Totals not selected | |
| 4.1 LOD vs Ultrasound guided transvaginal ovarian drilling | 1 | Mean Difference (IV, Fixed, 95% CI) | 0.0 [0.0, 0.0] | |
| 4.2 LOD versus mini laparoscopy with sedation | 1 | Mean Difference (IV, Fixed, 95% CI) | 0.0 [0.0, 0.0] | |
| 4.3 LOD vs unilateral LOD | 3 | Mean Difference (IV, Fixed, 95% CI) | 0.0 [0.0, 0.0] | |
| 4.4 Laser LOD vs Harmonic Scalpel | 1 | Mean Difference (IV, Fixed, 95% CI) | 0.0 [0.0, 0.0] | |
| Outcome or subgroup title | No. of studies | No. of participants | Statistical method | Effect size |
| 1 Menstrual regularity Show forest plot | 2 | 73 | Odds Ratio (M‐H, Fixed, 95% CI) | 16.04 [4.19, 61.34] |
| 1.1 LOD (4‐5 laser coagulation points) vs 1 laser coagulation point per ovary | 1 | 40 | Odds Ratio (M‐H, Fixed, 95% CI) | 19.0 [2.12, 170.38] |
| 1.2 LOD 4 punctures vs 2 punctures per ovary LOD | 1 | 33 | Odds Ratio (M‐H, Fixed, 95% CI) | 14.0 [2.60, 75.41] |
| 2 Testosterone and free androgen index Show forest plot | 2 | Mean Difference (IV, Fixed, 95% CI) | Subtotals only | |
| 2.1 LOD 4‐5 punctures vs 2 or fewer punctures (Testosterone) | 2 | 73 | Mean Difference (IV, Fixed, 95% CI) | ‐0.90 [‐1.12, ‐0.68] |
| 2.2 LOD 4 punctures vs 2 punctures (FAI) | 1 | 33 | Mean Difference (IV, Fixed, 95% CI) | ‐1.5 [‐3.21, 0.21] |
| Outcome or subgroup title | No. of studies | No. of participants | Statistical method | Effect size |
| 1 Menstrual regularity Show forest plot | 2 | Odds Ratio (M‐H, Fixed, 95% CI) | Totals not selected | |
| 1.1 LOD vs Adjusted thermal dose | 1 | Odds Ratio (M‐H, Fixed, 95% CI) | 0.0 [0.0, 0.0] | |
| 1.2 LOD unipolar vs LOD bipolar | 1 | Odds Ratio (M‐H, Fixed, 95% CI) | 0.0 [0.0, 0.0] | |
| 2 Harms Show forest plot | 1 | Odds Ratio (M‐H, Fixed, 95% CI) | Totals not selected | |
| 3 BMI Show forest plot | 1 | Mean Difference (IV, Fixed, 95% CI) | Totals not selected | |
| 4 Testosterone and free androgen index Show forest plot | 2 | Mean Difference (IV, Fixed, 95% CI) | Totals not selected | |
| 4.1 LOD vs Adjusted thermal dose | 1 | Mean Difference (IV, Fixed, 95% CI) | 0.0 [0.0, 0.0] | |
| 4.2 LOD unipolar vs LOD bipolar | 1 | Mean Difference (IV, Fixed, 95% CI) | 0.0 [0.0, 0.0] | |
| 5 Metabolic measures Show forest plot | 1 | Mean Difference (IV, Fixed, 95% CI) | Totals not selected | |
| 5.1 LOD (unipolar) vs bipolar | 1 | Mean Difference (IV, Fixed, 95% CI) | 0.0 [0.0, 0.0] | |