Isoflavones for hypercholesterolemia
Abstract
This is a protocol for a Cochrane Review (Intervention). The objectives are as follows:
To assess the effects of isoflavones for hypercholesterolemia.
Background
Description of the condition
Hypercholesterolemia is the presence of abnormally high levels of cholesterol in the blood, and it has reached epidemic proportions worldwide. In 2008, the highest serum total cholesterol concentrations worldwide were reported in Australasia, North America, and Western Europe (Farzadfar 2011). The regional mean of the serum total cholesterol levels was 5.24 mmol/L (95% confidence interval (CI), 5.08 to 5.39) for men and 5.23 mmol/L (95% CI, 5.03 to 5.43) for women, which meant that approximately 50% of the population in these countries may have suffered from hypercholesterolemia (Farzadfar 2011). In developing countries, the number of patients with hypercholesterolemia has risen during the past three decades, particularly in Asia (Farzadfar 2011). For example, in 2001, the prevalence of hypercholesterolemia was 33% in middle‐aged and older‐aged Chinese people (He 2004).
Hypercholesterolemia is a significant risk factor for cardiovascular diseases (CVDs). In humans, hypercholesterolemia is often due to high serum low‐density‐lipoprotein (LDL) cholesterol levels, which are generally atherogenic. Atherosclerosis is the pathological basis for most CVDs and is often characterized as the progressive accumulation of lipids in the vessel wall. The subsequent rate of atherogenesis is positively associated with the severity of associated risk factors including serum cholesterol levels (Badimon 2011). High levels of serum cholesterol particles may increase vascular superoxide production in the blood, alter endothelium‐dependent vasodilatation (widening of the cavity in a blood vessel), and then promote the formation of atherosclerosis plaques, and finally facilitate CVDs. Thus, lowering the blood total cholesterol levels may be of benefit to patients with CVDs. Several trials have demonstrated that treatment of high cholesterol levels played the most important role on more than half the decline in coronary heart disease mortality in the last decades (Ford 2007; Laatikainen 2005).
Description of the intervention
Rich sources of isoflavones, plant‐based chemicals related to phytoestrogen, are found in soy and red clover. Asian people consume more isoflavones from their regular diet than Western people. Daily isoflavones intake in Chinese and Japanese was estimated to be 15 to 50 mg/d (Kang 2010; Liu 2010; Shimazu 2010), whereas it was likely to be less than 3 mg/d in Europe and the United States populations (Chun 2007; Keinan 2002).
Hypercholesterolemia can be modified by therapeutic dietary changes including lowering cholesterol by diet or supplementing the diet with certain nutrients such as isoflavones. Isoflavones have many benefits for human health, such as improving osteoporosis and menopausal syndromes. In the last decade, several systematic reviews and meta‐analyses have assessed the effects of isoflavones on lipid profiles in humans (Taku 2007; Taku 2008; Weggemans 2003; Zhan 2005; Zhuo 2004). However, the conclusions of these reviews were inconsistent, which may be due to the different isoflavones used, dose levels, styles and durations of the trials, and the various initial serum lipid concentrations of the participants. Isoflavones were often supplemented through natural food (including soy, tofu and red clover), soy protein contained isoflavones, isoflavones extracts, and single compound of isoflavones such as genistein, daidzein or glycetein. Other components such as soy protein may have contributed to and confused the effect of isoflavones on the serum concentrations of total and LDL‐cholesterol (Taku 2007; Taku 2008).
Adverse effects of the intervention
Isoflavones have a safe side‐effect profile with moderately elevated rates of gastrointestinal side effects, such as abdominal bloating (Albertazzi 2005; Garrido 2006), gastralgia (stomach pain) (Nikander 2004), and back pain (Albertazzi 2005). The rare, but serious, adverse effects include endometrial hyperplasia (Unfer 2004) and recurrence of breast cancer (Nikander 2004).
How the intervention might work
The activities of the phytoestrogen component of isoflavones may play an important role in the effects of isoflavones on serum lipid profiles. Recently, clinical intervention studies have demonstrated that blood isoflavones metabolites (such as equol) levels were associated with the clinical effects of isoflavones, including several positive outcomes for vasomotor symptoms, increasing bone mineral density, and decreasing the cardiovascular risk factors LDL‐cholesterol and C‐reactive protein (Jackson 2011). Equol is naturally produced by the gut bacterial biotransformation of daidzein in certain individuals. There is a higher frequency of 'equol‐producers' in Asian populations (50% to 60%) than in Western populations (25% to 30%) (Setchell 2010). Several clinical studies have concluded that isoflavones may produce better clinical effects in equol‐producers than in non‐equol‐producers (Duncan 2000; Kreijkamp 2005; Setchell 2002).
The effects of isoflavones on serum lipid profiles may also contribute to their activities, independent of phytoestrogen. Cellular and animal studies demonstrated that genistein can act as an inhibitor of protein tyrosine kinase. In pancreatic beta cells, genistein acutely stimulates insulin secretion through a cyclic AMP (cAMP)‐dependent protein kinase pathway (Liu 2006).
Why it is important to do this review
There were some limitations of previously published meta‐analyses on this topic. First, only one meta‐analysis searched databases such as MEDLINE, EMBASE, The Cochrane Library, ICHUSHI, and China National Knowledge Infrastructure (CNKI) (Taku 2008). Other meta‐analyses only reviewed studies published in PubMed, and only those published in English (Taku 2007; Weggemans 2003; Zhan 2005; Zhuo 2004). Second, all these meta‐analyses focused on the short‐term effects of isoflavones on lipid profiles (Taku 2007; Taku 2008; Weggemans 2003; Zhan 2005; Zhuo 2004). Some clinical trials that focused on the long‐term effects of isoflavones on postmenopausal osteoporosis also evaluated blood lipid changes. However, the meta‐analyses seldom analyzed these clinical trials. Third, only one meta‐analysis mentioned any adverse effect of isoflavones intervention (Taku 2008). To resolve these limitations and to provide a better understanding of the effects of isoflavones for hypercholesterolemia, we want to undertake this review. In the present meta‐analysis, we will screen the studies through PubMed, EMBASE, The Cochrane Library, and CNKI, and primarily attempt to evaluate the long‐term effects of isoflavones for hypercholesterolemia.
Objectives
To assess the effects of isoflavones for hypercholesterolemia.
Methods
Criteria for considering studies for this review
Types of studies
Randomized controlled clinical trials.
Types of participants
Adults (18 years or older) with hypercholesterolemia.
Diagnostic criteria
Hypercholesterolemia is diagnosed by a fasting blood total cholesterol greater than 5.20 mmol/L (200 mg/dL). We will also accept other definitions. We will exclude people with familial hypercholesterolemia and secondary hypercholesterolemia.
Potentially, we will subject diagnostic criteria to a sensitivity analysis.
Types of interventions
| Intervention ▼ / Control ► | Placebo or other food with total isoflavone amount less than 5 mg/day | Soy protein containing no or low isoflavones with total isoflavone amount less than 5 mg/day |
| Natural food, isoflavones extracts, single compound of isoflavones with total isoflavone amount higher than or equal to 15 mg/day | yes | no |
| Soy protein containing isoflavones with total isoflavone amount higher than or equal to 15 mg/day | no | yes |
Types of outcome measures
Primary outcomes
-
death from any cause;
-
cardiovascular events (both fatal and non‐fatal events, including myocardial infarction, angina pectoris, stroke; peripheral arterial disease, sudden death);
-
blood LDL‐cholesterol levels.
Secondary outcomes
-
adverse events;
-
health‐related quality of life;
-
blood total cholesterol levels;
-
other blood lipid levels (including HDL‐cholesterol, triglycerides, apolipoprotein A and B);
-
costs.
Timing of outcome measurement
The minimum treatment duration will be three months. If one study has several time‐point results, we will use the longest time‐point result for overall effects analysis and use other time‐point results for subgroup analysis (that is less than or equal to six months and longer than six months). For cardiovascular events, intervention duration will be at least six months.
Search methods for identification of studies
Electronic searches
We will use the most recent version of the following sources for the identification of trials.
-
The Cochrane Library
-
MEDLINE
-
EMBASE
-
China National Knowledge Infrastructure
We will also search databases of ongoing trials (http://www.controlled‐trials.com/ with links to several databases and https://www.clinicaltrialsregister.eu/). We will provide information including trial identifier about recognized studies in the section 'Outcomes' in the 'Characteristics of included studies' table.
For detailed search strategies please see under Appendix 1 (searches will not be older than six months at the moment the final review draft is checked into the Cochrane Information and Management System for editorial approval).
If additional key words of relevance are detected during any of the electronic or other searches, we will modify the electronic search strategies to incorporate these terms. We will include studies published in any language.
We will send results of the electronic searches to the Editorial Base of the Cochrane Metabolic and Endocrine Disorders Group.
Searching other resources
We will try to identify additional studies by searching the reference lists of included trials,systematic reviews, meta‐analyses, and health technology assessment reports found as a result of the searches.
Data collection and analysis
Selection of studies
To determine the studies to be assessed further, two review authors (YQ, KN) will independently scan the abstract, title or both sections of every record retrieved. We will investigate all potentially relevant articles as full text. Where differences in opinion exist, they will be resolved by a third party. If resolving disagreement is not possible, we will add the article to those 'awaiting assessment' and we will contact authors for clarification. We will attach a PRISMA (preferred reporting items for systematic reviews and meta‐analyses) flow‐chart of study selection (Figure 1) (Liberati 2009).
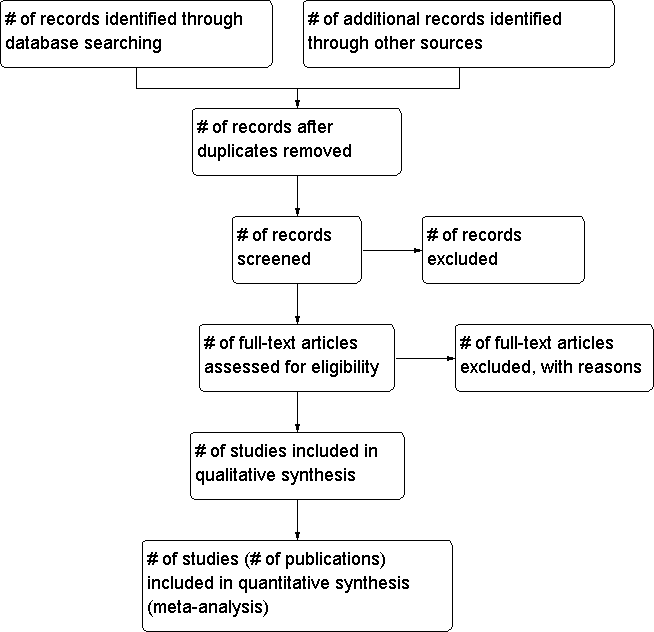
Study flow diagram.
Data extraction and management
For studies that fulfil the inclusion criteria, two review authors (YQ, KN) will independently abstract relevant population and intervention characteristics using standard data extraction templates (for details see 'Characteristics of included studies'; Table 1; Appendix 2; Appendix 3; Appendix 4; Appendix 5) with any disagreements to be resolved by discussion, or if required by a third party. We will send an email request to the contact persons of published studies to enquire whether authors are willing to answer questions regarding their trials. We will publish the results of this survey in Appendix 6. Thereafter, we will seek relevant missing information on the trial from the original author(s) of the article, if required.
| Study ID | Intervention(s) & control(s) | [n] screened | [n] randomized | [n] safety | [n] ITT | [n] finishing study | [%] of randomized participants |
| ID1 | I1: e.g. isoflavones C1: e.g. placebo | I1: C1: T: | I1: C1: T: | I1: C1: T: | I1: C1: T: | I1: C1: T: | I1: C1: T: |
| ID2 | I1: C1: | I1: C1: T: | I1: C1: T: | I1: C1: T: | I1: C1: T: | I1: C1: T: | I1: C1: T: |
| ID3 | I1: C1: | I1: C1: T: | I1: C1: T: | I1: C1: T: | I1: C1: T: | I1: C1: T: | I1: C1: T: |
| ID3 | I1: C1: | I1: C1: T: | I1: C1: T: | I1: C1: T: | I1: C1: T: | I1: C1: T: | I1: C1: T: |
| ID4 | I1: C1: | I1: C1: T: | I1: C1: T: | I1: C1: T: | I1: C1: T: | I1: C1: T: | I1: C1: T: |
| ID5 | I1: C1: | I1: C1: T: | I1: C1: T: | I1: C1: T: | I1: C1: T: | I1: C1: T: | I1: C1: T: |
| ID6 | I1: C1: | I1: C1: T: | I1: C1: T: | I1: C1: T: | I1: C1: T: | I1: C1: T: | I1: C1: T: |
| ID7 | I1: C1: | I1: C1: T: | I1: C1: T: | I1: C1: T: | I1: C1: T: | I1: C1: T: | I1: C1: T: |
| ID8 | I1: C1: | I1: C1: T: | I1: C1: T: | I1: C1: T: | I1: C1: T: | I1: C1: T: | I1: C1: T: |
| ID9 | I1: C1: | I1: C1: T: | I1: C1: T: | I1: C1: T: | I1: C1: T: | I1: C1: T: | I1: C1: T: |
| Total | I1: C1: T: | I1: C1: T: |
./. : not reported
C: control; I: intervention; ITT: intention‐to‐treat; T: Total
Dealing with duplicate publications
In the case of duplicate publications and companion papers of a primary study, we will try to maximise yield of information by simultaneous evaluation of all available data.
Assessment of risk of bias in included studies
Two review authors (YQ, KN) will assess each trial independently. Possible disagreements will be resolved by consensus, or with consultation with a third party. In cases of disagreement, we will consult the rest of the group and a judgement will be made based on consensus.
We will assess risk of bias using The Cochrane Collaboration’s tool (Higgins 2011). We will use the following bias criteria:
-
random sequence generation (selection bias);
-
allocation concealment (selection bias);
-
blinding (performance bias and detection bias), separated for blinding of participants and personnel and blinding of outcome assessment;
-
incomplete outcome data (attrition bias);
-
selective reporting (reporting bias);
-
other bias.
We will judge risk of bias criteria as 'low risk', 'high risk' or 'unclear risk' and use individual bias items as described in the Cochrane Handbook for Systematic Reviews of Interventions (Higgins 2011). We will attach a 'Risk of bias' graph and a 'Risk of bias' summary as figures.
We will assess the impact of individual bias domains on study results at endpoint and study levels.
Measures of treatment effect
We will express dichotomous data as odds ratio (OR) or risk ratio (RR) with 95% confidence intervals (CI). We will express continuous data as differences in means (MD) with 95% CI.
Unit of analysis issues
We will take into account the level at which randomization occurred, such as cross‐over trials, cluster‐randomized trials and multiple observations for the same outcome.
Dealing with missing data
We will obtain relevant missing data from authors, if feasible and carefully perform evaluation of important numerical data such as screened, randomized patients as well as intention‐to‐treat (ITT), as‐treated and per‐protocol (PP) populations. We will investigate attrition rates, for example, drop‐outs, losses to follow up and withdrawals and critically appraise issues of missing data and imputation methods (for example last‐observation‐carried‐forward (LOCF)).
Assessment of heterogeneity
In the event of substantial clinical or methodological or statistical heterogeneity, we will not report study results as meta‐analytically pooled effect estimates.
We will identify heterogeneity by visual inspection of the forest plots and by using a standard Chi2 test with a significance level of α = 0.1, in view of the low power of this test. We specifically will examine heterogeneity employing the I2 statistic which quantifies inconsistency across studies to assess the impact of heterogeneity on the meta‐analysis (Higgins 2002; Higgins 2003), where an I2 statistic of 75% and more indicates a considerable level of inconsistency (Higgins 2011).
When heterogeneity is found, we will attempt to determine potential reasons for it by examining individual study and subgroup characteristics.
We expect the following characteristics to introduce clinical heterogeneity:
-
Asian and non‐Asian populations (due to their different genotype, diet style, and equol metabolism phenotype etc);
-
degree of hypercholesterolemia;
-
previous cardiovascular events;
-
other cardiovascular risk factors.
Assessment of reporting biases
We will use funnel plots in case we include more than 10 studies for a given outcome to assess small study bias. There are a number of explanations for the asymmetry of a funnel plot (Sterne 2001) and we will carefully interpret results (Lau 2006).
Data synthesis
We will primarily summarize low‐risk of bias data by means of a random‐effects model. We will perform statistical analyses according to the statistical guidelines referenced in the most recent version of the Cochrane Handbook for Systematic Reviews of Interventions (Higgins 2011).
Subgroup analysis and investigation of heterogeneity
We will mainly carry out subgroup analyses of the primary outcome parameter(s) (see above) and investigate interaction.
The following subgroup analyses are planned:
-
Asian and non‐Asian population;
-
male and female;
-
hypercholesterolemia with or without hypertriglyceridemia;
-
equol and non‐equol producers.
Sensitivity analysis
We will perform sensitivity analyses in order to explore the influence of the following factors on effect size:
-
restricting the analysis to published studies;
-
restricting the analysis taking account risk of bias, as specified above;
-
restricting the analysis to very long or large studies to establish how much they dominate the results;
-
restricting the analysis to studies using the following filters: diagnostic criteria, language of publication, source of funding (industry versus other), country.
We will also test the robustness of the results by repeating the analysis using different measures of effect size (RR, OR etc.) and different statistical models (fixed‐effect model and random‐effects model).

Study flow diagram.
| Study ID | Intervention(s) & control(s) | [n] screened | [n] randomized | [n] safety | [n] ITT | [n] finishing study | [%] of randomized participants |
| ID1 | I1: e.g. isoflavones C1: e.g. placebo | I1: C1: T: | I1: C1: T: | I1: C1: T: | I1: C1: T: | I1: C1: T: | I1: C1: T: |
| ID2 | I1: C1: | I1: C1: T: | I1: C1: T: | I1: C1: T: | I1: C1: T: | I1: C1: T: | I1: C1: T: |
| ID3 | I1: C1: | I1: C1: T: | I1: C1: T: | I1: C1: T: | I1: C1: T: | I1: C1: T: | I1: C1: T: |
| ID3 | I1: C1: | I1: C1: T: | I1: C1: T: | I1: C1: T: | I1: C1: T: | I1: C1: T: | I1: C1: T: |
| ID4 | I1: C1: | I1: C1: T: | I1: C1: T: | I1: C1: T: | I1: C1: T: | I1: C1: T: | I1: C1: T: |
| ID5 | I1: C1: | I1: C1: T: | I1: C1: T: | I1: C1: T: | I1: C1: T: | I1: C1: T: | I1: C1: T: |
| ID6 | I1: C1: | I1: C1: T: | I1: C1: T: | I1: C1: T: | I1: C1: T: | I1: C1: T: | I1: C1: T: |
| ID7 | I1: C1: | I1: C1: T: | I1: C1: T: | I1: C1: T: | I1: C1: T: | I1: C1: T: | I1: C1: T: |
| ID8 | I1: C1: | I1: C1: T: | I1: C1: T: | I1: C1: T: | I1: C1: T: | I1: C1: T: | I1: C1: T: |
| ID9 | I1: C1: | I1: C1: T: | I1: C1: T: | I1: C1: T: | I1: C1: T: | I1: C1: T: | I1: C1: T: |
| Total | I1: C1: T: | I1: C1: T: | |||||
| ./. : not reported C: control; I: intervention; ITT: intention‐to‐treat; T: Total | |||||||