Scolaris Content Display Scolaris Content Display

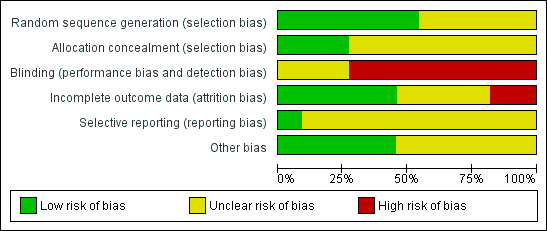
Risk of bias graph: review authors' judgements about each risk of bias item presented as percentages across all included studies.
Figuras y tablas -
Figure 1

Risk of bias graph: review authors' judgements about each risk of bias item presented as percentages across all included studies.

Risk of bias summary: review authors' judgements about each risk of bias item for each included study.
Figuras y tablas -
Figure 2

Risk of bias summary: review authors' judgements about each risk of bias item for each included study.

Comparison 1 Relaxation versus usual care, Outcome 1 Pain intensity.
Figuras y tablas -
Analysis 1.1

Comparison 1 Relaxation versus usual care, Outcome 1 Pain intensity.

Comparison 1 Relaxation versus usual care, Outcome 2 Maternal perception of pain.
Figuras y tablas -
Analysis 1.2

Comparison 1 Relaxation versus usual care, Outcome 2 Maternal perception of pain.

Comparison 1 Relaxation versus usual care, Outcome 3 Satisfaction with pain relief in labour.
Figuras y tablas -
Analysis 1.3

Comparison 1 Relaxation versus usual care, Outcome 3 Satisfaction with pain relief in labour.

Comparison 1 Relaxation versus usual care, Outcome 4 Satisfaction with childbirth experience.
Figuras y tablas -
Analysis 1.4

Comparison 1 Relaxation versus usual care, Outcome 4 Satisfaction with childbirth experience.

Comparison 1 Relaxation versus usual care, Outcome 5 Assisted vaginal delivery.
Figuras y tablas -
Analysis 1.5

Comparison 1 Relaxation versus usual care, Outcome 5 Assisted vaginal delivery.

Comparison 1 Relaxation versus usual care, Outcome 6 Caesarean delivery.
Figuras y tablas -
Analysis 1.6

Comparison 1 Relaxation versus usual care, Outcome 6 Caesarean delivery.

Comparison 1 Relaxation versus usual care, Outcome 7 Apgar score < 7 at 5 minutes.
Figuras y tablas -
Analysis 1.7

Comparison 1 Relaxation versus usual care, Outcome 7 Apgar score < 7 at 5 minutes.

Comparison 1 Relaxation versus usual care, Outcome 8 Use of pharmacological pain relief.
Figuras y tablas -
Analysis 1.8

Comparison 1 Relaxation versus usual care, Outcome 8 Use of pharmacological pain relief.

Comparison 1 Relaxation versus usual care, Outcome 9 Length of labour.
Figuras y tablas -
Analysis 1.9

Comparison 1 Relaxation versus usual care, Outcome 9 Length of labour.

Comparison 1 Relaxation versus usual care, Outcome 10 Augmentation with oxytocin.
Figuras y tablas -
Analysis 1.10

Comparison 1 Relaxation versus usual care, Outcome 10 Augmentation with oxytocin.

Comparison 2 Yoga versus control, Outcome 1 Pain intensity.
Figuras y tablas -
Analysis 2.1

Comparison 2 Yoga versus control, Outcome 1 Pain intensity.

Comparison 2 Yoga versus control, Outcome 2 Satisfaction with pain relief.
Figuras y tablas -
Analysis 2.2

Comparison 2 Yoga versus control, Outcome 2 Satisfaction with pain relief.

Comparison 2 Yoga versus control, Outcome 3 Satisfaction with childbirth experience.
Figuras y tablas -
Analysis 2.3

Comparison 2 Yoga versus control, Outcome 3 Satisfaction with childbirth experience.

Comparison 2 Yoga versus control, Outcome 4 Apgar score less than seven at five minutes.
Figuras y tablas -
Analysis 2.4

Comparison 2 Yoga versus control, Outcome 4 Apgar score less than seven at five minutes.

Comparison 2 Yoga versus control, Outcome 5 Use of pharmacological pain relief.
Figuras y tablas -
Analysis 2.5

Comparison 2 Yoga versus control, Outcome 5 Use of pharmacological pain relief.

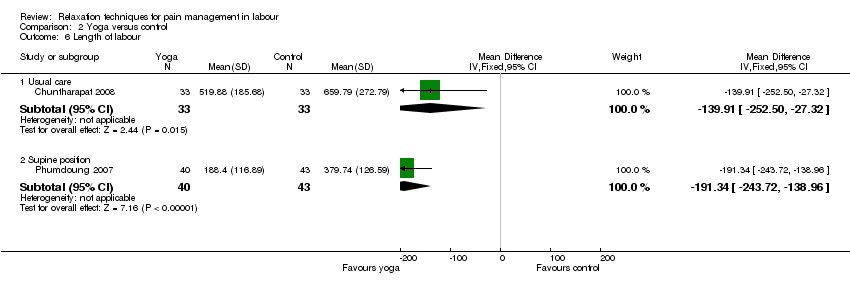
Comparison 2 Yoga versus control, Outcome 6 Length of labour.
Figuras y tablas -
Analysis 2.6

Comparison 2 Yoga versus control, Outcome 6 Length of labour.

Comparison 2 Yoga versus control, Outcome 7 Augmentation with oxytocin.
Figuras y tablas -
Analysis 2.7

Comparison 2 Yoga versus control, Outcome 7 Augmentation with oxytocin.

Comparison 3 Music versus control, Outcome 1 Pain intensity.
Figuras y tablas -
Analysis 3.1

Comparison 3 Music versus control, Outcome 1 Pain intensity.

Comparison 3 Music versus control, Outcome 2 Caesarean section.
Figuras y tablas -
Analysis 3.2

Comparison 3 Music versus control, Outcome 2 Caesarean section.

Comparison 3 Music versus control, Outcome 3 Use of pharmacological pain relief (epidural).
Figuras y tablas -
Analysis 3.3

Comparison 3 Music versus control, Outcome 3 Use of pharmacological pain relief (epidural).

Comparison 3 Music versus control, Outcome 4 Length of labour.
Figuras y tablas -
Analysis 3.4

Comparison 3 Music versus control, Outcome 4 Length of labour.

Comparison 3 Music versus control, Outcome 5 Anxiety.
Figuras y tablas -
Analysis 3.5

Comparison 3 Music versus control, Outcome 5 Anxiety.

Comparison 4 Audio‐analgesia compared versus control, Outcome 1 Satisfaction with pain relief.
Figuras y tablas -
Analysis 4.1

Comparison 4 Audio‐analgesia compared versus control, Outcome 1 Satisfaction with pain relief.

Comparison 1. Relaxation versus usual care

Outcome or subgroup title

No. of studies

No. of participants

Statistical method

Effect size

1 Pain intensity Show forest plot

2

Mean Difference (IV, Fixed, 95% CI)

Subtotals only

1.1 Latent phase

1

40

Mean Difference (IV, Fixed, 95% CI)

‐1.25 [‐1.97, ‐0.53]

1.2 Active phase

2

74

Mean Difference (IV, Fixed, 95% CI)

‐2.48 [‐3.13, ‐1.83]

1.3 Transition

1

40

Mean Difference (IV, Fixed, 95% CI)

0.0 [0.0, 0.0]

2 Maternal perception of pain Show forest plot

1

904

Mean Difference (IV, Fixed, 95% CI)

0.0 [‐0.22, 0.22]

3 Satisfaction with pain relief in labour Show forest plot

1

40

Risk Ratio (M‐H, Fixed, 95% CI)

8.0 [1.10, 58.19]

4 Satisfaction with childbirth experience Show forest plot

1

904

Mean Difference (IV, Fixed, 95% CI)

‐0.40 [‐3.47, 2.67]

5 Assisted vaginal delivery Show forest plot

2

86

Risk Ratio (M‐H, Random, 95% CI)

0.07 [0.01, 0.50]

6 Caesarean delivery Show forest plot

2

Risk Ratio (M‐H, Random, 95% CI)

Subtotals only

7 Apgar score < 7 at 5 minutes Show forest plot

1

34

Risk Ratio (M‐H, Fixed, 95% CI)

0.47 [0.02, 10.69]

8 Use of pharmacological pain relief Show forest plot

1

904

Risk Ratio (M‐H, Fixed, 95% CI)

1.00 [0.88, 1.13]

8.1 Epidural

1

904

Risk Ratio (M‐H, Fixed, 95% CI)

1.00 [0.88, 1.13]

9 Length of labour Show forest plot

1

36

Mean Difference (IV, Fixed, 95% CI)

105.56 [‐1.50, 212.62]

10 Augmentation with oxytocin Show forest plot

1

34

Risk Ratio (M‐H, Fixed, 95% CI)

1.14 [0.82, 1.59]

Figuras y tablas -
Comparison 1. Relaxation versus usual care
Comparison 2. Yoga versus control

Outcome or subgroup title

No. of studies

No. of participants

Statistical method

Effect size

1 Pain intensity Show forest plot

1

66

Mean Difference (IV, Fixed, 95% CI)

‐6.12 [‐11.77, ‐0.47]

1.1 Latent phase

1

66

Mean Difference (IV, Fixed, 95% CI)

‐6.12 [‐11.77, ‐0.47]

2 Satisfaction with pain relief Show forest plot

1

66

Mean Difference (IV, Fixed, 95% CI)

7.88 [1.51, 14.25]

2.1 Latent phase

1

66

Mean Difference (IV, Fixed, 95% CI)

7.88 [1.51, 14.25]

3 Satisfaction with childbirth experience Show forest plot

1

66

Mean Difference (IV, Fixed, 95% CI)

6.34 [0.26, 12.42]

3.1 Usual care

1

66

Mean Difference (IV, Fixed, 95% CI)

6.34 [0.26, 12.42]

4 Apgar score less than seven at five minutes Show forest plot

1

66

Risk Ratio (M‐H, Fixed, 95% CI)

0.0 [0.0, 0.0]

5 Use of pharmacological pain relief Show forest plot

2

Risk Ratio (M‐H, Fixed, 95% CI)

Subtotals only

5.1 Usual care

1

66

Risk Ratio (M‐H, Fixed, 95% CI)

0.82 [0.49, 1.38]

5.2 Supine position

1

83

Risk Ratio (M‐H, Fixed, 95% CI)

0.05 [0.01, 0.35]

6 Length of labour Show forest plot

2

Mean Difference (IV, Fixed, 95% CI)

Subtotals only

6.1 Usual care

1

66

Mean Difference (IV, Fixed, 95% CI)

‐139.91 [‐252.50, ‐27.32]

6.2 Supine position

1

83

Mean Difference (IV, Fixed, 95% CI)

‐191.34 [‐243.72, ‐138.96]

7 Augmentation with oxytocin Show forest plot

1

66

Risk Ratio (M‐H, Fixed, 95% CI)

0.76 [0.45, 1.31]

Figuras y tablas -
Comparison 2. Yoga versus control
Comparison 3. Music versus control

Outcome or subgroup title

No. of studies

No. of participants

Statistical method

Effect size

1 Pain intensity Show forest plot

1

Mean Difference (IV, Fixed, 95% CI)

Subtotals only

1.1 Latent phase

1

60

Mean Difference (IV, Fixed, 95% CI)

‐0.17 [‐1.41, 1.07]

1.2 Active phase

1

60

Mean Difference (IV, Fixed, 95% CI)

‐0.18 [‐0.70, 0.34]

2 Caesarean section Show forest plot

1

60

Risk Ratio (M‐H, Fixed, 95% CI)

1.25 [0.37, 4.21]

3 Use of pharmacological pain relief (epidural) Show forest plot

1

60

Risk Ratio (M‐H, Fixed, 95% CI)

0.83 [0.53, 1.32]

4 Length of labour Show forest plot

1

60

Mean Difference (IV, Fixed, 95% CI)

‐2.60 [‐11.58, 6.38]

4.1 Second stage

1

60

Mean Difference (IV, Fixed, 95% CI)

‐2.60 [‐11.58, 6.38]

5 Anxiety Show forest plot

1

Mean Difference (IV, Fixed, 95% CI)

Subtotals only

5.1 Latent phase

1

60

Mean Difference (IV, Fixed, 95% CI)

1.18 [‐0.13, 2.49]

5.2 Active phase

1

60

Mean Difference (IV, Fixed, 95% CI)

0.54 [‐0.56, 1.64]

Figuras y tablas -
Comparison 3. Music versus control
Comparison 4. Audio‐analgesia compared versus control

Outcome or subgroup title

No. of studies

No. of participants

Statistical method

Effect size

1 Satisfaction with pain relief Show forest plot

1

24

Risk Ratio (M‐H, Fixed, 95% CI)

2.0 [0.82, 4.89]

Figuras y tablas -
Comparison 4. Audio‐analgesia compared versus control