Relaxation techniques for pain management in labour
Appendices
Appendix 1. CENTRAL search strategy
#1 (labor or labour):ti.ab.kw
#2 Labo*r
#3 (childbirth or child‐birth or child birth) in Clinical Trials
#4 midwife*in Clinical Trial
#5 obstetric* in Clinical Trials*
#6 labo*r pain in Clinical Trials
#7 pain*labo*r in Clinical Trials
#8 contraction* in Clinical trials
#9 Pain management in Clinical Trials
#10 pain* manage* in Clinical Trials
#11 (#1 OR #2 OR #3 OR #4 OR #5 #6 OR #7 OR #8 OR #9 OR #10)
#12 MeSH descriptor Relaxation explode all trees
#13 yoga in Clincal Trials
#14 meditation in Clinical Trials
#15 imagery in Clinical trials
#16 visuali*ation in Clinical Trials
#17 breathing exercises in Clinical Trials
#18 (#12 OR #13 OR #14 OR #15 OR #16 OR #17)
#19 (#11 AND #12)
Appendix 2. MEDLINE search strategy
MEDLINE SEARCH:
1. yoga.mp. or exp Yoga/
2. meditation.mp. or exp Meditation/
3. imagery.mp. or exp "Imagery (Psychotherapy)"/
4. visualisation.mp.
5. 3 or 4
6. exp Relaxation/ or relaxation.mp.
7. breathing exercises.mp. or exp Breathing Exercises/
8. 1 or 2 or 5 or 6 or 7
9. exp Labor, Obstetric/ or exp Labor Presentation/ or exp Labor, Induced/ or exp Labor Pain/ or labo*r.mp. or exp Labor Onset/ or exp Labor Stage, First/
10. (childbirth or child birth or child‐birth).tw.
11. (labour or labor).ab.
12. pain$.mp.
13. pain manag$.mp. or exp Pain/
14. exp Labor, Obstetric/ or labo*r.mp.
15. or/9‐14
16. 8 and 15
17. randomi*ed controlled trial.pt.
18. controlled clinical trial.pt.
19. (randomized or randomised).ab.
20. placebo.ab.
21. drug therapy.fs.
22. randomly.ab.
23. trial.ab.
24. groups.ab.
25. or/17‐24
26. (animals not (humans and animals)).sh.
27. 25 not 26
28. 16 and 27
Appendix 3. CINAHL search strategy
S28. S25 and S26 and S27
S27. S7 or S8 or S9 or S10 or S11 or S12 or S13 or S14 or S15 or S16 or S17
S26. S1 or S2 or S3 or S4 or S5 or S6
S25. S18 or S19 or S20 or S21 or S22 or S23 or S24
S24. clinical trials
S23. Randomi*ed control# trial#
S22. random assignment
S21. random# allocation
S20. placebo#
S19. placebos/
S18. quantitative studies/
S17. AB(labo*r pain)
S16. AB(pain or labo*r pain)
S15. AB pain# manage#
S14. AB pain#
S13. AB midwife#
S12. AB midwi#
S11. AB obstetric#
S10. AB (childbirth or child birth or child‐birth)
S9. AB labor or labour
S8. MW labor or labour
S7. labor or labour
S6. MW guided imagery
S5. MW breathing exercises
S4. MW relaxation
S3. MW imagery or MW visuali*ation
S2. MW meditation#
S1. MW yoga
Appendix 4. Ongoing trials registers searches
We used the following search terms: obstetrics; labor; labour; birth; pain each combined with the terms yoga; meditation; imagery; visualisation; relaxation; breathing exercises, using the Boolean operator AND
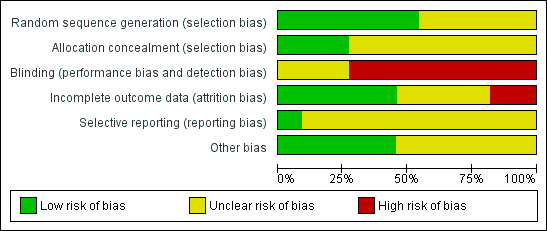
Risk of bias graph: review authors' judgements about each risk of bias item presented as percentages across all included studies.

Risk of bias summary: review authors' judgements about each risk of bias item for each included study.

Comparison 1 Relaxation versus usual care, Outcome 1 Pain intensity.

Comparison 1 Relaxation versus usual care, Outcome 2 Maternal perception of pain.

Comparison 1 Relaxation versus usual care, Outcome 3 Satisfaction with pain relief in labour.
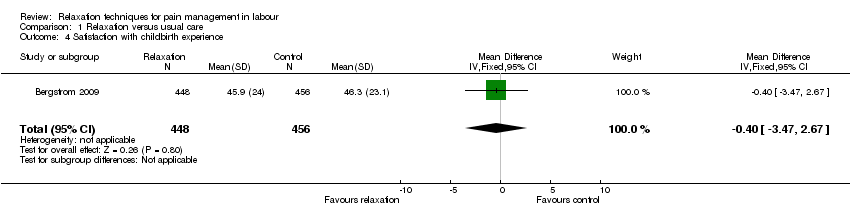
Comparison 1 Relaxation versus usual care, Outcome 4 Satisfaction with childbirth experience.

Comparison 1 Relaxation versus usual care, Outcome 5 Assisted vaginal delivery.
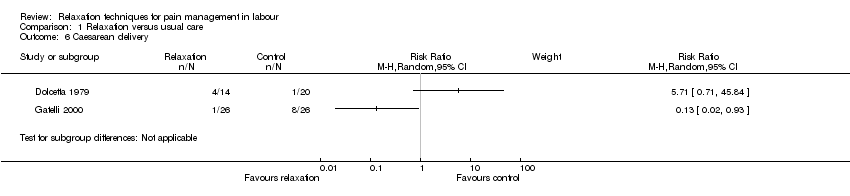
Comparison 1 Relaxation versus usual care, Outcome 6 Caesarean delivery.
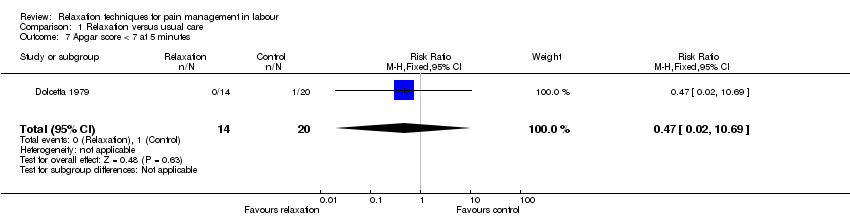
Comparison 1 Relaxation versus usual care, Outcome 7 Apgar score < 7 at 5 minutes.
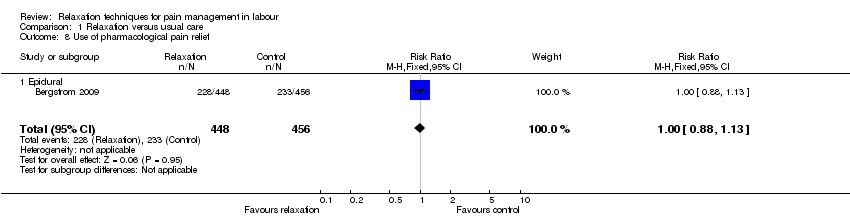
Comparison 1 Relaxation versus usual care, Outcome 8 Use of pharmacological pain relief.

Comparison 1 Relaxation versus usual care, Outcome 9 Length of labour.
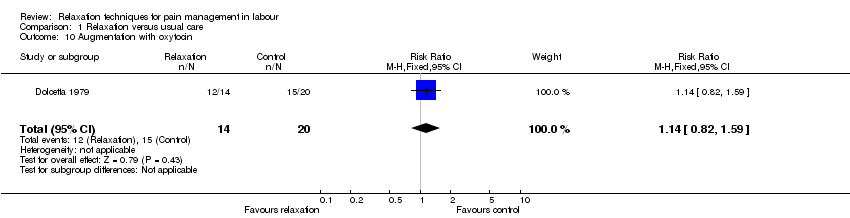
Comparison 1 Relaxation versus usual care, Outcome 10 Augmentation with oxytocin.

Comparison 2 Yoga versus control, Outcome 1 Pain intensity.

Comparison 2 Yoga versus control, Outcome 2 Satisfaction with pain relief.

Comparison 2 Yoga versus control, Outcome 3 Satisfaction with childbirth experience.

Comparison 2 Yoga versus control, Outcome 4 Apgar score less than seven at five minutes.

Comparison 2 Yoga versus control, Outcome 5 Use of pharmacological pain relief.
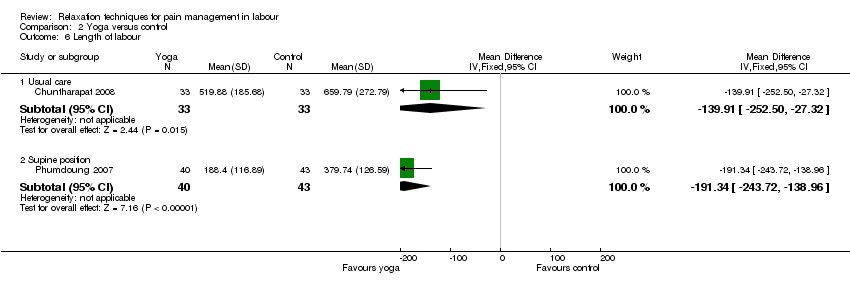
Comparison 2 Yoga versus control, Outcome 6 Length of labour.

Comparison 2 Yoga versus control, Outcome 7 Augmentation with oxytocin.

Comparison 3 Music versus control, Outcome 1 Pain intensity.

Comparison 3 Music versus control, Outcome 2 Caesarean section.
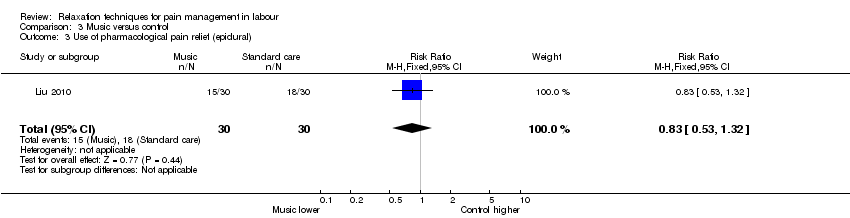
Comparison 3 Music versus control, Outcome 3 Use of pharmacological pain relief (epidural).

Comparison 3 Music versus control, Outcome 4 Length of labour.

Comparison 3 Music versus control, Outcome 5 Anxiety.
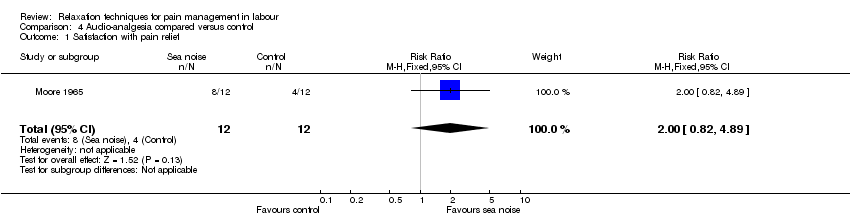
Comparison 4 Audio‐analgesia compared versus control, Outcome 1 Satisfaction with pain relief.
| Outcome or subgroup title | No. of studies | No. of participants | Statistical method | Effect size |
| 1 Pain intensity Show forest plot | 2 | Mean Difference (IV, Fixed, 95% CI) | Subtotals only | |
| 1.1 Latent phase | 1 | 40 | Mean Difference (IV, Fixed, 95% CI) | ‐1.25 [‐1.97, ‐0.53] |
| 1.2 Active phase | 2 | 74 | Mean Difference (IV, Fixed, 95% CI) | ‐2.48 [‐3.13, ‐1.83] |
| 1.3 Transition | 1 | 40 | Mean Difference (IV, Fixed, 95% CI) | 0.0 [0.0, 0.0] |
| 2 Maternal perception of pain Show forest plot | 1 | 904 | Mean Difference (IV, Fixed, 95% CI) | 0.0 [‐0.22, 0.22] |
| 3 Satisfaction with pain relief in labour Show forest plot | 1 | 40 | Risk Ratio (M‐H, Fixed, 95% CI) | 8.0 [1.10, 58.19] |
| 4 Satisfaction with childbirth experience Show forest plot | 1 | 904 | Mean Difference (IV, Fixed, 95% CI) | ‐0.40 [‐3.47, 2.67] |
| 5 Assisted vaginal delivery Show forest plot | 2 | 86 | Risk Ratio (M‐H, Random, 95% CI) | 0.07 [0.01, 0.50] |
| 6 Caesarean delivery Show forest plot | 2 | Risk Ratio (M‐H, Random, 95% CI) | Subtotals only | |
| 7 Apgar score < 7 at 5 minutes Show forest plot | 1 | 34 | Risk Ratio (M‐H, Fixed, 95% CI) | 0.47 [0.02, 10.69] |
| 8 Use of pharmacological pain relief Show forest plot | 1 | 904 | Risk Ratio (M‐H, Fixed, 95% CI) | 1.00 [0.88, 1.13] |
| 8.1 Epidural | 1 | 904 | Risk Ratio (M‐H, Fixed, 95% CI) | 1.00 [0.88, 1.13] |
| 9 Length of labour Show forest plot | 1 | 36 | Mean Difference (IV, Fixed, 95% CI) | 105.56 [‐1.50, 212.62] |
| 10 Augmentation with oxytocin Show forest plot | 1 | 34 | Risk Ratio (M‐H, Fixed, 95% CI) | 1.14 [0.82, 1.59] |
| Outcome or subgroup title | No. of studies | No. of participants | Statistical method | Effect size |
| 1 Pain intensity Show forest plot | 1 | 66 | Mean Difference (IV, Fixed, 95% CI) | ‐6.12 [‐11.77, ‐0.47] |
| 1.1 Latent phase | 1 | 66 | Mean Difference (IV, Fixed, 95% CI) | ‐6.12 [‐11.77, ‐0.47] |
| 2 Satisfaction with pain relief Show forest plot | 1 | 66 | Mean Difference (IV, Fixed, 95% CI) | 7.88 [1.51, 14.25] |
| 2.1 Latent phase | 1 | 66 | Mean Difference (IV, Fixed, 95% CI) | 7.88 [1.51, 14.25] |
| 3 Satisfaction with childbirth experience Show forest plot | 1 | 66 | Mean Difference (IV, Fixed, 95% CI) | 6.34 [0.26, 12.42] |
| 3.1 Usual care | 1 | 66 | Mean Difference (IV, Fixed, 95% CI) | 6.34 [0.26, 12.42] |
| 4 Apgar score less than seven at five minutes Show forest plot | 1 | 66 | Risk Ratio (M‐H, Fixed, 95% CI) | 0.0 [0.0, 0.0] |
| 5 Use of pharmacological pain relief Show forest plot | 2 | Risk Ratio (M‐H, Fixed, 95% CI) | Subtotals only | |
| 5.1 Usual care | 1 | 66 | Risk Ratio (M‐H, Fixed, 95% CI) | 0.82 [0.49, 1.38] |
| 5.2 Supine position | 1 | 83 | Risk Ratio (M‐H, Fixed, 95% CI) | 0.05 [0.01, 0.35] |
| 6 Length of labour Show forest plot | 2 | Mean Difference (IV, Fixed, 95% CI) | Subtotals only | |
| 6.1 Usual care | 1 | 66 | Mean Difference (IV, Fixed, 95% CI) | ‐139.91 [‐252.50, ‐27.32] |
| 6.2 Supine position | 1 | 83 | Mean Difference (IV, Fixed, 95% CI) | ‐191.34 [‐243.72, ‐138.96] |
| 7 Augmentation with oxytocin Show forest plot | 1 | 66 | Risk Ratio (M‐H, Fixed, 95% CI) | 0.76 [0.45, 1.31] |
| Outcome or subgroup title | No. of studies | No. of participants | Statistical method | Effect size |
| 1 Pain intensity Show forest plot | 1 | Mean Difference (IV, Fixed, 95% CI) | Subtotals only | |
| 1.1 Latent phase | 1 | 60 | Mean Difference (IV, Fixed, 95% CI) | ‐0.17 [‐1.41, 1.07] |
| 1.2 Active phase | 1 | 60 | Mean Difference (IV, Fixed, 95% CI) | ‐0.18 [‐0.70, 0.34] |
| 2 Caesarean section Show forest plot | 1 | 60 | Risk Ratio (M‐H, Fixed, 95% CI) | 1.25 [0.37, 4.21] |
| 3 Use of pharmacological pain relief (epidural) Show forest plot | 1 | 60 | Risk Ratio (M‐H, Fixed, 95% CI) | 0.83 [0.53, 1.32] |
| 4 Length of labour Show forest plot | 1 | 60 | Mean Difference (IV, Fixed, 95% CI) | ‐2.60 [‐11.58, 6.38] |
| 4.1 Second stage | 1 | 60 | Mean Difference (IV, Fixed, 95% CI) | ‐2.60 [‐11.58, 6.38] |
| 5 Anxiety Show forest plot | 1 | Mean Difference (IV, Fixed, 95% CI) | Subtotals only | |
| 5.1 Latent phase | 1 | 60 | Mean Difference (IV, Fixed, 95% CI) | 1.18 [‐0.13, 2.49] |
| 5.2 Active phase | 1 | 60 | Mean Difference (IV, Fixed, 95% CI) | 0.54 [‐0.56, 1.64] |
| Outcome or subgroup title | No. of studies | No. of participants | Statistical method | Effect size |
| 1 Satisfaction with pain relief Show forest plot | 1 | 24 | Risk Ratio (M‐H, Fixed, 95% CI) | 2.0 [0.82, 4.89] |