Técnicas de relajación para el tratamiento del dolor durante el trabajo de parto
Información
- DOI:
- https://doi.org/10.1002/14651858.CD009514.pub2Copiar DOI

- Base de datos:
-
- Cochrane Database of Systematic Reviews
- Versión publicada:
-
- 28 marzo 2018see what's new
- Tipo:
-
- Intervention
- Etapa:
-
- Review
- Grupo Editorial Cochrane:
-
Grupo Cochrane de Embarazo y parto
- Copyright:
-
- Copyright © 2018 The Cochrane Collaboration. Published by John Wiley & Sons, Ltd.
Cifras del artículo
Altmetric:
Citado por:
Autores
Contributions of authors
Caroline Smith and Carmel Collins conceptualised and wrote the protocol, reviewed trials, performed data extraction and jointly wrote the review and its update.
Kate Levett reviewed trials, performed data extraction and jointly wrote the review and its update.
Mike Armour undertook additional searches, data extraction, reviewed trials, prepared the 'Summary of findings' tables and commented on the draft of the paper.
Machiko Suganuma, reviewed trials and commented on the draft.
Hannah Dahlen contributed to the discussion and conclusion.
Caroline Smith is the guarantor of the review.
Sources of support
Internal sources
-
NICM, Western Sydney University, Australia.
-
Women's and Children's Health Research Institute, Flinders Medical Centre South Australia, Australia.
-
Children, Youth and Women's Health Services, Adelaide, Australia.
-
The University of Adelaide, Adelaide, Australia.
External sources
-
WHO UNDP‐UNFPA‐UNICEF‐WHO‐World Bank Special Programme of Research, Development and Research Training in Human Reproduction (HRP), Department of Reproductive Health and Research (RHR), World Health Organization, Switzerland.
Declarations of interest
Caroline A Smith: as a medical research institute, National Institute of Complementary Medicine (NICM) receives research grants and donations from foundations, universities, government agencies and industry. Sponsors and donors provide untied and tied funding for work to advance the vision and mission of the Institute. This systematic review was not specifically supported by donor or sponsor funding to NICM.
Kate M Levett: is employed at The University of Notre Dame, School of Medicine, and as a medical school receives research grants and donations from Foundations, Government agencies and industry. Kate Levett offers private acupressure for labour and birth education classes in Sydney Australia, these classes include complementary therapy strategies, such as relaxation and massage, for pain relief in labour.
Carmel T Collins: none known.
Mike Armour: is an acupuncturist, not current in clinical practice and until recently was a director of an acupuncture and physiotherapy clinic. As a medical research institute, National Institute of Complementary Medicine (NICM) receives research grants and donations from foundations, universities, government agencies and industry. Sponsors and donors provide untied and tied funding for work to advance the vision and mission of the Institute. This systematic review was not specifically supported by donor or sponsor funding to NICM.
Hannah G Dahlen: none known
Machiko Suganuma: none known.
Acknowledgements
We are grateful for the assistance of the staff in the editorial office for their help with preparing this review, in particular Therese Dowswell, Anna Cuthbert and Lynn Hampson, and the helpful comments from the consumer and statistical referees, and the Cochrane Pregnancy and Childbirth Editor.
We thank Caroline Crowther for her contribution to the protocol and previous versions of the review.
As part of the pre‐publication editorial process, this review has been commented on by two peers (an editor and referee who is external to the editorial team), a member of Pregnancy and Childbirth's international panel of consumers and the Group's Statistical Adviser.
This project was supported by the National Institute for Health Research, via Cochrane Infrastructure funding to Cochrane Pregnancy and Childbirth. The views and opinions expressed therein are those of the review authors and do not necessarily reflect those of the Systematic Reviews Programme, NIHR, NHS or the Department of Health.
Version history
| Published | Title | Stage | Authors | Version |
| 2018 Mar 28 | Relaxation techniques for pain management in labour | Review | Caroline A Smith, Kate M Levett, Carmel T Collins, Mike Armour, Hannah G Dahlen, Machiko Suganuma | |
| 2011 Dec 07 | Relaxation techniques for pain management in labour | Review | Caroline A Smith, Kate M Levett, Carmel T Collins, Caroline A Crowther | |
Differences between protocol and review
This updated review differs from the previously published Cochrane Review 'Complementary and alternative therapies for pain management in labour' (Smith 2006), which has now been revised to three separate reviews.
In this update, 2017, we have incorporated three 'Summary of findings' tables.
Notes
This new review is one of three which, collectively, update the previous review on a range of complementary therapies (Smith 2006). This review includes only trials of relaxation techniques.
Keywords
MeSH
Medical Subject Headings (MeSH) Keywords
Medical Subject Headings Check Words
Female; Humans; Pregnancy;
PICO

Study flow diagram
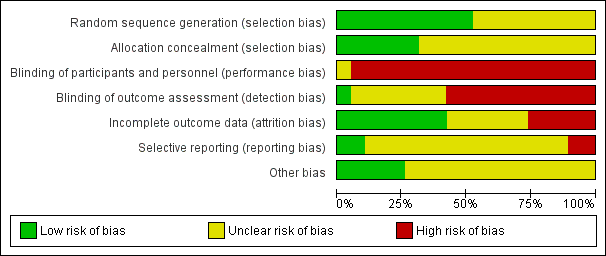
Risk of bias graph: review authors' judgements about each risk of bias item presented as percentages across all included studies

Risk of bias summary: review authors' judgements about each risk of bias item for each included study

Comparison 1 Relaxation versus usual care, Outcome 1 Pain intensity.

Comparison 1 Relaxation versus usual care, Outcome 2 Pain intensity.

Comparison 1 Relaxation versus usual care, Outcome 3 Satisfaction with pain relief.
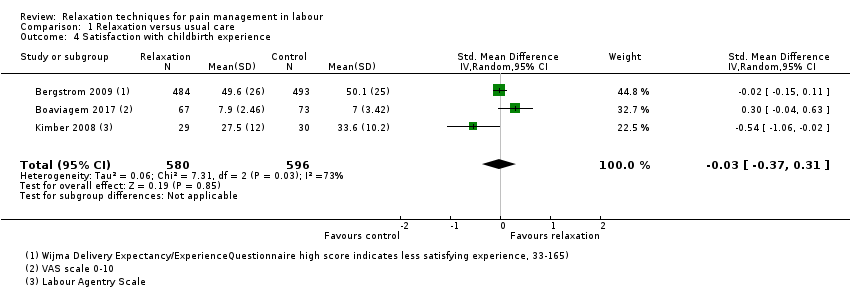
Comparison 1 Relaxation versus usual care, Outcome 4 Satisfaction with childbirth experience.

Comparison 1 Relaxation versus usual care, Outcome 5 Assisted vaginal birth.

Comparison 1 Relaxation versus usual care, Outcome 6 Caesarean section.
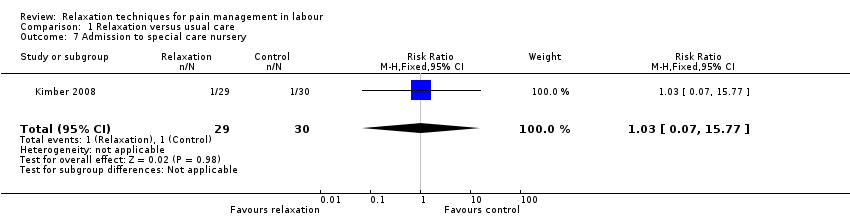
Comparison 1 Relaxation versus usual care, Outcome 7 Admission to special care nursery.

Comparison 1 Relaxation versus usual care, Outcome 8 Low Apgar score < 7 at 5 minutes.

Comparison 1 Relaxation versus usual care, Outcome 9 Use of pharmacological pain relief.

Comparison 1 Relaxation versus usual care, Outcome 10 Length of labour.
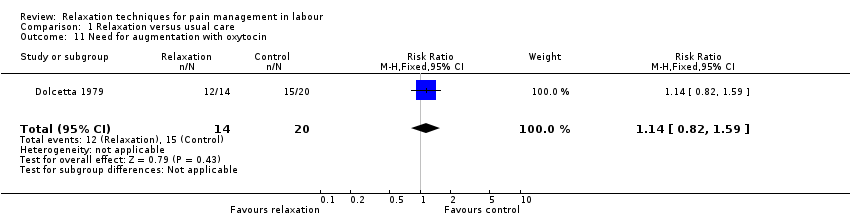
Comparison 1 Relaxation versus usual care, Outcome 11 Need for augmentation with oxytocin.

Comparison 1 Relaxation versus usual care, Outcome 12 Anxiety.

Comparison 1 Relaxation versus usual care, Outcome 13 Non‐prespecified: vitality.
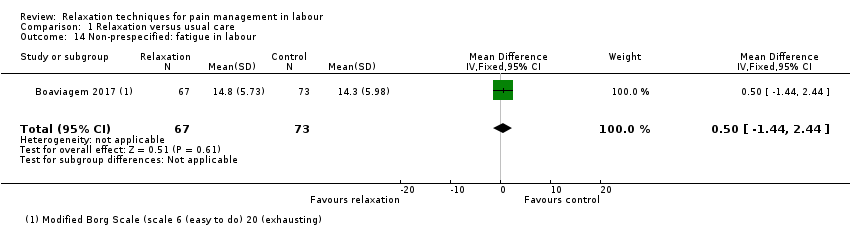
Comparison 1 Relaxation versus usual care, Outcome 14 Non‐prespecified: fatigue in labour.
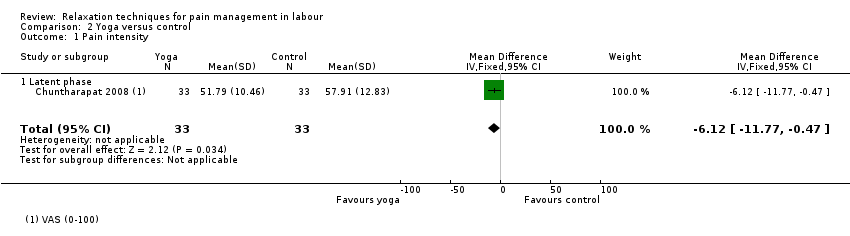
Comparison 2 Yoga versus control, Outcome 1 Pain intensity.

Comparison 2 Yoga versus control, Outcome 2 Satisfaction with pain relief.
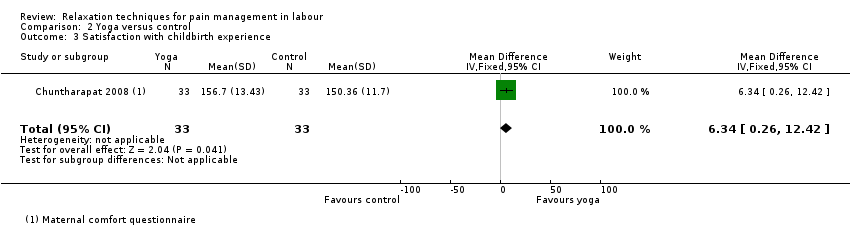
Comparison 2 Yoga versus control, Outcome 3 Satisfaction with childbirth experience.
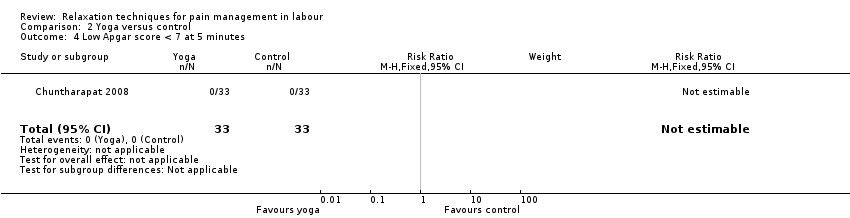
Comparison 2 Yoga versus control, Outcome 4 Low Apgar score < 7 at 5 minutes.
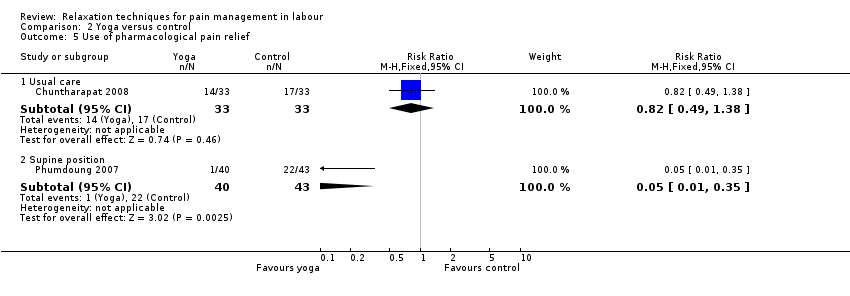
Comparison 2 Yoga versus control, Outcome 5 Use of pharmacological pain relief.

Comparison 2 Yoga versus control, Outcome 6 Length of labour.

Comparison 2 Yoga versus control, Outcome 7 Need for augmentation with oxytocin.

Comparison 3 Music versus control, Outcome 1 Pain intensity.
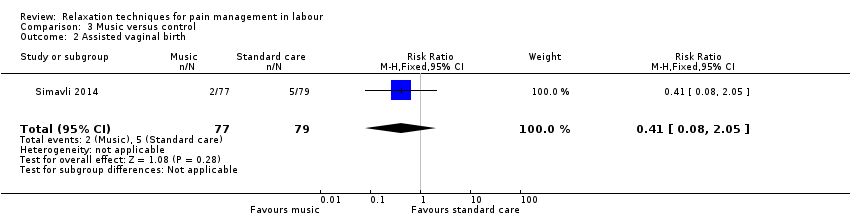
Comparison 3 Music versus control, Outcome 2 Assisted vaginal birth.

Comparison 3 Music versus control, Outcome 3 Caesarean section.

Comparison 3 Music versus control, Outcome 4 Admission to special care nursery.

Comparison 3 Music versus control, Outcome 5 Use of pharmacological pain relief.
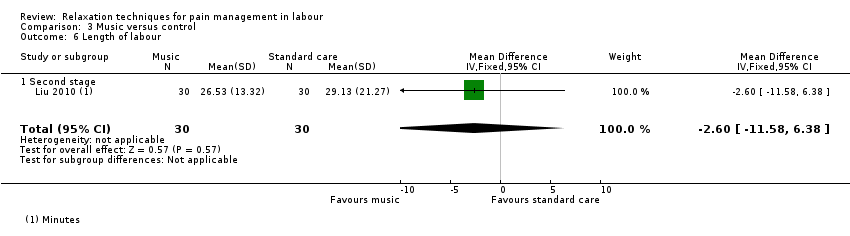
Comparison 3 Music versus control, Outcome 6 Length of labour.

Comparison 3 Music versus control, Outcome 7 Anxiety.
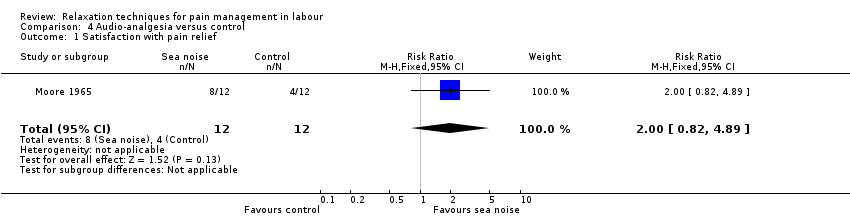
Comparison 4 Audio‐analgesia versus control, Outcome 1 Satisfaction with pain relief.
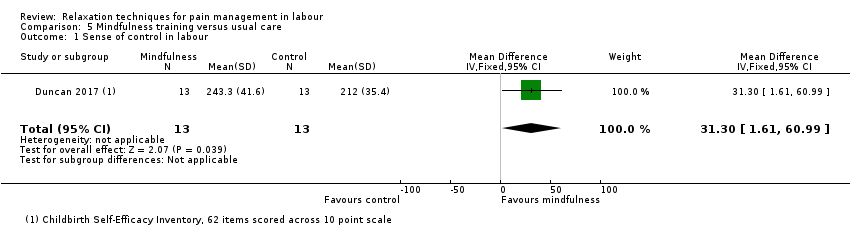
Comparison 5 Mindfulness training versus usual care, Outcome 1 Sense of control in labour.

Comparison 5 Mindfulness training versus usual care, Outcome 2 Satisfaction with childbirth.

Comparison 5 Mindfulness training versus usual care, Outcome 3 Assisted vaginal birth.
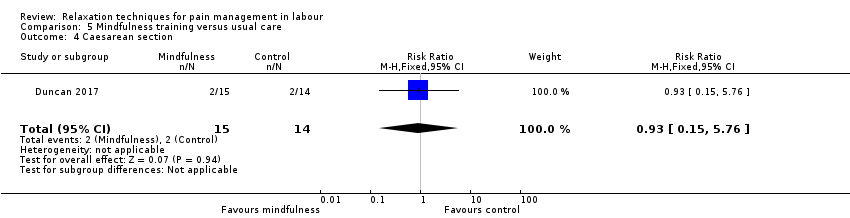
Comparison 5 Mindfulness training versus usual care, Outcome 4 Caesarean section.

Comparison 5 Mindfulness training versus usual care, Outcome 5 Need for pharmacological pain relief.
| Relaxation compared to usual care for pain management in labour | ||||||
| Patient or population: women in labour | ||||||
| Outcomes | Anticipated absolute effects* (95% CI) | Relative effect | № of participants | Quality of the evidence | Comments | |
| Risk with usual care | Risk with relaxation | |||||
| Pain intensity: active phase (lower scores indicate less intense pain) | The mean pain intensity ‐ active phase was 7.8 | MD 1.08 lower | ‐ | 271 | ⊕⊝⊝⊝ | |
| Satisfaction with pain relief (higher proportion high satisfaction) | Study population | RR 8.00 | 40 | ⊕⊝⊝⊝ | ||
| 50 per 1000 | 400 per 1000 | |||||
| Sense of control in labour | ‐ | ‐ | ‐ | ‐ | ‐ | No trial reported this outcome |
| Satisfaction with childbirth experience (higher scores indicate more satisfaction) | The mean satisfaction with childbirth experience using a variety of outcome measures was 27.1 | SMD 0.03 lower | ‐ | 1176 | ⊕⊝⊝⊝ | |
| Breastfeeding | ‐ | ‐ | ‐ | ‐ | ‐ | No trial reported this outcome |
| Assisted vaginal birth | Study population | Average RR 0.61 | 1122 | ⊕⊝⊝⊝ | ||
| 149 per 1000 | 91 per 1000 | |||||
| Caesarean section | Study population | Average RR 0.73 | 1122 | ⊕⊝⊝⊝ | ||
| 214 per 1000 | 157 per 1000 | |||||
| *The risk in the intervention group (and its 95% confidence interval) is based on the assumed risk in the comparison group and the relative effect of the intervention (and its 95% CI). | ||||||
| GRADE Working Group grades of evidence | ||||||
| 1Downgraded one level: most of the pooled effect provided by studies with high risk of bias in allocation concealment and/or blinding. | ||||||
| Yoga compared to control for pain management in labour | ||||||
| Patient or population: women in labour | ||||||
| Outcomes | Anticipated absolute effects* (95% CI) | Relative effect | № of participants | Quality of the evidence | Comments | |
| Risk with control | Risk with yoga | |||||
| Pain intensity (lower scores indicate less intense pain) | The mean pain intensity was 57.91 | MD 6.12 lower | ‐ | 66 | ⊕⊕⊝⊝ | |
| Satisfaction with pain relief Higher scores indicate greater satisfaction with pain relief | The mean satisfaction with pain relief was 45 | MD 7.88 higher | ‐ | 66 | ⊕⊕⊝⊝ | |
| Sense of control in labour | ‐ | ‐ | ‐ | ‐ | ‐ | No trial reported this outcome |
| Satisfaction with childbirth experience (higher scores indicate greater satisfaction) | The mean satisfaction with childbirth experience was 150.36 | MD 6.34 higher | ‐ | 66 | ⊕⊕⊝⊝ | |
| Breastfeeding | ‐ | ‐ | ‐ | ‐ | ‐ | No trial reported this outcome |
| Assisted vaginal birth | ‐ | ‐ | ‐ | ‐ | ‐ | No trial reported this outcome |
| Caesarean section | ‐ | ‐ | ‐ | ‐ | ‐ | No trial reported this outcome |
| *The risk in the intervention group (and its 95% confidence interval) is based on the assumed risk in the comparison group and the relative effect of the intervention (and its 95% CI). | ||||||
| GRADE Working Group grades of evidence | ||||||
| 1Downgraded one level: high risk of bias in blinding domains. | ||||||
| Music compared to control for pain management in labour | ||||||
| Patient or population: women in labour | ||||||
| Outcomes | Anticipated absolute effects* (95% CI) | Relative effect | № of participants | Quality of the evidence | Comments | |
| Risk with control | Risk with music | |||||
| Pain intensity ‐ active phase (lower scores indicate less intense pain) | The mean pain intensity ‐ active phase was 8.61 | MD 0.51 lower | ‐ | 217 | ⊕⊝⊝⊝ | |
| Satisfaction with pain relief | ‐ | ‐ | ‐ | ‐ | ‐ | No trial reported this outcome |
| Sense of control in labour | ‐ | ‐ | ‐ | ‐ | ‐ | No trial reported this outcome |
| Satisfaction with childbirth experience | ‐ | ‐ | ‐ | ‐ | ‐ | No trial reported this outcome |
| Breastfeeding | ‐ | ‐ | ‐ | ‐ | ‐ | No trial reported this outcome |
| Assisted vaginal birth | Study population | RR 0.41 | 156 | ⊕⊝⊝⊝ | ||
| 63 per 1000 | 26 per 1000 | |||||
| Caesarean section | Study population | RR 0.78 | 216 | ⊕⊝⊝⊝ | ||
| 119 per 1000 | 93 per 1000 | |||||
| *The risk in the intervention group (and its 95% confidence interval) is based on the assumed risk in the comparison group and the relative effect of the intervention (and its 95% CI). | ||||||
| GRADE Working Group grades of evidence | ||||||
| 1Downgraded two levels: all included studies had at least two domains with high risk of bias | ||||||
| Outcome or subgroup title | No. of studies | No. of participants | Statistical method | Effect size |
| 1 Pain intensity Show forest plot | 4 | Mean Difference (IV, Random, 95% CI) | Subtotals only | |
| 1.1 Latent phase | 1 | 40 | Mean Difference (IV, Random, 95% CI) | ‐1.25 [‐1.97, ‐0.53] |
| 1.2 Active phase | 4 | 271 | Mean Difference (IV, Random, 95% CI) | ‐1.08 [‐2.57, 0.41] |
| 1.3 Transition | 1 | 40 | Mean Difference (IV, Random, 95% CI) | 0.0 [0.0, 0.0] |
| 2 Pain intensity Show forest plot | 1 | 977 | Mean Difference (IV, Fixed, 95% CI) | 0.0 [‐0.23, 0.23] |
| 3 Satisfaction with pain relief Show forest plot | 1 | 40 | Risk Ratio (M‐H, Fixed, 95% CI) | 8.0 [1.10, 58.19] |
| 4 Satisfaction with childbirth experience Show forest plot | 3 | 1176 | Std. Mean Difference (IV, Random, 95% CI) | ‐0.03 [‐0.37, 0.31] |
| 5 Assisted vaginal birth Show forest plot | 4 | 1122 | Risk Ratio (M‐H, Random, 95% CI) | 0.61 [0.20, 1.84] |
| 6 Caesarean section Show forest plot | 4 | 1122 | Risk Ratio (M‐H, Random, 95% CI) | 0.73 [0.26, 2.01] |
| 7 Admission to special care nursery Show forest plot | 1 | 59 | Risk Ratio (M‐H, Fixed, 95% CI) | 1.03 [0.07, 15.77] |
| 8 Low Apgar score < 7 at 5 minutes Show forest plot | 1 | 34 | Risk Ratio (M‐H, Fixed, 95% CI) | 0.47 [0.02, 10.69] |
| 9 Use of pharmacological pain relief Show forest plot | 2 | 1036 | Risk Ratio (M‐H, Fixed, 95% CI) | 0.99 [0.88, 1.11] |
| 9.1 Epidural | 1 | 977 | Risk Ratio (M‐H, Fixed, 95% CI) | 1.00 [0.88, 1.13] |
| 9.2 Any additional pharmacological intervention | 1 | 59 | Risk Ratio (M‐H, Fixed, 95% CI) | 0.89 [0.61, 1.28] |
| 10 Length of labour Show forest plot | 3 | 224 | Mean Difference (IV, Random, 95% CI) | 39.30 [‐41.34, 119.93] |
| 11 Need for augmentation with oxytocin Show forest plot | 1 | 34 | Risk Ratio (M‐H, Fixed, 95% CI) | 1.14 [0.82, 1.59] |
| 12 Anxiety Show forest plot | 1 | 140 | Mean Difference (IV, Fixed, 95% CI) | 0.30 [‐4.15, 4.75] |
| 13 Non‐prespecified: vitality Show forest plot | 1 | 117 | Mean Difference (IV, Fixed, 95% CI) | 13.10 [10.58, 15.62] |
| 14 Non‐prespecified: fatigue in labour Show forest plot | 1 | 140 | Mean Difference (IV, Fixed, 95% CI) | 0.5 [‐1.44, 2.44] |
| Outcome or subgroup title | No. of studies | No. of participants | Statistical method | Effect size |
| 1 Pain intensity Show forest plot | 1 | 66 | Mean Difference (IV, Fixed, 95% CI) | ‐6.12 [‐11.77, ‐0.47] |
| 1.1 Latent phase | 1 | 66 | Mean Difference (IV, Fixed, 95% CI) | ‐6.12 [‐11.77, ‐0.47] |
| 2 Satisfaction with pain relief Show forest plot | 1 | 66 | Mean Difference (IV, Fixed, 95% CI) | 7.88 [1.51, 14.25] |
| 2.1 Latent phase | 1 | 66 | Mean Difference (IV, Fixed, 95% CI) | 7.88 [1.51, 14.25] |
| 3 Satisfaction with childbirth experience Show forest plot | 1 | 66 | Mean Difference (IV, Fixed, 95% CI) | 6.34 [0.26, 12.42] |
| 4 Low Apgar score < 7 at 5 minutes Show forest plot | 1 | 66 | Risk Ratio (M‐H, Fixed, 95% CI) | 0.0 [0.0, 0.0] |
| 5 Use of pharmacological pain relief Show forest plot | 2 | Risk Ratio (M‐H, Fixed, 95% CI) | Subtotals only | |
| 5.1 Usual care | 1 | 66 | Risk Ratio (M‐H, Fixed, 95% CI) | 0.82 [0.49, 1.38] |
| 5.2 Supine position | 1 | 83 | Risk Ratio (M‐H, Fixed, 95% CI) | 0.05 [0.01, 0.35] |
| 6 Length of labour Show forest plot | 2 | Mean Difference (IV, Fixed, 95% CI) | Subtotals only | |
| 6.1 Usual care | 1 | 66 | Mean Difference (IV, Fixed, 95% CI) | ‐139.91 [‐252.50, ‐27.32] |
| 6.2 Supine position | 1 | 83 | Mean Difference (IV, Fixed, 95% CI) | ‐191.34 [‐243.72, ‐138.96] |
| 7 Need for augmentation with oxytocin Show forest plot | 1 | 66 | Risk Ratio (M‐H, Fixed, 95% CI) | 0.76 [0.45, 1.31] |
| Outcome or subgroup title | No. of studies | No. of participants | Statistical method | Effect size |
| 1 Pain intensity Show forest plot | 3 | Mean Difference (IV, Random, 95% CI) | Subtotals only | |
| 1.1 Latent phase | 2 | 192 | Mean Difference (IV, Random, 95% CI) | ‐0.73 [‐1.01, ‐0.45] |
| 1.2 Active phase | 3 | 217 | Mean Difference (IV, Random, 95% CI) | ‐0.51 [‐1.10, 0.07] |
| 1.3 Transition | 1 | 132 | Mean Difference (IV, Random, 95% CI) | ‐0.70 [‐0.86, ‐0.54] |
| 2 Assisted vaginal birth Show forest plot | 1 | 156 | Risk Ratio (M‐H, Fixed, 95% CI) | 0.41 [0.08, 2.05] |
| 3 Caesarean section Show forest plot | 2 | 216 | Risk Ratio (M‐H, Fixed, 95% CI) | 0.78 [0.36, 1.70] |
| 4 Admission to special care nursery Show forest plot | 1 | 155 | Risk Ratio (M‐H, Fixed, 95% CI) | 0.23 [0.05, 1.01] |
| 5 Use of pharmacological pain relief Show forest plot | 1 | 60 | Risk Ratio (M‐H, Fixed, 95% CI) | 0.83 [0.53, 1.32] |
| 6 Length of labour Show forest plot | 1 | 60 | Mean Difference (IV, Fixed, 95% CI) | ‐2.60 [‐11.58, 6.38] |
| 6.1 Second stage | 1 | 60 | Mean Difference (IV, Fixed, 95% CI) | ‐2.60 [‐11.58, 6.38] |
| 7 Anxiety Show forest plot | 2 | Mean Difference (IV, Random, 95% CI) | Subtotals only | |
| 7.1 Latent phase | 2 | 192 | Mean Difference (IV, Random, 95% CI) | 0.08 [‐1.86, 2.02] |
| 7.2 Active phase | 2 | 192 | Mean Difference (IV, Random, 95% CI) | ‐0.30 [‐1.74, 1.13] |
| 7.3 Transition | 1 | 132 | Mean Difference (IV, Random, 95% CI) | ‐0.66 [‐0.82, ‐0.50] |
| Outcome or subgroup title | No. of studies | No. of participants | Statistical method | Effect size |
| 1 Satisfaction with pain relief Show forest plot | 1 | 24 | Risk Ratio (M‐H, Fixed, 95% CI) | 2.0 [0.82, 4.89] |
| Outcome or subgroup title | No. of studies | No. of participants | Statistical method | Effect size |
| 1 Sense of control in labour Show forest plot | 1 | 26 | Mean Difference (IV, Fixed, 95% CI) | 31.30 [1.61, 60.99] |
| 2 Satisfaction with childbirth Show forest plot | 1 | 26 | Mean Difference (IV, Fixed, 95% CI) | ‐4.5 [‐17.61, 8.61] |
| 3 Assisted vaginal birth Show forest plot | 1 | 29 | Risk Ratio (M‐H, Fixed, 95% CI) | 0.31 [0.01, 7.09] |
| 4 Caesarean section Show forest plot | 1 | 29 | Risk Ratio (M‐H, Fixed, 95% CI) | 0.93 [0.15, 5.76] |
| 5 Need for pharmacological pain relief Show forest plot | 1 | 26 | Risk Ratio (M‐H, Fixed, 95% CI) | 0.5 [0.20, 1.26] |