Antagonistas del factor de crecimiento endotelial vascular para el edema macular secundario a la oclusión de una rama de la vena central de la retina
Resumen
Antecedentes
La oclusión de una rama de la vena central de la retina (ORVR) es una de las anomalías vasculares de la retina que ocurre con mayor frecuencia. La causa más frecuente de la pérdida de la visión en los pacientes con ORVR es el edema macular (EM). Se ha observado que la fotocoagulación con láser en cuadrículas o focal reduce el riesgo de pérdida de la visión. Sin embargo, existen limitaciones a este tratamiento y las modalidades más nuevas pueden tener una eficacia igual o mayor. El tratamiento antiangiogénico con antagonistas del factor de crecimiento endotelial vascular (anti‐VEGF, por sus siglas en inglés) se ha utilizado recientemente con éxito para tratar el EM debido a varias causas.
Objetivos
Investigar la eficacia y recopilar evidencia de ensayos controlados aleatorizados (ECA) sobre los posibles efectos perjudiciales de los agentes antagonistas del factor de crecimiento endotelial vascular (anti‐VEGF, por sus siglas en inglés) en el tratamiento del edema macular (EM) secundario a la oclusión de una rama de la vena central de la retina (ORVR).
Métodos de búsqueda
Se hicieron búsquedas en el Registro Cochrane Central de Ensayos Controlados (Cochrane Central Register of Controlled Trials, CENTRAL) (que contiene el Registro de Ensayos del Grupo Cochrane de Trastornos de los Ojos y la Visión [Cochrane Eyes and Vision]) (2019, número 6); MEDLINE Ovid; Embase Ovid; el registro ISRCTN; ClinicalTrials.gov; y la ICTRP de la OMS. La fecha de la última búsqueda fue el 12 de junio de 2019.
Criterios de selección
Se incluyeron ensayos controlados aleatorizados (ECA) que investigaran la ORVR. Los ensayos aptos para inclusión debían tener al menos seis meses seguimiento en el que el tratamiento con anti‐VEGF se comparara con otro tratamiento, ningún tratamiento o placebo. Se excluyeron los ensayos donde se utilizaron tratamientos combinados (anti‐VEGF más otros tratamientos) y los ensayos que investigaron la dosis y la duración del tratamiento sin un grupo de comparación (otro tratamiento/ningún tratamiento/simulación).
Obtención y análisis de los datos
Dos autores de la revisión extrajeron de forma independiente los datos mediante procedimientos metodológicos estándar previstos por la Colaboración Cochrane. El desenlace primario fue la proporción de participantes con una mejoría en la mejor agudeza visual corregida mayor o igual a 15 letras (tres líneas) en la Early Treatment in Diabetic Retinopathy Study (ETDRS) Chart (Tabla del Estudio del Tratamiento Temprano de la Retinopatía Diabética) a los seis y 12 meses de seguimiento. Los desenlaces secundarios fueron la proporción de participantes con una reducción mayor o igual a 15 letras en la ETDRS (tres líneas) y el cambio medio en la agudeza visual (AV) a los seis y 12 meses, así como el cambio en el espesor central de la retina (ECR) en la tomografía de coherencia óptica desde el inicio a los seis y 12 meses. También se recopilaron datos sobre eventos adversos y calidad de vida (CdV).
Resultados principales
Se encontraron ocho ECA con 1631 participantes que cumplieron con los criterios de inclusión después de la revisión independiente y por duplicado de los resultados de la búsqueda. Estos estudios se realizaron en Europa, Norteamérica, la región del Mediterráneo oriental y Asia oriental. Los participantes incluidos fueron adultos, de 18 años o más con una AV de 20/40 o peor. Los estudios variaron según la duración de la enfermedad, pero permitieron ojos previamente tratados siempre que hubiera un intervalo suficiente sin tratamiento. Se incluyeron todos los agentes anti‐VEGF (bevacizumab, ranibizumab y aflibercept) y corticosteroides (triamcinolona y dexametasona). En general, se consideró que los estudios presentaban un riesgo de sesgo moderado o poco claro. En cuatro de los ocho estudios, no se ocultó el tratamiento a los participantes, a los evaluadores de los desenlaces o a ambos.
Un ensayo comparó los agentes anti‐VEGF con un tratamiento falso. A los seis meses, los ojos que recibieron anti‐VEGF tuvieron significativamente más probabilidades de ganar 15 o más letras ETDRS (riesgo relativo [RR] 1,72, intervalo de confianza [IC] del 95%: 1,19 a 2,49; 283 participantes, evidencia de calidad moderada). La AV media fue mejor en el grupo anti‐VEGF a los seis meses en comparación con el control (diferencia de medias [MD] 7,50 letras, IC del 95%: 5,29 a 9,71; 282 participantes; evidencia de certeza moderada). Los agentes anti‐VEGF también probaron ser más eficaces para reducir el ECR a los seis meses (DM ‐57,50 micras, IC del 95%: ‐108,63 a ‐6,37; 281 participantes; un ECR más bajo es mejor; evidencia de certeza moderada). Solo hubo evidencia de certeza muy baja sobre los efectos adversos. No se informó acerca de la endoftalmitis. El cambio medio de la CdV (medido mediante el Cuestionario de Funcionamiento Visual VFQ‐25 del National Eye Institute) fue mejor en las personas tratadas con anti‐VEGF en comparación con las personas tratadas con el placebo (DM 7,6 puntuación más alta, IC del 95%: 4,3 a 10,9; 281 participantes; evidencia de certeza moderada).
Tres ECA compararon el anti‐VEGF con tratamiento macular con láser (participantes totales = 473). El porcentaje de ojos que ganaron al menos 15 letras fue mayor en el grupo anti‐VEGF a los seis meses (RR 2,09, IC del 95%: 1,44 a 3,05; dos estudios, 201 participantes; evidencia de certeza moderada). La AV media fue mejor en los grupos anti‐VEGF que en los grupos con láser a los seis meses (MD 9,63 letras, IC del 95%: 7,23 a 12,03; 3 estudios, 473 participantes; evidencia de certeza moderada). Hubo una mayor reducción del ECR en el grupo anti‐VEGF comparado con el grupo del láser a los seis meses (MD ‐147,47 micras, IC del 95%: ‐200,19 a ‐94,75; 2 estudios, 201 participantes; evidencia de certeza moderada). Solo hubo evidencia de certeza muy baja sobre los eventos adversos. No se informó acerca de la endoftalmitis. No se informaron los desenlaces de CdV.
Cuatro estudios compararon el anti‐VEGF con el tratamiento con corticosteroides intravítreos (875 participantes). El porcentaje de ojos que ganaron al menos 15 letras ETDRS fue mayor en el grupo anti‐VEGF a los seis meses (RR 1,67, IC del 95%: 1,33 a 2,10; dos estudios, 330 participantes; evidencia de certeza alta) y a los 12 meses (RR 1,76, IC del 95%: 1,36 to 2,28; un estudio, 307 participantes; evidencia de certeza alta). La AV media fue mejor en el grupo anti‐VEGF a los seis meses (DM 8,22 letras, IC del 95%: 5,69 a 10,76; dos estudios, 330 participantes; evidencia de certeza alta) y a los 12 meses (DM 9,15, IC del 95%: 6,32 a 11,97; dos estudios, 343 participantes; evidencia de certeza alta). El ECR medio también mostró una reducción mayor en el grupo anti‐VEGF a los 12 meses comparado con los corticosteroides intravítreos (DM ‐26,92 micras, IC del 95%: ‐65,88 a 12,04; dos estudios, 343 participantes; evidencia de certeza moderada). Las personas que recibieron agentes anti‐VEGF mostraron una mejora superior de la CdV a los 12 meses en comparación con aquellas que recibieron corticosteroides (DM 3,10,IC del 95%: 0,22 a 5,98 ; un estudio, 307 participantes; evidencia de certeza moderada). La evidencia de certeza moderada indica un aumento del riesgo de cataratas y PIO elevada con los corticosteroides. Solo hubo evidencia de certeza muy baja sobre los eventos APTC (eventos tromboembólicos arteriales definidos por la Anti‐Platelet Trialists' Collaboration). No se observaron casos de endoftalmitis.
Conclusiones de los autores
La evidencia de los ECA disponible indica que el tratamiento del EM secundario a la ORVR con agentes anti‐VEGF mejora los desenlaces clínicos y visuales a los seis y 12 meses.
PICO
Resumen en términos sencillos
Antagonistas del factor de crecimiento endotelial vascular para el edema macular secundario a la oclusión de una rama de la vena central de la retina
¿Cuál es el objetivo de esta revisión?
El objetivo de esta revisión Cochrane fue averiguar si los antagonistas del factor de crecimiento endotelial vascular (anti‐VEGF, por sus siglas en inglés) funcionan para el tratamiento del edema macular (EM) secundario a la oclusión de una rama de la vena central de la retina (ORVR). Los investigadores Cochrane recopilaron y analizaron todos los estudios relevantes para responder a esta pregunta y encontraron ocho estudios.
Mensajes clave La revisión muestra que el tratamiento con anticuerpos anti‐VEGF beneficia a las personas con EM debido a ORVR proporcionando una mayor probabilidad de presentar una visión mejorada a los seis y 12 meses en comparación con ningún tratamiento, láser o inyección de corticosteroides.
¿Qué se estudió en la revisión?
Hay pequeños vasos sanguíneos en la parte posterior del ojo (retina) llamados arterias (cuando la sangre entra en el ojo) y venas (cuando la sangre sale del ojo). La ORVR se produce cuando se bloquea una vena que drena parte de la retina. Esto puede producir una hinchazón (edema) en la parte posterior del ojo que puede provocar la pérdida de la visión, en especial si se produce en el centro de la retina (mácula).
Una opción de tratamiento para el EM por ORVR son las inyecciones de anti‐VEGF. El VEGF es una molécula que se encuentra en la parte posterior del ojo asociada a la inflamación. Los agentes anti‐VEGF bloquean la acción del VEGF, lo que puede ayudar a reducir el grado de afectación. El tratamiento del EM por ORVR es importante ya que puede evitar que se produzca la pérdida de la visión.
Los fármacos anti‐VEGF más utilizados son:
∙ ranibizumab (Lucentis)
· aflibercept (Eylea)
· bevacizumab (Avastin)
¿Cuáles son los principales resultados de la revisión? Los investigadores de Cochrane encontraron ocho estudios relevantes. Estos estudios se realizaron en Europa, Norteamérica, la región del Mediterráneo oriental y Asia oriental.
Un estudio comparó el anti‐VEGF con ningún tratamiento (inyección falsa); tres estudios compararon el anti‐VEGF con otro tipo de tratamiento (láser); y cuatro estudios compararon el anti‐VEGF con corticosteroides. Los hallazgos fueron los siguientes.
∙ Las personas tratadas con anti‐VEGF tuvieron más probabilidades de tener una mejor visión y menos hinchazón en la parte posterior del ojo a los seis meses después del tratamiento, en comparación con las personas que no fueron tratadas con anti‐VEGF o que fueron tratadas con láser o corticosteroides (evidencia de certeza moderada).
· En general solo hubo evidencia de certeza muy baja sobre los eventos adversos (perjudiciales) al comparar el tratamiento anti‐VEGF con los otros tratamientos. No hubo casos de infección ocular (endoftalmitis). Hubo evidencia de que las personas tratadas con corticosteroides (inyectados en el ojo) tuvieron más probabilidades de desarrollar cataratas o una mayor presión en el ojo en comparación con los anti‐VEGF.
∙ El tratamiento con anti‐VEGF se asoció con una mejora superior de la calidad de vida (certeza moderada).
¿Cómo de actualizada está esta revisión? Los investigadores Cochrane buscaron estudios publicados hasta junio de 2019.
Authors' conclusions
Summary of findings
| Anti‐VEGF v sham for macular oedema secondary to branch retinal vein occlusion | |||||||
| Patient or population: macular oedema secondary to branch retinal vein occlusion | |||||||
| Outcomes | Anticipated absolute effects* (95% CI) | Relative effect | № of participants | Certainty of the evidence | Comments | ||
|---|---|---|---|---|---|---|---|
| Risk with sham | Risk with anti‐VEGF | ||||||
| Gain of 15 letters or more of visual acuity at 6 months | 6 months | 269 per 1000 | 462 per 1000 | RR 1.72 | 283 | ⊕⊕⊕ | |
| 12 months | Data not available because participants in sham group received anti‐VEGF after 6 months | ||||||
| Mean change in visual acuity letters at 6 months measured with a logMAR chart (higher letter score is better visual acuity) | 6 months | The mean VA change with sham was 5 letters | The mean number of letters read with anti‐VEGF was 7.50 letters more (5.29 more to 9.71 more) | ‐ | 282 | ⊕⊕⊕ | |
| 12 months | Data not available because participants in sham group received anti‐VEGF after 6 months | ||||||
| Mean central retinal thickness (CRT) change at 6 months in microns (lower value is better) | The mean CRT change with sham was −207 microns | The mean CRT with anti‐VEGF was 57.5 microns less | ‐ | 281 | ⊕⊕⊕ | ||
| Adverse outcomes at any time point | Cataract | 11 per 1000 | 11 per 1000 (1 to 106) | RR 0.98 (0.09 to 10.66) | 283 (1 RCT) | ⊕ | 12 month results. Patients in the sham arm were able to receive rescue anti‐VEGF after 6 months. |
| Raised IOP* | 1 per 1000 | 6 per 1000 (0 to 101) | RR 5.41 (0.30 to 96.88) | 283 (1 RCT) | ⊕ | ||
| APTC events | 22 per 1000 | 32 per 1000 (6 to 142) | RR 1.47 (0.30 to 7.14) | 283 (1 RCT) | ⊕ | ||
| Endophthalmitis | No endophthalmitis was reported in either anti‐VEGF (n = 190) or sham (n = 91) arms | ||||||
| Mean change in quality of life (QoL) at 12 months on the National Eye Institute Visual Functioning Questionnaire‐25 (VFQ‐25) (scored 0 to 100) (higher score is better quality of life) | The mean QoL change with sham was 0 | The mean QoL score with anti‐VEGF was 7.60 higher (4.30 to 10.90) | ‐ | 281 (1 RCT) | ⊕⊕⊕ | Data collected at 6 months because participants in sham group received anti‐VEGF after 6 months | |
| *The risk in the intervention group (and its 95% CI) is based on the assumed risk in the comparison group and the relative effect of the intervention (and its 95% CI). Where no events observed in control group, we have used an estimate of 1 per 1000 for illustrative purposes. | |||||||
| GRADE Working Group grades of evidence | |||||||
| 1Downgraded 1 level for risk of bias 2Downgraded 2 levels for imprecision and 1 level for risk of bias | |||||||
| Anti‐VEGF compared to laser for branch retinal vein occlusion (BRVO) | |||||||
| Patient or population: people with BRVO | |||||||
| Outcomes | Anticipated absolute effects* (95% CI) | Relative effect | № of participants | Certainty of the evidence | Comments | ||
|---|---|---|---|---|---|---|---|
| Risk with laser | Risk with anti‐VEGF | ||||||
| Gain of 15 letters or more of visual acuity | 6 months | 260 per 1000 | 543 per 1000 | RR 2.09 | 201 | ⊕⊕⊕ | |
| 12 months | Data not available because participants in sham group received anti‐VEGF after 6 months | ||||||
| Mean change in visual acuity letters measured with a logMAR chart (higher letter score is better visual acuity) | 6 months | The mean visual acuity change with laser ranged from 2 to 7 letters | The mean number of letters read with anti‐VEGF was 9.63 letters more | ‐ | 473 | ⊕⊕⊕ | |
| 12 months | Data not available because participants in sham group received anti‐VEGF after 6 months | ||||||
| Mean central retinal thickness (CRT) change at 6 months in microns (lower value is better) | The mean CRT change with laser was −128 microns | The mean CRT change with anti‐VEGF was 147.47 microns less | ‐ | 201 | ⊕⊕⊕ | ||
| Adverse outcomes at any time point | Cataract* | 1 per 1000 | 3 per 1000 (0 to 75) | RR 2.97 (0.12 to 71.89) | 456 (2 RCTs) | ⊕ | |
| Raised IOP* | No raised IOP was reported in either anti‐VEGF (n = 182) or laser (n = 93) groups | ⊕ | |||||
| APTC events | 5 per 1000 | 4 per 1000 (1 to 37) | RR 0.99 (0.15 to 6.78) | 476 (3 RCTs) | ⊕ | ||
| Endophthalmitis | No endophthalmitis was reported in either anti‐VEGF (n = 284) or laser (n = 192) arms | ⊕ | |||||
| Mean change in quality of life at 12 months on the National Eye Institute Visual Functioning Questionnaire‐25 (VFQ‐25) (scored 0 to 100) (higher score is better quality of life) | Not reported | ||||||
| *The risk in the intervention group (and its 95% CI) is based on the assumed risk in the comparison group and the relative effect of the intervention (and its 95% CI). Where no events observed in control group, we have used an estimate of 1 per 1000 for illustrative purposes. | |||||||
| GRADE Working Group grades of evidence | |||||||
| 1Downgraded 1 level for risk of bias 2Downgraded 1 level for risk of bias and 2 levels for imprecision | |||||||
| Anti‐VEGF compared to steroid for BRVO | |||||||
| Patient or population: people with BRVO | |||||||
| Outcomes | Anticipated absolute effects* (95% CI) | Relative effect | № of participants | Certainty of the evidence | Comments | ||
|---|---|---|---|---|---|---|---|
| Risk with steroid | Risk with anti‐VEGF | ||||||
| Gain of 15 letters or more of visual acuity | 6 months | 379 per 1000 | 633 per 1000 | RR 1.67 | 330 | ⊕⊕⊕⊕ | |
| 12 months | 338 per 1000 | 595 per 1000 (460 to 771) | RR 1.76 | 307 | ⊕⊕⊕⊕ | ||
| Mean change in visual acuity letters measured with a logMAR chart (higher letter score is better visual acuity) | 6 months | The mean visual acuity change with steroid ranged from 9 to 11 letters | The mean number of letters read with anti‐VEGF was 8.22 more | ‐ | 330 | ⊕⊕⊕⊕ | |
| 12 months | The mean visual acuity change with steroid ranged from 6 to 8 letters | The mean number of letters read with anti‐VEGF was on average 9.15 letters more (6.32 more to 11.97 more) | ‐ | 343 (2 RCTs) | ⊕⊕⊕⊕ | ||
| Mean central retinal thickness (CRT) change at 12 months in microns (lower value is better) | The mean CRT change with steroid ranged from −249 to −306 microns | The mean CRT change with anti‐VEGF was 26.92 microns less | ‐ | 343 | ⊕⊕⊕ | ||
| Adverse outcomes at any time point | Cataract | 125 per 1000 | 22 per 1000 (7 to 75) | RR 0.12 (0.04 to 0.32) | 551 (3 RCTs) | ⊕⊕⊕ | |
| Raised IOP | 240 per 1000 | 57 per 1000 (34 to 94) | RR 0.25 (0.16 to 0.40) | 673 (4 RCTs) | ⊕⊕⊕ | ||
| APTC events | 1 per 1000 | 3 per 1000 (0 to 74) | RR 3.02 (0.12 to 73.55) | 587 (3 RCTs) | ⊕ | ||
| Endophthalmitis | No endophthalmitis was reported in either anti‐VEGF (n = 187) or steroid (n = 179) arms. | ||||||
| Mean change in quality of life at 12 months on the National Eye Institute Visual Functioning Questionnaire‐25 (VFQ‐25) (scored 0 to 100) (higher score is better quality of life) | The mean change in quality of life score with steroid was 3.5 | The mean change in quality of life score with anti‐VEGF was 3.10 higher | ‐ | 307 | ⊕⊕⊕ | ||
| *The risk in the intervention group (and its 95% CI) is based on the assumed risk in the comparison group and the relative effect of the intervention (and its 95% CI). | |||||||
| GRADE Working Group grades of evidence | |||||||
| 1 One study was judged to be at high risk of attrition bias because participants in the steroid group dropped out of the study due to adverse effects and poor response. We did not downgrade for risk of bias as the direction of the risk of bias is likely to be favouring the steroid group and so the estimate of effect reported here may well be an under‐estimate. 2Downgraded 1 level for risk of bias (studies were at high risk of attrition bias) 3Downgraded 2 levels for imprecision and 1 level for risk of bias | |||||||
Background
Description of the condition
Branch retinal vein occlusion (BRVO) is the second most commonly occurring retinal vascular abnormality after diabetic retinopathy (Mitchell 1996). A BRVO is an occlusion of either a major branch retinal vein draining one quadrant of the retina, a macular branch vein draining the macula, or a peripheral branch vein draining a portion of the retinal periphery. The pathogenesis of BRVO is thought to involve both retinal vein compression and damage to the vessel wall, possibly leading to thrombus formation. BRVOs are thought to occur at sites where retinal arterioles cross retinal veins. Histopathological studies support the hypothesis that because of a common adventitial sheath, thickening of the arteriolar wall compresses the lumen of the vein which alters blood flow causing thrombosis and venous occlusion (Frangieh 1982). Once the occlusion occurs, increased vascular pressure behind the occlusion may lead to leakage of fluid and small molecules across the vascular wall and into the surrounding retinal tissue, resulting in local oedema. This oedema is characterised by the collection of fluid in intercellular spaces within the outer plexiform layer of the retina and results from the breakdown of the capillary endothelium blood‐retinal barrier and leakage of fluid from the vasculature. Vascular endothelial damage to the affected vein may induce low‐grade, chronic inflammation of the retinal microvasculature and upregulation of inflammatory mediators. These mediators include prostaglandins, leukotrienes, intercellular adhesion molecule‐1, integrins, tumour necrosis factor‐a, and vascular endothelial growth factor (VEGF) (Ehlers 2011; Funk 2009; Rehak 2008).
The 15‐year incidence of BRVO in an elderly (aged 65 to 74 years) Caucasian (understood to be white) population is 1.8% (Klein 2008); and most studies report a range of between 0.6% and 2% (Klein 2000; Mitchell 1996; Wong 2005; Xu 2007; Yasuda 2010). A recent pooled analysis of 68,751 individuals indicates an age and gender standardised prevalence for BRVO of 4.42 per 1000 (confidence interval (CI) 3.65 to 5.19; Rogers 2010a); however, significant heterogeneity between studies precluded a formal meta‐analysis. Second eye involvement by BRVO may occur in between 3.5% to 9% of cases over time (Glacet‐Bernard 1996; Rogers 2010b); and affected individuals have a loss in vision‐related quality of life even with normal vision in the fellow eye (Awdeh 2010).
BRVO may be classified on a spectrum of ischaemic or non‐ischaemic designated by the disc areas (DA) of hypoperfusion on fluorescein angiography. The extent of ischaemia has a relationship with the likelihood of neovascular complications with reports suggesting a rate of retinal neovascularisation in 36% to 62% of eyes with more than 5 DA of non‐perfusion over two years of follow‐up (Shilling 1976).
Known risk factors for BRVO include hypertension, atherosclerosis, hyperlipidaemia, diabetes mellitus, thrombophilia and other inflammatory and myeloproliferative disorders (Dodson 1982; Dodson 1992; EDCCS Group 1993). A systematic review of the natural history of BRVO suggests that although the baseline visual acuity (VA) is generally poor (less than 20/40), with time the VA improves, and between one third and three quarters of eyes show at least a two‐line improvement in VA without intervention. However, clinically significant improvement beyond 20/40 is uncommon (Rogers 2010b).
The most common cause of visual loss in BRVO patients is macular oedema (MO), which occurs in 5% to 15% of patients within the first year (Rogers 2010b). Other causes of visual loss include macular ischaemia, glaucoma and neovascularisation (Rogers 2010b). Macular oedema and neovascularisation of the retina or disc are the two major complications that require therapy (BVOS Group 1984; Shilling 1976). Many treatment strategies, both medical and surgical, have been reported for BRVO. Surgical treatments thought to be of benefit include vitrectomy with internal limiting membrane peeling and vitrectomy with arteriovenous sheathotomy (Ehlers 2011). Medical therapies of clinical benefit include grid laser photocoagulation (GLP), sector panretinal photocoagulation, intravitreal steroids (triamcinolone, dexamethasone) and intravitreal vascular endothelial growth factor inhibitors.
The BVOS clinical trial evaluated whether grid macular laser photocoagulation improved the VA in patients with a VA of 20/40 or worse resulting from MO secondary to BRVO. This multicentre randomised controlled trial (RCT) assigned 139 participants to either grid macular laser photocoagulation or no laser treatment. The groups were well matched at baseline in terms of risk factors, duration of symptoms, and VA. With a mean follow‐up of 3.1 years (68% of participants), the grid laser group had statistically significant improvements in VA with 65% (28/43) treated versus 37% (13/35) controls gaining two or more lines of vision over consecutive visits (P = 0.014). Since its publication in 1984, this has been the 'gold standard' treatment; there were, however, several limitations, notably the exclusion of participants who had a BRVO within three months and the exclusion of those with foveal haemorrhage (BVOS Group 1984). This study has led to the current recommendation in the UK (Royal College of Ophthalmologists) that GLP is an effective treatment to reduce MO and to improve VA in BRVO with MO and VA of 20/40 or less. Treatment should be postponed for three months after onset to allow for any spontaneous resolution and reduction in haemorrhage. Fluorescein angiography is recommended before treatment to quantify the level of macular ischaemia, which may limit the value of laser photocoagulation. In addition, grid laser treatment is thought unlikely to provide significant benefit in eyes with BRVO of more than one year’s duration and VA of 20/200 or worse.
The SCORE study (Scott 2009) examined intravitreal triamcinolone (IVTA) versus standard of care (GLP) to elucidate the differences in GLP versus IVTA for MO secondary to BRVO in 411 eyes. Approximately 45% of individuals had a BRVO with MO of three to six months' duration and 9% of included participants had more than 10 disc areas of non‐perfusion. The mean (standard deviation (SD)) number baseline Early Treatment in Diabetic Retinopathy Study (ETDRS) letters was 57 (12.6). Eyes were randomised to either grid‐pattern laser (n = 137), 1 mg IVTA (n= 136), or 4 mg IVTA (n = 138). In the SCORE study, eyes were retreated with their assigned dose of IVTA or grid‐pattern laser every four months during the study period unless there was a predefined significant improvement or a significant adverse event. The results of the SCORE study demonstrated that there was no difference in VA between eyes treated with IVTA or GLP at 12 months. Twenty‐nine per cent, 26%, and 27% gained three or more lines of visual acuity at one year in the laser, 1 mg, and 4 mg groups, respectively. All three groups showed similar reductions in MO as measured by optical coherence tomography (OCT). The IVTA groups had an increased rate of side effects, particularly raised intraocular pressure (IOP) requiring medication (7%: 1 mg; 41%; 4 mg; versus 2% laser) and cataract formation (25%: 1 mg; 35%: 4 mg; versus 13% laser). There were no cases of endophthalmitis in the laser and 1 mg group, but there was one case in the 4 mg group. Other reported adverse events were vitreous floaters and conjunctival haemorrhage: 31% of the 1 mg triamcinolone group and 26% of 4 mg triamcinolone group had vitreous floaters and 30% of the 1 mg triamcinolone group and 33% of the 4 mg triamcinolone group had conjunctival haemorrhage.
Recently, the utility of extended‐release corticosteroid delivery systems has been evaluated in the GENEVA study (Haller 2010). An international study at 167 sites in 24 countries was designed to examine the effect of a sustained‐release intravitreal dexamethasone delivery system at the 0.35 mg and 0.7 mg (Ozurdex, Allergan) dose for MO in eyes with BRVO or central retinal vein occlusion (CRVO) over a 6‐month period. At baseline, the mean VA was approximately 54 letters (20/80) in all groups, and the mean central retinal thickness was approximately 550 microns. Ten per cent of participants (131/1267) had a history of photocoagulation, and 17% had a duration of retinal vein occlusion (RVO) and MO of less than three months. All comparison groups were well matched. Primary outcome was reported for all RVO eyes grouped together. In a subgroup analysis of 291 eyes with BRVO receiving the 0.7 mg implant, at 60 days following treatment 30% gained 15 letters or more compared to 13% in the sham group. At 90 days, 24% gained 15 letters or more compared to 15% in the sham group. The difference was significant at both time points, but not at the 180‐day time point. The overall incidence of ocular adverse events was significantly higher in the Ozudex implant 0.7 mg group (62.9%) and Ozudex implant 0.35 mg group (61.9%) than in the sham group (42.8%). Cataract progression was similar in both the treatment and the sham groups in the 6‐month study. The only adverse events that occurred significantly more frequently in either the Ozudex implant treatment group than in the sham group were eye pain, ocular hypertension, and anterior chamber cells. Ocular hypertension (≥ 25 mmHg) occurred in 4% of treated eyes (0.35 mg and 0.7 mg implants) compared to 0.7% of sham eyes (Haller 2010). Ozurdex received Food and Drug Administration (FDA) approval for treatment of MO secondary to BRVO in 2009.
Description of the intervention
Vascular endothelial growth factor (VEGF) plays a role in the development of MO and in the neovascular complications of BRVO. Elevated intraocular levels of VEGF have been demonstrated in patients with RVOs (Campochiaro 2008); and sustained release of VEGF in primate eyes causes vascular leakage and MO (Ozaki 1997). There are several anti‐VEGF agents available. The first licensed drug was bevacizumab (Avastin®), a recombinant humanised monoclonal whole immunoglobulin antibody that binds to VEGF and blocks the binding of VEGF to endothelial cell receptors (Ferrara 2006). Bevacizumab was licensed for the treatment of bowel cancer. Pegaptanib sodium (Macugen®) is a pegylated modified oligonucleotide, which binds to extracellular VEGF‐165 and antagonises its biological effects (Gragoudas 2004). Ranibizumab (Lucentis®) is a recombinant humanised monoclonal immunoglobulin antibody fragment that binds to the receptors of biologically active VEGF‐A (Presta 1997); it has been licensed for the treatment of age‐related macular degeneration (AMD) and RVOs in the USA and Europe. Aflibercept (VEGF Trap‐eye) (Eylea®) is a further VEGF‐binding recombinant fusion protein, and has been hypothesised to have the greatest efficacy of its class due to its binding to VEGF isoforms A and B, as well as placental growth factor (PGF). Monoclonal antibodies against VEGF administered intravitreally have been approved for the treatment of AMD (Rosenfeld 2006), and widespread evidence has suggested a benefit and favourable side effect profile of their use in MO secondary to RVOs (Campochiaro 2010b; Prager 2009, Garnock‐Jones 2011).
How the intervention might work
Elevated intraocular levels of VEGF have been demonstrated in patients with RVOs (Noma 2006). Sustained release of VEGF in primate eyes causes vascular leakage and MO (Ozaki 1997); and several studies have demonstrated that anti‐VEGF antibodies inhibit VEGF mediated neovascularisation and permeability in both in vitro and in vivo studies (Aiello 1995a; Aiello 1995b; Boyd 2002). Thus there is a strong basis for the hypothesis that anti‐VEGF agents may be beneficial in the treatment of vascular leakage and MO (Campochiaro 2008).
Why it is important to do this review
BRVO is the most common RVO and a significant cause of visual morbidity. Current treatment regimens licensed in the UK include macular photocoagulation and more recently intravitreal dexamethasone (Ozurdex®) implants. Intravitreal anti‐VEGF therapy has a good side effect profile (serious adverse ocular events less than 0.1% (out of 1301 participants)) (Kourlas 2007) (see systematic review Mitchell 2011) and has not been found to be associated commonly with side effects such as a sustained rise in IOP commonly seen with steroid preparations. Several early reports suggested an important clinical efficacy for the use of anti‐VEGF in MO secondary to BRVO (Campochiaro 2010b; Campochiaro 2010a; Kriechbaum 2008; Moradian 2011; Prager 2009; Rabena 2007).
Objectives
To investigate the efficacy and gather evidence from randomised controlled trials (RCTs) on the potential harms of anti‐vascular endothelial growth factor (VEGF) agents for the treatment of macular oedema (MO) secondary to branch retinal vein occlusion (BRVO).
Methods
Criteria for considering studies for this review
Types of studies
In this review, we sought to include all randomised controlled trials of at least six months' duration: we judged a minimum of six months was required to determine treatment efficacy and adverse effects. We included published and unpublished studies in all languages to ensure the widest possible collection of evidence. We included studies as long as they reported at least one primary or secondary outcome that this review is considering.
Types of participants
We included trials with participants of all ages and both genders who have had a diagnosis of unilateral or bilateral macular oedema secondary to branch retinal vein occlusion or hemi‐retinal vein occlusion. All countries and ethnic groups were eligible for inclusion. We included treatment‐naive and previously‐treated eyes.
Types of interventions
We included trials where anti‐VEGF treatment was compared with another treatment, no treatment, or placebo. We excluded trials where combination treatments (anti‐VEGF plus other treatments) were used and excluded trials that investigated the dose and duration of treatment without a comparison group (other treatment/no treatment/sham). We judged that choosing clear, distinct comparisons would help produce clear results of treatment outcome.
Types of outcome measures
Primary outcomes
The primary outcome for this review was the proportion of participants with an improvement from baseline in best‐corrected visual acuity (BCVA) of greater than or equal to 15 letters (three lines) on the Early Treatment in Diabetic Retinopathy Study (ETDRS) chart at six months and at 12 months of follow‐up.
Secondary outcomes
We examined the following secondary outcomes as they represent important clinical and therapeutic indices of safety and efficacy.
-
Mean visual acuity (VA) change at six and 12 months.
-
The proportion of participants with a loss of 15 or more letters (ETDRS) compared with baseline at six and 12 months.
-
Change in central retinal thickness (CRT) on optical coherence tomography (OCT) from baseline at 12 months.
Adverse outcomes
We sought to report any ocular or systemic adverse outcomes reported in the trials.
Quality of life data
We reported any quality of life data reported in the studies.
Search methods for identification of studies
Electronic searches
The Cochrane Eyes and Vision Information Specialist conducted systematic searches in the following electronic databases for RCTs and controlled clinical trials. There were no restrictions to language or year of publication. The date of the search was 12 June 2019.
-
Cochrane Central Register of Controlled Trials (CENTRAL; 2019, Issue 6) (which contains the Cochrane Eyes and Vision Trials Register) in the Cochrane Library (searched 12 June 2019) (Appendix 1).
-
MEDLINE Ovid (1946 to 12 June 2019) (Appendix 2).
-
Embase Ovid (1980 to 12 June 2019) (Appendix 3).
-
Latin American and Caribbean Literature on Health Sciences (LILACS) (1982 to 12 June 2019) (Appendix 4).
-
ISRCTN registry (www.isrctn.com/editAdvancedSearch; searched 12 June 2019) (Appendix 5).
-
US National Institutes of Health Ongoing Trials Register (www.ClinicalTrials.gov; searched 12 June 2019) (Appendix 6).
-
World Health Organization (WHO) International Clinical Trials Registry Platform (ICTRP) (www.who.int/ictrp; searched 12 June 2019) (Appendix 7).
Searching other resources
We manually searched the references of identified studies to try to find other relevant studies. We also contacted the corresponding authors of included studies to find further information.
Data collection and analysis
Selection of studies
Two review authors independently reviewed all the titles and abstracts identified from the electronic and manual searches against the inclusion criteria. We classified each report into one of four categories: include; possibly include; exclude; and unclear. We obtained the full‐text articles of all 'possibly include' articles and both review authors independently assessed and classified these articles. We resolved disagreement by discussion between the review authors.
Data extraction and management
We extracted the following participant and trial characteristics and reported them in appropriate table format.
-
Participant characteristics (gender, age, diagnostic criteria, baseline VA, central retinal thickness)
-
Intervention (drug, dose, timing interval, time from diagnosis, frequency and length of treatment)
-
Methodology (group size, randomisation, masking, unit of analysis)
-
Primary and secondary outcomes
-
Additional data (quality of life)
-
Treatment compliance and dropout rate/loss to follow‐up
Two review authors extracted the data independently using forms developed by the Cochrane Eyes and Vision Group. The review authors compared the two sets of extracted data and resolved any identified discrepancies through discussion. One review author entered data into Review Manager 5 (RevMan 5) and a second review author checked that the data entered were correct (Review Manager 2014). Where more than one report was present for a single study, we used all reports to extract data into a single data collection form.
When data were missing from a publication or ClinicalTrials.gov, we contacted investigators by email with a request to provide data for this review. We used intention‐to‐treat analysis to deal with missing data.
Assessment of risk of bias in included studies
Two review authors assessed the methodological quality of the selected trials according to Chapter 8 of the Cochrane Handbook for Systematic Reviews of Interventions (Higgins 2019). We considered the following main criteria according to the GRADE approach.
-
Selection bias: sequence generation, allocation concealment
-
Detection bias: blinding (masking) of outcome assessment
-
Performance bias: masking of participants, researchers and outcome assessors
-
Attrition bias: loss to follow‐up, rates of compliance
-
Reporting bias: selective outcome reporting
We reported each parameter as high risk of bias, low risk of bias or unclear.
Measures of treatment effect
We defined these according to the data types established in Chapter 9 of the Cochrane Handbook for Systematic Reviews of Interventions (Deeks 2017); they include the following.
Dichotomous data
Variables in this group included the primary outcome, the proportion of participants with a loss of 15 or more letters (ETDRS) compared with baseline, the proportion of participants experiencing a complication or adverse event during follow‐up and the proportion of participants given additional treatments during follow‐up. We reported dichotomous variables as risk ratios (RRs) with 95% confidence intervals (CIs).
Continuous data
These variables included mean change in visual acuity (VA) and mean change in central retinal thickness (CRT). We reported continuous variables as a mean difference (MD) ± standard deviation (SD) (normal distribution) or median and inter‐quartile range (not normally distributed).
Ordinal data
The types of adverse events, complications and interventions performed were ordinal data.
Counts and rates data
We measured the number of adverse events, number of complications and interventions performed as counts or rates data.
Unit of analysis issues
All studies considered one eye per person. When dealing with multi‐arm studies, we only extracted data from the arms dealing with the basis of this review.
Dealing with missing data
We contacted the authors of the VIBRANT study to request SD data for mean letters gained and mean change in central retinal thickness at six months. This was provided. We contacted the authors of unpublished and unreported studies NCT01189526 and NCT01795209 to obtain results but did not receive responses to our email requests.
Assessment of heterogeneity
We considered heterogeneity between studies by looking at the basic characteristics of participants (e.g. age, gender or ethnicity) as well as their inclusion and exclusion criteria. We used the I² statistic to assess heterogeneity. This is a measure of the percentage variance attributable to study heterogeneity.
Assessment of reporting biases
We assessed reporting bias by comparing the published results against the study protocol. We assessed publication bias by searching both published articles and trial registries.
Data synthesis
We used RevMan 5 to combine results across studies. We used GRADE software to produce 'Summary of findings' tables, along with certainty assessments, which we used to summarise risk of bias in presented results.
Subgroup analysis and investigation of heterogeneity
We performed subgroup analysis by comparing the efficacy of the anti‐VEGF agents (bevacizumab, ranibizumab and aflibercept) across studies.
We assessed heterogeneity between studies with the I² statistic as outlined in Assessment of heterogeneity above.
Sensitivity analysis
No sensitivity analysis was performed for this review.
'Summary of findings' table
We prepared 'Summary of findings' tables for the following three comparisons using GRADEpro software (GRADEpro GDT): anti‐VEGF versus sham, anti‐VEGF versus laser and anti‐VEGF versus steroids. We included the following outcomes in the 'Summary of findings' table.
-
Gain of 15 letters or more of visual acuity at six months
-
Gain of 15 letters or more of visual acuity at 12 months
-
Mean visual acuity change at six months
-
Mean visual acuity change at 12 months
-
Mean central retinal thickness change at 12 months
-
Adverse outcomes at any time point
-
Quality of life change at 12 months
We graded the certainty of the evidence using GRADE (GRADE 2013). GRADE has four categories: high‐, moderate‐, low‐ and very low‐certainty evidence. We considered randomised controlled trials to be high‐certainty evidence and downgraded for serious limitations in study design (risk of bias), inconsistency, imprecision, indirectness and evidence of publication bias. Two authors did the GRADE assessment independently using a checklist designed to aid consistency and reproducibility of the GRADE assessments (Meander 2014).
Results
Description of studies
Results of the search
The electronic searches run in 2012 yielded a total of 448 references. The Cochrane Information Specialist (CIS) scanned the search results, removed duplicates and 325 references which were not relevant to the scope of the review. We screened 163 reports to identify potentially relevant studies. We identified 29 case series and summarised the results of these studies (see Table 1). We excluded a further 121 records after reading the abstract. We obtained full‐text copies of eight records for further investigation. We included two studies in the review. One RCT (two reports) compared anti‐VEGF with sham injection; and one quasi‐RCT compared macular grid laser with anti‐VEGF. We excluded five studies and identified five ongoing studies (EUCTR2010-023900-29-GB; NCT01189526; NCT01396057; NCT01521559; NCT01635803). We marked these studies for assessment and possible inclusion in the review when data became available.
| Study name | Number of eyes included | Prospective recruitment | Drug and dose | Mean IVI | Mean f‐up | Outcome |
| 32 eyes | No | Bevacizumab 1.25 mg
| 1.7 | 4 m (median) | Mean BCVA (logMAR) improved from 0.7 to 0.5 and mean CMT improved from 454 µm to 305 µm | |
| 42 eyes (All non‐ischaemic) | No | Bevacizumab 1.25 mg |
| 12 m | Improvement in mean Snellen BCVA from 20/280 to 20/170 at final follow‐up. Mean CMT reduction from 451 µm to 400 µm at 6 mths. | |
| 39 eyes (14 with MO and BRVO) | No | Bevacizumab 1.25 mg | 1.4 | 5.4 m | 50% of patients had previous laser treatment. The mean log‐MAR of the BRVO group was 0.71, and this improved 1 month after the second injection to 0.34. The mean CMT was 468.6 µm which decreased to 186.4 µm at final follow‐up. No significant ocular or systemic SE. | |
| 191 eyes Comparative study: IVB (n = 73) versus IVTA (n = 118) (non‐ischaemic = 90%) | No | Bevacizumab 1.25 mg
| 1.9 | 11.1 m | Mean BCVA (logMAR) improved from 0.91 to 0.45 in the IVB group and mean CMT decreased from 477 µm to 218 µm. | |
| 52 eyes Comparative study: IVTA (n = 17), IVB (n = 14), combined (n = 21) (All non‐ischaemic) | Yes | Bevacizumab 1.25 mg
| 1.6 | 6 m | Mean BCVA (logMAR) improved from 0.92 to 0.45 in the IVB group. No significant ocular or systemic SE. | |
| 83 eyes Comparative study: IVTA (n = 25), IVB (n = 24), no treatment (n = 34) (56% ischaemic) | Yes | Bevacizumab 2.5 mg
| 1 | 41.4 wks | BCVA (logMAR) improved from 0.95 to 0.79 at 12 weeks Mean CMT decreased from 457 µm to 323 µm 24 weeks after treatment | |
| 29 eyes Comparative study: IVTA (n = 16), IVB (n = 13) | No | Bevacizumab 1.25 mg
| 1.6 | 7.4 m | 61.5% of IVB group received previous laser treatment. Improvement in mean BCVA (logMAR) from 0.99 to 0.35 at final follow‐up. Reduction in mean CMT from 538 µm to 222 µm microns. No significant ocular or systemic side effects. | |
| 50 eyes | No | Bevacizumab 1.25 mg
| 1.94 | 7.9 m | 56% gained 5 or more ETDRS letters; 44% had less than 5 ETDRS letter gain or worse final BCVA. No significant ocular or systemic side effects. | |
| 28 eyes | Yes | Bevacizumab 1.25 mg
| 3.7 | 6 m | Improvement in mean BCVA (logMAR) from 0.8 to 0.44 at final follow‐up. Reduction in mean CMT from 486 µm to 268 µm. | |
| 52 eyes (23% ischaemic) | No | Bevacizumab 1.25 mg
| 3.3 | 12 m | Only 17 eyes (26%) returned for follow‐up. The median Snellen BCVA improved from 20/100 at baseline to 20/50 at 12 months. The mean CMT decreased by 205 µm compared with baseline. | |
| 12 eyes (40% ischaemic) | No | Bevacizumab 1.25 mg
| 4 | 9.8 m | Improvement in mean BCVA (logMAR) from 0.91 to 0.48 at final follow‐up. Reduction in mean CMT from 506 µm to 267.5 µm. | |
| 91 eyes | No | Bevacizumab 1.25 mg
| 1.3 | Up to 3 m | Mean reduction in CMT from 610 µm to 368 µm after 1 injection | |
| 61 eyes (34 with BRVO) | Yes | Bevacizumab 2.5 mg | 4.9 | 3 m | Mean BCVA (logMAR) improved from 0.50 to 0.32. Mean CMT decreased from 602 µm to 386 µm. | |
| 34 eyes Comparative study: IVTA (n = 34), IVB (n = 34) | No | Bevacizumab 1.25 mg
| 3.83 | 4.9 m | Mean BCVA improved by 0.14 logMAR units. Mean CMT decreased from 506 µm to 228 µm. | |
| 23 (All non‐ischaemic) | Yes | Bevacizumab 1.25 mg
| 1.6 in first 6 months and 0.8 in second 6 months | 12 m | The median VA gained 3.0 lines from baseline at 48 weeks and there was a decrease of 39% of the median CMT. | |
| 205 eyes | No | Bevacizumab 1.25 mg
|
| 36.8 wks
| The median BCVA (logMAR) was 0.6 at baseline improving to 0.4. Reduction in CMT, from a baseline of 454 µm to 248 µm. | |
| 50 eyes | Yes | Bevacizumab 1.25 mg
| 2 | 12 m | The mean BCVA (logMAR) improved from 0.53 to 0.26. Mean CMT decreased from 523 µm to 305 µm. | |
| 34 eyes | Yes | Bevacizumab 1.25 mg
| 2.9 | 6 m | The mean BCVA (logMAR) improved from 0.79 to 0.51 at 6 months. Mean CMT decreased from 474 µm to 316 µm. | |
| 29 eyes (21 with BRVO) | Yes | Bevacizumab 1.0 mg
| 2.3 | 6 m | Baseline mean BCVA was 50 ETDRS letters, by month 6, BCVA improved to 65 letters. CMT decreased from 558 µm to 382 µm. | |
| 18 eyes with BRVO (All non‐ischaemic) | No | Bevacizumab 1.25 mg
| 2.7 | 12 m | Baseline BCVA was 20/240 (logMAR 1.08) improving to 20/60 (logMAR 0.48) at the end of follow‐up (approx 12 months). The mean CMT decreased to 250 ± 48 µm. | |
| 12 eyes | No | Bevacizumab 1.25 mg
| 1 | 12 wks | Mean BCVA (logMAR) was 1.22 improving to 0.61. The mean CMT was 672.8 µm at baseline. There was a 44.6% decrease in CMT from baseline. | |
| 8 eyes | Yes | Ranibizumab 0.5 mg | 3.6 | 12 m | Mean improvement in BCVA (logMAR) from 0.80 0.41. Mean reduction of 275 µm in CMT from baseline. Contrast sensitivity, time and reading fluency improved significantly in the treated eyes. | |
| 21 eyes (BRVO only) | Yes | Bevacizumab 1 mg
| 8 | 12 m | In the BRVO group (n = 18), visual acuity increased from 55 letters (20/80) at baseline to 73 letters (20/32) at month 12. CMT decreased significantly by 241 μm after 12 months of follow‐up. | |
| 27 eyes | No | Bevacizumab 1.25 mg
| 2 | 5.3 m | Mean BCVA improved from 20/200 to 20/100 at final follow‐up. Mean CMT decreased from 487 µm to 332 µm at final follow‐up. No adverse side effects were observed following injections. | |
| 21 eyes | Yes | Bevacizumab 1.5 mg | 3 | 6.2 m | Mean BCVA (logMAR) improved from 0.81 to 0.55 at 6 months. Mean CMT decreased from 492 µm to 316 µm. | |
| 28 eyes | Yes | Ranibizumab 0.5 mg | 6 | 9 m | Mean BCVA (logMAR) improved from 0.74 to 0.49. Mean CMT decreased from 349 µm at baseline to 229 µm. | |
| 22 eyes (BRVO only) | No | Bevacizumab 2.5 mg | 2.6 | 23 wks | 76.5% of those with BRVO had a significant improved visual acuity (by at least 3 lines). Mean CMT decreased from 678 µm to 236 µm. | |
| 9 eyes | Yes | Bevacizumab 1.25 mg | 1 | 9 wks | Mean BCVA (logMAR) improved from 0.5 to 0.31 at 9 weeks. Mean CMT reduced from 408 µm to 309 µm. | |
| 25 eyes (12 with BRVO only) | Yes | Bevacizumab 2.5 mg | 2 | 6.5 m | 50% (6/12) had received previous treatment. Mean BCVA (logMAR) improved from 0.94 to 0.54 at final follow‐up. Mean CMT reduced from 392 µm to 234 µm. |
m: months; wks: weeks; BCVA: best‐corrected visual acuity; CMT: central macular thickness; IVTA: intravitreal triamcinolone; IVB: intravitreal bevacizumab; IVI: intravitreal injections; f‐up: follow‐up; VA: visual acuity
Update searches run in June 2019 yielded a further 1735 records (Figure 1). After 538 duplicates were removed, the Cochrane Information Specialist (CIS) screened the remaining 1197 records and removed 710 references that were not relevant to the scope of the review. We screened the remaining 487 references and obtained 35 full‐text reports for further assessment. We identified 13 reports of eight new studies; for further details see Characteristics of included studies. We excluded 21 reports of 21 studies: see Characteristics of excluded studies. We identified one new ongoing study (NCT03108352); and have followed up on the five ongoing studies that were cited in the previous version of the review. Studies NCT01189526 and NCT01635803 are ongoing; the three other studies have been completed and incorporated into the following new studies: Bandello 2018, COMRADE‐B and VIBRANT.
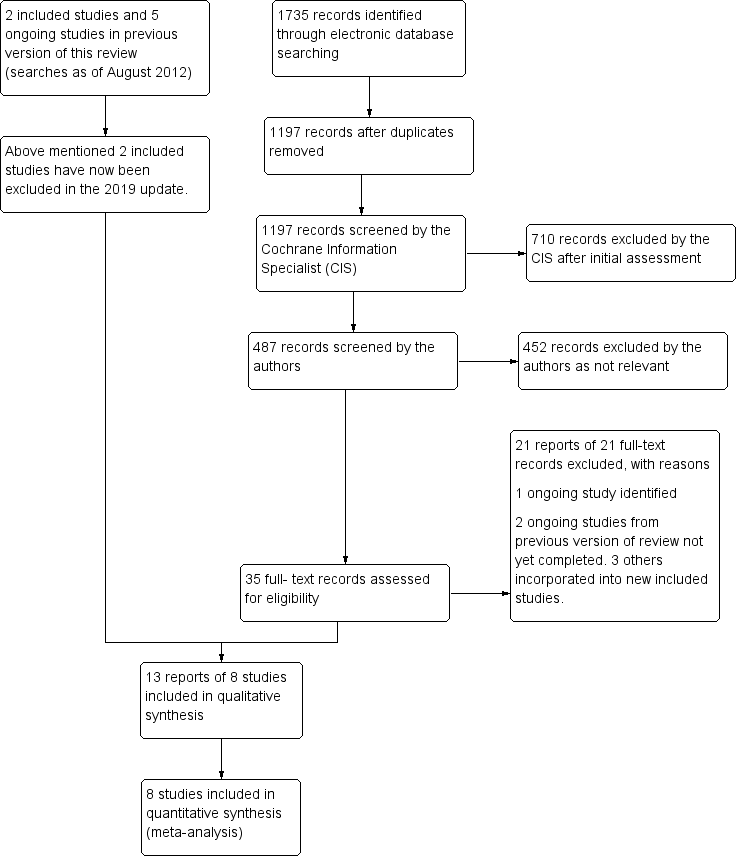
Study flow diagram.
In the previous version of this review there were two included studies and five excluded studies. For this update we have excluded the two studies which were previously included; see Differences between protocol and review. Consequently this review now contains eight included studies, 26 excluded studies and three ongoing studies.
Included studies
Bandello 2018 was a 12‐month multi‐centre randomised controlled trial of 307 eyes in 307 participants with branch retinal vein occlusion. Participants were randomised to dexamethasone implant (n = 154) or ranibizumab injection (n = 153). Eyes in the dexamethasone arm all received treatment at baseline, then again at month 5 and month 10/11 if required. Eyes in the ranibizumab group received injection at baseline then monthly to month 5, with treatment as required thereafter to month 12.
BLOSSOM was a 12‐month, phase III, multicentre randomised controlled trial of 283 participants with branch retinal vein occlusion. Participants were randomised to receive ranibizumab (n = 190) or sham (n = 93). The ranibizumab arm received three ranibizumab 0.5 mg injections spaced monthly, followed by injections as required based on pre‐defined re‐treatment criteria. The sham arm consisted of treatment in the form of sham injections until six months, after which participants could receive ranibizumab 0.5 mg as required. Hence we excluded data points from this arm from six months.
BRIGHTER was a phase III open label study of 455 participants across 17 countries comparing ranibizumab (n = 183), ranibizumab plus laser (n = 180), and laser alone (n = 92) for the treatment of cystoid macular oedema in BRVO. Participants were assigned with a ratio of 2:2:1 to these groups. Participants received monthly injection or laser every four months until visual acuity was deemed stable, after which treatment was given on an 'as needed' basis. Importantly, participants in the laser arm were also able to receive ranibizumab from month 6. We excluded data points from this arm from six months onwards.
COMRADE‐B was a 6‐month, phase IIIb, multicentre, randomised, double‐masked study that enrolled participants with visual impairment due to macular oedema secondary to BRVO. Two hundred and forty‐four participants were enrolled from 74 sites across Europe. Ranibizumab (n = 126) was given as three loading injections at the start of the study until a stable VA was reached followed by 'as needed' treatment; whilst the dexamethasone arm (n = 118) was given as a single injection at baseline with monthly sham injections until month 3 followed by an 'as needed' regimen. The primary outcome was mean average change in BCVA from baseline to month 1 through month 6.
Higashiyama 2013 performed a prospective, comparative, randomised, interventional clinical trial. Forty‐three eyes of 43 participants with macular oedema because of BRVO were randomly assigned to 4 mg intravitreal injections of TA (IVTA) (21 participants, IVTA group) or 1.25 mg intravitreal injections of bevacizumab (IVB) (22 participants, IVB group) and followed for 12 months. No additional treatments were administered for three months after the initial injection; additional injections were administered when macular oedema recurred between three and 12 months after the initial injection. The main outcome measures were changes in the logarithm of the minimal angle of resolution BCVA and CRT from baseline to 12 months.
The RABAMES trial was a prospective, randomised, controlled, multicentre investigator‐initiated clinical trial over six months on 30 participants with BRVO and macular oedema. The three arms of the study were: intravitreal ranibizumab (n = 10) versus grid‐pattern laser photocoagulation (n = 10) versus a combination of both (n = 10) in participants with chronic macular oedema secondary to BRVO. During the 3‐month treatment period, participants received either three monthly intravitreal ranibizumab injections, or up to two treatment sessions of macular laser photocoagulation or intravitreal ranibizumab combined with laser photocoagulation. The primary outcomes were mean gain in ETDRS letters, proportion of participants gaining 15 or more letters and improvement in central retinal thickness.
Ramezani 2012 performed a controlled, randomised single‐masked clinical trial on treatment‐naive BRVO with duration of less than 12 weeks. Eligible eyes were randomly assigned to intravitreal bevacizumab (IVB) (n = 43) and intravitreal triamcinolone (IVT) (n = 43) groups. In the IVB group, the eyes received three prescheduled monthly intravitreal injections of 1.25 mg/0.5 ml bevacizumab. The eyes in the IVT group had two prescheduled intravitreal injections of 2 mg/0.5 ml triamcinolone acetonide, performed two months apart. The primary outcome was the change in BCVA at six months. Secondary outcome measures consisted of CMT changes, determined by OCT, and intraocular pressure (IOP) changes.
The VIBRANT study was a phase III, multicentre, randomised, double‐masked, active‐controlled, 52‐week trial comparing the efficacy and safety of intravitreal aflibercept injection (IAI) with macular grid laser photocoagulation for treatment of macular oedema after BRVO. Participants 18 years old with BRVO or hemi‐retinal vein occlusion (HRVO) causing oedema involving the centre of the macula were eligible for enrolment if the occlusion occurred within 12 months, and BCVA was between 73 and 24 Early Treatment Diabetic Retinopathy Study (ETDRS) letters (20/40 to 20/320 Snellen equivalent). Eyes in the IAI group (n = 91) received 2 mg IAI every four weeks from baseline to week 20. A sham laser treatment was also performed at baseline. After this, eyes received 2 mg IAI every eight weeks with rescue laser at week 36 if needed. Eyes in the laser group (n = 92) received macular laser photocoagulation at baseline and sham injections every four weeks from baseline to week 20. After this, eyes received three 2 mg IAI every four weeks; then 8‐weekly with rescue laser at week 36 if needed. Eyes in both treatment groups were evaluated for rescue treatment from week 12 onward. The primary efficacy outcome measure was the proportion of eyes that gained 15 ETDRS letters in BCVA from baseline at week 24. The secondary efficacy outcome measures were a change from baseline in BCVA, CRT, and the National Eye Institute 25‐item Visual Function Questionnaire (NEI VFQ‐25) total scores. Additional prespecified endpoints were the time to first sustained gain of 15 letters, change from baseline in NEI VFQ‐25 subscales (near activities, distance activities, and visual dependency), and proportion of participants with a change in retinal perfusion. Safety assessments included ocular and non‐ocular adverse events (AEs) and serious AEs (SAEs).This cross‐over design means results at six months are a true reflection of treatment efficacy. After this, eyes in the laser group were eligible to receive IAI, of which 80.7% did. In comparison, 10.6% of the IAI group received rescue laser at week 36. Standard deviations for this study were obtained by email correspondence with the authors.
Included studies typically reported proportion of participants gaining 15 letters or more (RABAMES); or the mean change in visual acuity (BRIGHTER; Higashiyama 2013). Some reported both (Bandello 2018; BLOSSOM; COMRADE‐B; Ramezani 2014; VIBRANT).
See the 'Characteristics of included studies' table for additional details.
Excluded studies
We excluded 26 studies. We excluded BRAVO 2010 due to the use of rescue laser treatment in both the sham and anti‐VEGF arms; and Russo 2009 due to its quasi‐RCT design. Three trials were dose‐finding studies (Campochiaro 2008; Campochiaro 2010a; Wroblewski 2010); and one study had a follow‐up period of less than six months (Moradian 2011). We excluded an additional seven studies as they examined combination therapy (Chiquet 2016; Donati 2012; Hanhart 2017; Kartasasmita 2016; Moon 2016; Tomomatsu 2016; Zhang 2014). We excluded four studies as they compared anti‐VEGF treatment to other anti‐VEGF therapy (CRAVE 2015; Klimes 2015; MARVEL; SHORE 2014). Four studies had a retrospective, non‐randomised design (Chiquet 2015; Gu 2017; Guignier 2013; Leitritz 2013). Regnier 2015 is a review article. See the 'Characteristics of excluded studies' table and Table 2 for further details. From the search, we identified numerous interventional case series where anti‐VEGF agents for MO secondary to BRVO were used. These did not meet the inclusion criteria for the systematic review, and primary outcomes for these are summarised in Table 1.
| Study | Study details | Conclusion |
| Dose‐finding study: patients with CRVO (n = 14) and BRVO (n = 17) were randomised to receive either 0.3 mg ranibizumab or 0.5 mg ranibizumab and followed for 2 years | The 0.3 mg and 0.5 mg doses had similar results and when combined showed that 20 patients with BRVO had mean and median improvements in BCVA of 16.1 and 15 letters. After 2 years of follow‐up, only 5 of 17 patients with BRVO and 3 of 14 patients with CRVO were oedema‐free with no injections for at least 1 year. | |
| Dose‐finding study: patients with CRVO (n = 20) and BRVO (n = 20) were randomised to receive 3 monthly injections either 0.3 mg ranibizumab or 0.5 mg ranibizumab. | Primary end point at 3 months: improvement of 10 and 18 letters in the BRVO group for the lower and higher doses respectively. OCT showed that compared to lower dose injections, 0.5 mg of ranibizumab tended to cause more rapid reductions of central retinal thickening that lasted longer between injections. | |
| Retrospective study in eyes with CRVO and BRVO, 102 patients (64 in the anti‐VEGF (bevacizumab or ranibizumab) group, 38 in the DEX group) without previous treatment were included in this multi‐centre retrospective study and evaluated at baseline and 1, 3, 6, and 12 months after the onset of treatment. | Both the DEX and anti‐VEGF groups showed similar improvements in visual acuity and central retinal thickness. However, at 3 months, 5 patients (13%) in the DEX group and 20 (31%) in the anti‐VEGF group (P < 0.001) changed treatment due to poor response. | |
| Combination therapy retrospective study in CRVO and BRVO. 48 patients – 40 in the anti‐VEGF DEX sequence (AD group), 8 in the DEX anti‐VEGF sequence (DA group) – were included in this multicentre retrospective study and evaluated at baseline, 1, 3, 6 and 12 months after the switch. | VA significantly improved at 1 month in the AD group (P = 0.03) but not in the DA group (P = 0.40). CMT decreased significantly in the AD group at 1, 6 and 12 months (P = 0.002, P = 0.005 and P = 0.002, respectively). In the DA group, VA did not change from baseline at any time point, and CMT decreased at 1 month (P = 0.02) but not later on. | |
| Participants were randomised 1:1 to receive monthly treatment with bevacizumab or ranibizumab. The primary outcome was change in central foveal thickness at 6 months compared to baseline. | The trial randomised 98 patients to treatment with bevacizumab or ranibizumab. At 6 months, there were no differences in change in central foveal thickness between groups (bevacizumab: mean reduction of 212.6 microns, 95% CI (confidence interval) −288.3 to −137.0; ranibizumab: mean reduction of 243.8 microns, 95% CI, −309.6 to −178.0; P = 0.72, analysis of variance (ANOVA)). Both groups showed similar functional outcomes (bevacizumab: 0.33 logMAR gain, 95% CI, −0.47 to −0.18; ranibizumab: 0.34 log‐ MAR gain, 95% CI, −0.45 to −0.23; P = 0.38, ANOVA). | |
| The COMRADE‐B study was a 6‐month RCT comparing ranibizumab with dexamethasone implant. The extension study followed up a subset of the original study group for a further 6 months. | Patients enrolled in the extension study were limited only to German centres, and in general had better visual acuity outcomes at 6 months than those not enrolled. In the extension 6 months, eyes in the ranibizumab arm could receive ranibizumab as required. Eyes in the dexamethasone arm could receive 1 further dexamethasone implant in the extension 6 month period. 'Mean average change in best‐corrected visual acuity (BCVA) was significantly better for ranibizumab than dexamethasone (P = 0.0249).' Also, "elevated intraocular pressure (IOP) was more frequent with dexamethasone than ranibizumab treatment." | |
| 18 eyes with MO secondary to BRVO (of at least 3 months duration) were randomised to receive either IVB (n = 9) at baseline, month 1 and month 2 or (n = 9) IVB at baseline, month 1 and month 2 with grid laser photocoagulation after the second injection. | Both groups demonstrated a mean improvement in BCVA and CMT at 12 months, however the combination groups required fewer IVB injections; (median of 4 ± 1.1 for IVB alone versus 3 ± 0.4 in the combination group) (P = 0.03). | |
| Non‐randomised case series in CRVO and BRVO. 32 ME cases treated with Ozurdex and 32 ME cases treated with ranibizumab were enrolled, with 26 central (C)RVO and 6 branch (B)RVO participants in each group. The authors compared the results of best‐corrected visual acuity (BCVA), central retinal thickness, number of injections, and intraocular pressure (IOP) at 1, 2, 3, and 6 months after injection. | BCVA in both groups at each follow‐up were significantly increased compared to baseline with no statistical difference between the groups. Ozurdex and ranibizumab successfully reduced CMT at each follow‐up. Both CRVO and BRVO patients had significant between‐group differences in the mean number of injections. Among the CRVO patients, IOP in the Ozurdex group was significantly increased compared to baseline and the ranibizumab group at 1, 2, and 3 months postinjection. | |
| Non‐randomised case series in BRVO. A total of 19 patients (19 eyes) were included in this prospective pilot study. Initially, 8 eyes received three IV bevacizumab (group 1) and 11 received one IV Ozurdex (group 2). All the patients underwent a 1‐, 3‐, 4‐ and 6‐month follow‐up visit. A repeated IV bevacizumab (group 1) or IV Ozurdex (group 2) was proposed at 4 months when necessary. | The mean visual acuity was significantly better 1 month after treatment in group 2, while the mean central macular thickness was also significantly lower in group 2. However, there was no longer any difference between the 2 groups at 3, 4 and 6 months, neither in terms of visual | |
| Non‐randomised combination comparative study in CRVO and BRVO. Fifteen eyes were switched to ranibizumab, 12 to aflibercept, and 10 to dexamethasone. At 3, 6, 9, and 12 months, the outcome measures were visual acuity (VA) and central macular thickness (CMT). | 1 year after the switch, CMT decreased from 430.11 ± 91.21 to 291.86 ± 43.87 μm ( P < 0.001). VA increased in 59.5% of the eyes. No difference between the groups was found in those outcomes at 1 year, but the number of injections varied: 3.30 ± 0.95 for dexamethasone, 6.50 ± 2.11 for aflibercept, and 8.27 ± 2.37 for ranibizumab ( P < 0.001). | |
| Non‐randomised comparative study in BRVO of laser alone or laser with bevacizumab. 19 patients with macular oedema secondary to BRVO were assigned to either the group of 9 patients in combination therapy of laser photocoagulation with intravitreal bevacizumab or the group of 10 patients in the laser photocoagulation therapy. Complete ophthalmologic examinations were performed just before the therapy and at 1 month following the therapy. | Combination therapy of laser photocoagulation and single intravitreal bevacizumab injection resulted in a significantly better visual acuity compared to laser photocoagulation therapy (0.35 versus 0.13 logMAR; P = 0.041) and reduced macular thickness by 120.33 µm versus 71.50 µm (P = 0.277), although this difference was not significant. | |
| In this prospective interventional consecutive case series, previously untreated eyes with perfused MO were enclosed over a period of 16 months for bevacizumab (BEV) and for 29 months for grid laser photocoagulation (GLP). The follow‐up period was 1 year. Patients with persistent MO after 12 months of BEV were offered GLP and vice versa, and were followed up for another 12 months. | Both BEV (23 eyes) and GLP (21 eyes) caused a significant ( P < 0.05) reduction in central retinal thickness (CRT) at 12 months although this was delayed with GLP. However, BEV revealed a significantly better 'best‐corrected visual acuity' (BCVA) compared with GLP (0.2 vs 0.5 logMAR; P < 0.04). Switching therapy for non‐responders revealed a reduced CRT at another 12 months, although this was not significant. | |
| 42 confirmed cases (42 eyes) with macular oedema secondary to BRVO were randomised into 3 groups, each group contained 14 eyes. The ranibizumab group received intravitreal injection of ranibizumab (0.05 mL), the laser group received grid laser photocoagulation, and the combined group received a second therapy of grid laser photocoagulation after 1 wk of the intravitreal injection of ranibizumab. Best‐corrected visual acuity (BCVA) and the central macular thickness (CMT) preoperative and at 1, 3, 6 months after therapy was recorded. | The BCVA and the CMT had no differences among 3 groups pretherapy (P > 0.05). While BCVA was much better and CMT was reduced significantly post‐therapy than pre‐therapy in all 3 groups (P < 0.05). The BCVA and CMT in the ranibizumab group were significantly different in every time point (1, 3, 6 months) (P < 0.05). The BCVA declined and the CMT was thicker as time went on. In the laser group and the combined group, BCVA and CMT had little differences at different time points (P > 0.05); while the BCVA was better and the CMT was thinner in the combined group than ranibizumab group and laser group at every time point (P < 0.05). At 3 and 6 months, the BCVA was better and the CMT was thinner in laser group than ranibizumab group (P < 0.05). | |
| A 25‐health‐state Markov model considering ranges of visual acuity in both eyes was developed. Patients had a confirmed diagnosis of macular oedema secondary to BRVO and had best‐corrected visual acuity (BCVA) at baseline between 25 and 73 letters. The evaluation compared IVT‐AFL 2 mg with ranibizumab 0.5 mg: the frequency of injections and monitoring were identical for both treatments, taken from randomised trials and a physician survey. A systematic review and indirect comparison were conducted to determine the probabilities of gaining at least 15 BCVA letters from baseline to 6 months; BCVA was then extrapolated over time to determine costs and outcomes. Utilities were taken from published literature and costs were estimated from a UK payer perspective. Published drug prices were discounted to reflect patient access schemes. Costs and benefits were discounted at 3.5%. | The indirect comparison found that IVT‐AFL was associated with a small numerical advantage in the likelihood of gaining 15 BCVA letters, compared with ranibizumab (median odds ratio = 1.08, 95% Cl 0.43 to 2.56). IVT‐AFL was associated with a higher number of QALYs (0.045) per patient than ranibizumab. Both treatments are available to the National Health Service under confidential patient access schemes. Cost effectiveness was estimated for a range of possible discounts for each treatment. At price parity, IVT‐AFL reduces cost by GBP 4 per patient and was a dominant therapy. Results were sensitive to the unit cost of the drugs used, to comparative efficacy and number of injections for both treatments. | |
| In this prospective, randomised, non‐inferiority trial, 75 participants with macular oedema due to BRVO received intravitreal injections of ranibizumab (IVR) or bevacizumab (IVB) after 1:1 block randomisation. The primary outcome measure was the difference in mean changes in best‐corrected visual acuity (BCVA) at 6 months. Secondary outcome measures included mean change in central retinal thickness (CRT), the proportion of patients improving by > 15 letters and the proportion of patients developing neovascularisation. | Participants received either IVR (n = 37) or IVB (n = 38). The mean BCVA at baseline was 52.8 ± 14.4 letters (20/80) and 56.1 ± 10.0 letters (20/80) (P = 0.24) in the ranibizumab and bevacizumab groups, respectively. At 6 months, the mean gains in BCVA were +18.1 letters (95% CI +12.8 to +22.6; P < 0.0001) in the ranibizumab group and +15.6 letters (95% CI +12.0 to +20.5; P < 0.0001) in the bevacizumab group. The difference between the mean visual gains of the treated groups (bevacizumab–ranibizumab) was −2.5 letters (95% CI −8.0 to +5.0; P = 0.74). Mean reductions in CRT at 6 months were 177.1 ± 122.3 mm in the ranibizumab group (P < 0.0001) and 201.7 ± 166.2 mm in the bevacizumab group ( P < 0.0001), with no significant difference between the 2 groups (P = 0.48). The mean numbers of ranibizumab and bevacizumab injections were 3.2 ± 1.5 and 3.0 ± 1.4, respectively (P = 0.55). 2 serious adverse events occurred in the ranibizumab group and 1 in the bevacizumab group but both were unrelated to intravitreal injections. | |
| This was a prospective, randomised, interventional comparative study conducted in 45 eyes with ME secondary to BRVO who were treated primarily with IVB 1.25 mg (23 eyes, IVB group) or combination therapy of IVB 1.25 mg with a single simultaneous STA 40 mg (18 eyes, IVB/STA group). Re‐injections were performed with IVB if optical coherence tomography (OCT) showed recurrent ME associated with decreased visual acuity. The main outcome measurement was the number of additional IVB injections, and changes of best‐corrected visual acuity (BCVA) and central macular thickness (CMT) during a 6‐month follow‐up period were compared. | BCVA showed significant improvement in 2 groups at 6 months. In addition, CMT showed significant decrease in 2 groups at 6 months. No significant differences in the change of BCVA and CMT at 6 months after injection (P = 0.973, P = 0.639) were observed between the 2 groups. A statistically significant difference was found regarding the number of additional IVB injections (IVB group 0.96 ± 0.83; IVB/STA group 0.44 ± 0.70, P = 0.034). | |
| 81 eyes with acute (< 3 months) BRVO were randomly assigned to receive either 2 injections of 1.25 mg bevacizumab 6 weeks apart or sham injections. Follow‐up results were reported at 6 weeks and 12 weeks. | After week 6, visual improvements in the bevacizumab treated group were significantly better than the sham group. At 12 weeks there was no significant difference. There was a significant reduction in CMT both at 6 and at 12 weeks. | |
| In this randomised clinical trial, 86 eyes with recent onset (< 12 weeks) CRVO were assigned to 2 groups: bevacizumab (IVB) group (43 eyes) that received 3 monthly injections of 1.25 mg of IVB, and triamcinolone (IVT) group (43 eyes) that received 2 injections of 2 mg IVT 2 months apart. Outcomes were best‐corrected visual acuity (BCVA), central macular thickness (CMT), and intraocular pressure (IOP) changes. | Mean BCVA improved significantly at 6 months in both groups; from 0.87 ± 0.49 to 0.41 ± 0.35 logMAR in IVB group, and from 0.81 ± 0.45 to 0.62 ± 0.48 logMAR in IVT group (P < 0.001). However, between‐group differences reach a significant level at months 4 (P = 0.003) and 6 (P < 0.001) in favour of the IVB group. In terms of CMT reduction, the difference between the groups was statistically significant (P = 0.002) at month 6. Significant differences were noted more in the ischaemic cases in favour of the IVB group. Mean IOP rise was significantly higher in the IVT group at all visits. | |
| A Bayesian network meta‐analysis of RCTs of treatments for macular oedema secondary to BRVO. Interventions: ranibizumab 0.5 mg when necessary, aflibercept 2 mg monthly, dexamethasone 0.7 mg implant, laser photocoagulation, ranibizumab + laser, or sham intervention. Bevacizumab and triamcinolone were excluded. | 8 RCTs were identified for inclusion with 1743 adult patients. The probability of being the most efficacious treatment at month 6 or 12 based on letters gained was 54% for ranibizumab monotherapy, 30% for aflibercept, 16% for ranibizumab plus laser (adjunctive or prompt), and 0% for dexamethasone implant, laser or sham. The probability of being the most efficacious treatment for patients gaining ≥15 letters was 39% for aflibercept, 35% for ranibizumab monotherapy, 24% for ranibizumab plus laser, 2% for dexamethasone implant, and less than 1% for laser or sham. There was no statistical difference between ranibizumab monotherapy and aflibercept for letters gained (+1.4 letters for ranibizumab vs aflibercept with 95% credible interval (CrI) of −5.2 to +8.5 letters) or the OR for gaining ≥15 letters: 1.06 (95% CrI 0.16 to 8.94)). Dexamethasone implant was associated with significantly higher IOP/OH than antivascular endothelial growth factor agents (OR 13.1 (95% CrI 1.7 to 116.9)). | |
| A quasi‐RCT of 30 eyes in 30 patients in a single centre in Italy. 15 eyes received bevacizumab whilst 15 eyes received laser treatment. Follow‐up was for 12 months. | The laser arm showed improvement in VA of 0.21 and 0.20 logMAR at 6 and 12 months, respectively. The bevacizumab arm showed mean VA improvement at 6 and 12 months of 0.30 and 0.31, respectively (P < 0.05). CRT decreased by 42% in the laser arm and 60.3% in the bevacizumab arm at 12 months (P < 0.05). | |
| Participants received monthly injections of 0.5 mg ranibizumab for 7 months and those meeting | There was no significant difference in the slope of change in BCVA between months 7 and 15 in patients treated 'as needed' versus those treated with monthly injections (P = 0.509). Mean (standard deviation) change from baseline BCVA in Early Treatment Diabetic Retinopathy Study letter score at month 15 was 21.0 ± 14.1 in the PRN group (n = 82) versus 18.7 ± 14.1 in the monthly group (n = 80) and 14.5 ± 14.7 in NR participants (n = 13). The percentage of participants who achieved BCVA 20/40 at month 15 was 76.8% in the PRN group, 71.3% in the monthly group, and 46.2% in NR participants. The mean (standard deviation) change from baseline central subfield thickness was 247.8 ± 207.5 mm in the PRN group, 289.9 ± 177.2 mm in the monthly group, and 93.2 ± 225.2 mm in NR participants. There were no significant differences in mean BCVA gains or central subfield thickness reductions at month 15 between the PRN and monthly injection groups (all > 0.05). | |
| A study to investigate whether targeted retinal photocoagulation (TRP) of peripheral non‐perfused areas (NPAs) could prevent the recurrence of macular oedema (ME) due to branch retinal vein occlusion (BRVO) after intravitreal bevacizumab injection (IVB). Eyes received 1.25 mg IVB only (IVB group) or combined with TRP (IVB + TRP group) of NPAs, more than 5 disc areas identified by fluorescein angiography in the patients with ME secondary to BRVO. Best‐corrected visual acuity (BCVA) and central retinal thickness (CRT) determined by optical coherence tomography were measured every month for 6 months. | 38 patients were enrolled and randomised to IVB group (n = 19) and IVB + TRP group (n = 19). Both groups showed similar thinning in CRT at 1 week after IVB. The IVB + TRP group maintained thinner CRT at 2 (P = 0.0072) and 3 (P = 0.0086) months compared with IVB group. However, the difference in CRT became insignificant at 4, 5 and 6 months. The number of reinjections (± standard deviation) in IVB group (1.58 ±0.69) was significantly greater (P = 0.0025) than that in IVB + TRP group (0.83±0.62). BCVA significantly improved at 6 month in IVB + TRP group (P = 0.015), but not in IVB group. | |
| 20 eyes were randomised 3:1 to intravitreous injections of pegaptanib 0.3 or 1 mg at baseline and at weeks 6 and 12 with subsequent injections at 6‐week intervals at investigator discretion until week 48. Principal efficacy outcomes were change from baseline to week 54. | Results were similar in both dosage groups. Mean BCVA improved 14 letters and mean CMT decreased by 205 microns. | |
| 30 eyes of 30 patients with BRVO were randomised into 3 groups: group 1 (10 eyes) received grid laser treatment alone, group 2 received a single dose of intravitreal injection of ranibizumab (0.05 mL/0.5 mg) followed by grid laser treatment 7 days following injection. Group 3 (10 eyes) received 3 loading doses of intravitreal ranibizumab with grid laser treatment 7 days after the first injection. After 6 months follow‐up, the best‐corrected visual acuity and optical coherence tomography (OCT) and central macular thickness were observed. | After 6 months, the visual acuity of patients was improved significantly. There was an average increase of 11 letters, 17 letters and 18 letters in group 1, 2, and 3 respectively, with the average decrease in OCT being 208.7 mum, 312.9 mum and 326.8 mum, respectively, in these groups. Gain in visual acuity more than 3 lines was 1 case (10%) in group 1. There were 3 cases (30%) in group 2 and 4 cases (40%) in group 3. |
BCVA: best‐corrected visual acuity; BRVO: branch retinal vein occlusion; CMT: central macular thickness; CRVO: central retinal vein occlusion; IVB: intravitreal bevacizumab; MO: macular oedema; OCT: optical coherence tomography
Risk of bias in included studies
Figure 2 highlights the 'Risk of bias' assessment for included studies in each domain.

'Risk of bias' summary: review authors' judgements about each risk of bias item for each included study.
The included studies varied slightly in their eligibility criteria. Some only included treatment‐naive participants, whilst others allowed previous treatment as long as it was given some time previously. Although no study gave a specific age range for inclusion, the mean participant age did vary between trials. Some studies were double‐masked, whilst others had poorer levels of masking.
Nevertheless, we judge the differences between studies to be small compared to the treatment effect and the results of this review can be interpreted with a high degree of certainty.
Allocation
Bandello 2018 showed unclear levels of selection bias with no information given about random sequence generation or allocation concealment.
BLOSSOM remains unpublished so the risk of allocation bias is unclear.
BRIGHTER had low risk of selection bias. The randomisation list was generated using a validated system that automates the random assignment of treatment arms to randomisation numbers in the specified ratio. Concealment of allocations was performed prior to assignment.
COMRADE‐B also showed low risk of allocation bias and appropriate randomisation. At enrolment, participants were randomised 1:1 to receive either ranibizumab or dexamethasone intravitreal implant treatment. A randomisation list was produced using a validated system that randomly assigned the treatment arms to randomisation numbers in the specified ratio.
The study by Higashiyama and colleagues had unclear levels of selection bias. The doctor who designed and conducted this study (OS) was responsible for randomisation and random allocation performed by the others on the day that the participants received an intravitreal injection. The 'envelope' method was used for randomisation (Higashiyama 2013).
We judge RABAMES to be at low risk for selection bias. The randomisation list implemented blocked randomisation with one block of size 30 (10 eyes and participants per study arm) without any stratification. Randomization was performed by the coordinating study centre.
The study by Ramezani and colleagues is low risk for selection bias. Randomization was performed using a random block permutation method according to a computer‐generated randomisation list. The block length varied randomly (4, 8). Random allocation sequence was performed by a biostatistician. He put the randomisation sequence in numbered, labelled, concealed envelopes. Whenever a new participant passed inclusion criteria a new envelope was opened and the group was revealed (Ramezani 2012).
VIBRANT was a large trial with low risk for selection bias. Eyes were randomised 1:1 into the IAI and laser groups according to a predetermined central randomisation scheme. Randomisation was provided by an interactive voice/web response system to the designated unmasked personnel.
Blinding
We deemed Bandello 2018 to be high risk for performance bias due to failure to mask investigators and participants.
BLOSSOM remains unpublished so the risk of performance and detection bias is unclear.
BRIGHTER had a high risk of performance and detection bias. There was no masking of investigators or participants (save for a visual acuity assessment investigator). Failing to mask the participant makes unmasking a high risk.
COMRADE‐B was judged low risk for performance bias. A minimum of two investigators were involved, per study site, to fulfil the masking requirements. The injecting physician was unmasked and performed the study drug administrations as per the protocol; the physician was not involved in any other aspects of the study, however, and was not allowed to communicate the details of the treatment to anyone. Participants were masked and sham injections were given to the dexamethasone group after the baseline injection. The evaluating physician was masked to the treatment assigned so detection bias was minimal.
The risk of performance and detection bias was high in Higashiyama 2013. Treating doctors were not masked. Participants were masked although the nature of triamcinolone and bevacizumab injections are different symptomatically so this masking is likely compromised. Furthermore, outcome assessors were not masked.
RABAMES showed high risk of performance bias as there was no masking of investigators or participants save for OCT assessment. Nevertheless, OCT scans were evaluated by an independent retina specialist masked to the individual treatment.
Ramezani 2012 showed unclear risk of performance bias. The study group masked participants to their treatment; however, since triamcinolone might cause floaters they do not consider this study as a double‐masked one. Detection bias was minimised at baseline and at each study visit thereafter: refraction and BCVA were determined, and OCT was performed by certified examiners masked both to the randomisation and to the findings of previous measurements.
VIBRANT had low risk of bias due to poor masking. A sham laser treatment was also performed at baseline. Eyes in the laser group received macular laser photocoagulation at baseline and sham injections every four weeks from baseline to week 20. Optical coherence tomography images were evaluated by an independent central reading centre.
Incomplete outcome data
Bandello 2018 was judged as high risk for attrition bias. Forty‐two participants did not complete the study in the Ozurdex arm compared to only 14 in the ranibizumab arm. The most common reason for Ozurdex failure of completion was adverse event (raised IOP).
In BLOSSOM, 94.0% of participants completed 12 months' follow‐up (93.2% in the ranibizumab arm and 95.7% in the sham arm). The intent‐to‐treat approach was used for efficacy analyses and included all participants as randomised.
There was a high risk of attrition bias in BRIGHTER: 13% loss of participants from 'laser only' group at six months (half of these due to physicians' decision). The risk was also high in COMRADE‐B, where the ranibizumab arm showed 91.3% follow‐up at six months, higher than the 84.7% in the dexamethasone arm. The dexamethasone arm had six participant withdrawals due to inadequate response to treatment and six withdrawals due to adverse events (the nature of these is not clear).
In the Higashiyama 2013 study, three triamcinolone and four bevacizumab participants were lost to follow‐up. These were not analysed in the 12‐month results.
RABAMES was low risk for attrition bias as only one participant withdrew from the study. This was due to stroke and occurred in the combined ranibizumab and laser group. This was also the case for the study by Ramezani 2012, where only one participant was lost to follow‐up at six months. This occurred in the bevacizumab group.
VIBRANT was low risk for attrition bias. All randomised eyes in both treatment groups were included in the full analysis set, except for two eyes in the laser group that did not have a post‐baseline BCVA assessment.
Selective reporting
The following trials reported all pre‐specified primary and secondary outcomes listed in their study protocol on ClinicalTrials.gov and we considered them at low risk for selective reporting: BLOSSOM, BRIGHTER (NCT01599650), COMRADE‐B (NCT01396057), Bandello 2018 (NCT01427751), RABAMES (NCT00562406), Ramezani 2012 (NCT00370266) and VIBRANT (NCT01521559).
The protocol for Higashiyama 2013 was not available and we are unable to exclude the possibility of selective reporting: we consider the study ‘unclear’ in this domain.
Other potential sources of bias
Some trials received pharmaceutical company funding.
Of the eight trials included, five received pharmaceutical company funding: BRIGHTER, COMRADE‐B, Bandello 2018, RABAMES and VIBRANT. This support included study design, conducting the study, data collection, management and data interpretation to various degrees. There was also support for medical writing and editorial assistance.
Effects of interventions
See: Summary of findings 1 Anti‐VEGF compared to sham for macular oedema secondary to branch retinal vein occlusion; Summary of findings 2 Anti‐VEGF compared to laser for branch retinal vein occlusion (BRVO); Summary of findings 3 Anti‐VEGF compared to steroid for branch retinal vein occlusion (BRVO)
Anti‐VEGF treatment versus sham
Improvement of 15 or more letters (primary outcome)
People receiving anti‐VEGF showed better outcome than those treated with sham injections at six months (RR 1.72, 95% CI 1.19 to 2.49; 1 study, 283 participants; moderate‐certainty evidence; Analysis 1.1). Unfortunately, this outcome was limited to only one trial and for only six months, as rescue treatment was available after this time (BLOSSOM).
Mean change in best‐corrected visual acuity (BCVA)
People receiving anti‐VEGF showed better improvement in mean visual acuity than those receiving sham at six months (MD 7.50 letters, 95% CI 5.29 to 9.71; 1 study, 282 participants; moderate‐certainty evidence; Analysis 1.2).
Loss of 15 or more letters
People receiving anti‐VEGF showed better outcome than those treated with sham injections at six months (RR 0.24). However, the 95% CI (0.05 to 1.31) included 1.00 (Analysis 1.3).
Central retinal thickness (CRT)
No data was available for 12 months but results at six months showed participants receiving anti‐VEGF had a greater reduction in central retinal thickness than those receiving sham (MD −57.50 microns, 95% CI −108.63 to −6.37; 1 study, 281 participants; moderate‐certainty evidence; Analysis 1.4).
Adverse events (AEs)
The anti‐VEGF and sham cohorts reported similar levels of ocular and systemic adverse events. Antiplatelet Trialists’ Collaboration (APTC) arterial thromboembolic events were equally common in both groups. Endophthalmitis was rare.
Quality of life
The mean improvement in quality of life (QoL) at 12 months on the National Eye Institute Visual Functioning Questionnaire‐25 (VFQ‐25) (scored 0 to 100; higher score is better quality of life) was 7.60 higher (4.30 to 10.90) (1 study, 281 participants; moderate‐certainty evidence; Analysis 1.8).
Anti‐VEGF treatment versus laser photocoagulation
Improvement of 15 or more letters (primary outcome)
Eyes receiving anti‐VEGF showed better outcome than the laser arm at six months (RR 2.09, 95% CI 1.44 to 3.05; 2 studies, 201 participants; I² = 0%; moderate‐certainty evidence; Analysis 2.1). There were no results available for 12 months.
Mean change in best‐corrected visual acuity (BCVA)
People receiving anti‐VEGF showed greater gains than those receiving laser at six months (MD 9.63 letters, 95% CI 7.23 to 12.03; 3 studies, 473 participants; I² = 0%; moderate‐certainty evidence; Analysis 2.2; Figure 3). There were no results available for 12 months.
![Forest plot of comparison: 2 Anti‐VEGF v laser, outcome: 2.2 Mean VA change at 6 months [letters].](/cdsr/doi/10.1002/14651858.CD009510.pub3/media/CDSR/CD009510/image_n/nCD009510-FIG-03.svg)
Forest plot of comparison: 2 Anti‐VEGF v laser, outcome: 2.2 Mean VA change at 6 months [letters].
Central retinal thickness (CRT)
Mean change in CRT was greater in the anti‐VEGF than the laser group at six months (MD −147.47 microns, 95% CI −200.19 to −94.75; 2 studies, 201 participants; I² = 0%; moderate‐certainty evidence; Analysis 2.3) although no data was available for 12 months of treatment.
Adverse events
Systemic adverse events were well‐matched between the anti‐VEGF and laser cohorts. There was no sign that thromboembolic events were more common in either group (Figure 4). There were no episodes of endophthalmitis after any intravitreal anti‐VEGF injection.

Forest plot of comparison: 2 Anti‐VEGF v laser, outcome: 2.5 APTC events.
Quality of life
This data was not reported.
Anti‐VEGF treatment versus steroid
Improvement of 15 or more letters (primary outcome)
Participants receiving anti‐VEGF showed better outcomes than steroid at six months (RR 1.67, 95% CI 1.33 to 2.10; 2 studies, 330 participants; I² = 0%; high‐certainty evidence; Analysis 3.1; Figure 5); and 12 months (RR 1.76, 95% CI 1.36 to 2.28; 1 study, 307 participants; high‐certainty evidence; Analysis 3.2).

Forest plot of comparison: 3 Anti‐VEGF v steroid, outcome: 3.1 Gain of 15 letters or more at 6 months.
Mean change in best‐corrected visual acuity (BCVA)
Eyes receiving anti‐VEGF showed a great improvement in visual acuity than those in the steroid arm both at six months (MD 8.22 letters, 95% CI 5.69 to 10.76; 2 studies, 330 participants; I² = 0%; high‐certainty evidence; Analysis 3.3); and 12 months (MD 9.15 letters, 95% CI 6.32 to 11.97; 2 studies, 343 participants; I² = 0%; high‐certainty evidence; Analysis 3.4).
Central retinal thickness (CRT)
Central macular thickness showed a greater reduction at 12 months in eyes receiving anti‐VEGF than those receiving steroid (MD −26.92 microns, 95% CI −65.88 to 12.04; 3 studies, 343 participants; I² = 0%; moderate‐certainty grade; Analysis 3.6).
Adverse events
Systemic adverse events were similar in the anti‐VEGF and steroid cohorts. However, ocular adverse events were more common in the steroid cohort, who had greater rates of cataract formation (moderate‐certainty evidence) and raised intraocular pressure (moderate‐certainty evidence; Figure 6).

Forest plot of comparison: 3 Anti‐VEGF v steroid, outcome: 3.9 Raised IOP.
Quality of life
Participants receiving anti‐VEGF showed a greater improvement in quality of life at 12 months compared to those receiving steroid (MD 3.10, 95% CI 0.22 to 5.98; 1 study, 307 participants; moderate‐certainty evidence).
Discussion
Summary of main results
This systematic review and meta‐analysis has revealed that in the treatment of macular oedema secondary to branch retinal vein occlusion, intravitreal anti‐VEGF agents give the best outcomes and are as safe, or safer, than sham, laser photocoagulation or intravitreal steroid.
BLOSSOM study showed that anti‐VEGF is more effective than sham in promoting visual gain and reducing visual loss over a 6‐month follow‐up. Anti‐VEGF was also more effective at reducing central macular thickness.
Several studies compared anti‐VEGF with laser, with follow‐up of six months (RABAMES, BRIGHTER and VIBRANT). Together, these studies showed anti‐VEGF is more effective than laser at improving visual outcome, reducing visual loss and promoting resolution of macular oedema.
Anti‐VEGF is also more effective in achieving functional and anatomical outcomes than intravitreal steroid, both triamcinolone and dexamethasone implant (COMRADE‐B, Ramezani 2012, Bandello 2018, and Higashiyama 2013). Anti‐VEGF has a better adverse event profile, and improves quality of life more than steroid.
Overall completeness and applicability of evidence
Intravitreal anti‐VEGF treatment and sham
This comparison included only one study, and this was limited to six months as rescue treatment with anti‐VEGF was possible after this for the sham arm (BLOSSOM). The BRAVO 2010 study had to be excluded as rescue laser was available to both the sham and anti‐VEGF arms of the study. Although BLOSSOM remains unpublished, the data provided by this trial give good high‐certainty evidence for the benefit of anti‐VEGF over sham.
Intravitreal anti‐VEGF treatment and grid laser photocoagulation (GLP)
Overall, this involved a total of 473 participants and two anti‐VEGF agents were represented: ranibizumab (RABAMES and BRIGHTER), and aflibercept (VIBRANT).
The studies generally included participants with a wide range of baseline visual acuity, typically 20/40 and 20/400. RABAMES included only perfused (non‐ischaemic) BRVO whereas this was not a specified criterion in BRIGHTER or VIBRANT. Eyes with ischaemic BRVO tend to have poorer baseline acuity, and there is thus insufficient study data to predict the efficacy of anti‐VEGF or laser treatment in these eyes.
Furthermore, VIBRANT included hemi‐retinal vein occlusion (HRVO) as a form of BRVO whereas it is not clear whether the other studies did this also. As HRVO is considered by some authorities as a subtype of CRVO rather than BRVO, it is unclear whether the inclusion of these eyes makes a meaningful difference to the results and conclusions.
RABAMES included treatment‐naive participants only although the other studies permitted inclusion of participants who had previously been treated. Participants seen in clinic outside a clinical trial setting are more likely to have had previous treatment, as well as ocular comorbidities such as diabetic retinopathy. As more such participants were excluded from the clinical trials, the effect of ocular comorbidity cannot be determined with any certainty.
Intravitreal anti‐VEGF treatment and intravitreal steroid
Four RCTs contributed data to this comparison, two comparing anti‐VEGF with intravitreal triamcinolone (Higashiyama 2013 and Ramezani 2012) and two comparing anti‐VEGF with intravitreal dexamethasone implant (COMRADE‐B and Bandello 2018). Both bevacizumab (Higashiyama 2013 and Ramezani 2012) and ranibizumab (COMRADE‐B and Bandello 2018) were included.
Higashiyama 2013 included treatment‐naive eyes of less than 12‐months disease duration, although there is no mention of ischaemic status. Ramezani 2012 also included treatment‐naive eyes only, but limited this to disease duration of 12 weeks or less at baseline. COMRADE‐B permitted previously treated eyes but stipulated a treatment‐free period of three months for anti‐VEGF and six months for prior intravitreal steroids. Bandello 2018 included treatment‐naive eyes only with symptom duration of three months or less. The study also excluded eyes with 'severe macular ischaemia'.
Quality of the evidence
Intravitreal anti‐VEGF treatment and sham
We found one RCT with good methodological quality for this comparison (BLOSSOM). This, however, remains unpublished so we obtained data from ClinicalTrials.gov.
Intravitreal anti‐VEGF treatment and grid laser photocoagulation (GLP)
A total of three studies contributed data to this comparison (RABAMES, BRIGHTER and VIBRANT). VIBRANT and BRIGHTER were particularly large studies with good study design.
RABAMES has low risk of selection bias but high risk of performance and detection bias due to a lack of masking of participants or assessors. Nevertheless, the two largest RCTs (BRIGHTER and VIBRANT) showed good study design with a low risk of bias.
Intravitreal anti‐VEGF treatment and intravitreal steroid
Four RCTs were included in this analysis. These studies showed a high risk of bias. Higashiyama 2013 failed to mask participants and outcome assessors, meaning a high risk of performance and detection bias. Ramezani 2012 did mask outcome assessors, but there was insufficient information in the article to determine whether allocation concealment was performed to a high enough level to avoid selection bias. Although COMRADE‐B was well designed to avoid bias, limiting dexamethasone use to baseline only with outcomes reported at six months meant a waning of the treatment effect of this drug. Bandello 2018 failed to mask investigators and participants, so has high risk of performance and detection bias.
Heterogeneity
Subgroup analysis comparing the effect of the three anti‐VEGF agents (bevacizumab, ranibizumab and aflibercept) showed no difference in efficacy.
Overall, heterogeneity was low across studies, with low Chi², high P values and low I² values. There was, however, one exception to this.
In Analysis 3.5, heterogeneity was observed between COMRADE‐B and Ramezani 2012 for mean CRT at six months. Participants in the steroid arm of COMRADE‐B did poorly compared to those in the steroid arm of Ramezani 2012. In Ramezani 2012, eyes in the steroid arm received two injections of intravitreal steroid spaced two months apart, meaning the treatment effect was more sustained, whilst those in COMRADE‐B only received a single dose of steroid at baseline. This might explain the observed heterogeneity.
Potential biases in the review process
The studies included in this review typically only provided data for six months of treatment, save Higashiyama 2013 and Bandello 2018, which had 12 months of follow‐up. Typically, the study designs permitted rescue treatment after six months, hence necessitating exclusion after this. Short follow‐up of six months can introduce bias, particularly in investigation of adverse events, such as cataract formation in the use of intravitreal steroids.
Included studies showed some clinical heterogeneity as they were conducted in diverse ethnicities and also showed differences in inclusion criteria, such as the inclusion or exclusion of ischaemic BRVO. We judged the effect of this to be small compared to the treatment effects observed.
Further heterogeneity arose from the anti‐VEGF used within the studies, as bevacizumab, ranibizumab and aflibercept were all used. We judged the effect of this also to be small due to the similar efficacy of all three agents demonstrated in the results.
Statistical heterogeneity between studies was low.
We found intra‐study selective outcome reporting to be minimal for all but two of the included studies. This was demonstrated by comparing the published results with the study protocol. The protocol for Higashiyama 2013 was not available on ClinicalTrials.gov and we are unable to exclude the possibility of selective reporting.
Publication bias was avoided by using trial registries to look for studies to include. One study was not published but we obtained data from the trial registry (BLOSSOM). We also contacted the authors of this study to obtain further study information, such as that needed to assess risk of bias.
Studies comparing anti‐VEGF with steroid showed poor masking of study participants and outcome assessors. This is most likely due to the nature of the respective injection, which is colourless liquid for anti‐VEGF and crystals/implant for steroid. This exposes this group of studies to performance and detection bias.
Agreements and disagreements with other studies or reviews
We found three systematic reviews using our search strategy. The first preceded the widespread use of intravitreal anti‐VEGF for BRVO and does not report recent studies examining the efficacy of this treatment (McIntosh 2007). The second, Regnier 2015, evaluated treatments for BRVO to 2015, finding eight RCTs with a total of 1743 adult participants. As with our systematic review, anti‐VEGF agents were found to be more effective than steroids or laser in improving visual acuity at six and 12 months. Anti‐VEGF agents were also safer than intravitreal steroids, that were associated with intraocular pressure rise. Qian 2017, the third systematic review that we found, also performed a systematic review but included CRVO as well as BRVO studies to 2017. In BRVO, this review found anti‐VEGF agents to be more effective than steroids or laser in improving visual acuity at three, six and 12 months, with lower IOP compared to steroids.

Study flow diagram.

'Risk of bias' summary: review authors' judgements about each risk of bias item for each included study.
![Forest plot of comparison: 2 Anti‐VEGF v laser, outcome: 2.2 Mean VA change at 6 months [letters].](/es/cdsr/doi/10.1002/14651858.CD009510.pub3/media/CDSR/CD009510/image_n/nCD009510-FIG-03.svg)
Forest plot of comparison: 2 Anti‐VEGF v laser, outcome: 2.2 Mean VA change at 6 months [letters].

Forest plot of comparison: 2 Anti‐VEGF v laser, outcome: 2.5 APTC events.

Forest plot of comparison: 3 Anti‐VEGF v steroid, outcome: 3.1 Gain of 15 letters or more at 6 months.

Forest plot of comparison: 3 Anti‐VEGF v steroid, outcome: 3.9 Raised IOP.

Comparison 1: Anti‐VEGF v sham, Outcome 1: Gain of 15 letters or more at 6 months

Comparison 1: Anti‐VEGF v sham, Outcome 2: Mean VA change at 6 months

Comparison 1: Anti‐VEGF v sham, Outcome 3: Loss of 15 letters or more at 6 months

Comparison 1: Anti‐VEGF v sham, Outcome 4: Mean CRT change at 6 months

Comparison 1: Anti‐VEGF v sham, Outcome 5: Cataract

Comparison 1: Anti‐VEGF v sham, Outcome 6: Raised IOP

Comparison 1: Anti‐VEGF v sham, Outcome 7: APTC events

Comparison 1: Anti‐VEGF v sham, Outcome 8: Quality of life change

Comparison 2: Anti‐VEGF v laser, Outcome 1: Gain of 15 letters or more at 6 months

Comparison 2: Anti‐VEGF v laser, Outcome 2: Mean VA change at 6 months

Comparison 2: Anti‐VEGF v laser, Outcome 3: Mean CRT change at 6 months

Comparison 2: Anti‐VEGF v laser, Outcome 4: Cataract

Comparison 2: Anti‐VEGF v laser, Outcome 5: APTC events

Comparison 3: Anti‐VEGF v steroid, Outcome 1: Gain of 15 letters or more at 6 months

Comparison 3: Anti‐VEGF v steroid, Outcome 2: Gain of 15 letters or more at 12 months

Comparison 3: Anti‐VEGF v steroid, Outcome 3: Mean VA change at 6 months

Comparison 3: Anti‐VEGF v steroid, Outcome 4: Mean VA change at 12 months

Comparison 3: Anti‐VEGF v steroid, Outcome 5: Mean CRT change at 6 months

Comparison 3: Anti‐VEGF v steroid, Outcome 6: Mean CRT change at 12 months

Comparison 3: Anti‐VEGF v steroid, Outcome 7: Quality of life change at 12 months

Comparison 3: Anti‐VEGF v steroid, Outcome 8: Cataract

Comparison 3: Anti‐VEGF v steroid, Outcome 9: Raised IOP

Comparison 3: Anti‐VEGF v steroid, Outcome 10: APTC events

Comparison 3: Anti‐VEGF v steroid, Outcome 11: Endophthalmitis
| Anti‐VEGF v sham for macular oedema secondary to branch retinal vein occlusion | |||||||
| Patient or population: macular oedema secondary to branch retinal vein occlusion | |||||||
| Outcomes | Anticipated absolute effects* (95% CI) | Relative effect | № of participants | Certainty of the evidence | Comments | ||
|---|---|---|---|---|---|---|---|
| Risk with sham | Risk with anti‐VEGF | ||||||
| Gain of 15 letters or more of visual acuity at 6 months | 6 months | 269 per 1000 | 462 per 1000 | RR 1.72 | 283 | ⊕⊕⊕ | |
| 12 months | Data not available because participants in sham group received anti‐VEGF after 6 months | ||||||
| Mean change in visual acuity letters at 6 months measured with a logMAR chart (higher letter score is better visual acuity) | 6 months | The mean VA change with sham was 5 letters | The mean number of letters read with anti‐VEGF was 7.50 letters more (5.29 more to 9.71 more) | ‐ | 282 | ⊕⊕⊕ | |
| 12 months | Data not available because participants in sham group received anti‐VEGF after 6 months | ||||||
| Mean central retinal thickness (CRT) change at 6 months in microns (lower value is better) | The mean CRT change with sham was −207 microns | The mean CRT with anti‐VEGF was 57.5 microns less | ‐ | 281 | ⊕⊕⊕ | ||
| Adverse outcomes at any time point | Cataract | 11 per 1000 | 11 per 1000 (1 to 106) | RR 0.98 (0.09 to 10.66) | 283 (1 RCT) | ⊕ | 12 month results. Patients in the sham arm were able to receive rescue anti‐VEGF after 6 months. |
| Raised IOP* | 1 per 1000 | 6 per 1000 (0 to 101) | RR 5.41 (0.30 to 96.88) | 283 (1 RCT) | ⊕ | ||
| APTC events | 22 per 1000 | 32 per 1000 (6 to 142) | RR 1.47 (0.30 to 7.14) | 283 (1 RCT) | ⊕ | ||
| Endophthalmitis | No endophthalmitis was reported in either anti‐VEGF (n = 190) or sham (n = 91) arms | ||||||
| Mean change in quality of life (QoL) at 12 months on the National Eye Institute Visual Functioning Questionnaire‐25 (VFQ‐25) (scored 0 to 100) (higher score is better quality of life) | The mean QoL change with sham was 0 | The mean QoL score with anti‐VEGF was 7.60 higher (4.30 to 10.90) | ‐ | 281 (1 RCT) | ⊕⊕⊕ | Data collected at 6 months because participants in sham group received anti‐VEGF after 6 months | |
| *The risk in the intervention group (and its 95% CI) is based on the assumed risk in the comparison group and the relative effect of the intervention (and its 95% CI). Where no events observed in control group, we have used an estimate of 1 per 1000 for illustrative purposes. | |||||||
| GRADE Working Group grades of evidence | |||||||
| 1Downgraded 1 level for risk of bias 2Downgraded 2 levels for imprecision and 1 level for risk of bias | |||||||
| Anti‐VEGF compared to laser for branch retinal vein occlusion (BRVO) | |||||||
| Patient or population: people with BRVO | |||||||
| Outcomes | Anticipated absolute effects* (95% CI) | Relative effect | № of participants | Certainty of the evidence | Comments | ||
|---|---|---|---|---|---|---|---|
| Risk with laser | Risk with anti‐VEGF | ||||||
| Gain of 15 letters or more of visual acuity | 6 months | 260 per 1000 | 543 per 1000 | RR 2.09 | 201 | ⊕⊕⊕ | |
| 12 months | Data not available because participants in sham group received anti‐VEGF after 6 months | ||||||
| Mean change in visual acuity letters measured with a logMAR chart (higher letter score is better visual acuity) | 6 months | The mean visual acuity change with laser ranged from 2 to 7 letters | The mean number of letters read with anti‐VEGF was 9.63 letters more | ‐ | 473 | ⊕⊕⊕ | |
| 12 months | Data not available because participants in sham group received anti‐VEGF after 6 months | ||||||
| Mean central retinal thickness (CRT) change at 6 months in microns (lower value is better) | The mean CRT change with laser was −128 microns | The mean CRT change with anti‐VEGF was 147.47 microns less | ‐ | 201 | ⊕⊕⊕ | ||
| Adverse outcomes at any time point | Cataract* | 1 per 1000 | 3 per 1000 (0 to 75) | RR 2.97 (0.12 to 71.89) | 456 (2 RCTs) | ⊕ | |
| Raised IOP* | No raised IOP was reported in either anti‐VEGF (n = 182) or laser (n = 93) groups | ⊕ | |||||
| APTC events | 5 per 1000 | 4 per 1000 (1 to 37) | RR 0.99 (0.15 to 6.78) | 476 (3 RCTs) | ⊕ | ||
| Endophthalmitis | No endophthalmitis was reported in either anti‐VEGF (n = 284) or laser (n = 192) arms | ⊕ | |||||
| Mean change in quality of life at 12 months on the National Eye Institute Visual Functioning Questionnaire‐25 (VFQ‐25) (scored 0 to 100) (higher score is better quality of life) | Not reported | ||||||
| *The risk in the intervention group (and its 95% CI) is based on the assumed risk in the comparison group and the relative effect of the intervention (and its 95% CI). Where no events observed in control group, we have used an estimate of 1 per 1000 for illustrative purposes. | |||||||
| GRADE Working Group grades of evidence | |||||||
| 1Downgraded 1 level for risk of bias 2Downgraded 1 level for risk of bias and 2 levels for imprecision | |||||||
| Anti‐VEGF compared to steroid for BRVO | |||||||
| Patient or population: people with BRVO | |||||||
| Outcomes | Anticipated absolute effects* (95% CI) | Relative effect | № of participants | Certainty of the evidence | Comments | ||
|---|---|---|---|---|---|---|---|
| Risk with steroid | Risk with anti‐VEGF | ||||||
| Gain of 15 letters or more of visual acuity | 6 months | 379 per 1000 | 633 per 1000 | RR 1.67 | 330 | ⊕⊕⊕⊕ | |
| 12 months | 338 per 1000 | 595 per 1000 (460 to 771) | RR 1.76 | 307 | ⊕⊕⊕⊕ | ||
| Mean change in visual acuity letters measured with a logMAR chart (higher letter score is better visual acuity) | 6 months | The mean visual acuity change with steroid ranged from 9 to 11 letters | The mean number of letters read with anti‐VEGF was 8.22 more | ‐ | 330 | ⊕⊕⊕⊕ | |
| 12 months | The mean visual acuity change with steroid ranged from 6 to 8 letters | The mean number of letters read with anti‐VEGF was on average 9.15 letters more (6.32 more to 11.97 more) | ‐ | 343 (2 RCTs) | ⊕⊕⊕⊕ | ||
| Mean central retinal thickness (CRT) change at 12 months in microns (lower value is better) | The mean CRT change with steroid ranged from −249 to −306 microns | The mean CRT change with anti‐VEGF was 26.92 microns less | ‐ | 343 | ⊕⊕⊕ | ||
| Adverse outcomes at any time point | Cataract | 125 per 1000 | 22 per 1000 (7 to 75) | RR 0.12 (0.04 to 0.32) | 551 (3 RCTs) | ⊕⊕⊕ | |
| Raised IOP | 240 per 1000 | 57 per 1000 (34 to 94) | RR 0.25 (0.16 to 0.40) | 673 (4 RCTs) | ⊕⊕⊕ | ||
| APTC events | 1 per 1000 | 3 per 1000 (0 to 74) | RR 3.02 (0.12 to 73.55) | 587 (3 RCTs) | ⊕ | ||
| Endophthalmitis | No endophthalmitis was reported in either anti‐VEGF (n = 187) or steroid (n = 179) arms. | ||||||
| Mean change in quality of life at 12 months on the National Eye Institute Visual Functioning Questionnaire‐25 (VFQ‐25) (scored 0 to 100) (higher score is better quality of life) | The mean change in quality of life score with steroid was 3.5 | The mean change in quality of life score with anti‐VEGF was 3.10 higher | ‐ | 307 | ⊕⊕⊕ | ||
| *The risk in the intervention group (and its 95% CI) is based on the assumed risk in the comparison group and the relative effect of the intervention (and its 95% CI). | |||||||
| GRADE Working Group grades of evidence | |||||||
| 1 One study was judged to be at high risk of attrition bias because participants in the steroid group dropped out of the study due to adverse effects and poor response. We did not downgrade for risk of bias as the direction of the risk of bias is likely to be favouring the steroid group and so the estimate of effect reported here may well be an under‐estimate. 2Downgraded 1 level for risk of bias (studies were at high risk of attrition bias) 3Downgraded 2 levels for imprecision and 1 level for risk of bias | |||||||
| Study name | Number of eyes included | Prospective recruitment | Drug and dose | Mean IVI | Mean f‐up | Outcome |
| 32 eyes | No | Bevacizumab 1.25 mg
| 1.7 | 4 m (median) | Mean BCVA (logMAR) improved from 0.7 to 0.5 and mean CMT improved from 454 µm to 305 µm | |
| 42 eyes (All non‐ischaemic) | No | Bevacizumab 1.25 mg |
| 12 m | Improvement in mean Snellen BCVA from 20/280 to 20/170 at final follow‐up. Mean CMT reduction from 451 µm to 400 µm at 6 mths. | |
| 39 eyes (14 with MO and BRVO) | No | Bevacizumab 1.25 mg | 1.4 | 5.4 m | 50% of patients had previous laser treatment. The mean log‐MAR of the BRVO group was 0.71, and this improved 1 month after the second injection to 0.34. The mean CMT was 468.6 µm which decreased to 186.4 µm at final follow‐up. No significant ocular or systemic SE. | |
| 191 eyes Comparative study: IVB (n = 73) versus IVTA (n = 118) (non‐ischaemic = 90%) | No | Bevacizumab 1.25 mg
| 1.9 | 11.1 m | Mean BCVA (logMAR) improved from 0.91 to 0.45 in the IVB group and mean CMT decreased from 477 µm to 218 µm. | |
| 52 eyes Comparative study: IVTA (n = 17), IVB (n = 14), combined (n = 21) (All non‐ischaemic) | Yes | Bevacizumab 1.25 mg
| 1.6 | 6 m | Mean BCVA (logMAR) improved from 0.92 to 0.45 in the IVB group. No significant ocular or systemic SE. | |
| 83 eyes Comparative study: IVTA (n = 25), IVB (n = 24), no treatment (n = 34) (56% ischaemic) | Yes | Bevacizumab 2.5 mg
| 1 | 41.4 wks | BCVA (logMAR) improved from 0.95 to 0.79 at 12 weeks Mean CMT decreased from 457 µm to 323 µm 24 weeks after treatment | |
| 29 eyes Comparative study: IVTA (n = 16), IVB (n = 13) | No | Bevacizumab 1.25 mg
| 1.6 | 7.4 m | 61.5% of IVB group received previous laser treatment. Improvement in mean BCVA (logMAR) from 0.99 to 0.35 at final follow‐up. Reduction in mean CMT from 538 µm to 222 µm microns. No significant ocular or systemic side effects. | |
| 50 eyes | No | Bevacizumab 1.25 mg
| 1.94 | 7.9 m | 56% gained 5 or more ETDRS letters; 44% had less than 5 ETDRS letter gain or worse final BCVA. No significant ocular or systemic side effects. | |
| 28 eyes | Yes | Bevacizumab 1.25 mg
| 3.7 | 6 m | Improvement in mean BCVA (logMAR) from 0.8 to 0.44 at final follow‐up. Reduction in mean CMT from 486 µm to 268 µm. | |
| 52 eyes (23% ischaemic) | No | Bevacizumab 1.25 mg
| 3.3 | 12 m | Only 17 eyes (26%) returned for follow‐up. The median Snellen BCVA improved from 20/100 at baseline to 20/50 at 12 months. The mean CMT decreased by 205 µm compared with baseline. | |
| 12 eyes (40% ischaemic) | No | Bevacizumab 1.25 mg
| 4 | 9.8 m | Improvement in mean BCVA (logMAR) from 0.91 to 0.48 at final follow‐up. Reduction in mean CMT from 506 µm to 267.5 µm. | |
| 91 eyes | No | Bevacizumab 1.25 mg
| 1.3 | Up to 3 m | Mean reduction in CMT from 610 µm to 368 µm after 1 injection | |
| 61 eyes (34 with BRVO) | Yes | Bevacizumab 2.5 mg | 4.9 | 3 m | Mean BCVA (logMAR) improved from 0.50 to 0.32. Mean CMT decreased from 602 µm to 386 µm. | |
| 34 eyes Comparative study: IVTA (n = 34), IVB (n = 34) | No | Bevacizumab 1.25 mg
| 3.83 | 4.9 m | Mean BCVA improved by 0.14 logMAR units. Mean CMT decreased from 506 µm to 228 µm. | |
| 23 (All non‐ischaemic) | Yes | Bevacizumab 1.25 mg
| 1.6 in first 6 months and 0.8 in second 6 months | 12 m | The median VA gained 3.0 lines from baseline at 48 weeks and there was a decrease of 39% of the median CMT. | |
| 205 eyes | No | Bevacizumab 1.25 mg
|
| 36.8 wks
| The median BCVA (logMAR) was 0.6 at baseline improving to 0.4. Reduction in CMT, from a baseline of 454 µm to 248 µm. | |
| 50 eyes | Yes | Bevacizumab 1.25 mg
| 2 | 12 m | The mean BCVA (logMAR) improved from 0.53 to 0.26. Mean CMT decreased from 523 µm to 305 µm. | |
| 34 eyes | Yes | Bevacizumab 1.25 mg
| 2.9 | 6 m | The mean BCVA (logMAR) improved from 0.79 to 0.51 at 6 months. Mean CMT decreased from 474 µm to 316 µm. | |
| 29 eyes (21 with BRVO) | Yes | Bevacizumab 1.0 mg
| 2.3 | 6 m | Baseline mean BCVA was 50 ETDRS letters, by month 6, BCVA improved to 65 letters. CMT decreased from 558 µm to 382 µm. | |
| 18 eyes with BRVO (All non‐ischaemic) | No | Bevacizumab 1.25 mg
| 2.7 | 12 m | Baseline BCVA was 20/240 (logMAR 1.08) improving to 20/60 (logMAR 0.48) at the end of follow‐up (approx 12 months). The mean CMT decreased to 250 ± 48 µm. | |
| 12 eyes | No | Bevacizumab 1.25 mg
| 1 | 12 wks | Mean BCVA (logMAR) was 1.22 improving to 0.61. The mean CMT was 672.8 µm at baseline. There was a 44.6% decrease in CMT from baseline. | |
| 8 eyes | Yes | Ranibizumab 0.5 mg | 3.6 | 12 m | Mean improvement in BCVA (logMAR) from 0.80 0.41. Mean reduction of 275 µm in CMT from baseline. Contrast sensitivity, time and reading fluency improved significantly in the treated eyes. | |
| 21 eyes (BRVO only) | Yes | Bevacizumab 1 mg
| 8 | 12 m | In the BRVO group (n = 18), visual acuity increased from 55 letters (20/80) at baseline to 73 letters (20/32) at month 12. CMT decreased significantly by 241 μm after 12 months of follow‐up. | |
| 27 eyes | No | Bevacizumab 1.25 mg
| 2 | 5.3 m | Mean BCVA improved from 20/200 to 20/100 at final follow‐up. Mean CMT decreased from 487 µm to 332 µm at final follow‐up. No adverse side effects were observed following injections. | |
| 21 eyes | Yes | Bevacizumab 1.5 mg | 3 | 6.2 m | Mean BCVA (logMAR) improved from 0.81 to 0.55 at 6 months. Mean CMT decreased from 492 µm to 316 µm. | |
| 28 eyes | Yes | Ranibizumab 0.5 mg | 6 | 9 m | Mean BCVA (logMAR) improved from 0.74 to 0.49. Mean CMT decreased from 349 µm at baseline to 229 µm. | |
| 22 eyes (BRVO only) | No | Bevacizumab 2.5 mg | 2.6 | 23 wks | 76.5% of those with BRVO had a significant improved visual acuity (by at least 3 lines). Mean CMT decreased from 678 µm to 236 µm. | |
| 9 eyes | Yes | Bevacizumab 1.25 mg | 1 | 9 wks | Mean BCVA (logMAR) improved from 0.5 to 0.31 at 9 weeks. Mean CMT reduced from 408 µm to 309 µm. | |
| 25 eyes (12 with BRVO only) | Yes | Bevacizumab 2.5 mg | 2 | 6.5 m | 50% (6/12) had received previous treatment. Mean BCVA (logMAR) improved from 0.94 to 0.54 at final follow‐up. Mean CMT reduced from 392 µm to 234 µm. | |
| m: months; wks: weeks; BCVA: best‐corrected visual acuity; CMT: central macular thickness; IVTA: intravitreal triamcinolone; IVB: intravitreal bevacizumab; IVI: intravitreal injections; f‐up: follow‐up; VA: visual acuity | ||||||
| Study | Study details | Conclusion |
| Dose‐finding study: patients with CRVO (n = 14) and BRVO (n = 17) were randomised to receive either 0.3 mg ranibizumab or 0.5 mg ranibizumab and followed for 2 years | The 0.3 mg and 0.5 mg doses had similar results and when combined showed that 20 patients with BRVO had mean and median improvements in BCVA of 16.1 and 15 letters. After 2 years of follow‐up, only 5 of 17 patients with BRVO and 3 of 14 patients with CRVO were oedema‐free with no injections for at least 1 year. | |
| Dose‐finding study: patients with CRVO (n = 20) and BRVO (n = 20) were randomised to receive 3 monthly injections either 0.3 mg ranibizumab or 0.5 mg ranibizumab. | Primary end point at 3 months: improvement of 10 and 18 letters in the BRVO group for the lower and higher doses respectively. OCT showed that compared to lower dose injections, 0.5 mg of ranibizumab tended to cause more rapid reductions of central retinal thickening that lasted longer between injections. | |
| Retrospective study in eyes with CRVO and BRVO, 102 patients (64 in the anti‐VEGF (bevacizumab or ranibizumab) group, 38 in the DEX group) without previous treatment were included in this multi‐centre retrospective study and evaluated at baseline and 1, 3, 6, and 12 months after the onset of treatment. | Both the DEX and anti‐VEGF groups showed similar improvements in visual acuity and central retinal thickness. However, at 3 months, 5 patients (13%) in the DEX group and 20 (31%) in the anti‐VEGF group (P < 0.001) changed treatment due to poor response. | |
| Combination therapy retrospective study in CRVO and BRVO. 48 patients – 40 in the anti‐VEGF DEX sequence (AD group), 8 in the DEX anti‐VEGF sequence (DA group) – were included in this multicentre retrospective study and evaluated at baseline, 1, 3, 6 and 12 months after the switch. | VA significantly improved at 1 month in the AD group (P = 0.03) but not in the DA group (P = 0.40). CMT decreased significantly in the AD group at 1, 6 and 12 months (P = 0.002, P = 0.005 and P = 0.002, respectively). In the DA group, VA did not change from baseline at any time point, and CMT decreased at 1 month (P = 0.02) but not later on. | |
| Participants were randomised 1:1 to receive monthly treatment with bevacizumab or ranibizumab. The primary outcome was change in central foveal thickness at 6 months compared to baseline. | The trial randomised 98 patients to treatment with bevacizumab or ranibizumab. At 6 months, there were no differences in change in central foveal thickness between groups (bevacizumab: mean reduction of 212.6 microns, 95% CI (confidence interval) −288.3 to −137.0; ranibizumab: mean reduction of 243.8 microns, 95% CI, −309.6 to −178.0; P = 0.72, analysis of variance (ANOVA)). Both groups showed similar functional outcomes (bevacizumab: 0.33 logMAR gain, 95% CI, −0.47 to −0.18; ranibizumab: 0.34 log‐ MAR gain, 95% CI, −0.45 to −0.23; P = 0.38, ANOVA). | |
| The COMRADE‐B study was a 6‐month RCT comparing ranibizumab with dexamethasone implant. The extension study followed up a subset of the original study group for a further 6 months. | Patients enrolled in the extension study were limited only to German centres, and in general had better visual acuity outcomes at 6 months than those not enrolled. In the extension 6 months, eyes in the ranibizumab arm could receive ranibizumab as required. Eyes in the dexamethasone arm could receive 1 further dexamethasone implant in the extension 6 month period. 'Mean average change in best‐corrected visual acuity (BCVA) was significantly better for ranibizumab than dexamethasone (P = 0.0249).' Also, "elevated intraocular pressure (IOP) was more frequent with dexamethasone than ranibizumab treatment." | |
| 18 eyes with MO secondary to BRVO (of at least 3 months duration) were randomised to receive either IVB (n = 9) at baseline, month 1 and month 2 or (n = 9) IVB at baseline, month 1 and month 2 with grid laser photocoagulation after the second injection. | Both groups demonstrated a mean improvement in BCVA and CMT at 12 months, however the combination groups required fewer IVB injections; (median of 4 ± 1.1 for IVB alone versus 3 ± 0.4 in the combination group) (P = 0.03). | |
| Non‐randomised case series in CRVO and BRVO. 32 ME cases treated with Ozurdex and 32 ME cases treated with ranibizumab were enrolled, with 26 central (C)RVO and 6 branch (B)RVO participants in each group. The authors compared the results of best‐corrected visual acuity (BCVA), central retinal thickness, number of injections, and intraocular pressure (IOP) at 1, 2, 3, and 6 months after injection. | BCVA in both groups at each follow‐up were significantly increased compared to baseline with no statistical difference between the groups. Ozurdex and ranibizumab successfully reduced CMT at each follow‐up. Both CRVO and BRVO patients had significant between‐group differences in the mean number of injections. Among the CRVO patients, IOP in the Ozurdex group was significantly increased compared to baseline and the ranibizumab group at 1, 2, and 3 months postinjection. | |
| Non‐randomised case series in BRVO. A total of 19 patients (19 eyes) were included in this prospective pilot study. Initially, 8 eyes received three IV bevacizumab (group 1) and 11 received one IV Ozurdex (group 2). All the patients underwent a 1‐, 3‐, 4‐ and 6‐month follow‐up visit. A repeated IV bevacizumab (group 1) or IV Ozurdex (group 2) was proposed at 4 months when necessary. | The mean visual acuity was significantly better 1 month after treatment in group 2, while the mean central macular thickness was also significantly lower in group 2. However, there was no longer any difference between the 2 groups at 3, 4 and 6 months, neither in terms of visual | |
| Non‐randomised combination comparative study in CRVO and BRVO. Fifteen eyes were switched to ranibizumab, 12 to aflibercept, and 10 to dexamethasone. At 3, 6, 9, and 12 months, the outcome measures were visual acuity (VA) and central macular thickness (CMT). | 1 year after the switch, CMT decreased from 430.11 ± 91.21 to 291.86 ± 43.87 μm ( P < 0.001). VA increased in 59.5% of the eyes. No difference between the groups was found in those outcomes at 1 year, but the number of injections varied: 3.30 ± 0.95 for dexamethasone, 6.50 ± 2.11 for aflibercept, and 8.27 ± 2.37 for ranibizumab ( P < 0.001). | |
| Non‐randomised comparative study in BRVO of laser alone or laser with bevacizumab. 19 patients with macular oedema secondary to BRVO were assigned to either the group of 9 patients in combination therapy of laser photocoagulation with intravitreal bevacizumab or the group of 10 patients in the laser photocoagulation therapy. Complete ophthalmologic examinations were performed just before the therapy and at 1 month following the therapy. | Combination therapy of laser photocoagulation and single intravitreal bevacizumab injection resulted in a significantly better visual acuity compared to laser photocoagulation therapy (0.35 versus 0.13 logMAR; P = 0.041) and reduced macular thickness by 120.33 µm versus 71.50 µm (P = 0.277), although this difference was not significant. | |
| In this prospective interventional consecutive case series, previously untreated eyes with perfused MO were enclosed over a period of 16 months for bevacizumab (BEV) and for 29 months for grid laser photocoagulation (GLP). The follow‐up period was 1 year. Patients with persistent MO after 12 months of BEV were offered GLP and vice versa, and were followed up for another 12 months. | Both BEV (23 eyes) and GLP (21 eyes) caused a significant ( P < 0.05) reduction in central retinal thickness (CRT) at 12 months although this was delayed with GLP. However, BEV revealed a significantly better 'best‐corrected visual acuity' (BCVA) compared with GLP (0.2 vs 0.5 logMAR; P < 0.04). Switching therapy for non‐responders revealed a reduced CRT at another 12 months, although this was not significant. | |
| 42 confirmed cases (42 eyes) with macular oedema secondary to BRVO were randomised into 3 groups, each group contained 14 eyes. The ranibizumab group received intravitreal injection of ranibizumab (0.05 mL), the laser group received grid laser photocoagulation, and the combined group received a second therapy of grid laser photocoagulation after 1 wk of the intravitreal injection of ranibizumab. Best‐corrected visual acuity (BCVA) and the central macular thickness (CMT) preoperative and at 1, 3, 6 months after therapy was recorded. | The BCVA and the CMT had no differences among 3 groups pretherapy (P > 0.05). While BCVA was much better and CMT was reduced significantly post‐therapy than pre‐therapy in all 3 groups (P < 0.05). The BCVA and CMT in the ranibizumab group were significantly different in every time point (1, 3, 6 months) (P < 0.05). The BCVA declined and the CMT was thicker as time went on. In the laser group and the combined group, BCVA and CMT had little differences at different time points (P > 0.05); while the BCVA was better and the CMT was thinner in the combined group than ranibizumab group and laser group at every time point (P < 0.05). At 3 and 6 months, the BCVA was better and the CMT was thinner in laser group than ranibizumab group (P < 0.05). | |
| A 25‐health‐state Markov model considering ranges of visual acuity in both eyes was developed. Patients had a confirmed diagnosis of macular oedema secondary to BRVO and had best‐corrected visual acuity (BCVA) at baseline between 25 and 73 letters. The evaluation compared IVT‐AFL 2 mg with ranibizumab 0.5 mg: the frequency of injections and monitoring were identical for both treatments, taken from randomised trials and a physician survey. A systematic review and indirect comparison were conducted to determine the probabilities of gaining at least 15 BCVA letters from baseline to 6 months; BCVA was then extrapolated over time to determine costs and outcomes. Utilities were taken from published literature and costs were estimated from a UK payer perspective. Published drug prices were discounted to reflect patient access schemes. Costs and benefits were discounted at 3.5%. | The indirect comparison found that IVT‐AFL was associated with a small numerical advantage in the likelihood of gaining 15 BCVA letters, compared with ranibizumab (median odds ratio = 1.08, 95% Cl 0.43 to 2.56). IVT‐AFL was associated with a higher number of QALYs (0.045) per patient than ranibizumab. Both treatments are available to the National Health Service under confidential patient access schemes. Cost effectiveness was estimated for a range of possible discounts for each treatment. At price parity, IVT‐AFL reduces cost by GBP 4 per patient and was a dominant therapy. Results were sensitive to the unit cost of the drugs used, to comparative efficacy and number of injections for both treatments. | |
| In this prospective, randomised, non‐inferiority trial, 75 participants with macular oedema due to BRVO received intravitreal injections of ranibizumab (IVR) or bevacizumab (IVB) after 1:1 block randomisation. The primary outcome measure was the difference in mean changes in best‐corrected visual acuity (BCVA) at 6 months. Secondary outcome measures included mean change in central retinal thickness (CRT), the proportion of patients improving by > 15 letters and the proportion of patients developing neovascularisation. | Participants received either IVR (n = 37) or IVB (n = 38). The mean BCVA at baseline was 52.8 ± 14.4 letters (20/80) and 56.1 ± 10.0 letters (20/80) (P = 0.24) in the ranibizumab and bevacizumab groups, respectively. At 6 months, the mean gains in BCVA were +18.1 letters (95% CI +12.8 to +22.6; P < 0.0001) in the ranibizumab group and +15.6 letters (95% CI +12.0 to +20.5; P < 0.0001) in the bevacizumab group. The difference between the mean visual gains of the treated groups (bevacizumab–ranibizumab) was −2.5 letters (95% CI −8.0 to +5.0; P = 0.74). Mean reductions in CRT at 6 months were 177.1 ± 122.3 mm in the ranibizumab group (P < 0.0001) and 201.7 ± 166.2 mm in the bevacizumab group ( P < 0.0001), with no significant difference between the 2 groups (P = 0.48). The mean numbers of ranibizumab and bevacizumab injections were 3.2 ± 1.5 and 3.0 ± 1.4, respectively (P = 0.55). 2 serious adverse events occurred in the ranibizumab group and 1 in the bevacizumab group but both were unrelated to intravitreal injections. | |
| This was a prospective, randomised, interventional comparative study conducted in 45 eyes with ME secondary to BRVO who were treated primarily with IVB 1.25 mg (23 eyes, IVB group) or combination therapy of IVB 1.25 mg with a single simultaneous STA 40 mg (18 eyes, IVB/STA group). Re‐injections were performed with IVB if optical coherence tomography (OCT) showed recurrent ME associated with decreased visual acuity. The main outcome measurement was the number of additional IVB injections, and changes of best‐corrected visual acuity (BCVA) and central macular thickness (CMT) during a 6‐month follow‐up period were compared. | BCVA showed significant improvement in 2 groups at 6 months. In addition, CMT showed significant decrease in 2 groups at 6 months. No significant differences in the change of BCVA and CMT at 6 months after injection (P = 0.973, P = 0.639) were observed between the 2 groups. A statistically significant difference was found regarding the number of additional IVB injections (IVB group 0.96 ± 0.83; IVB/STA group 0.44 ± 0.70, P = 0.034). | |
| 81 eyes with acute (< 3 months) BRVO were randomly assigned to receive either 2 injections of 1.25 mg bevacizumab 6 weeks apart or sham injections. Follow‐up results were reported at 6 weeks and 12 weeks. | After week 6, visual improvements in the bevacizumab treated group were significantly better than the sham group. At 12 weeks there was no significant difference. There was a significant reduction in CMT both at 6 and at 12 weeks. | |
| In this randomised clinical trial, 86 eyes with recent onset (< 12 weeks) CRVO were assigned to 2 groups: bevacizumab (IVB) group (43 eyes) that received 3 monthly injections of 1.25 mg of IVB, and triamcinolone (IVT) group (43 eyes) that received 2 injections of 2 mg IVT 2 months apart. Outcomes were best‐corrected visual acuity (BCVA), central macular thickness (CMT), and intraocular pressure (IOP) changes. | Mean BCVA improved significantly at 6 months in both groups; from 0.87 ± 0.49 to 0.41 ± 0.35 logMAR in IVB group, and from 0.81 ± 0.45 to 0.62 ± 0.48 logMAR in IVT group (P < 0.001). However, between‐group differences reach a significant level at months 4 (P = 0.003) and 6 (P < 0.001) in favour of the IVB group. In terms of CMT reduction, the difference between the groups was statistically significant (P = 0.002) at month 6. Significant differences were noted more in the ischaemic cases in favour of the IVB group. Mean IOP rise was significantly higher in the IVT group at all visits. | |
| A Bayesian network meta‐analysis of RCTs of treatments for macular oedema secondary to BRVO. Interventions: ranibizumab 0.5 mg when necessary, aflibercept 2 mg monthly, dexamethasone 0.7 mg implant, laser photocoagulation, ranibizumab + laser, or sham intervention. Bevacizumab and triamcinolone were excluded. | 8 RCTs were identified for inclusion with 1743 adult patients. The probability of being the most efficacious treatment at month 6 or 12 based on letters gained was 54% for ranibizumab monotherapy, 30% for aflibercept, 16% for ranibizumab plus laser (adjunctive or prompt), and 0% for dexamethasone implant, laser or sham. The probability of being the most efficacious treatment for patients gaining ≥15 letters was 39% for aflibercept, 35% for ranibizumab monotherapy, 24% for ranibizumab plus laser, 2% for dexamethasone implant, and less than 1% for laser or sham. There was no statistical difference between ranibizumab monotherapy and aflibercept for letters gained (+1.4 letters for ranibizumab vs aflibercept with 95% credible interval (CrI) of −5.2 to +8.5 letters) or the OR for gaining ≥15 letters: 1.06 (95% CrI 0.16 to 8.94)). Dexamethasone implant was associated with significantly higher IOP/OH than antivascular endothelial growth factor agents (OR 13.1 (95% CrI 1.7 to 116.9)). | |
| A quasi‐RCT of 30 eyes in 30 patients in a single centre in Italy. 15 eyes received bevacizumab whilst 15 eyes received laser treatment. Follow‐up was for 12 months. | The laser arm showed improvement in VA of 0.21 and 0.20 logMAR at 6 and 12 months, respectively. The bevacizumab arm showed mean VA improvement at 6 and 12 months of 0.30 and 0.31, respectively (P < 0.05). CRT decreased by 42% in the laser arm and 60.3% in the bevacizumab arm at 12 months (P < 0.05). | |
| Participants received monthly injections of 0.5 mg ranibizumab for 7 months and those meeting | There was no significant difference in the slope of change in BCVA between months 7 and 15 in patients treated 'as needed' versus those treated with monthly injections (P = 0.509). Mean (standard deviation) change from baseline BCVA in Early Treatment Diabetic Retinopathy Study letter score at month 15 was 21.0 ± 14.1 in the PRN group (n = 82) versus 18.7 ± 14.1 in the monthly group (n = 80) and 14.5 ± 14.7 in NR participants (n = 13). The percentage of participants who achieved BCVA 20/40 at month 15 was 76.8% in the PRN group, 71.3% in the monthly group, and 46.2% in NR participants. The mean (standard deviation) change from baseline central subfield thickness was 247.8 ± 207.5 mm in the PRN group, 289.9 ± 177.2 mm in the monthly group, and 93.2 ± 225.2 mm in NR participants. There were no significant differences in mean BCVA gains or central subfield thickness reductions at month 15 between the PRN and monthly injection groups (all > 0.05). | |
| A study to investigate whether targeted retinal photocoagulation (TRP) of peripheral non‐perfused areas (NPAs) could prevent the recurrence of macular oedema (ME) due to branch retinal vein occlusion (BRVO) after intravitreal bevacizumab injection (IVB). Eyes received 1.25 mg IVB only (IVB group) or combined with TRP (IVB + TRP group) of NPAs, more than 5 disc areas identified by fluorescein angiography in the patients with ME secondary to BRVO. Best‐corrected visual acuity (BCVA) and central retinal thickness (CRT) determined by optical coherence tomography were measured every month for 6 months. | 38 patients were enrolled and randomised to IVB group (n = 19) and IVB + TRP group (n = 19). Both groups showed similar thinning in CRT at 1 week after IVB. The IVB + TRP group maintained thinner CRT at 2 (P = 0.0072) and 3 (P = 0.0086) months compared with IVB group. However, the difference in CRT became insignificant at 4, 5 and 6 months. The number of reinjections (± standard deviation) in IVB group (1.58 ±0.69) was significantly greater (P = 0.0025) than that in IVB + TRP group (0.83±0.62). BCVA significantly improved at 6 month in IVB + TRP group (P = 0.015), but not in IVB group. | |
| 20 eyes were randomised 3:1 to intravitreous injections of pegaptanib 0.3 or 1 mg at baseline and at weeks 6 and 12 with subsequent injections at 6‐week intervals at investigator discretion until week 48. Principal efficacy outcomes were change from baseline to week 54. | Results were similar in both dosage groups. Mean BCVA improved 14 letters and mean CMT decreased by 205 microns. | |
| 30 eyes of 30 patients with BRVO were randomised into 3 groups: group 1 (10 eyes) received grid laser treatment alone, group 2 received a single dose of intravitreal injection of ranibizumab (0.05 mL/0.5 mg) followed by grid laser treatment 7 days following injection. Group 3 (10 eyes) received 3 loading doses of intravitreal ranibizumab with grid laser treatment 7 days after the first injection. After 6 months follow‐up, the best‐corrected visual acuity and optical coherence tomography (OCT) and central macular thickness were observed. | After 6 months, the visual acuity of patients was improved significantly. There was an average increase of 11 letters, 17 letters and 18 letters in group 1, 2, and 3 respectively, with the average decrease in OCT being 208.7 mum, 312.9 mum and 326.8 mum, respectively, in these groups. Gain in visual acuity more than 3 lines was 1 case (10%) in group 1. There were 3 cases (30%) in group 2 and 4 cases (40%) in group 3. | |
| BCVA: best‐corrected visual acuity; BRVO: branch retinal vein occlusion; CMT: central macular thickness; CRVO: central retinal vein occlusion; IVB: intravitreal bevacizumab; MO: macular oedema; OCT: optical coherence tomography | ||
| Outcome or subgroup title | No. of studies | No. of participants | Statistical method | Effect size |
| 1.1 Gain of 15 letters or more at 6 months Show forest plot | 1 | Risk Ratio (M‐H, Fixed, 95% CI) | Totals not selected | |
| 1.2 Mean VA change at 6 months Show forest plot | 1 | Mean Difference (IV, Fixed, 95% CI) | Totals not selected | |
| 1.3 Loss of 15 letters or more at 6 months Show forest plot | 1 | Risk Ratio (M‐H, Fixed, 95% CI) | Totals not selected | |
| 1.4 Mean CRT change at 6 months Show forest plot | 1 | Mean Difference (IV, Fixed, 95% CI) | Totals not selected | |
| 1.5 Cataract Show forest plot | 1 | Risk Ratio (M‐H, Fixed, 95% CI) | Totals not selected | |
| 1.6 Raised IOP Show forest plot | 1 | Risk Ratio (M‐H, Fixed, 95% CI) | Totals not selected | |
| 1.7 APTC events Show forest plot | 1 | Risk Ratio (M‐H, Fixed, 95% CI) | Totals not selected | |
| 1.8 Quality of life change Show forest plot | 1 | Mean Difference (IV, Fixed, 95% CI) | Totals not selected | |
| 1.8.1 6 months | 1 | Mean Difference (IV, Fixed, 95% CI) | Totals not selected | |
| 1.8.2 12 months | 1 | Mean Difference (IV, Fixed, 95% CI) | Totals not selected | |
| Outcome or subgroup title | No. of studies | No. of participants | Statistical method | Effect size |
| 2.1 Gain of 15 letters or more at 6 months Show forest plot | 2 | 201 | Risk Ratio (M‐H, Fixed, 95% CI) | 2.09 [1.44, 3.05] |
| 2.2 Mean VA change at 6 months Show forest plot | 3 | 473 | Mean Difference (IV, Fixed, 95% CI) | 9.63 [7.23, 12.03] |
| 2.3 Mean CRT change at 6 months Show forest plot | 2 | 201 | Mean Difference (IV, Fixed, 95% CI) | ‐147.47 [‐200.19, ‐94.75] |
| 2.4 Cataract Show forest plot | 2 | Risk Ratio (M‐H, Fixed, 95% CI) | Totals not selected | |
| 2.5 APTC events Show forest plot | 3 | 476 | Risk Ratio (M‐H, Fixed, 95% CI) | 0.99 [0.15, 6.78] |
| Outcome or subgroup title | No. of studies | No. of participants | Statistical method | Effect size |
| 3.1 Gain of 15 letters or more at 6 months Show forest plot | 2 | 330 | Risk Ratio (M‐H, Fixed, 95% CI) | 1.67 [1.33, 2.10] |
| 3.2 Gain of 15 letters or more at 12 months Show forest plot | 1 | Risk Ratio (M‐H, Fixed, 95% CI) | Totals not selected | |
| 3.3 Mean VA change at 6 months Show forest plot | 2 | 330 | Mean Difference (IV, Fixed, 95% CI) | 8.22 [5.69, 10.76] |
| 3.4 Mean VA change at 12 months Show forest plot | 2 | 343 | Mean Difference (IV, Fixed, 95% CI) | 9.15 [6.32, 11.97] |
| 3.5 Mean CRT change at 6 months Show forest plot | 2 | 330 | Mean Difference (IV, Fixed, 95% CI) | ‐66.79 [‐94.69, ‐38.90] |
| 3.6 Mean CRT change at 12 months Show forest plot | 2 | 343 | Mean Difference (IV, Fixed, 95% CI) | ‐26.92 [‐65.88, 12.04] |
| 3.7 Quality of life change at 12 months Show forest plot | 1 | Mean Difference (IV, Fixed, 95% CI) | Totals not selected | |
| 3.8 Cataract Show forest plot | 3 | 637 | Risk Ratio (M‐H, Fixed, 95% CI) | 0.12 [0.04, 0.32] |
| 3.9 Raised IOP Show forest plot | 4 | 673 | Risk Ratio (M‐H, Fixed, 95% CI) | 0.25 [0.16, 0.40] |
| 3.10 APTC events Show forest plot | 3 | 587 | Risk Ratio (M‐H, Fixed, 95% CI) | 3.02 [0.12, 73.55] |
| 3.11 Endophthalmitis Show forest plot | 3 | 366 | Risk Ratio (M‐H, Fixed, 95% CI) | Not estimable |