| 1 Patients' perception of change in incontinence ‐ not cured Show forest plot | 3 | | Risk Ratio (M‐H, Fixed, 95% CI) | Subtotals only |
|
| 1.1 Additional group supervision (with no difference in PFMT) | 2 | 111 | Risk Ratio (M‐H, Fixed, 95% CI) | 0.89 [0.78, 1.03] |
| 1.2 Additional phone calls (with no difference in PFMT) | 0 | 0 | Risk Ratio (M‐H, Fixed, 95% CI) | 0.0 [0.0, 0.0] |
| 1.3 Individual supervision versus no supervision (with differences in PFMT) | 1 | 64 | Risk Ratio (M‐H, Fixed, 95% CI) | 0.86 [0.73, 1.02] |
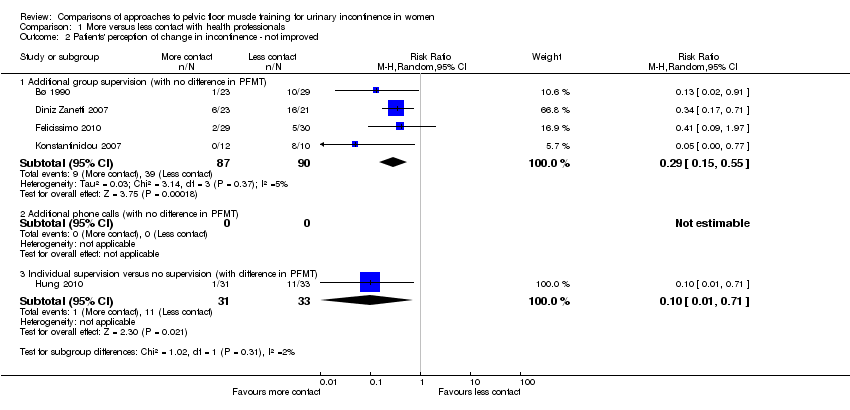
| 2 Patients' perception of change in incontinence ‐ not improved Show forest plot | 5 | | Risk Ratio (M‐H, Random, 95% CI) | Subtotals only |
|
| 2.1 Additional group supervision (with no difference in PFMT) | 4 | 177 | Risk Ratio (M‐H, Random, 95% CI) | 0.29 [0.15, 0.55] |
| 2.2 Additional phone calls (with no difference in PFMT) | 0 | 0 | Risk Ratio (M‐H, Random, 95% CI) | 0.0 [0.0, 0.0] |
| 2.3 Individual supervision versus no supervision (with difference in PFMT) | 1 | 64 | Risk Ratio (M‐H, Random, 95% CI) | 0.10 [0.01, 0.71] |
| 3 Incontinence specific quality of life Show forest plot | | | Other data | No numeric data |
|
| 3.1 Additional group supervision (with no difference in PFMT) | | | Other data | No numeric data |
| 3.2 Additional phone calls (with no difference in PFMT) | | | Other data | No numeric data |
| 3.3 Individual supervision versus no supervision (difference in PFMT) | | | Other data | No numeric data |
| 4 Symptom impact Show forest plot | | | Other data | No numeric data |
|
| 4.1 Additional group supervision (with no difference in PFMT) | | | Other data | No numeric data |
| 4.2 Additional phone calls (with no difference in PFMT) | | | Other data | No numeric data |
| 4.3 Individual supervision versus no supervision (difference in PFMT) | | | Other data | No numeric data |
| 5 Frequency of leakage ‐ leakage episodes in 24 hours Show forest plot | 1 | 22 | Mean Difference (IV, Fixed, 95% CI) | ‐1.38 [‐2.04, ‐0.72] |
|
| 5.1 Additional group supervision (with no difference in PFMT) | 1 | 22 | Mean Difference (IV, Fixed, 95% CI) | ‐1.38 [‐2.04, ‐0.72] |
| 5.2 Additional phone calls (with no difference in PFMT) | 0 | 0 | Mean Difference (IV, Fixed, 95% CI) | 0.0 [0.0, 0.0] |
| 5.3 Individual supervision versus no supervision (with difference in PFMT) | 0 | 0 | Mean Difference (IV, Fixed, 95% CI) | 0.0 [0.0, 0.0] |
| 6 Frequency of leakage ‐ other measures Show forest plot | | | Other data | No numeric data |
|
| 6.1 Additional group supervision (with no difference in PFMT) | | | Other data | No numeric data |
| 6.2 Additional phone calls (with no difference in PFMT) | | | Other data | No numeric data |
| 6.3 Individual supervision versus no supervision (with difference in PFMT) | | | Other data | No numeric data |
| 7 Amount of leakage ‐ pad, paper towel and cough tests Show forest plot | | | Other data | No numeric data |
|
| 7.1 Additional group supervision (with no difference in PFMT) | | | Other data | No numeric data |
| 7.2 Additional phone calls (with no difference in PFMT) | | | Other data | No numeric data |
| 7.3 Individual versus no supervision (with difference in PFMT) | | | Other data | No numeric data |
| 8 Amount of leakage ‐ other measures Show forest plot | | | Other data | No numeric data |
|
| 8.1 Additional group supervision (with no difference in PFMT) | | | Other data | No numeric data |
| 8.2 Additional phone calls (with no difference in PFMT) | | | Other data | No numeric data |
| 8.3 Individualised versus no supervision (with difference in PFMT) | | | Other data | No numeric data |
| 9 Voiding frequency Show forest plot | | | Other data | No numeric data |
|
| 9.1 Additional group supervision (with no difference in PFMT) | | | Other data | No numeric data |
| 9.2 Additional phone calls (with no difference in PFMT) | | | Other data | No numeric data |
| 9.3 Individual versus no supervision (with difference in PFMT) | | | Other data | No numeric data |
| 10 PFM performance Show forest plot | | | Other data | No numeric data |
|
| 10.1 Additional group supervision (with no difference in PFMT) | | | Other data | No numeric data |
| 10.2 More individual contact versus less individual contact (with no difference in PFMT) | | | Other data | No numeric data |
| 10.3 Individual versus no supervision (with difference in PFMT) | | | Other data | No numeric data |
| 11 Treatment adherence Show forest plot | | | Other data | No numeric data |
|
| 11.1 Additional group supervision (with no difference in PFMT) | | | Other data | No numeric data |
| 11.2 Additional phone calls (with no difference in PFMT) | | | Other data | No numeric data |
| 11.3 Individual versus no supervision (with difference in PFMT) | | | Other data | No numeric data |
| 12 Follow‐up data Show forest plot | | | Other data | No numeric data |
|
| 12.1 Additional group supervision (with no difference in PFMT) | | | Other data | No numeric data |
| 12.2 Additional phone calls (with no difference in PFMT) | | | Other data | No numeric data |
| 12.3 Individual versus no supervision (with difference in PFMT) | | | Other data | No numeric data |