Bupropión para el trastorno de déficit de atención e hiperactividad (TDAH) en adultos
Información
- DOI:
- https://doi.org/10.1002/14651858.CD009504.pub2Copiar DOI

- Base de datos:
-
- Cochrane Database of Systematic Reviews
- Versión publicada:
-
- 02 octubre 2017see what's new
- Tipo:
-
- Intervention
- Etapa:
-
- Review
- Grupo Editorial Cochrane:
-
Grupo Cochrane de Problemas de desarrollo, psicosociales y de aprendizaje
- Copyright:
-
- Copyright © 2017 The Cochrane Collaboration. Published by John Wiley & Sons, Ltd.
Cifras del artículo
Altmetric:
Citado por:
Autores
Contributions of authors
Wim Verbeeck: first review author, led all stages of the review and is the guarantor for the review.
Geertruida E Bekkering: second review author, provided methodological and statistical support.
Wim Van den Noortgate: third review author, contributed methodological and statistical support.
Cornelis Kramers: fourth review author, contributed to the final draft of the manuscript.
Sources of support
Internal sources
-
CEBAM, Cochrane Belgium, Leuven, Belgium.
Salary for Geertruida E Bekkering
-
Department of Pharmacology and Toxicology, Radboud University Medical Centre, Nijmegen, Netherlands.
Salary for Cornelis Kramers
-
Vincent van Gogh Institute for Psychiatry, Centre for Autism and ADHD, Venray, Netherlands.
Salary for Wim Verbeeck
-
Faculty of Psychology and Educational Sciences, Katholieke Universiteit Leuven, Leuven, Belgium.
Salary for Wim Van den Noortgate
External sources
-
None, Other.
Declarations of interest
Wim Verbeeck ‐ none known.
Geertruida E Bekkering ‐ none known.
Wim Van den Noortgate ‐ none known.
Cornelis Kramers ‐ none known.
Acknowledgements
We acknowledge, with gratitude, the comments of Professor Geraldine Macdonald, Co‐ordinating Editor of the Cochrane Developmental, Psychosocial and Learning Problems Group (CDPLPG), and the assistance of Laura MacDonald (former Managing Editor), Margaret Anderson (Information Specialist), Dr Joanne Wilson (Managing Editor), and Gemma O'Loughlin (Assistant Managing Editor) in the development of this review.
Version history
| Published | Title | Stage | Authors | Version |
| 2017 Oct 02 | Bupropion for attention deficit hyperactivity disorder (ADHD) in adults | Review | Wim Verbeeck, Geertruida E Bekkering, Wim Van den Noortgate, Cornelis Kramers | |
| 2011 Dec 07 | Bupropion for Attention Deficit Hyperactivity Disorder (ADHD) in adults | Protocol | Wim Verbeeck, Geertruida E Bekkering, Wim Van den Noortgate | |
Differences between protocol and review
Please also see our protocol (Verbeeck 2011), and Table 1.
-
Methods. Data collection and analysis. 'Summary of findings' table. At the request of the editorial base, we added a new section on the ''Summary of findings' table', beneath Data synthesis in the Methods section.
-
Methods. Data collection and analysis. Sensitivity analysis. We performed an additional post hoc sensitivity analysis in which we assessed the impact of choosing the fixed‐effect model for our meta‐analyses. By examining the results of both the fixed‐effect and the random‐effects models, we attempted to evaluate the impact of the clinical heterogeneity, and have more balanced weights for all trials in the meta‐analysis.
-
Results. Effects of interventions. Other adverse effect outcomes. As adverse events were sparsely reported in the studies, we added post hoc analyses on the retention rate, the number of participants that lowered their dose due to adverse events, and the number of participants with at least one adverse event.
Keywords
MeSH
Medical Subject Headings (MeSH) Keywords
- Attention Deficit Disorder with Hyperactivity [*drug therapy];
- Bupropion [administration & dosage, adverse effects, *therapeutic use];
- Central Nervous System Stimulants [administration & dosage, adverse effects, *therapeutic use];
- Delayed‐Action Preparations;
- Off‐Label Use;
- Patient Dropouts [statistics & numerical data];
- Randomized Controlled Trials as Topic;
- Severity of Illness Index;
- Treatment Outcome;
Medical Subject Headings Check Words
Adult; Female; Humans; Male;
PICO

Study flow diagram.

Risk of bias summary: review authors' judgements about each risk of bias item for each included study
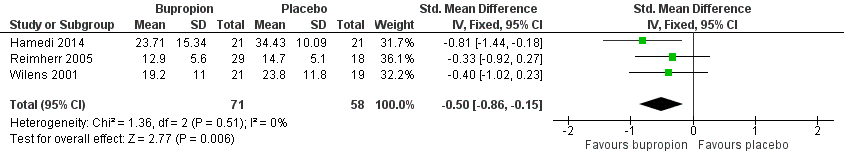
Forest plot of comparison: 1 Bupropion versus placebo, outcome: 1.1 Severity of ADHD (at study completion).

Forest plot of comparison: 1 Bupropion vs placebo, outcome: 1.1 Achievement of significant clinical improvement (% participants).
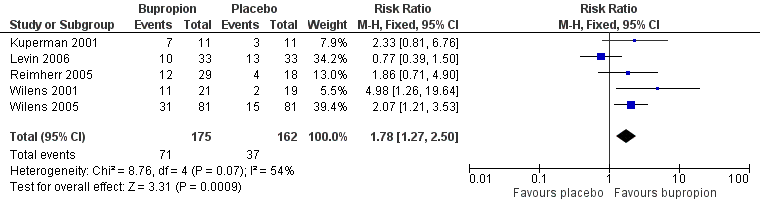
Forest plot of comparison: 1 Bupropion vs placebo, outcome: 1.3 Clinical Global Impression (CGI) ‐ improvement scale (% participants achieving at least 1 or 2 on CGI).
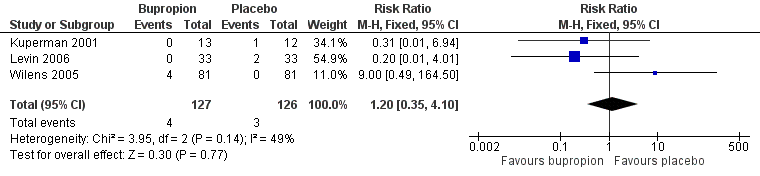
Forest plot of comparison: 1 Bupropion versus placebo, outcome: 1.4 Number of participants withdrawn due to adverse events.

Comparison 1 Bupropion versus placebo, Outcome 1 Severity of ADHD (at study completion).

Comparison 1 Bupropion versus placebo, Outcome 2 Achievement of significant clinical improvement (% participants).

Comparison 1 Bupropion versus placebo, Outcome 3 Clinical Global Impression (CGI) ‐ Improvement scale (% participants achieving at least one or two on CGI).

Comparison 1 Bupropion versus placebo, Outcome 4 Number of participants withdrawn due to adverse events.

Comparison 1 Bupropion versus placebo, Outcome 5 Depressive symptoms (change from baseline to study completion).
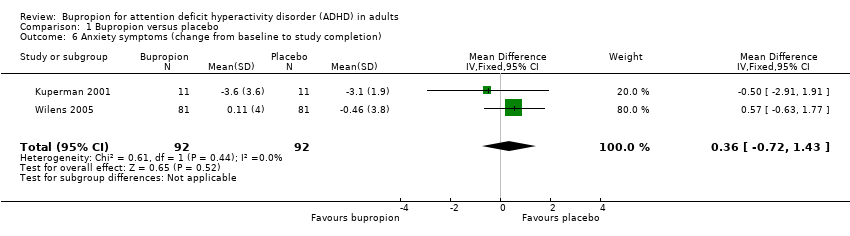
Comparison 1 Bupropion versus placebo, Outcome 6 Anxiety symptoms (change from baseline to study completion).
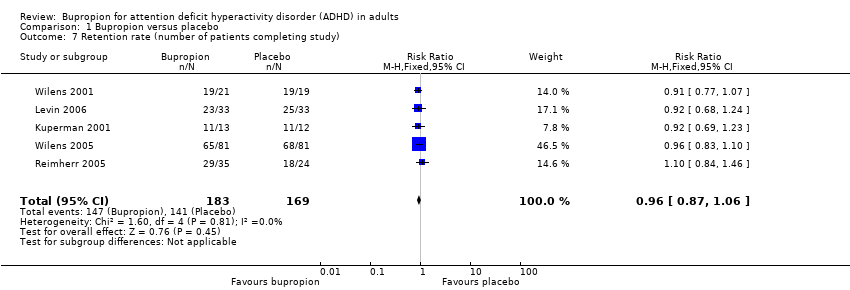
Comparison 1 Bupropion versus placebo, Outcome 7 Retention rate (number of patients completing study).

Comparison 1 Bupropion versus placebo, Outcome 8 Number of participants that lowered their dose due to adverse events.

Comparison 1 Bupropion versus placebo, Outcome 9 Number of participants with at least one adverse event.

Comparison 2 Bupropion versus placebo (sensitivity analyses), Outcome 1 Severity of ADHD (at study completion) ‐ clinician rated.

Comparison 2 Bupropion versus placebo (sensitivity analyses), Outcome 2 Severity if ADHD (at study completion) ‐ studies that exclude psychiatric comorbidity.

Comparison 2 Bupropion versus placebo (sensitivity analyses), Outcome 3 Achievement of significant clinical improvement (% participants) ‐ studies that exclude psychiatric comorbidity.

Comparison 2 Bupropion versus placebo (sensitivity analyses), Outcome 4 CGI ‐ Improvement (% participants achieving at least one or two on CGI) ‐ studies that exclude psychiatric comorbidity.

Comparison 2 Bupropion versus placebo (sensitivity analyses), Outcome 5 Number of participants withdrawn due to adverse events ‐ studies that exclude psychiatric comorbidity.
| Bupropion compared with placebo for adult ADHD | |||||
| Participant or population: Adults with ADHD Settings: Ambulant care Intervention: Bupropion Comparison: Placebo | |||||
| Outcomes | Illustrative comparative risks* (95% CI) | Relative effect | Number of participants | Quality of the evidence | |
| Assumed risk | Corresponding risk | ||||
| Placebo | Bupropion | ||||
| Severity of ADHD (at study completion) WRAADDS scale (0 to 28), ADHD‐RS scale (0 to 54) or CAARS scale (0 to 48). On all scales, a higher score equates to more symptoms (at 6 weeks) | The mean score for severity of ADHD ranged across control groups from 14.70 (WRAADDS) to 23.80 (ADHD‐RS) and 34.43 (CAARS) | The standardised mean score for severity of ADHD in the intervention groups was on average 0.50 lower (0.86 lower to 0.15 lower) | ‐ | 129 | ⊕⊕⊝⊝ |
| Achievement of significant clinical improvement (% participants) (at 6 to 10 weeks) | 212 per 1000 | 318 per 1000 | RR 1.50 (1.13 to 1.99) | 315 | ⊕⊕⊝⊝ |
| CGI ‐ Improvement scale (% participants achieving at least 1 or 2 on CGI) (at 6 to 10 weeks) | 222 per 1000 | 395 per 1000 (from 282 to 555) | RR 1.78 (1.27 to 2.50) | 337 | ⊕⊕⊝⊝ |
| Number of participants withdrawn due to adverse events (at 6 to 10 weeks) | 61 per 1000 | 73 per 1000 | RR 1.20 (0.35 to 4.10) | 253 | ⊕⊕⊝⊝ |
| *The basis for the assumed risk was the median control group risk across studies. The corresponding risk (and its 95% CI) is based on the assumed risk in the comparison group and the relative effect of the intervention (and its 95% CI). | |||||
| GRADE Working Group grades of evidence | |||||
| 1Downgraded by one level due to limitations in study design. Most quality items were poorly reported. | |||||
| Topic | Method |
| Unit of analysis issues | Cross‐over trials We will include cross‐over trials. Given the risk of carry‐over effects, we will use data from the first period (before cross‐over) only, and treat these as parallel‐group trials. |
| Assessment of reporting biases | We will produce funnel plots (estimated treatment effects against their standard error). We will test funnel plot asymmetry when there are at least 10 studies included in the meta‐analysis. Asymmetry could be due to publication bias, but could also be due to a relationship between trial size and effect size. In the event that we find a relationship, we will examine the clinical diversity of the studies, selection biases and poor methodological quality as alternative explanations to publication bias. |
| Subgroup analysis and investigation of heterogeneity | We will perform two subgroup analyses:
When there are more than 10 studies included in the analyses, we will investigate statistical heterogeneity using meta‐regression (Deeks 2011). |
| Multiple time points | We will classify outcomes of all studies based on time of measurement from randomisation: acute (less than 24 hours), short‐term (less than six weeks), medium‐term (six weeks to six months), and long‐term (more than six months). Within each time period, we will include the latest outcome in the meta‐analysis. |
| Sensitivity analysis | We will conduct sensitivity analyses to determine whether findings are sensitive to restricting the analyses to studies judged to be at low risk of bias. In these analyses, we will restrict the analysis to the following:
|
| Study ID | Outcome/scale | Results for bupropion | Results for placebo (P value for difference between groups) |
| Self‐rated ADHD symptoms | ‐13.7 (SD 6.9) | ‐12.4 (SD 10.6) (P = 0.69) | |
| Global level of functioning | Mean final value at study completion 57.5 (SD 8.1) | Mean final value at study completion 56.2 (SD 3.6) (P > 0.05) | |
| ADHD Symptom Checklist (DuPaul 1990) | Mean difference from baseline ‐12.7 | Mean difference ‐6.9 (P < 0.001) | |
| Global level of functioning | Mean change from baseline 7.3 (SD 10.4) | 4.0 (SD 8.0) (P = 0.035) | |
| ADHD: attention deficit hyperactivity disorder | |||
| Outcome | Fixed‐effect model | Studies excluding psychiatric comorbidity (fixed‐effect model) | Random‐effects model | Studies using clinician‐rated scales (fixed‐effect model) |
| Severity of ADHD symptoms | SMD ‐0.50 (95% CI ‐0.86 to ‐0.15), 129 participants | SMD ‐0.55 (95% CI ‐0.98 to ‐0.12), 89 participants | SMD ‐0.50 (95% CI ‐0.86 to ‐0.15), 129 participants | SMD ‐0.36 (95% CI ‐0.79 to 0.07), 87 participants |
| Proportion with significant clinical improvement | RR 1.50 (95% CI 1.13 to 1.99), 315 participants | RR 1.58 (95% CI 1.06 to 2.35), 209 participants | RR 1.48 (95% CI 1.05 to 2.11), 315 participants | N/A |
| Proportion with at least 1 or 2 on CGI | RR 1.78 (95% CI 1.27 to 2.50), 337 participants | RR 2.06 (95% CI 1.34 to 3.16), 231 participants | RR 1.79 (95% CI 1.02 to 3.14), 337 participants | N/A |
| Adverse events: number of patients withdrawn | RR 1.20 (95% CI 0.35 to 4.10), 253 participants | RR 2.42 (95% CI 0.49 to 12.01), 187 participants | RR 0.85 (95% CI 0.07 to 9.77), 253 participants | N/A |
| ADHD: attention deficit hyperactivity disorder | ||||
| Outcome or subgroup title | No. of studies | No. of participants | Statistical method | Effect size |
| 1 Severity of ADHD (at study completion) Show forest plot | 3 | 129 | Std. Mean Difference (IV, Fixed, 95% CI) | ‐0.50 [‐0.86, ‐0.15] |
| 2 Achievement of significant clinical improvement (% participants) Show forest plot | 4 | 315 | Risk Ratio (M‐H, Fixed, 95% CI) | 1.50 [1.13, 1.99] |
| 3 Clinical Global Impression (CGI) ‐ Improvement scale (% participants achieving at least one or two on CGI) Show forest plot | 5 | 337 | Risk Ratio (M‐H, Fixed, 95% CI) | 1.78 [1.27, 2.50] |
| 4 Number of participants withdrawn due to adverse events Show forest plot | 3 | 253 | Risk Ratio (M‐H, Fixed, 95% CI) | 1.20 [0.35, 4.10] |
| 5 Depressive symptoms (change from baseline to study completion) Show forest plot | 2 | 184 | Mean Difference (IV, Fixed, 95% CI) | 0.52 [‐0.46, 1.51] |
| 6 Anxiety symptoms (change from baseline to study completion) Show forest plot | 2 | 184 | Mean Difference (IV, Fixed, 95% CI) | 0.36 [‐0.72, 1.43] |
| 7 Retention rate (number of patients completing study) Show forest plot | 5 | 352 | Risk Ratio (M‐H, Fixed, 95% CI) | 0.96 [0.87, 1.06] |
| 8 Number of participants that lowered their dose due to adverse events Show forest plot | 2 | 104 | Risk Ratio (M‐H, Fixed, 95% CI) | 1.86 [0.57, 6.10] |
| 9 Number of participants with at least one adverse event Show forest plot | 3 | 227 | Risk Ratio (M‐H, Fixed, 95% CI) | 1.14 [0.95, 1.37] |
| Outcome or subgroup title | No. of studies | No. of participants | Statistical method | Effect size |
| 1 Severity of ADHD (at study completion) ‐ clinician rated Show forest plot | 2 | 87 | Std. Mean Difference (IV, Fixed, 95% CI) | ‐0.36 [‐0.79, 0.07] |
| 2 Severity if ADHD (at study completion) ‐ studies that exclude psychiatric comorbidity Show forest plot | 2 | 89 | Std. Mean Difference (IV, Fixed, 95% CI) | ‐0.55 [‐0.98, ‐0.12] |
| 3 Achievement of significant clinical improvement (% participants) ‐ studies that exclude psychiatric comorbidity Show forest plot | 2 | 209 | Risk Ratio (M‐H, Fixed, 95% CI) | 1.58 [1.06, 2.35] |
| 4 CGI ‐ Improvement (% participants achieving at least one or two on CGI) ‐ studies that exclude psychiatric comorbidity Show forest plot | 3 | 231 | Risk Ratio (M‐H, Fixed, 95% CI) | 2.06 [1.34, 3.16] |
| 5 Number of participants withdrawn due to adverse events ‐ studies that exclude psychiatric comorbidity Show forest plot | 2 | 187 | Risk Ratio (M‐H, Fixed, 95% CI) | 2.42 [0.49, 12.01] |