Stosowanie płynów izotonicznych w porównaniu z hipotonicznymi przy dożylnym podawaniu płynów u dzieci
Información
- DOI:
- https://doi.org/10.1002/14651858.CD009457.pub2Copiar DOI

- Base de datos:
-
- Cochrane Database of Systematic Reviews
- Versión publicada:
-
- 18 diciembre 2014see what's new
- Tipo:
-
- Intervention
- Etapa:
-
- Review
- Grupo Editorial Cochrane:
-
Grupo Cochrane de Lesiones
- Copyright:
-
- Copyright © 2014 The Cochrane Collaboration. Published by John Wiley & Sons, Ltd.
Cifras del artículo
Altmetric:
Citado por:
Autores
Contributions of authors
Sarah McNab and Tavey Dorofaeff screened the titles and abstracts of all trials identified through the search for potential inclusion. Two authors independently performed data extraction for each study (each author was involved with data extraction of at least one study, with Sarah McNab involved with data extraction for each study).
The initial draft was written by Sarah McNab, with all authors contributing to draft revisions.
Robert Ware provided statistical advice and assistance.
Sources of support
Internal sources
-
No sources of support supplied
External sources
-
Murdoch Childrens Research Institute, Australia.
Scholarship funding for Dr Sarah McNab
-
Vincent Fairfax Family Foundation Research Entry Scholarship, Royal Australasian College of Physicians, Australia.
Scholarship funding for Dr Sarah McNab
Declarations of interest
Sarah McNab, Trevor Duke and Andrew Davidson have been involved in the design and conduct of a trial (McNab 2014), which would potentially be eligible for future revisions of this Cochrane Review.
Mark Coulthard, Robert Ware, Karen Choong and Kristen Neville were involved in the design and conduct of studies included in this Cochrane Review. We did not extract outcome or quality data from the studies we co‐author.
Tavey Dorofaeff: None known.
Acknowledgements
We thank the authors of each included study who responded to our request for further data. We also thank Dr Burcu Gorgulu for translation of the Turkish Dağli 1997 study into English.
Assistance was also provided by the Cochrane Injuries Group's Trials Search Co‐ordinator, as well as the Cochrane workshops.
Version history
| Published | Title | Stage | Authors | Version |
| 2014 Dec 18 | Isotonic versus hypotonic solutions for maintenance intravenous fluid administration in children | Review | Sarah McNab, Robert S Ware, Kristen A Neville, Karen Choong, Mark G Coulthard, Trevor Duke, Andrew Davidson, Tavey Dorofaeff | |
| 2011 Dec 07 | Isotonic versus hypotonic solutions for maintenance intravenous fluid administration in children | Protocol | Sarah McNab, Trevor Duke, Karen Choong, Tavey Dorofaeff, Andrew Davidson, Mark Coulthard, Kristen Neville, Robert S. Ware | |
Differences between protocol and review
A secondary outcome planned in our protocol was mean change in serum sodium. We removed this due to doubts about the statistical significance of this outcome, with concerns about false positive results when comparisons are made within randomised groups (Bland 2011). In addition, the clinical significance of change in sodium is complex and related to the initial sodium for an individual patient. These data were not available.
We included two sensitivity analyses that were not described a priori: these are described in the main text. We did not conduct a planned sensitivity analysis on allocation concealment as only one, small study did not conceal allocation. All subgroup analyses were pre‐specified in the protocol.
The protocol for this review initially stated that we would look to analyse continuous outcomes according to two time blocks: < 12 hours and ≥ 12 hours. Practically, when examining the available data in the included studies, this was difficult as, within individual studies, there were multiple outcomes within the one time block. We elected to change the time blocks to 6 to 12 hours and > 12 to 24 hours. No study had more than one outcome reported within these time blocks. While some studies also reported outcomes in later time blocks (e.g. T48 and T72), most had substantial drop‐outs by this time frame with few meaningful data.
In the protocol, solutions with > or = 125 mmol/L of sodium were considered isotonic or near isotonic. In the review, we added an upper limit of 160 mmol/L. For the subgroup analysis of moderately hypotonic fluid, the protocol defined moderately hypotonic fluid as containing sodium of >/= 70 mmol/L and </= 100 mmol/L. We changed the latter to < 125 mmol/L in the review; this did not affect the outcome as no study used fluid containing between 100 mmol/L and 125 mmol/L of sodium. We changed a restricted fluid rate from </= 60% maintenance in the protocol to </= 70% of standard maintenance in the review.
The protocol stipulated that the rate at which fluid was administered would not be used to include or exclude studies. We removed this from the final review for clarity. We did not use a predefined fluid rate to exclude studies; however, information on fluid rates assisted in determining whether the fluid was being administered to maintain hydration, or for another purpose (e.g. for resuscitation or to replace a pre‐existing deficit).
Keywords
MeSH
Medical Subject Headings (MeSH) Keywords
- Fluid Therapy [*adverse effects, methods];
- Hypernatremia [blood, etiology];
- Hyponatremia [blood, *etiology];
- Hypotonic Solutions [administration & dosage, *adverse effects];
- Infusions, Intravenous;
- Isotonic Solutions [administration & dosage, *adverse effects];
- Randomized Controlled Trials as Topic;
- Risk;
- Saline Solution, Hypertonic [administration & dosage, *adverse effects];
- Sodium [blood];
Medical Subject Headings Check Words
Adolescent; Child; Child, Preschool; Humans; Infant;
PICO

Study flow diagram.
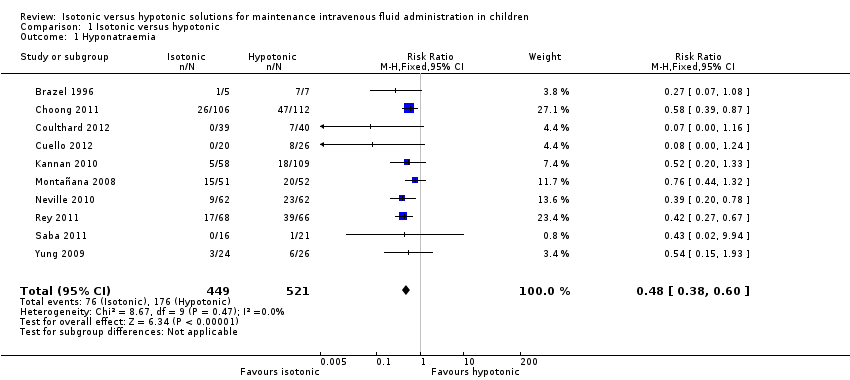
Comparison 1 Isotonic versus hypotonic, Outcome 1 Hyponatraemia.

Comparison 1 Isotonic versus hypotonic, Outcome 2 Hypernatraemia.
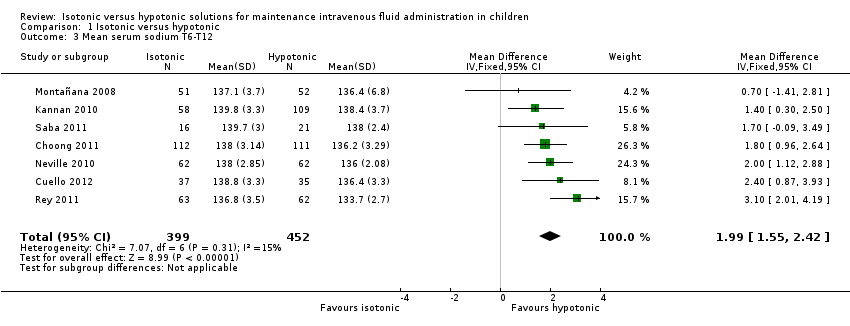
Comparison 1 Isotonic versus hypotonic, Outcome 3 Mean serum sodium T6‐T12.
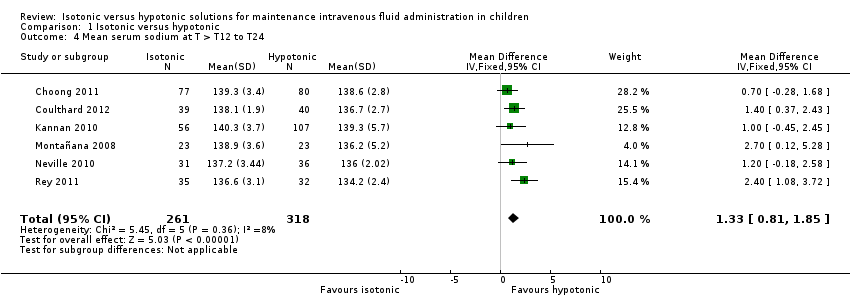
Comparison 1 Isotonic versus hypotonic, Outcome 4 Mean serum sodium at T > T12 to T24.

Comparison 1 Isotonic versus hypotonic, Outcome 5 Death.

Comparison 1 Isotonic versus hypotonic, Outcome 6 Seizures.
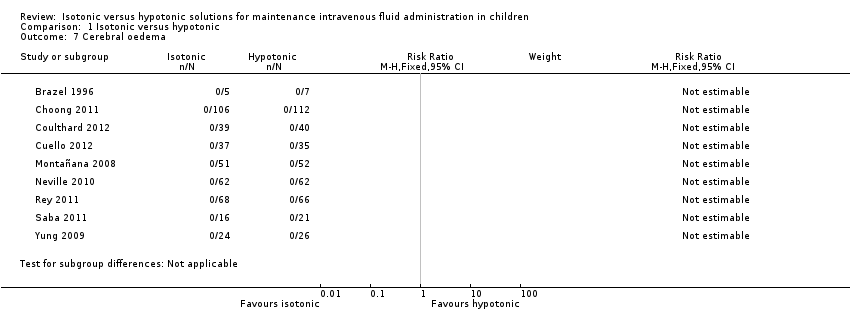
Comparison 1 Isotonic versus hypotonic, Outcome 7 Cerebral oedema.

Comparison 1 Isotonic versus hypotonic, Outcome 8 Overhydration.
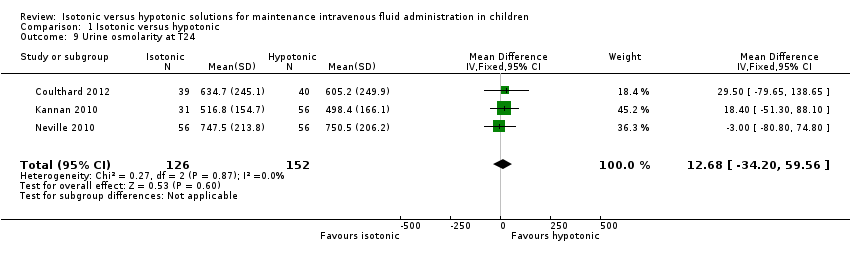
Comparison 1 Isotonic versus hypotonic, Outcome 9 Urine osmolarity at T24.
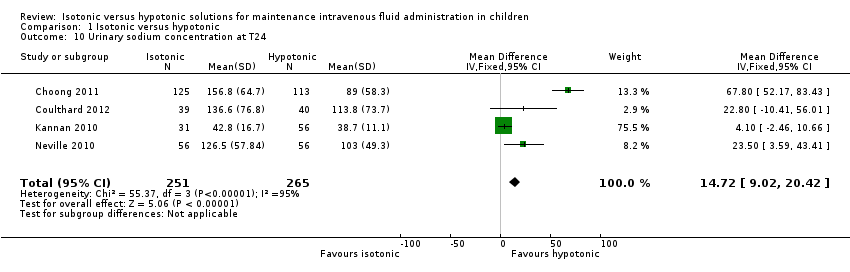
Comparison 1 Isotonic versus hypotonic, Outcome 10 Urinary sodium concentration at T24.

Comparison 1 Isotonic versus hypotonic, Outcome 11 Hyponatraemia (by concentration of hypotonic fluid).

Comparison 1 Isotonic versus hypotonic, Outcome 12 Hyponatraemia (surgical/medical).
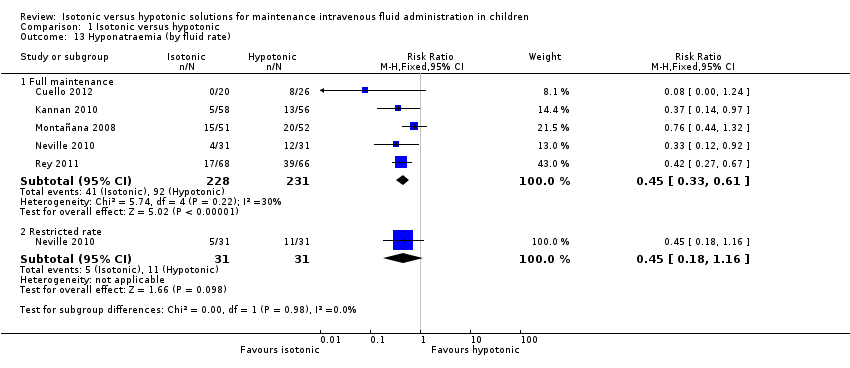
Comparison 1 Isotonic versus hypotonic, Outcome 13 Hyponatraemia (by fluid rate).
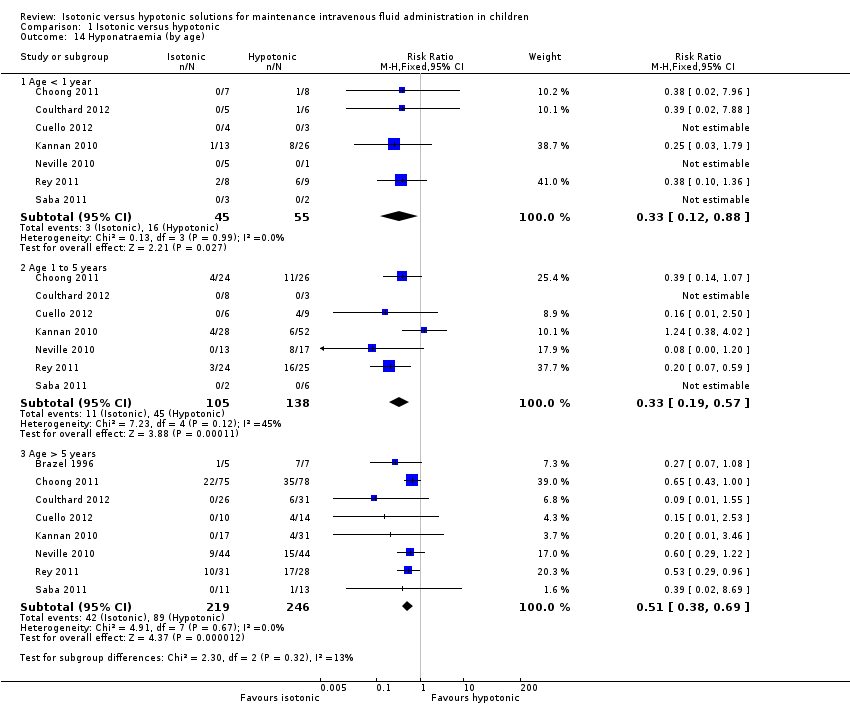
Comparison 1 Isotonic versus hypotonic, Outcome 14 Hyponatraemia (by age).

Comparison 1 Isotonic versus hypotonic, Outcome 15 Hyponatraemia (by severity of illness).

Comparison 1 Isotonic versus hypotonic, Outcome 16 Sensitivity analysis ‐ balanced fluid rates.

Comparison 1 Isotonic versus hypotonic, Outcome 17 Sensitivity analysis ‐ normonatraemic at baseline.
| Isotonic intravenous fluid compared with hypotonic intravenous fluid to maintain hydration | ||||||
| Patient or population: children requiring intravenous fluid to maintain hydration Settings: inpatient hospital setting Intervention: isotonic intravenous fluid Comparison: hypotonic intravenous fluid | ||||||
| Outcomes | Illustrative comparative risks* (95% CI) | Relative effect | No of participants | Quality of the evidence | Comments | |
| Assumed risk | Corresponding risk | |||||
| Hypotonic intravenous fluid | Isotonic intravenous fluid | |||||
| Hyponatraemia (serum sodium < 135 mmol/L) | Study population | RR 0.48 (0.38 to 0.60) | 970 | ⊕⊕⊕⊕ | ||
| 338 per 1000 | 169 per 1000 | |||||
| Surgical patients | RR 0.48 (0.36 to 0.64) | 529 (7) | ⊕⊕⊕⊕ | |||
| 379 per 1000 | 185 per 1000 | |||||
| Medical patients | RR 0.29 (0.16 to 0.55) | 279 (4) | ⊕⊕⊕⊝ | |||
| 276 per 1000 | 83 per 1000 | |||||
| Intensive care patients | RR 0.48 (0.37 to 0.64) | 443 (5) | ⊕⊕⊕⊕ | |||
| 446 per 1000 | 217 per 1000 | |||||
| Non‐intensive care patients | RR 0.45 (0.29 to 0.68) | 359 (5) | ⊕⊕⊕⊝ | |||
| 312 per 1000 | 135 per 1000 | |||||
| Hypernatraemia | Study population | RR 1.24 (0.65 to 2.38) | 937 | ⊕⊕⊝⊝ | Quality of evidence downgraded due to imprecision ‐ small number of events, wide confidence interval | |
| 34 per 1000 | 37 per 1000 | |||||
| Death | Study population | 5.59 (0.23 to 135.17) | 996 | ⊕⊕⊝⊝ | Quality of evidence downgraded due to imprecision ‐ small number of events, wide confidence interval Study design reduced the likelihood of this outcome | |
| 0 per 1000 | 2 per 1000 | |||||
| Seizures | Study population | RR 0.62 (0.03 to 15.02) | 996 | ⊕⊕⊝⊝ | Quality of evidence downgraded due to imprecision ‐ small number of events, wide confidence interval Study design reduced the likelihood of this outcome | |
| 2 per 1000 | 0 per 1000 | |||||
| Cerebral oedema | Study population | RR incalculable | 9 studies | ⊕⊝⊝⊝ | Quality of evidence downgraded due to imprecision ‐ no events, incalculable confidence interval Study design reduced the likelihood of this outcome | |
| 0 per 1000 | 0 per 1000 | |||||
| Overhydration | Study population | RR 1.14 (0.46 to 2.87) | 615 | ⊕⊕⊝⊝ | Quality of evidence downgraded due to imprecision ‐ small number of events, wide confidence interval Heterogeneity in the criteria for assessing this outcome | |
| 26 per 1000 | 30 per 1000 | |||||
| *The basis for the assumed risk (e.g. the median control group risk across studies) is provided in footnotes. The corresponding risk (and its 95% confidence interval) is based on the assumed risk in the comparison group and the relative effect of the intervention (and its 95% CI). | ||||||
| GRADE Working Group grades of evidence | ||||||
|
| Na+ (mmol/L) | Cl‐ (mmol/L) | K+ (mmol/L) | Mg++ (mmol/L) | Calcium (mmol/L) | Lactate (mmol/L) | Acetate (mmol/L) | Gluconate (mmol/L) | Glucose (gram/L) |
| Physiologically isotonic/near isotonic | |||||||||
| 0.9% sodium chloride | 154 | 154 | ‐ | ‐ | ‐ | ‐ | ‐ | ‐ | ‐ |
| 0.9% sodium chloride with 2.5/5% dextrose | 154 | 154 | ‐ | ‐ | ‐ | ‐ | ‐ | ‐ | 25 / 50 |
| Hartmann's solution (similar in ionic composition to Ringer's lactate) | 131 | 111 | 5 | ‐ | 2 | 29 | ‐ | ‐ | ‐ |
| Plasmalyte 148 solution | 140 | 98 | 5 | 1.5 | ‐ | ‐ | 27 | 23 | ‐ |
| Plasmalyte 148 solution with 5% dextrose | 140 | 98 | 5 | 1.5 | ‐ | ‐ | 27 | 23 | 50 |
| Physiologically moderately hypotonic | |||||||||
| 0.45% sodium chloride (N/2) with 5% dextrose | 77 | 77 | ‐ | ‐ | ‐ | ‐ | ‐ | ‐ | 50 |
| Physiologically very hypotonic | |||||||||
| 0.3% sodium chloride (N/3) with 3.3% dextrose | 51 | 51 | ‐ | ‐ | ‐ | ‐ | ‐ | ‐ | 33 |
| 0.18% sodium chloride (N/5) with 4% dextrose | 30 | 30 | ‐ | ‐ | ‐ | ‐ | ‐ | ‐ | 40 |
| Note: Minor variations in composition occur at the point of manufacture. | |||||||||
| Study | Number of participants | Population | Study arms | Primary outcome |
| 12 | Patients undergoing primary corrective surgery for idiopathic scoliosis | Isotonic (Hartmann's) Hypotonic (either 0.3% saline + 3% dextrose or 0.18% saline + 4% dextrose) Rate: 1.5 ml/kg/hr | Development of SIADH | |
| 122 | PICU patients | Isotonic fluid (sodium 140 mEq/L) Hypotonic fluid (sodium between 20 and 100 mEq/L corresponding to 2 to 4 mEq/kg/24 hr) Exact composition of fluids not stated Rate: standard maintenance | Hyponatraemia < 135 mEq/L | |
| 50 | PICU patients | 0.9% saline at standard maintenance rate 0.9% saline at 2/3 restricted rate 0.18% saline + 4% dextrose at standard maintenance rate 0.18% saline + 4% dextrose at 2/3 restricted rate | Change in plasma sodium from admission to 12 to 24 hrs later | |
| 167 | Broad paediatric population (university hospital in India) | 0.9% saline + 5% dextrose at standard maintenance rate 0.18% saline + 5% dextrose at standard maintenance rate 0.18% saline + 5% dextrose at 2/3 restricted rate | Hyponatraemia < 130mEq/L | |
| 124 | Elective or emergency surgery | 0.9% saline + 2.5% dextrose at standard maintenance rate 0.9% saline + 5% dextrose at 50% restricted rate 0.45% saline + 2.5% dextrose at standard maintenance rate 0.45% saline + 5% dextrose at 50% restricted rate | Change in plasma sodium from induction of anaesthesia to T8 | |
| 125 | PICU patients | Isotonic (sodium 136 mmol/L) Hypotonic (sodium 30 to 50 mmol/L) Exact composition not stated Rate: standard maintenance | Change in plasma sodium from admission to 12 and 24 hrs later | |
| 258 | Surgical patients | 0.9% saline + 5% dextrose 0.45% saline + 5% dextrose Rate: Physician's discretion | Hyponatraemia < 135 mmol/L | |
| 37 | Medical patients admitted via ED Elective surgical patients | 0.9% saline + 5% dextrose 0.45% saline + 5% dextrose Rate: physician's discretion | Rate of change of sodium | |
| 82 | Patients undergoing spinal instrumentation, craniotomy for brain tumour resection or cranial vault remodelling | Hartmann's + 5% dextrose at full maintenance rate 0.45% saline + 5% dextrose at 2/3 restricted rate | Mean plasma sodium 16 to 18 hrs postoperatively | |
| (abstract only) | 72 | Participants with either of 2 conditions: a) gastroenteritis with moderate dehydration and unable to tolerate fluids b) children requiring non‐urgent surgery and requiring maintenance intravenous hydration during their admission | 0.9% saline + 5% dextrose +/‐ 20 mmol/L KCl 0.2% saline + 5% dextrose +/‐ 20 mmol/L KCl Rate: standard maintenance | Mean plasma sodium at 4 (T4) and 8 (T8) hours, and the percentage of patients who developed hyponatraemia (> 125 mEq/L and < 135 mEq/L) |
| ED: emergency department KCl: potassium choride | ||||
| First author | Duration of fluid therapy | Timing of outcome measurements |
| Brazel | Max 72 hrs | End of procedure, T6, T24, T48, T72
|
| Montañana | Max 24 hrs | T6, T24 (only T6 primary outcome data included in analysis) |
| Yung | 12 to 24 hrs | T12 to 24 |
| Kannan | Max 72 hrs | T12, T24, T36, T48, T60, T72
|
| Neville | Max 24 hrs | At intubation, T8, T24 |
| Rey | Max 24 hrs | T12, T24 |
| Choong | Max 48 hrs | T12, T24, T36, T48 |
| Saba | 8 to 12 hrs | T12 |
| Coulthard | 16 to 18 hrs | T16 to 18 |
| Cuello | 8 hrs | T4, T8 |
| hr: hour | ||
| Primary author | Inclusion criteria | Exclusion criteria |
| Brazel | Adolescent patients undergoing primary corrective surgery for adolescent idiopathic scoliosis
| — |
| Montañana | PICU patients requiring maintenance intravenous fluid
| Chronic or acute kidney failure Patients at risk of cerebral oedema (diabetic ketoacidosis or craneoencephalic trauma) Patients with plasma sodium level at admission < 130 mEq/L or > 150 mEq/L, and/or dehydration > 5% of the patient's body weight
|
| Yung | Patients admitted to PICU who would normally require IV fluids at standard maintenance rates for 12 hrs, with normal sodium levels and not hypoglycaemic
| Neonates, diabetes, renal failure, shock Cardiac and neurosurgical patients were eligible for the restricted rate arm only |
| Kannan | Patients aged between 3 months and 12 years requiring IV maintenance fluid administration for at least 24 hrs
| Na < 130mEq/L, Na > 150mEq/L, blood glucose > 180 mg/dL, dehydration, shock, severe malnutrition, cirrhosis of liver, congestive heart failure, acute or chronic renal failure and nephrotic syndrome Patients receiving drugs that may alter plasma sodium levels Patients requiring fluid boluses for volume depletion and/or shock |
| Neville | Patients undergoing elective or emergency surgery, expected to take nothing by mouth after surgery for at least 8 hrs. Weight > 8kg | Significant blood loss expected during surgery Surgery types known to be associated with excess ADH secretion (cranial and thoracic surgery) Known abnormality of ADH secretion, nephrogenic diabetes insipidus, pituitary or hypothalamic disease, kidney disease, acute or chronic lung disease Patients receiving drugs known to stimulate ADH secretion |
| Rey | PICU patients requiring maintenance IV fluids
| Impairment in body water homeostasis (e.g. congestive heart failure) Electrolytic alterations requiring a different IV fluid than that in the study Renal function abnormalities Patients requiring fluid restriction |
| Choong | Euvolaemic patients within 6 hours after elective surgery if anticipated need for IV maintenance was > 24 hours
| Uncorrected plasma sodium level abnormalities before the end of surgery Patients with known abnormalities of ADH secretion Patients requiring volume resuscitation and/or vasoactive infusions Recent loop diuretic use Total parenteral nutrition required with 24 hours following surgery Patients for whom either a hypotonic or isotonic Isotonic fluid was considered necessary or contraindicated (e.g. because of a risk of cerebral oedema, acute burns or the risk of third space and/or sodium overload in patients with pre‐existing congestive cardiac failure, renal failure, liver failure or cirrhosis) |
| Saba | Patients requiring at least 8 hours of IV fluids
| Baseline Na of < 133 or > 145 mmol/L Patients with any of renal disease, cardiac dysfunction, pre‐existing hypertension, diuretic use, oedema, known adrenal dysfunction, acute or severe chronic neurological illness |
| Coulthard | Patients admitted to PICU following spinal instrumentation for correction of scoliosis, craniotomy for excision of brain tumours and cranial vault remodelling | Lengthening only of spinal instrumentation rods, insertion or revision of ventriculoperitoneal shunts, intracerebral cyst fenestration or previously enrolled |
| Cuello | Patients 6 months to 14 years old; with a serum sodium level between 125 mmol/L to 150 mmol/L; previously healthy, admitted to the emergency room or hospitalisation ward with any of 2 conditions: a) gastroenteritis with moderate dehydration and unable to drink fluids; b) children undergoing non‐urgent surgery and requiring maintenance IV hydration during their hospitalisation (i.e. non‐incarcerated hernia, adenotonsillectomies, tympanostomy, fracture reductions of the extremities, etc.) | Chronic illnesses (e.g. cystic fibrosis, cerebral palsy, etc.); taking antidiuretics; major trauma that required intensive care; hyper or hyponatraemia at admission; severe dehydration |
| ADH: antidiuretic hormone secretion | ||
| Outcome or subgroup title | No. of studies | No. of participants | Statistical method | Effect size |
| 1 Hyponatraemia Show forest plot | 10 | 970 | Risk Ratio (M‐H, Fixed, 95% CI) | 0.48 [0.38, 0.60] |
| 2 Hypernatraemia Show forest plot | 9 | 937 | Risk Ratio (M‐H, Fixed, 95% CI) | 1.24 [0.65, 2.38] |
| 3 Mean serum sodium T6‐T12 Show forest plot | 7 | 851 | Mean Difference (IV, Fixed, 95% CI) | 1.99 [1.55, 2.42] |
| 4 Mean serum sodium at T > T12 to T24 Show forest plot | 6 | 579 | Mean Difference (IV, Fixed, 95% CI) | 1.33 [0.81, 1.85] |
| 5 Death Show forest plot | 10 | 996 | Risk Ratio (M‐H, Fixed, 95% CI) | 5.59 [0.23, 135.17] |
| 6 Seizures Show forest plot | 10 | 996 | Risk Ratio (M‐H, Fixed, 95% CI) | 0.62 [0.03, 15.02] |
| 7 Cerebral oedema Show forest plot | 9 | Risk Ratio (M‐H, Fixed, 95% CI) | Subtotals only | |
| 8 Overhydration Show forest plot | 5 | 615 | Risk Ratio (M‐H, Fixed, 95% CI) | 1.14 [0.46, 2.87] |
| 9 Urine osmolarity at T24 Show forest plot | 3 | 278 | Mean Difference (IV, Fixed, 95% CI) | 12.68 [‐34.20, 59.56] |
| 10 Urinary sodium concentration at T24 Show forest plot | 4 | 516 | Mean Difference (IV, Fixed, 95% CI) | 14.72 [9.02, 20.42] |
| 11 Hyponatraemia (by concentration of hypotonic fluid) Show forest plot | 9 | Risk Ratio (M‐H, Fixed, 95% CI) | Subtotals only | |
| 11.1 Isotonic versus moderately hypotonic fluid | 4 | 458 | Risk Ratio (M‐H, Fixed, 95% CI) | 0.48 [0.34, 0.67] |
| 11.2 Isotonic versus very hypotonic fluid | 5 | 409 | Risk Ratio (M‐H, Fixed, 95% CI) | 0.40 [0.27, 0.58] |
| 12 Hyponatraemia (surgical/medical) Show forest plot | 8 | Risk Ratio (M‐H, Fixed, 95% CI) | Subtotals only | |
| 12.1 Surgical patients | 7 | 529 | Risk Ratio (M‐H, Fixed, 95% CI) | 0.48 [0.36, 0.64] |
| 12.2 Medical patients | 4 | 279 | Risk Ratio (M‐H, Fixed, 95% CI) | 0.29 [0.16, 0.55] |
| 13 Hyponatraemia (by fluid rate) Show forest plot | 5 | Risk Ratio (M‐H, Fixed, 95% CI) | Subtotals only | |
| 13.1 Full maintenance | 5 | 459 | Risk Ratio (M‐H, Fixed, 95% CI) | 0.45 [0.33, 0.61] |
| 13.2 Restricted rate | 1 | 62 | Risk Ratio (M‐H, Fixed, 95% CI) | 0.45 [0.18, 1.16] |
| 14 Hyponatraemia (by age) Show forest plot | 8 | Risk Ratio (M‐H, Fixed, 95% CI) | Subtotals only | |
| 14.1 Age < 1 year | 7 | 100 | Risk Ratio (M‐H, Fixed, 95% CI) | 0.33 [0.12, 0.88] |
| 14.2 Age 1 to 5 years | 7 | 243 | Risk Ratio (M‐H, Fixed, 95% CI) | 0.33 [0.19, 0.57] |
| 14.3 Age > 5 years | 8 | 465 | Risk Ratio (M‐H, Fixed, 95% CI) | 0.51 [0.38, 0.69] |
| 15 Hyponatraemia (by severity of illness) Show forest plot | 9 | Risk Ratio (M‐H, Fixed, 95% CI) | Subtotals only | |
| 15.1 Intensive care patients | 5 | 443 | Risk Ratio (M‐H, Fixed, 95% CI) | 0.48 [0.37, 0.64] |
| 15.2 Non‐intensive care patients | 5 | 359 | Risk Ratio (M‐H, Fixed, 95% CI) | 0.45 [0.29, 0.68] |
| 16 Sensitivity analysis ‐ balanced fluid rates Show forest plot | 8 | 735 | Risk Ratio (M‐H, Fixed, 95% CI) | 0.45 [0.35, 0.58] |
| 17 Sensitivity analysis ‐ normonatraemic at baseline Show forest plot | 4 | 326 | Risk Ratio (M‐H, Fixed, 95% CI) | 0.49 [0.34, 0.71] |