Intervenciones con medios masivos de comunicación para la reducción del estigma relacionado con la salud mental
Información
- DOI:
- https://doi.org/10.1002/14651858.CD009453.pub2Copiar DOI

- Base de datos:
-
- Cochrane Database of Systematic Reviews
- Versión publicada:
-
- 23 julio 2013see what's new
- Tipo:
-
- Intervention
- Etapa:
-
- Review
- Grupo Editorial Cochrane:
-
Grupo Cochrane de Consumidores y comunicación
- Copyright:
-
- Copyright © 2013 The Cochrane Collaboration. Published by John Wiley & Sons, Ltd.
Cifras del artículo
Altmetric:
Citado por:
Autores
Contributions of authors
Sarah Clement wrote the protocol (Clement 2011), with Paul Williams writing some sections and Sara Evans‐Lacko co‐writing some sections. All authors contributed ideas to the protocol and critically revised it. Sarah Clement produced an initial draft MEDLINE search strategy which was developed further and finalised by John Kis‐Rigo (Cochrane Consumers and Communication Review Group).
Sarah Clement supervised the adaptation of the MEDLINE search strategy for the other English language databases and Sosei Yamaguchi adapted it for the Japanese database Ichushi. Francesca Lassman ran some of the database searches and undertook the non‐database searches. Francesca Lassman was the primary screener for the English language databases and Sosei Yamaguchi for the Japanese database. Sarah Clement developed the manuals for inclusion decisions and data extraction and the Data Extraction Template, and these were piloted with Sara Evans‐Lacko, Elizabeth Barley, Paul Williams and Francesca Lassman. Sarah Clement made inclusion decisions and extracted data for all English articles and Sosei Yamaguchi did this for the Japanese articles. Elizabeth Barley and Sara Evans‐Lacko shared the role of second author for inclusion decisions and data extraction, with Francesca Lassman also contributing. Nicolas Rüsch made inclusion decisions on German language articles. Paul Williams and Sarah Clement undertook the analyses, with Paul providing statistical advice and guidance and performing the complex analyses. Sarah Clement drafted the review with major assistance from Francesca Lassman. Nicolas Rüsch, Mike Slade and Graham Thornicroft provided information, advice and support at intervals throughout the review process and assisted in interpreting the review findings and drawing implications from them; and in addition Graham Thornicroft provided supervision to Sarah Clement. All authors critically revised the review.
Sources of support
Internal sources
-
No sources of support supplied
External sources
-
This publication is independent research funded by the National Institute for Health Research under its Programme Grants for Applied Research scheme (Improving Mental Health Outcomes by Reducing Stigma and Discrimination: RP‐PG‐0606‐1053)., UK.
The Programme grant supports the salary of SC, FL and contributes to the time of PW, GT and MS. The views expressed in this publication are those of the authors and not necessarily those of the NHS, the National Institute for Health Research or the Department of Health.
-
NIHR Specialist Mental Health Biomedical Research Centre at the Institute of Psychiatry, Kings College London and the South London and Maudsley NHS Foundation Trust, UK.
This contributes to the time of GT.
-
Big Lottery and Comic Relief grant for Evaluation of the Time to Change Programme, UK.
This supports the salary of SEL.
Declarations of interest
Review authors have been involved in some studies on the effectiveness of mass media interventions in reducing mental health‐related stigma. Graham Thornicroft leads the independent evaluation team for England's national ‘Time to Change: Let’s end mental health discrimination now’ programme (Henderson 2009) and has received research funding for this. Sara Evans‐Lacko is employed as a researcher on this evaluation team. Graham Thornicroft has been a member of the independent evaluation team for Scotland’s ‘See Me’ campaign (Dunion 2005) and received research funding for this. Both Time to Change and See Me are multifaceted initiatives with mass media components. Graham Thornicroft is chief investigator and Sarah Clement is study lead for a randomised controlled trial on the effectiveness of an anti‐stigma DVD (Clement 2012). Graham Thornicroft received research funding for this study from the England's National Institute for Health Research and Sarah Clement is employed on this study. However, none of these studies proved eligible for the review.
Elizabeth Barley, Francesca Lassman, Nicolas Rüsch, Mike Slade, Paul Williams, Sosei Yamaguchi have no known potential conflicts of interest.
Acknowledgements
We are very grateful to Rowena Pagdin who adapted the MEDLINE search strategy for the other English language databases, ran some of the database searches and was the secondary screener for the English databases, screening 20% of the records. We thank staff and editors of the Cochrane Consumers and Communication Review Group for their support, advice and assistance, especially Megan Prictor, Sandy Oliver, Rebecca Ryan and John Kis‐Rigo. We also thank the UK Cochrane Centre training team for their advice and support. We thank our consultation group for their thoughtful contributions at the protocol and review stage, including Nisha Mehta, Vanessa Pinfold, Debra Jeffery and Felicity Callard. We are very grateful to Ken Ichikawa for screening 20% of the items yielded by the Japanese database search, and for making inclusion decisions and extracting data for Japanese studies. We are grateful to the authors of included studies and experts who responded to our requests about other potentially‐eligible studies, including Otto Wahl, Norman Sartorius and Lynne Robinson. We are also very grateful to the study authors who kindly provided further information about, or data from, their studies. Particular thanks are due to Dr Koji Yoshida and the Japanese 'National Federation of Families with Mentally Ill' for providing the original data set for their study, and to Dr Yoshida for his efforts in successfully releasing these data. We also thank Steve Bowen for proof reading and contributing to the plain language summary; and the staff at the library of the Institute of Psychiatry, King's College London for database and document retrieval advice and support.
Version history
| Published | Title | Stage | Authors | Version |
| 2013 Jul 23 | Mass media interventions for reducing mental health‐related stigma | Review | Sarah Clement, Francesca Lassman, Elizabeth Barley, Sara Evans‐Lacko, Paul Williams, Sosei Yamaguchi, Mike Slade, Nicolas Rüsch, Graham Thornicroft | |
| 2011 Dec 07 | Mass media interventions for reducing mental health‐related stigma | Protocol | Sarah Clement, Francesca Lassman, Elizabeth Barley, Sara Evans‐Lacko, Paul Williams, Rowena Pagdin, Mike Slade, Nicolas Rüsch, Sosei Yamaguchi, Graham Thornicroft | |
Differences between protocol and review
The protocol for this review is Clement 2011.
Types of outcome measure
We had originally planned to include discriminatory behavioural intentions under discrimination (stigmatising behaviour), but elected to treat these as under prejudice (stigmatising attitudes) as an intention is more akin to an attitude than a behaviour.
Data extraction and management
A post‐hoc decision was made not to use the 'see the person' message type, as this message type only arose when interventions contained personal narratives and if we had categorised these as having a 'see the person' primary message we would have missed messages contained in what the narrators said (or other aspects of the intervention). We also decided post‐hoc to include commonly‐used categories of primary message that were not in Clement 2010. We had not pre‐specified the method of deciding which message was primary and decided this would be undertaken independently by two authors who would resolve disparities by discussion, and with arbitration if necessary.
We had not specified methods for classifying levels of risk for outcome measures in our protocol, therefore, through discussion (SC EB, SEL and FL), we established the following pragmatic criteria. We rated as high risk: measures developed by the study authors with no psychometric data reported; measures for which the authors reported a Cronbach's alpha of < 0.7; and un‐referenced measures. We rated as 'unclear': referenced measures with no psychometric data reported; referenced measures with no statement that the measure was reliable or valid; and validated measures being used for the first time in a different type of population. We rated as low risk: measures which study authors reported had a Cronbach's alpha of 0.7 or greater, or referenced the measure as being reliable or valid.
Measures of treatment effect
Standardised mean differences rather than mean differences were calculated, as different measures were used for the same outcome and this precludes the use of mean differences. We did not pre‐specify actions if data were skewed data. When this was the case the data were transformed into the logarithmic scale using methods described by Higgins and colleagues (Higgins 2008).
Unit of analysis issues
It was clarified that where intervention arms fell into different subgroups each intervention arm was compared to the control group and the possibility of meta‐analysis was only considered within each subgroup, thereby avoiding potential unit‐of‐analysis errors. We had not made an a priori plan for dealing with studies with two control groups. When this arose we selected the one that was most similar to the intervention, that is an intervention containing irrelevant material rather than a no intervention control.
Data synthesis
Where there was an even number of outcomes, we made a post‐hoc decision, after consultation with the Cochrane Consumers and Communication Review Group, to follow Brennan 2009 and to select the outcome with the n/2 ranked effect size (using data from the final follow‐up point when there were two or more follow‐up points). A post‐hoc decision was also needed about which outcome to select when multiple outcomes were used in studies with median data. In these cases, on the advice of UK Cochrane Centre training staff, we used an adapted version of the methods proposed by Grimshaw 2003 and Brennan 2009 whereby, after checking that the interquartile ranges were similar, we examined medians at the latest time point and selected the one ranked (n+1)/2 when there was an odd number of outcomes and the one ranked n/2 when there was an even number. Because standardised mean differences rather than mean differences were used, baseline differences are not reported. The review author group discussion to decide about the appropriateness of meta‐analysis was originally planned as a face‐to‐face meeting but altered to an email discussion for practical reasons, and given that for the vast majority of comparisons meta‐analysis was precluded on statistical grounds. We planned to produce a 'Summary of findings' table using GRADEprofiler (GRADEpro) software. In the event the 'Summary of findings' table was produced using the template in RevMan, but still following the GRADE approach (Guyatt 2008).
Subgroup analysis
The main analysis became, in effect, a subgroup analysis by timing of outcome, as we had not anticipated the issue of differential follow‐up time points. This approach was undertaken because it was not appropriate to combine outcomes assessed immediately post‐intervention with those assessed at six months or longer, and because issues of multiplicity would have arisen for studies with more than one follow‐up time point, had we not separated the data by follow‐up time point. In the remaining subgroup analyses we selected the earliest follow‐up time point as the one to present data for. We found that there were two unanticipated types of intervention: simulated audio‐recordings, and interventions containing third‐person narratives. As we considered each of these to be sufficiently distinct from the groups already listed in our subgroup analysis, these groups were added into the analyses post‐hoc. As no mobile phone, broadcast media or cinema interventions were found, we did not refer to these and they did not appear in the 'type of media' subgroup analysis. There was just one intervention ‐ a CD‐ROM ‐ that fell in the 'other' category for media type and a decision was made to group this in the Internet category as Internet‐delivery would not have materially changed participants' experience of the intervention.
Sensitivity analysis
As minimal meta‐analysis was warranted we examined the effects of removing studies at risk of bias and less precise studies primarily through examining changes in median effect sizes. We had intended to test for small study effects of binary outcomes by performing the arcsine‐Thompson test, but this was precluded because we found only two studies with binary primary outcomes, and these had very different timings of outcome (immediate and 9 months). Where reporting bias was discovered we planned to investigate the impact in a sensitivity analysis, but this did not prove possible (see Effects of interventions), as the only studies for which meta‐analysis was possible had identical bias. As we found that three of the multi‐arm studies included arms that the study authors considered unlikely to reduce stigma (Reinke 2004; Brown 2010; Corrigan (submitted)), we undertook a post‐hoc sensitivity analysis to examine the effects of removing these studies.
Quality of the evidence
We had pre‐specified in the protocol the main outcomes for assessment of the quality of the evidence, but had not specified which would be categorised as critically important and which as important. We made a post‐hoc decision to categorise discrimination as a critically important outcome and the remainder as important.
Keywords
MeSH
Medical Subject Headings (MeSH) Keywords
Medical Subject Headings Check Words
Humans;
PICO

Study flow diagram.

Risk of bias graph: review authors' judgements about each risk of bias item presented as percentages across all included studies.
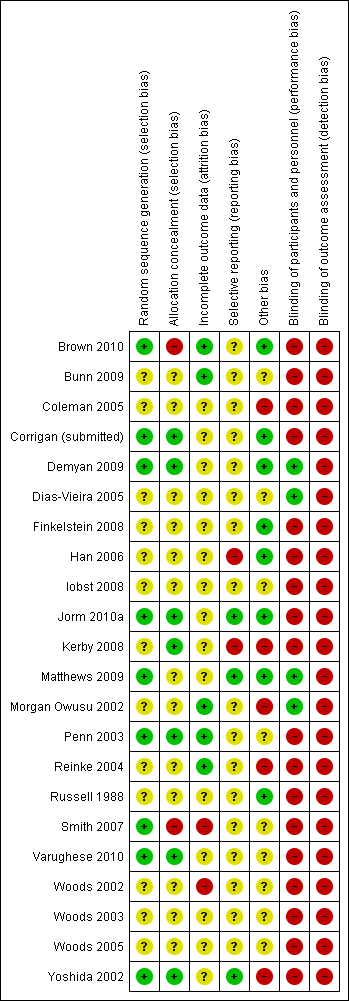
Risk of bias summary: review authors' judgements about each risk of bias item for each included study.

Forest plot of comparison: 1 Mass media vs. control (main comparison), outcome: 1.1 Discrimination (Immediate).

Forest plot of comparison: 1 Mass media vs. control (main comparison): outcome 1.2 Discrimination.

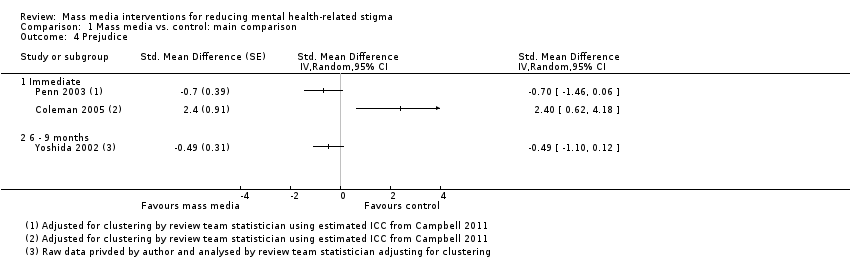
Forest plot of comparison: 1 Mass media vs. control (main comparison), outcome: 1.3 Prejudice.

Forest plot of comparison: 1 Mass media vs. control (main comparison), outcome: 1.4 Prejudice.
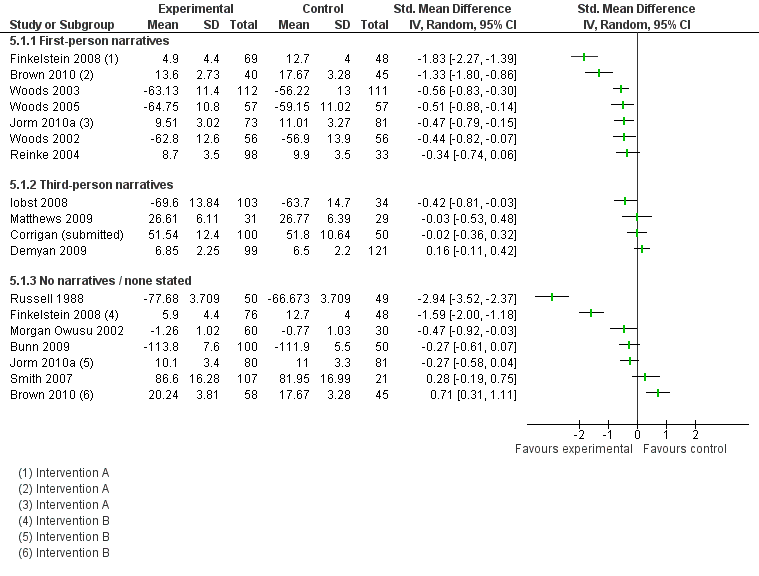
Forest plot of comparison: 5 Mass media vs. control by presence of narratives, outcome: 5.1 Prejudice (at earliest follow‐up time point).
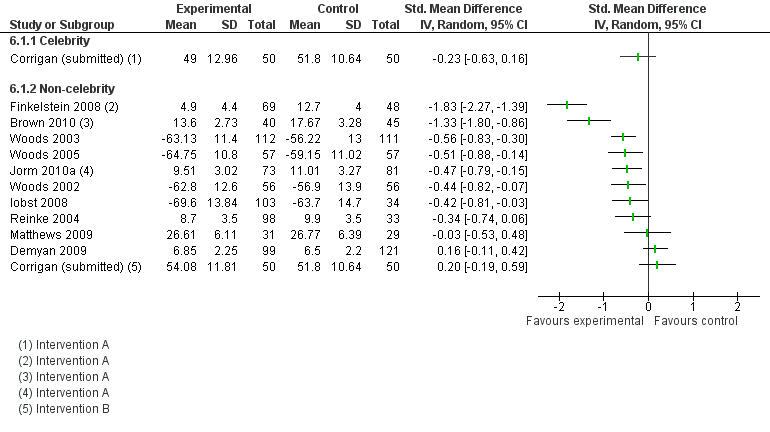
Forest plot of comparison: 6 Mass media vs. control by celebrity narratives, outcome: 6.1 Prejudice (at earliest follow‐up time point).
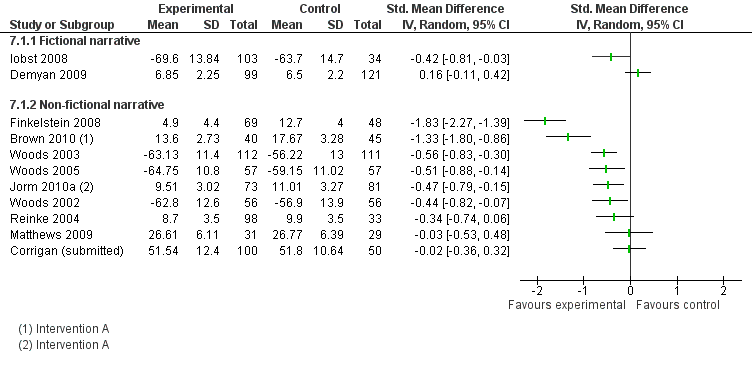
Forest plot of comparison: 7 Mass media vs. control by fictional narratives, outcome: 7.1 Prejudice (at earliest follow‐up time point).

Forest plot of comparison: 8 Mass media vs. control by type of message, outcome: 8.1 Prejudice (at earliest follow‐up time point).

Forest plot of comparison: 9 Mass media vs. control by type of media, outcome: 9.1 Prejudice (at earliest follow‐up time point)).

Comparison 1 Mass media vs. control: main comparison, Outcome 1 Discrimination (Immediate).

Comparison 1 Mass media vs. control: main comparison, Outcome 2 Discrimination.

Comparison 1 Mass media vs. control: main comparison, Outcome 3 Prejudice.
Comparison 1 Mass media vs. control: main comparison, Outcome 4 Prejudice.

Comparison 2 Mass media vs. control by income of country, Outcome 1 Prejudice (at earliest follow‐up time point).

Comparison 3 Mass media vs. control by number of mass media components, Outcome 1 Prejudice (at earliest follow‐up time point).
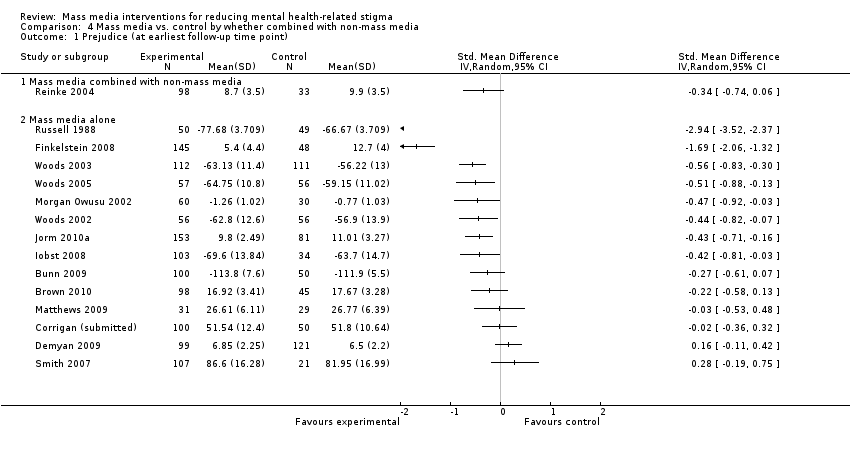
Comparison 4 Mass media vs. control by whether combined with non‐mass media, Outcome 1 Prejudice (at earliest follow‐up time point).
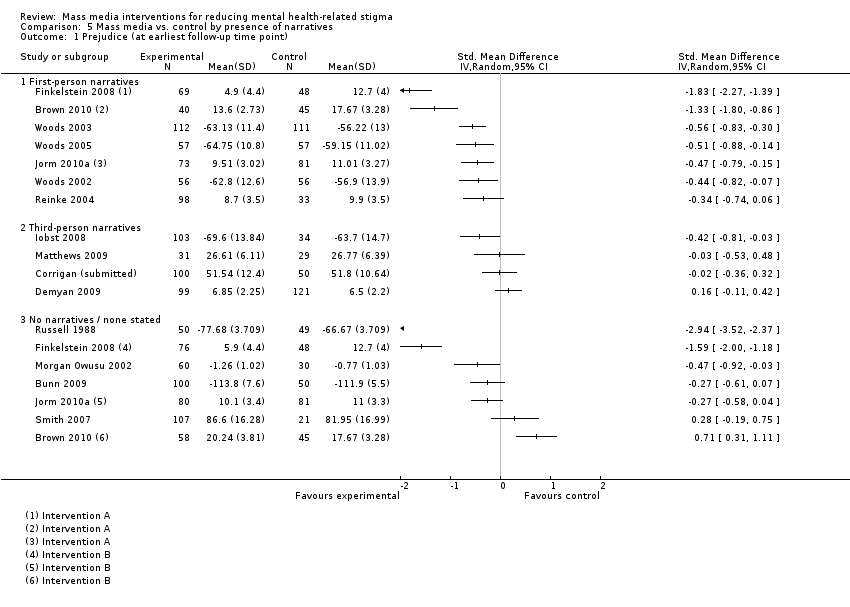
Comparison 5 Mass media vs. control by presence of narratives, Outcome 1 Prejudice (at earliest follow‐up time point).

Comparison 6 Mass media vs. control by celebrity narratives, Outcome 1 Prejudice (at earliest follow‐up time point).

Comparison 7 Mass media vs. control by fictional narratives, Outcome 1 Prejudice.

Comparison 8 Mass media vs. control by type of message, Outcome 1 Prejudice (at earliest follow‐up time point).

Comparison 9 Mass media vs. control by type of media, Outcome 1 Prejudice (at earliest follow‐up time point)).
| Mass media compared with inactive control for reducing mental health‐related stigma | ||||
| Patient or population: General public or any of its constituent groups (excluding groups comprising solely of people with mental ill health) Settings: Any Intervention: Mass media Comparison: Inactive control | ||||
| Outcomes | Relative effect | No of Participants | Quality of the evidence | Comments |
| Discrimination (i) not registering to attend focus group with people with schizophrenia (immediate)1 (ii) not visiting sheltered workshop for people with mental illness (9 months)2 (iii) distance placed between chairs when anticipating meeting with person with Tourette's syndrome3 | ORs (802 participants, 2 studies) (i) 1.30 (0.53 to 3.19) (i) 1.19 (0.85 to 1.65) SMDs (394 participants, 3 studies) (iii) median SMD ‐0.25 Range of SMDs ‐0.85 (‐1.39 to ‐0.31) to ‐0.17 (‐0.53 to 0.20) | 1196 (5) | ⊕⊕⊝⊝ | Quality of evidence downgraded for study limitations (risk of bias) and indirectness of measures (see Quality of the evidence for full details) |
| Prejudice Multiple scales4 Follow‐up (i) Immediate5 (ii) 1 week to 2 months6 (iii) 6 to 9 months7 | Median SMD (i) ‐0.38 (ii) ‐0.38 (iii) ‐0.49 Range of SMDs ‐2.94 (‐3.52 to ‐2.37) to 2.40 (0.62 to 4.18) Median SMDs are equivalent to reductions of 0.22, 0.22 and 0.29 points on the 1 to 4 point SDS scale [7], which is equivalent to reducing the level of prejudice from that associated with symptoms of schizophrenia to the level associated with symptoms of major depression8 | 3176 (19) | ⊕⊕⊝⊝ | Quality of evidence downgraded for study limitations (risk of bias) and indirectness of populations (see Quality of the evidence for full details) |
| Cost (i) Audiovisual public service announcement (ii) a) CD‐ROM b) printed manual (iii) magazine article | Relative costs (i) 100 US dollars (equivalent to £64 GBP) vs. nil (ii) a) 35,000 Australian dollars (£22,404 GBP) for 250 e‐learning CDs @ 140 dollars per CD (ii) b) 7,140 Australian dollars(£4,570 GBP) for 238 manuals @ 30 dollars per manual vs. nil (iii) 'printing costs' vs 'printing costs' | 416 (3) | ⊕⊝⊝⊝ | Quality of evidence downgraded for inconsistency of results, imprecision, and 'other' (data only being available on request, lack of cost‐effectiveness data) (see Quality of the evidence for full details) |
| Unforeseen adverse effects | Statements in two studies: (i) ‘Given that this was an educational intervention with a non‐clinical sample, there was no formal enquiry about adverse events. Informally, no adverse events were reported'; (ii) ‘No adverse effects, such as an increase in stigma as a result of the intervention, were identified’ | 2 (455) | ⊕⊕⊝⊝ | Quality of evidence downgraded for study limitations (risk of bias) and imprecision (see Quality of the evidence for full details) |
| CI: Confidence interval; OR: Odds ratio; SMD: Standardised mean difference | ||||
| GRADE Working Group grades of evidence | ||||
| [1] Penn 2003 [2] Yoshida 2002 [3] Woods 2002; Woods 2003; Woods 2005 [4] 28 different measures were used (see Characteristics of included studies) [5] Brown 2010; Bunn 2009; Coleman 2005; Corrigan (submitted); Finkelstein 2008; Iobst 2008; Matthews 2009; Morgan Owusu 2002; Penn 2003; Smith 2007; Woods 2002; Woods 2003; Woods 2005; Yoshida 2002 [6] Russell 1988; Demyan 2009; Brown 2010; Jorm 2010a [7] Yoshida 2002; Finkelstein 2008; Jorm 2010a [OR:1 indicated decreased stigma, > 1 indicates increased stigma; SMD < 0 indicates decreased stigma, > 0 indicates increased stigma] [8] Link 1999 This reference for the scale also reports a population standard deviation of 0.59 for social distance in relation to schizophrenia using the SDS from the observational study, General Social Survey 1996, USA. It gives SDS scores for different mental health conditions which are used for further interpretation. | ||||
| Comparison | No. of comparisons with positive direct of effect1 | Median effect size across all comparisons2 | Median effect size across all comparisons without unit of analysis errors3 | No. of comparisons showing statistically significant effects4 | Interpretation of median effect size across all comparisons5 |
| Mass media vs. control | |||||
| Immediate follow‐up | 3/4 | SMD = ‐0.25 OR = 1.30 | SMD = ‐0.25 | 1/4 (+) | Small/negligible |
| 6 to 9 months follow‐up | 0/1 | OR = 1.19 | OR = 1.19 | 0/1 | Negligible |
| Mass media vs. control by if 2+ mass media components | |||||
| 2+ mass media components | 0/1 | OR = 1.19 | OR = 1.19 | 0/1 | Negligible |
| One mass media component | 3/4 | SMD = ‐0.25 OR = 1.30 | SMD = ‐0.25 | 1/4 (+) | Small/negligible |
| Mass media vs. control by presence of narratives | |||||
| First‐person narratives | 3/4 | SMD = ‐0.25 OR = 1.30 | SMD = ‐0.25 | 1/4 (+) | Small/negligible |
| Third‐person narratives | 0/1 | OR = 1.19 | OR = 1.19 | 0/1 | Negligible |
| Mass media vs. control by type of primary message | |||||
| Recovery‐oriented | 0/1 | OR = 1.19 | OR = 1.19 | 0/1 | Negligible |
| Not to blame | 3/3 | SMD = ‐0.25 | SMD = ‐0.25 | 1/3 | Small |
| Multiple | 0/1 | OR = 1.30 | ‐ | 0/1 | Negligible |
| Mass media vs. control by fictional narratives | |||||
| Fictional narratives | 0/1 | OR = 1.19 | OR = 1.19 | 0/1 | Negligible |
| Non‐fictional narratives | 3/4 | SMD = ‐0.25 OR = 1.30 | SMD = ‐0.25 | 1/4 (+) | Small/negligible |
| Mass media vs. control by type of media | |||||
| Audiovisual | 3/4 | SMD = ‐0.25 OR = 1.30 | SMD = ‐0.25 | 1/4 (+) | Small/negligible |
| | 0/1 | OR = 1.19 | OR = 1.19 | 0/1 | Negligible |
| [1] Stigma‐reducing [2] When there was an even number of effect sizes the median reported is the mean of the two middle values. [3] This excludes cluster trials not adjusted for study design by the authors and without a study‐derived intra‐class correlation co‐efficient (Penn 2003) [4] (+) means in stigma‐reducing direction, (‐) means in stigma increasing direction [5] SMDs large ≥ 0.8; medium ≥ 0.5, small ≥ 0.2, negligible < 0.2; and for ORs large ≥ 4.3; medium ≥ 2.5, small ≥ 1.5, negligible < 1.5, based on Cohen’s (Cohen 1988) rule of thumb, and using a pragmatic decision about how to treat intermediate values | |||||
| Comparison | No. of comparisons with positive direct of effect1 | Median effect size across all comparisons2 | Median effect size across all comparisons without unit of analysis errors3 | No. of comparisons showing statistically significant effects4 | Interpretation of median effect size across all comparisons ( Cohen 1988)5 |
| Mass media vs. control | |||||
| Immediate follow‐up | 12/15 | ‐0.38 | ‐0.38 | 6/15 (+), 1/15 (‐) | Small |
| 1 to 8 weeks follow‐up | 3/5 | ‐0.38 | ‐0.38 | 2/5 (+) | Small |
| 6 to 9 months follow‐up | 3/3 | ‐0.49 | ‐0.49 | 1/3 (+) | Small‐to‐medium |
| Mass media vs. control by income of country | |||||
| Upper middle income | 1/1 | ‐1.69 | ‐1.69 | 1/1 | Large |
| High income | 14/18 | ‐0.42 | ‐0.42 | 7/18 (+) 1/18 (‐) | Small |
| Mass media vs. control by if 2+ mass media components | |||||
| 2+ mass media components | 4/6 | ‐0.49 | ‐0.49 | 3/6 (+) | Small‐to‐medium |
| One mass media component | 12/13 | ‐0.34 | ‐0.34 | 5/13 (+) 1/13 (‐) | Small |
| Mass media vs. control by if combined with non‐mass media | |||||
| With non‐mass media | 2/2 | ‐0.42 | ‐0.42 | 0/2 | Small |
| Mass media alone | 13/17 | ‐0.43 | ‐0.43 | 8/17 (+) 1/17 (‐) | Small |
| Mass media vs. control by presence of narratives | |||||
| First‐person narratives | 8/10 | ‐0.51 | ‐0.51 | 6/10 (+) 1/10 (‐) | Medium |
| Third‐person narratives | 4/5 | ‐0.03 | ‐0.03 | 2/5 (+) | Negligible |
| No narratives | 5/7 | ‐0.27 | ‐0.27 | 3/7 (+) 1/7 (‐) | Small |
| Mass media vs. control by celebrity narratives | |||||
| Celebrity narratives | 1/1 | ‐0.23 | ‐0.23 | 0/1 | Small |
| Non‐celebrity narratives | 11/15 | ‐0.48 | ‐0.44 | 7/15 (+) 1/15 (‐) | Small |
| Mass media vs. control by fictional narratives | |||||
| Fictional narratives | 2/3 | ‐0.42 | ‐0.42 | 1/3 (+) | Small |
| Non‐fictional narratives | 10/12 | ‐0.47 | ‐0.47 | 6/12 (+) 1/12 (‐) | Small |
| Mass media vs. control by type of message | |||||
| Biomedical | 1/2 | 0.99 | ‐0.42 | 1/2 (+) 1/2 (‐) | Large |
| Social inclusion/human rights | 1/1 | ‐2.94 | ‐2.94 | 1/1 (+) | Large |
| Recovery‐oriented | 5/5 | ‐0.30 | ‐0.30 | 1/5 (+) | Small |
| Negative impact of mental illness | 1/2 | ‐0.13 | ‐0.13 | 0/2 | Negligible |
| Seek professional care | 2/3 | ‐0.43 | ‐0.43 | 2/3 (+) | Small |
| Not to blame | 3/3 | ‐0.51 | ‐0.51 | 3/3 (+) | Medium |
| Hallucinatory experience | 1/2 | 0.22 | 0.22 | 1/2 (‐) | Small |
| Multiple messages | 3/4 | ‐0.70 | ‐0.71 | 1/4 (+) | Medium |
| Mass media vs. control by type of media | |||||
| Internet | 3/4 | ‐0.30 | ‐0.30 | 2/4 (+) | Small |
| Audiovisual | 7/10 | ‐0.47 | ‐0.47 | 5/10 (+) 1/10 (‐) | Small |
| Audio | 1/2 | 0.22 | 0.22 | 1/2 (‐) | Small |
| | 6/6 | ‐0.46 | ‐0.46 | 4/5 (+) | Small |
| [1] Stigma‐reducing [2] Excluding study with median and IQR data only (Kerby 2008). When there was an even number of effect sizes the median reported is the mean of the two middle values. [3] This excludes cluster trials not adjusted for study design by the authors and without a study‐derived intra‐class correlation co‐efficient (Penn 2003; Coleman 2005) [4] (+) means in stigma‐reducing direction, (‐) means in stigma increasing direction. Excluding study with median and IQR data only (Kerby 2008) [5] SMDs large ≥ 0.8; medium ≥ 0.5, small ≥ 0.2, negligible < 0.2, based on Cohen’s (Cohen 1988) rule of thumb, and using a pragmatic decision about how to treat intermediate values | |||||
| Study ID
| Measure | Intervention arm | Intervention group summary statistic | N(I) | Control group summary statistic | N(C) | Effect estimate/test statistic and P value/95% CI | |
|
| Psychiatric Knowledge Survey | A (Internet education) | Immediate follow‐up: 90.5% items correct Six‐months follow‐up: 65.6% items correct | 69 | 43.9% items correct | 48 | Pre‐post Χ2 P value < 0.0001 | |
| B (Printed documents) | Immediate follow‐up: 56.3% items correct Six‐months follow‐up: 49.6% items correct | 76 | 43.9% items correct | 48 | Pre‐post Χ2 P value < 0.0001 | |||
| Four knowledge items, beliefs about depression treatments selected | A (CD‐ROM) | 65.8% | 73 | 52.4%
| 82 | OR for pre‐post intervention interactions = 2.11 | ||
| B (manual) | 67.9% | 83 | 52.4% | 82 | OR for pre‐post intervention interactions = 3.64 | |||
| Seven knowledge items, item 1 (what is mental illness) selected | A (standard video) | 96.6% (29/30) | 30 | 76.7% (23/30) | 30 | OR = 8.83 (95% CI 1.01 to 76.96) | ||
| B (culturally specific video) | 96.6% (29/30) | 30 | 76.7% (23/30) | 30 | OR = 8.83 (95% CI 1.01 to 76.96) | |||
| Knowledge of Mental Illness scale | Booklet | 3.22 (1.48) | 301 | 3.03 (1.41) | 391 | Adjusted mean difference = 0.20, 95% CI ‐0.06 to 0.46, P = 0.133) | ||
| [1] Outcome measure used in two previous studies (Jorm 1997; Griffiths 2004); control group same for both intervention arms; statistic from paper, OR or SMD not calculable. [2] Four items, if recognised depression/schizophrenia from vignettes of person portrayed as meeting DSM‐IV‐TR criteria for the conditions DSM (Jorm 1997); two items developed for study: beliefs about treatments for schizophrenia/depression (% of all type treatments deemed by authors to be helpful endorsed by respondent; outcome for review as specified per protocol (Brennan 2009); data from earliest follow‐up time point (1 month). N assumed from consort diagram as not stated. [3] Items developed for study, dichotomous (correct or not); item 1 selected as knowledge outcome for review as specified per protocol [Grimshaw 2003] [4] Six‐item scale developed for study; continuous scale; linear regression model fitted including a random effect for clustering by sampling design (19 areas, average observations per cluster 36); from authors dataset; results presented are unadjusted means (SD) by arm along with the adjusted mean difference between arms, corresponding 95% confidence interval and P value. | ||||||||
| Intervention A (Internet education) %, n = 69 | Intervention B (printed articles) %, n = 76 | |
| Liked educational experience in general (yes/probably yes) | 97.1 | 89.3 |
| Topic is important (yes/probably yes) | 100 | 97.4 |
| Content is useful (y) (yes/probably yes) | 98.6 | 90.7 |
| Content is interesting (y) (yes/probably yes) | 100 | 86.8 |
| Content is unpleasant (no/probably no) | 81.2 | 73.3 |
| Content is difficult to understand (no/probably no) | 89.9 | 61.8 |
| Liked way information is presented (y) (yes/probably yes) | 87.0 | 60.5 |
| Intervention A (CD‐ROM) %, n = 63 to 64 | Intervention B (manual) %, n = 62 to 66 | |
| Read most/all of material | 95.3 | 100.0 |
| Material was easy/very easy to understand | 96.9 | 97.0 |
| Learnt a great deal/a fair bit from material | 90.6 | 90.1 |
| Material was useful/very useful | 93.8 | 98.4 |
| Will use intervention in future | 73.0 | 90.3 |
| Would probably/definitely recommend intervention to others | 96.9 | 98.4 |
| Yoshida 2002 (N = 106)1,2 | Mean (SD) |
|
| Favourability rating (1 to 5) | 3.67 (0.85) | |
| Looking forward to next issue of booklet rating (1 to 5) | 3.67 (1.04) | |
| Recommendation to others rating (1 to 5) | 3.29 (0.78) | |
| [1] Among participants who were aware of the intervention [2] High rating indicates a positive audience reaction | ||
| Outcome or subgroup title | No. of studies | No. of participants | Statistical method | Effect size |
| 1 Discrimination (Immediate) Show forest plot | 3 | Std. Mean Difference (IV, Random, 95% CI) | Totals not selected | |
| 2 Discrimination Show forest plot | 2 | Odds Ratio (Random, 95% CI) | Totals not selected | |
| 2.1 Immediate | 1 | Odds Ratio (Random, 95% CI) | 0.0 [0.0, 0.0] | |
| 2.2 6 ‐ 9 months | 1 | Odds Ratio (Random, 95% CI) | 0.0 [0.0, 0.0] | |
| 3 Prejudice Show forest plot | 15 | Std. Mean Difference (IV, Random, 95% CI) | Totals not selected | |
| 3.1 Immediate | 12 | Std. Mean Difference (IV, Random, 95% CI) | 0.0 [0.0, 0.0] | |
| 3.2 1 week ‐ 2 months | 4 | Std. Mean Difference (IV, Random, 95% CI) | 0.0 [0.0, 0.0] | |
| 3.3 6 ‐ 9 months | 2 | Std. Mean Difference (IV, Random, 95% CI) | 0.0 [0.0, 0.0] | |
| 4 Prejudice Show forest plot | 3 | Std. Mean Difference (Random, 95% CI) | Totals not selected | |
| 4.1 Immediate | 2 | Std. Mean Difference (Random, 95% CI) | 0.0 [0.0, 0.0] | |
| 4.2 6 ‐ 9 months | 1 | Std. Mean Difference (Random, 95% CI) | 0.0 [0.0, 0.0] | |
| Outcome or subgroup title | No. of studies | No. of participants | Statistical method | Effect size |
| 1 Prejudice (at earliest follow‐up time point) Show forest plot | 15 | Std. Mean Difference (IV, Random, 95% CI) | Totals not selected | |
| 1.1 Upper‐middle income | 1 | Std. Mean Difference (IV, Random, 95% CI) | 0.0 [0.0, 0.0] | |
| 1.2 High income | 14 | Std. Mean Difference (IV, Random, 95% CI) | 0.0 [0.0, 0.0] | |
| Outcome or subgroup title | No. of studies | No. of participants | Statistical method | Effect size |
| 1 Prejudice (at earliest follow‐up time point) Show forest plot | 15 | Std. Mean Difference (IV, Random, 95% CI) | Totals not selected | |
| 1.1 Multiple mass media components | 4 | Std. Mean Difference (IV, Random, 95% CI) | 0.0 [0.0, 0.0] | |
| 1.2 One mass media component | 11 | Std. Mean Difference (IV, Random, 95% CI) | 0.0 [0.0, 0.0] | |
| Outcome or subgroup title | No. of studies | No. of participants | Statistical method | Effect size |
| 1 Prejudice (at earliest follow‐up time point) Show forest plot | 15 | Std. Mean Difference (IV, Random, 95% CI) | Totals not selected | |
| 1.1 Mass media combined with non‐mass media | 1 | Std. Mean Difference (IV, Random, 95% CI) | 0.0 [0.0, 0.0] | |
| 1.2 Mass media alone | 14 | Std. Mean Difference (IV, Random, 95% CI) | 0.0 [0.0, 0.0] | |
| Outcome or subgroup title | No. of studies | No. of participants | Statistical method | Effect size |
| 1 Prejudice (at earliest follow‐up time point) Show forest plot | 15 | Std. Mean Difference (IV, Random, 95% CI) | Totals not selected | |
| 1.1 First‐person narratives | 7 | Std. Mean Difference (IV, Random, 95% CI) | 0.0 [0.0, 0.0] | |
| 1.2 Third‐person narratives | 4 | Std. Mean Difference (IV, Random, 95% CI) | 0.0 [0.0, 0.0] | |
| 1.3 No narratives / none stated | 7 | Std. Mean Difference (IV, Random, 95% CI) | 0.0 [0.0, 0.0] | |
| Outcome or subgroup title | No. of studies | No. of participants | Statistical method | Effect size |
| 1 Prejudice (at earliest follow‐up time point) Show forest plot | 11 | Std. Mean Difference (IV, Random, 95% CI) | Totals not selected | |
| 1.1 Celebrity | 1 | Std. Mean Difference (IV, Random, 95% CI) | 0.0 [0.0, 0.0] | |
| 1.2 Non‐celebrity | 11 | Std. Mean Difference (IV, Random, 95% CI) | 0.0 [0.0, 0.0] | |
| Outcome or subgroup title | No. of studies | No. of participants | Statistical method | Effect size |
| 1 Prejudice Show forest plot | 11 | Std. Mean Difference (IV, Random, 95% CI) | Totals not selected | |
| 1.1 Fictional narrative | 2 | Std. Mean Difference (IV, Random, 95% CI) | 0.0 [0.0, 0.0] | |
| 1.2 Non‐fictional narrative | 9 | Std. Mean Difference (IV, Random, 95% CI) | 0.0 [0.0, 0.0] | |
| Outcome or subgroup title | No. of studies | No. of participants | Statistical method | Effect size |
| 1 Prejudice (at earliest follow‐up time point) Show forest plot | 15 | Std. Mean Difference (IV, Fixed, 95% CI) | Totals not selected | |
| 1.1 Biomedical | 1 | Std. Mean Difference (IV, Fixed, 95% CI) | 0.0 [0.0, 0.0] | |
| 1.2 Social inclusion / human rights | 1 | Std. Mean Difference (IV, Fixed, 95% CI) | 0.0 [0.0, 0.0] | |
| 1.3 Recovery‐oriented | 4 | Std. Mean Difference (IV, Fixed, 95% CI) | 0.0 [0.0, 0.0] | |
| 1.4 Negative impact of mental illness | 2 | Std. Mean Difference (IV, Fixed, 95% CI) | 0.0 [0.0, 0.0] | |
| 1.5 Seek professional care | 3 | Std. Mean Difference (IV, Fixed, 95% CI) | 0.0 [0.0, 0.0] | |
| 1.6 Not to blame | 3 | Std. Mean Difference (IV, Fixed, 95% CI) | 0.0 [0.0, 0.0] | |
| 1.7 This is hallucinatory experience | 2 | Std. Mean Difference (IV, Fixed, 95% CI) | 0.0 [0.0, 0.0] | |
| 1.8 Multiple primary messages | 2 | Std. Mean Difference (IV, Fixed, 95% CI) | 0.0 [0.0, 0.0] | |
| Outcome or subgroup title | No. of studies | No. of participants | Statistical method | Effect size |
| 1 Prejudice (at earliest follow‐up time point)) Show forest plot | 15 | Std. Mean Difference (IV, Random, 95% CI) | Totals not selected | |
| 1.1 Internet (also includes CD‐ROM) | 4 | Std. Mean Difference (IV, Random, 95% CI) | 0.0 [0.0, 0.0] | |
| 1.2 Recorded ‐ audiovisual | 7 | Std. Mean Difference (IV, Random, 95% CI) | 0.0 [0.0, 0.0] | |
| 1.3 Recorded ‐ audio | 2 | Std. Mean Difference (IV, Random, 95% CI) | 0.0 [0.0, 0.0] | |
| 1.4 Print | 5 | Std. Mean Difference (IV, Random, 95% CI) | 0.0 [0.0, 0.0] | |