Anticoagulación para la tromboprofilaxis perioperatoria en pacientes con cáncer
Resumen
Antecedentes
La elección de la tromboprofilaxis perioperatoria apropiada para los pacientes con cáncer depende de los efectos beneficiosos y perjudiciales relativos de los diferentes anticoagulantes.
Objetivos
Examinar de forma sistemática la evidencia de la eficacia y la seguridad relativas de los anticoagulantes para la tromboprofilaxis perioperatoria en los pacientes con cáncer.
Métodos de búsqueda
Esta actualización de la revisión sistemática se basó en los hallazgos de una búsqueda bibliográfica exhaustiva realizada el 14 de junio de 2018 que incluyó una importante búsqueda electrónica en el Registro Cochrane Central de Ensayos Controlados (Cochrane Central Register of Controlled Trials, CENTRAL, 2018, número 6), MEDLINE (Ovid) y Embase (Ovid); una búsqueda manual en resúmenes de congresos; la verificación de las referencias de los estudios incluidos; la búsqueda de los estudios en curso y el uso de la función de "citas relacionadas" en PubMed.
Criterios de selección
Ensayos controlados aleatorizados (ECA) que reclutaron a pacientes con cáncer sometidos a una intervención quirúrgica y que evaluaron los efectos de la heparina de bajo peso molecular (HBPM), la heparina no fraccionada (HNF) o el fondaparinux sobre la mortalidad, la trombosis venosa profunda (TVP), la embolia pulmonar (EP), los resultados hemorrágicos y la trombocitopenia.
Obtención y análisis de los datos
Mediante un formulario estandarizado se extrajeron los datos por duplicado sobre el diseño de los estudios, los participantes, los resultados de las intervenciones de interés y el riesgo de sesgo. Los resultados de interés incluyeron mortalidad por todas las causas, EP, tromboembolia venosa (TEV) sintomática, TVP asintomática, hemorragias graves, hemorragias leves, síndrome posflebítico, calidad de vida relacionada con la salud y trombocitopenia. La certeza de la evidencia para cada resultado se evaluó mediante el enfoque GRADE (GRADE Handbook).
Resultados principales
De las 7670 citas únicas identificadas, se incluyeron 20 ECA con 9771 pacientes con cáncer asignados al azar que recibieron anticoagulación profiláctica preoperatoria. Se identificaron siete informes de siete ECA nuevos para esta actualización.
Los metanálisis no descartaron de manera concluyente un efecto beneficioso o perjudicial de la HBPM en comparación con la HNF en los siguientes resultados: mortalidad (riesgo relativo [RR] 0,82; intervalo de confianza [IC] del 95%: 0,63 a 1,07; diferencia de riesgos [DR] 9 menos por 1000; IC del 95%: 19 menos a 4 más; evidencia de certeza moderada), EP (RR 0,49; IC del 95%: 0,17 a 1,47; DR 3 menos por 1000, IC del 95%: 5 menos a 3 más; evidencia de certeza moderada), TVP sintomática (RR 0,67; IC del 95%: 0,27 a 1,69; DR 3 menos por 1000; IC del 95%: 7 menos a 7 más; evidencia de certeza moderada), TVP asintomática (RR 0,86; IC del 95%: 0,71 a 1,05; DR 11 menos por 1000; IC del 95%: 23 menos a 4 más; evidencia de certeza baja), hemorragia grave (RR 1,01; IC del 95%: 0,69 a 1,48; DR 0 menos por 1000; IC del 95%: 10 menos a 15 más; evidencia de certeza moderada), hemorragia leve (RR 1,01; IC del 95%: 0,76 a 1,33; DR 1 más por 1000; IC del 95%: 34 menos a 47 más; evidencia de certeza moderada), reintervención por hemorragia (RR 0,93; IC del 95%: 0,57 a 1,50; DR 4 menos por 1000; IC del 95%: 22 menos a 26 más; evidencia de certeza moderada), transfusión intraoperatoria (diferencia de medias [DM] ‐35,36 ml; IC del 95%: ‐253,19 a 182,47; evidencia de certeza baja), transfusión posoperatoria (DM 190,03 ml; IC del 95%: ‐23,65 a 403,72; evidencia de certeza baja), y trombocitopenia (RR 3,07; IC del 95%: 0,32 a 29,33; DR 6 más por 1000; IC del 95%: 2 menos a 82 más; evidencia de certeza moderada). La HBPM se asoció con una menor incidencia de hematomas en las heridas (RR 0,70; IC del 95%: 0,54 a 0,92; DR 26 menos por 1000; IC del 95%: 39 menos a 7 menos; evidencia de certeza moderada). En los metanálisis se encontraron los siguientes resultados adicionales: resultados de pérdida de sangre intraoperatoria (DM ‐6,75 ml; IC del 95%: ‐85,49 a 71,99; evidencia de certeza moderada) y volumen de drenaje posoperatorio (DM 30,18 ml; IC del 95%: ‐36,26 a 96,62; evidencia de certeza moderada).
Además, los metanálisis no descartaron de manera concluyente un efecto beneficioso o perjudicial de la HBPM en comparación con fondaparinux en los siguientes resultados: cualquier TEV (TVP o EP, o ambos; RR 2,51; IC del 95%: 0,89 a 7,03; DR 57 más por 1000; IC del 95%: 4 menos a 228 más; evidencia de certeza baja), hemorragia grave (RR 0,74; IC del 95%: 0,45 a 1,23; DR 8 menos por 1000; IC del 95%: 16 menos a 7 más; evidencia de certeza baja), hemorragia leve (RR 0,83; IC del 95%: 0,34 a 2,05; DR 8 menos por 1000; IC del 95%: 33 menos a 52 más; evidencia de certeza baja), trombocitopenia (RR 0,35; IC del 95%: 0,04 a 3,30; DR 14 menos por 1000; IC del 95%: 20 menos a 48 más; evidencia de certeza baja), cualquier EP (RR 3.13; IC del 95%: 0,13 a 74,64; DR 2 más por 1000; IC del 95%: 1 menos a 78 más; evidencia de certeza baja) y el volumen del drenaje posoperatorio (DM ‐20,00 ml; IC del 95%: ‐114,34 a 74,34; evidencia de certeza baja)
Conclusiones de los autores
No se encontraron diferencias entre la tromboprofilaxis perioperatoria con HBPM versus HNF y HBPM en comparación con el fondaparinux en los efectos sobre la mortalidad, los resultados tromboembólicos, la hemorragia grave o la hemorragia leve en los pacientes con cáncer. Hubo una menor incidencia de hematomas en las heridas con HBPM en comparación con HNF.
PICOs
Resumen en términos sencillos
Anticoagulantes para la prevención de los coágulos sanguíneos en pacientes con cáncer sometidos a cirugía
Antecedentes
Los pacientes con cáncer sometidos a cirugía tienen un mayor riesgo de coágulos sanguíneos. Los diluyentes de la sangre (anticoagulantes) que se administran para prevenir estos coágulos incluyen la heparina no fraccionada (HNF) infundida por vía intravenosa (en una vena), la heparina de bajo peso molecular (HBPM) inyectada por vía subcutánea (bajo la piel) una o dos veces al día y el fondaparinux. Estos anticoagulantes pueden tener perfiles diferentes de eficacia y de seguridad.
Características de los estudios
Se buscaron en las bases de datos científicas ensayos clínicos sobre los efectos de los anticoagulantes en la muerte, la embolia pulmonar (coágulo sanguíneo en los pulmones), la trombosis venosa profunda (coágulo sanguíneo en las venas de las piernas), los hematomas, las hemorragias y la necesidad de transfusión de sangre en los pacientes con cáncer sometidos a cirugías. Se incluyeron los ensayos con adultos y niños de cualquier edad o sexo con tumores sólidos o cáncer de la sangre, independientemente del tipo de tratamiento del cáncer. La evidencia está actualizada hasta el 14 de junio de 2018.
Resultados clave
Se encontraron 20 estudios que incluyeron 9771 pacientes con cáncer. La evidencia no identificó diferencias entre los efectos de la HBPM y la HNF en la muerte, los coágulos sanguíneos o la hemorragia. Hubo menos hematomas alrededor de la herida después de una cirugía con HBPM en comparación con HNF. El fondaparinux puede haber reducido el riesgo de formación de un coágulo sanguíneo.
Fiabilidad de la evidencia
La fiabilidad de la evidencia varió de baja a moderada entre los resultados de interés.
Authors' conclusions
Summary of findings
| LMWH prophylaxis compared to UFH prophylaxis in people with cancer without VTE undergoing a surgery | |||||
| Patient or population: People with cancer with perioperative thromboprophylaxis | |||||
| Outcomes | № of participants | Certainty of the evidence | Relative effect | Anticipated absolute effects* (95% CI) | |
| Risk with UFH prophylaxis | Risk difference with LMWH prophylaxis | ||||
| Mortality | 4260 | ⊕⊕⊕⊝ | RR 0.82 | Study population | |
| 51 per 1000 | 9 fewer per 1000 | ||||
| Any PE | 5588 | ⊕⊕⊕⊝ | RR 0.49 | Study population | |
| 6 per 1000 | 3 fewer per 1000 | ||||
| Symptomatic DVT | 2250 | ⊕⊕⊕⊝ | RR 0.67 | Study population | |
| 10 per 1000 | 3 fewer per 1000 | ||||
| Symptomatic DVT measured as asymptomatic DVT | 4938 | ⊕⊕⊝⊝ | RR 0.86 | Study population | |
| 79 per 1000 | 11 fewer per 1000 | ||||
| Major bleeding | 3473 | ⊕⊕⊕⊝ | RR 1.01 | Study population | |
| 31 per 1000 | 0 fewer per 1000 | ||||
| Minor bleeding | 1194 | ⊕⊕⊕⊝ | RR 1.01 | Study population | |
| 142 per 1000 | 1 more per 1000 | ||||
| Wound hematoma | 2827 | ⊕⊕⊕⊝ | RR 0.70 | Study population | |
| 86 per 1000 | 26 fewer per 1000 | ||||
| Reoperation for bleeding | 1246 | ⊕⊕⊕⊝ | RR 0.93 | Study population | |
| 51 per 1000 | 4 fewer per 1000 | ||||
| Intraoperative transfusion | 737 | ⊕⊕⊝⊝ | ‐ | MD 35.36 lower | |
| Postoperative transfusion | 734 | ⊕⊕⊝⊝ | ‐ | MD 190.03 higher | |
| Intraoperative blood loss | 761 | ⊕⊕⊕⊝ | ‐ | MD 6.75 lower | |
| Postoperative drain volume | 1459 | ⊕⊕⊕⊝ | ‐ | MD 30.18 higher | |
| Thrombocytopenia | 683 | ⊕⊕⊕⊝ | RR 3.07 | Study population | |
| 3 per 1000 | 6 more per 1000 | ||||
| *The risk in the intervention group (and its 95% confidence interval) is based on the assumed risk in the comparison group and the relative effect of the intervention (and its 95% CI). | |||||
| GRADE Working Group grades of evidence | |||||
| 1 Downgraded due to serious imprecision. 95% CI is consistent with the possibility for important benefit (19 fewer per 1000 absolute reduction) and possibility of no effect (4 more per 1000 absolute increase), including 197 events in total. 2 Downgraded due to serious imprecision. Low event rate, 26 events in total 3 Downgraded due to serious imprecision. Low event rate, 18 events in total 4 Downgraded by one level due to serious inconsistency, outcome measured as surrogate outcome 5 Downgraded due to serious imprecision. 95% CI is consistent with the possibility of important benefit (23 fewer more per 1000 absolute reduction) and possibility of harm (4 more per 1000 increase), including 367 events in total. 6 Downgraded due to serious imprecision. 95% CI is consistent with the possibility of important benefit (10 fewer more per 1000 absolute reduction) and possibility of harm (15 more per 1000 increase), including 107 events in total. 7 Downgraded due to serious imprecision. 95% CI is consistent with the possibility for important benefit (34 fewer per 1000 absolute reduction) and possibility of no effect (47 more per 1000 absolute increase), including 170 events in total. 8 Downgraded due to serious risk of bias; allocation concealment was not clear in 5 out of 6 studies. 9 Downgraded due to serious imprecision. Low event rate, 206 events in total 10 Downgraded due to serious imprecision. 95% CI is consistent with the possibility of benefit (22 fewer per 1000 absolute reduction) and possibility of important harm (26 more per 1000 absolute increase), including 61 events in total. 11 Downgraded due to serious inconsistency. I2= 98%; Dahan 1990 included patients undergoing thoracic surgery for cancer whereas Koppenhagen 1992 included patients undergoing major elective abdominal surgery 12 Downgraded due to serious imprecision. 95% CI is consistent with the possibility for important benefit (253.19 mL less) and possibility of harm (182.47 mL more) 13 Downgraded due to serious inconsistency. I2 = 83%; Dahan 1990 included patients undergoing thoracic surgery for cancer whereas Koppenhagen 1992 included patients undergoing major elective abdominal surgery 14 Downgraded due to serious imprecision. 95% CI is consistent with the possibility for important benefit (23.65mL less) and possibility of harm (40.3.72mL more) 15 Downgraded due to serious imprecision. 95% CI is consistent with the possibility for important benefit (85.49 mL less) and possibility of harm (71.99 mL more) 16 Downgraded due to serious imprecision. 95% CI is consistent with the possibility for important benefit (36.26 mL less) and possibility of harm (96.62 mL more) 17 Downgraded due to serious imprecision. Low event rate, 4 events in total | |||||
| LMWH prophylaxis compared to fondaparinux prophylaxis in people with cancer without VTE undergoing a surgical procedure | |||||
| Patient or population: People with perioperative thromboprophylaxis in people with cancer | |||||
| Outcomes | № of participants | Certainty of the evidence | Relative effect | Anticipated absolute effects* (95% CI) | |
| Risk with Fondaparinux prophylaxis | Risk difference with LMWH prophylaxis | ||||
| Mortality ‐ not reported | ‐ | ‐ | ‐ | ‐ | ‐ |
| Any VTE | 1806 | ⊕⊕⊝⊝ | RR 2.51 | Study population | |
| 38 per 1000 | 57 more per 1000 | ||||
| Major Bleeding | 2339 | ⊕⊕⊝⊝ | RR 0.74 | Study population | |
| 29 per 1000 | 8 fewer per 1000 | ||||
| Minor Bleeding | 398 | ⊕⊕⊝⊝ | RR 0.83 | Study population | |
| 49 per 1000 | 8 fewer per 1000 | ||||
| Thrombocytopenia | 282 | ⊕⊕⊝⊝ | RR 0.35 | Study population | |
| 21 per 1000 | 14 fewer per 1000 | ||||
| Any Pulmonary embolism | 116 | ⊕⊕⊝⊝ | RR 3.10 | Study population | |
| 0 per 1000 | 0 fewer per 1000 | ||||
| Low | |||||
| 1 per 1000 | 2 more per 1000 | ||||
| Postoperative drain volume | 116 | ⊕⊕⊝⊝ | ‐ | The mean postoperative drain volume was 0 ml | MD 20 ml lower |
| *The risk in the intervention group (and its 95% confidence interval) is based on the assumed risk in the comparison group and the relative effect of the intervention (and its 95% CI). | |||||
| GRADE Working Group grades of evidence | |||||
| 1 Downgraded by one level for concerns about both imprecision and indirectness. 95% CI is consistent with the possibility for benefit (4 per 1000 absolute reduction) and possibility of important harm (22 per 1000 absolute increase), including 99 events in total. VTE events included both symptomatic and asymptomatic events for patients with cancer which introduces some level of indirectness. 2 Downgraded by one level due to high risk of bias (lack of allocation concealment and incomplete outcome data in Agnelli 2005; lack of blinding of patients and personnel and incomplete outcome data in Hata 2016 unclear allocation concealment in song 2018) 3 Although the event rate used from the fondaprinux arm includes asymptomatic events, it is very close to rate of symptomatic VTE (3.1%) found in a retrospective cohort Changolkar 2014 4 Downgraded for serious imprecision. 95% CI is consistent with the possibility for important benefit (16 per 1000 absolute reduction) and possibility of important harm (7 per 1000 absolute increase), including 60 events in total. 5 Downgraded for high risk of bias (lack of blinding of patients and personnel and incomplete outcome data in Hata 2016 and unclear allocation concealment in Song 2018) 6 Downgraded for serious imprecision. 95% CI is consistent with the possibility for important benefit (33 per 1000 absolute reduction) and possibility of important harm (52 per 1000 absolute increase), including 18 events in total. 7 Downgraded for high risk of bias (lack of blinding of patients and personnel and incomplete outcome data in Hata 2016) 8 Downgraded for serious imprecision. 95% CI is consistent with the possibility for important benefit (20 per 1000 absolute reduction) and possibility of important harm (48 per 1000 absolute increase), including 4 events in total. 9 Downgraded by two levels for very serious imprecision. 95% CI is consistent with the possibility for important benefit (1 per 1000 absolute reduction) and possibility of important harm (78 per 1000 absolute increase), including 1 event in total. 10 Downgraded due to serious imprecision. 95% CI is consistent with the possibility for important benefit (114.34 mL less) and possibility of harm (74.34 mL more) | |||||
Background
Description of the condition
People with cancer undergoing surgical procedures have a higher risk of venous thromboembolism (VTE) (deep venous thrombosis (DVT) or pulmonary embolism (PE), or both) than people without cancer (Gallus 1997; Kakkar 1970; Rahr 1992). It is estimated that cancer triples the risk of postoperative DVT (Edmonds 2004). Moreover, people with cancer and VTE have an increased risk of dying than people with VTE alone or with cancer alone (Levitan 1999; Sorensen 2000). It has been suggested that thromboprophylaxis might be less effective in people with cancer due to the prothrombotic state associated with malignancy (Flordal 1996; Gallus 1997).
Description of the intervention
Unfractionated heparin (UFH), and low‐molecular weight heparins (LMWH) do not have intrinsic anticoagulant activity but potentiate the activity of antithrombin III in inhibiting activated coagulation factors. These agents constitute indirect anticoagulants as their activity is mediated by plasma cofactors. Heparin and its low molecular weight derivatives are not absorbed orally and must be administered parenterally (Hirsh 1993). Both UFH and LMWH, in addition to fondaparinux, have been used for perioperative thromboprophylaxis in people with cancer undergoing surgery.
How the intervention might work
Through their anticoagulant effect, UFH and LMWH reduce the incidence of both DVT and PE and subsequently reduce the incidence of VTE‐associated mortality (Barritt 1960). At the same time, they increase the risk of bleeding that might be potentiated by the presence of surgical wounds.
Why it is important to do this review
Two systematic reviews found that heparins were superior to no anticoagulation in the prevention of DVT and PE in people undergoing colorectal (Borly 2005) or general surgery (Mismetti 2001). Mismetti 2001 found that among general surgery people, LMWH and UFH had similar efficacy and safety irrespective of cancer status. However, the authors did not provide the estimates of the relative effects of the two medications in people with cancer. The last update of this Cochrane systematic review (16 trials enrolling 12,890 participants) found no any significant differences in the relative benefits and harms of the two medications (Akl 2014).
Objectives
To systematically review the evidence for the relative efficacy and safety of anticoagulants for perioperative thromboprophylaxis in people with cancer.
Methods
Criteria for considering studies for this review
Types of studies
Randomized controlled trials (RCTs).
Types of participants
People with cancer planned to undergo a surgical intervention. People could have been of any age with either solid or hematologic cancer and at any stage of their cancer irrespective of the type of cancer therapy.
We included studies with subgroups of people with cancer that did not report subgroup specific data when people with cancer constituted 50% or more of the total population. Otherwise, we excluded them from the systematic review.
Types of interventions
Experimental arms: any anticoagulant.
-
Low‐molecular weight heparin (LMWH)
-
Unfractionated heparin (UFH)
-
Fondaparinux
We were interested in comparisons of any combination of the three management options listed above. We excluded studies that compared different types of LMWH or any anticoagulant to placebo. The protocol should have planned to provide all other co interventions (e.g. chemotherapy) similarly in the intervention and comparison group.
Types of outcome measures
Primary outcomes
-
All‐cause mortality.
Secondary outcomes
-
Pulmonary embolism (PE). PE events had to be suspected clinically, and diagnosed using an objective diagnostic test such as: pulmonary perfusion/ventilation scans, computed tomography, pulmonary angiography, or autopsy.
-
Symptomatic deep venous thrombosis (DVT). DVT events had to be suspected clinically, and diagnosed using an objective diagnostic test such as: venography, 125I‐fibrinogen‐uptake test, impedance plethysmography, or compression ultrasound.
-
Asymptomatic DVT. DVT detected by screening and diagnosed using an objective diagnostic test such as: venography, 125I‐fibrinogen‐uptake test, impedance plethysmography, or compression ultrasound.
-
Bleeding outcomes:
-
major bleeding: we accepted the authors' definitions of major bleeding
-
minor bleeding: we accepted the authors' definitions of minor bleeding
-
wound hematoma
-
reoperation for bleeding
-
transfusion (intraoperative, postoperative)
-
intraoperative blood loss
-
postoperative drain volume
-
-
Thrombocytopenia.
-
Health related quality of life.
Search methods for identification of studies
Electronic searches
The search was part of a comprehensive search for studies of anticoagulation in participants with cancer. We conducted comprehensive searches on 14 June 2018, following the original electronic searched in January 2007, February 2010, February 2013, and February 2016. We electronically searched the following databases: the Cochrane Central Register of Controlled Trials (CENTRAL; 2018, Issue 6), MEDLINE Ovid (starting 1946), and Embase Ovid (starting 1980). For each database, the search strategies combined terms for anticoagulants, terms for cancer, and a search filter for RCTs. We used no language restrictions. We listed the full search strategies for each of the electronic databases in Appendix 1; Appendix 2; and Appendix 3.
Searching other resources
We handsearched the conference proceedings of the American Society of Clinical Oncology (ASCO, starting with its first volume, 1982 up to June 2018) and of the American Society of Hematology (ASH, starting with its 2003 issue up to June 2018). We also searched ClinicalTrials.gov and World Health Organization International Clinical Trials Registry Platform for ongoing studies. We reviewed the reference lists of papers included in this review and of other relevant systematic reviews. We used the 'related citation' feature in PubMed to identify additional articles and 'citation tracking' of included studies in Web of Science Core Collection. In addition, we contacted experts in the field to check for unpublished and ongoing trials.
Data collection and analysis
Selection of studies
Two review authors (CFM and LAK) independently screened the title and abstract of identified citations for potential eligibility. We retrieved the full text of articles judged potentially eligible by at least one review author. Two review authors then independently screened the full‐text articles for eligibility using a standardized form with explicit inclusion and exclusion criteria (as detailed in the Criteria for considering studies for this review section). The two review authors resolved any disagreements about which articles were eligible by discussion or by consulting a third review author (EAA).
Data extraction and management
Two review authors (CFM and IGT) independently extracted data from each included study and resolved their disagreements by discussion. We aimed to collect data related to participants, interventions, outcomes, and others.
Participants
-
Number of people in each treatment arm
-
Number of people randomized to each treatment arm
-
Number of people followed up in each treatment arm
-
Number of withdrawals from treatment in each treatment arm
-
Demographic characteristics (e.g. age, sex)
-
Cancer characteristics (e.g. type, location, site of origin, stage, time since diagnosis, estimated life expectancy, current cancer treatments, performance status)
-
Description of the surgical procedure
-
History of VTE
-
Use of indwelling central venous catheters (CVC)
Interventions
-
Type of anticoagulant: LMWH, UFH, or fondaparinux
-
Dose: prophylactic versus therapeutic
-
Duration of treatment
-
Cointerventions including radiation therapy, chemotherapy, and hormonal therapy (type and duration)
Outcomes
We attempted to extract both time‐to‐event data (for all‐cause mortality) and categorical data (for all outcomes). However, none of the studies reported time‐to‐event data for people with cancer. For dichotomous data, we extracted data necessary to conduct a complete‐case analysis as the primary analysis. For continuous data, we extracted mean and standard deviation (SD) separately for each arm.
We attempted to contact study authors for incompletely reported data. We determined a priori to consider abstracts in the main analysis only if study authors supplied us with full reports of their methods and results.
Other
We extracted from each included trial any information on the following points:
-
source of funding
-
ethical approval
-
conflict of interest
-
intention‐to‐treat (ITT) analysis
Assessment of risk of bias in included studies
We assessed risk of bias at the trial level using Cochrane's 'Risk of bias' tool (Higgins 2011). Two review authors (CFM and LAK) independently assessed the risk of bias for each included trial and resolved any disagreements by discussion. 'Risk of bias' criteria included:
-
random sequence generation
-
allocation concealment
-
blinding of participants and personnel
-
blinding of outcome assessment
-
incomplete outcome data (percentage of follow‐up and whether this was addressed)
-
selective reporting
-
other bias (whether the trial was stopped early for benefit)
See Dealing with missing data section about assessing risk of bias associated with participants with missing data.
Measures of treatment effect
We collected and analyzed risk ratios (RRs) for categorical data, and mean differences (MD) for continuous data, with 95% confidence intervals (CI).
Unit of analysis issues
The unit of analysis was the individual participant.
Dealing with missing data
Determining participants with missing data
It was not clear whether certain participant categories (e.g. those described as "withdrew consent" or "experienced adverse events") were actually followed up by the trial authors (versus had missing participant data) (Akl 2016). To deal with this issue, we made the following considerations:
-
"ineligible participants," "did not receive the first dose" participant categories, which were defined prior to the initiation of the study intervention, most likely had missing participant data;
-
"withdrew consent," "lost to follow‐up" (LTFU), and "outcome not assessable" participant categories and other category explicitly reported as not being followed up, which were defined after the initiation of the study intervention, most likely had missing participant data;
-
"dead," "experienced adverse events," "noncompliant," and "discontinued prematurely" (and similarly described) participant categories, less likely have had missing participant data
Dealing with participants with missing data in the primary meta‐analysis
In the primary meta‐analysis, we used a complete‐case analysis approach, that is, we excluded participants considered to have missing data (Guyatt 2017).
For categorical data, we used the following calculations for each study arm:
-
denominator: (number of participants randomized) – (number of participants most likely with missing data, both pre‐ and postintervention initiation);
-
numerator: number of participants with observed events (i.e. participants who had at least one event for the outcome of interest during their available follow‐up time).
For continuous data, we planned to use the reported mean and SD for each study arm for participants actually followed up by the trial authors.
Assessing the risk of bias associated with participants with missing data
When the primary meta‐analysis of a specific outcome found a statistically significant effect, we conducted sensitivity meta‐analyses to assess the risk of bias associated with missing participant data. Those sensitivity meta‐analyses used a priori plausible assumptions about the outcomes of participants considered to have missing data. The assumptions we used in the sensitivity meta‐analyses were increasingly stringent in order to challenge the statistical significance of the results of the primary analysis progressively (Akl 2013; Ebrahim 2013).
For categorical data, and for RR showing a reduction in effect (RR less than 1), we used the following increasingly stringent but plausible assumptions (Akl 2013):
-
for the control arm, relative incidence (RI) among participants with missing data (LTFU) compared with participants with available data (FU) in the same arm (RILTFU/FU) = 1; for the intervention arm, RILTFU/FU = 1.5;
-
for the control arm, RILTFU/FU = 1; for the intervention arm, RILTFU/FU = 2;
-
for the control arm, RILTFU/FU = 1; for the intervention arm, RILTFU/FU = 3;
-
for the control arm, RILTFU/FU = 1; for the intervention arm, RILTFU/FU = 5.
For RR showing an increase in effect (RR greater than 1), we switched the above assumptions between the control and interventions arms (i.e. used RILTFU/FU = 1 for the intervention arm).
Specifically, we used the following calculations for each study arm:
-
denominator: (number of participants randomized) – (number of participants most likely with missing data, preintervention initiation);
-
numerator: (number of participants with observed events) + (number of participants most likely with missing data postintervention initiation, with assumed events).
Assumed events were calculated by applying the a priori plausible assumptions to the participants considered most likely with missing data postintervention initiation.
For continuous data, we planned to use the four strategies suggested by Ebrahim and colleagues (Ebrahim 2013). The strategies imputed the means for participants with missing data based on the means of participants actually followed up in individual trials included in the systematic review. To impute SD, we used the median SD from the control arms of all included trials (Ebrahim 2013).
Assessment of heterogeneity
We assessed heterogeneity among trials by visual inspection of forest plots, estimation of the percentage heterogeneity among trials that could not be ascribed to sampling variation (I2 test) (Higgins 2003), and by a formal statistical test of the significance of the heterogeneity (Deeks 2001). If there was evidence of substantial heterogeneity, we investigated and reported the possible reasons for this (see Subgroup analysis and investigation of heterogeneity section).
Assessment of reporting biases
We assessed for selective outcome reporting by trying to identify whether the study was included in a trial registry, whether a protocol was available, and whether the methods section provided a list of outcomes. We compared the list of outcomes from those sources to the outcomes reported in the published paper. Also, we created funnel plots to assess publication.
Data synthesis
For dichotomous data, we calculated the RR separately for each study (DerSimonian 1986; RevMan 2014), and for continuous data, we calculated the MD separately for each trial. When analyzing data related to participants who were reported as not compliant, we attempted to adhere to the principles of ITT analysis. We approached the issue of non‐compliance independently from that of missing data (Alshurafa 2012). We then pooled the results of the different studies using a random‐effects model.
'Summary of findings' tables
We created 'Summary of findings' tables and assessed the certainty of evidence for all outcomes using the GRADE approach (GRADE Handbook).
Subgroup analysis and investigation of heterogeneity
We planned to explore substantial heterogeneity by conducting subgroup analyses based on the characteristics of participants (type, severity, and stage of cancer, and whether people were on cancer treatment or not). We did not conduct any subgroup analyses because of the relatively small number of trials and the inclusion of different types of cancer in the same trial.
Sensitivity analysis
Unlike the 2014 update of this review, we included studies published as abstracts only in the sensitivity analysis. When the primary meta‐analysis of a specific outcome found a statistically significant effect, we conducted sensitivity meta‐analyses to assess the risk of bias associated with missing participant data.
Results
Description of studies
Results of the search
Figure 1 shows the study flow diagram. As of June 2018, the search strategy identified 7670 unique citations after removal of duplicates. In total, the title and abstract screening identified 167 citations as potentially eligible for this review. The full‐text screening of the 167 citations identified 32 full reports for 20 eligible RCTs (Agnelli 2005; Baykal 2001; Bergqvist 1990; Bergqvist 1997 (ENOXACAN); Boncinelli 2001; Dahan 1990; Encke 1988 (EFS); Fricker 1988; Gallus 1993; Goldhaber 2002; Hata 2016; Kakkar 1997; Kakkar 2005; Koppenhagen 1992; Onarheim 1986; Song 2018; Von Tempelhoff 1997; Von Tempelhoff 2000; Ward 1998), and one RCT published as an abstract (Godwin 1993). We excluded the remaining 135 full texts. One eligible study did not provide outcome data that could be included in the meta‐analysis so we summarized its results narratively (Kakkar 2005). We identified seven reports for six RCTs not included in previous version of this review. We identified one ongoing study (Safi 2011).

Study flow diagram. CVC: central venous catheter; LMWH: low‐molecular weight heparin; RCT: randomized controlled trial; UFH: unfractionated heparin; VTE: venous thromboembolism.
Included studies
We included 20 RCTs in this review (Agnelli 2005; Baykal 2001; Bergqvist 1990; Bergqvist 1997 (ENOXACAN); Boncinelli 2001; Dahan 1990; Encke 1988 (EFS); Fricker 1988; Gallus 1993; Godwin 1993; Goldhaber 2002; Hata 2016; Kakkar 1997; Kakkar 2005; Koppenhagen 1992; Onarheim 1986; Song 2018; Von Tempelhoff 1997; Von Tempelhoff 2000; Ward 1998). One of these trials was published as an abstract (Godwin 1993). See Characteristics of included studies table.
Participant characteristics
Trials were conducted in people with cancer undergoing the following types of surgery: gynecologic (four trials; Baykal 2001; Von Tempelhoff 1997; Von Tempelhoff 2000; Ward 1998), abdominal or pelvic (eight trials; Agnelli 2005; Bergqvist 1990; Bergqvist 1997 (ENOXACAN); Encke 1988 (EFS); Fricker 1988; Godwin 1993; Koppenhagen 1992; Onarheim 1986), thoracic (one trial; Dahan 1990), abdominal or thoracic (two trials; Gallus 1993; Song 2018), prostate (one trial; Boncinelli 2001), neurosurgery (one trial; Goldhaber 2002), urologic (one trial: Hata 2016), and unspecified (two trials; Kakkar 1997; Kakkar 2005). Mean age of participants varied from 46 to 71 years across included trials.
Interventions
Types of LMWH studied were: enoxaparin (four trials; Baykal 2001; Bergqvist 1997 (ENOXACAN); Goldhaber 2002; Hata 2016); dalteparin (five trials; Agnelli 2005; Bergqvist 1990; Fricker 1988; Onarheim 1986; Ward 1998); nadroparin (four trials; Boncinelli 2001; Dahan 1990; Encke 1988 (EFS); Song 2018); orgaran (one trial; Gallus 1993); normiflo (one trial; Godwin 1993); certoparin (two trials; Kakkar 2005; Von Tempelhoff 2000); clivarine (one trial; Kakkar 1997); and not specified (two trials; Koppenhagen 1992; Von Tempelhoff 1997). All trials started thromboprophylaxis preoperatively.
Outcomes
Comparison 1: low‐molecular weight heparin versus unfractionated heparin
-
Eight trials reported mortality (Bergqvist 1990; Bergqvist 1997 (ENOXACAN); Gallus 1993; Goldhaber 2002; Kakkar 1997; Koppenhagen 1992; Onarheim 1986; Von Tempelhoff 2000). Kakkar 2005 reported overall mortality in all trial participants but not by group.
-
14 trials reported PE (Baykal 2001; Bergqvist 1990; Bergqvist 1997 (ENOXACAN); Boncinelli 2001; Dahan 1990; Encke 1988 (EFS); Fricker 1988; Gallus 1993; Goldhaber 2002; Kakkar 1997; Koppenhagen 1992; Onarheim 1986; Von Tempelhoff 1997; Ward 1998). Kakkar 2005 reported overall incidence of PE in all trial participants but not by group.
-
Eight trials reported symptomatic DVT (Baykal 2001; Bergqvist 1997 (ENOXACAN); Boncinelli 2001; Fricker 1988; Goldhaber 2002; Koppenhagen 1992; Onarheim 1986; Ward 1998).
-
12 trials reported asymptomatic DVT (Bergqvist 1990; Bergqvist 1997 (ENOXACAN); Boncinelli 2001; Dahan 1990; Encke 1988 (EFS); Fricker 1988; Gallus 1993; Goldhaber 2002; Kakkar 1997; Koppenhagen 1992; Onarheim 1986; Von Tempelhoff 1997).
-
Nine trials reported major bleeding (Baykal 2001; Bergqvist 1997 (ENOXACAN); Boncinelli 2001; Dahan 1990; Fricker 1988; Gallus 1993; Goldhaber 2002; Kakkar 1997; Onarheim 1986).
-
Two trials reported minor bleeding (Bergqvist 1997 (ENOXACAN); Fricker 1988).
-
Six trials reported wound hematoma (Baykal 2001; Bergqvist 1990; Boncinelli 2001; Kakkar 1997; Koppenhagen 1992; Onarheim 1986).
-
Four trials reported reoperation for bleeding (Bergqvist 1997 (ENOXACAN); Boncinelli 2001; Gallus 1993; Onarheim 1986).
-
Two trials reported intraoperative transfusion (Dahan 1990; Koppenhagen 1992).
-
Two trials reported postoperative transfusion (Dahan 1990; Koppenhagen 1992).
-
Four trials reported intraoperative blood loss (Baykal 2001; Dahan 1990; Gallus 1993; Onarheim 1986).
-
Three trials reported postoperative drain volume (Baykal 2001; Encke 1988 (EFS); Koppenhagen 1992).
-
Two trials reported thrombocytopenia (Bergqvist 1997 (ENOXACAN); Onarheim 1986).
Comparison 2: low‐molecular weight heparin versus fondaparinux
-
One trial reported any PE (Song 2018)
-
Three trials reported VTE (Agnelli 2005; Hata 2016; Song 2018).
-
Three trials reported major bleeding (Agnelli 2005; Hata 2016; Song 2018).
-
One trial reported thrombocytopenia (Hata 2016).
-
One trial reported postoperative drain volume (Song 2018).
Excluded studies
We excluded 135 reports of 80 trials from this review for the following reasons: not population of interest, hospitalized people (11 studies); not population of interest, ambulatory people (27 studies); not population of interest, people with CVC (seven studies); not population of interest, people with VTE (19 studies): not comparison of interest, preoperative versus postoperative anticoagulation (two studies); not comparison of interest, mechanical versus pharmacologic (12 studies); not comparison of interest, different dosages of LMWH (one study); not comparison of interest, different dosages of UFH (two studies); not comparison of interest, UFH versus placebo (four studies); not comparison of interest, LMWH versus placebo (six studies); not comparison of interest, different types of LMWH (two studies); not comparison of interest, defibrotide versus UFH (one study); not comparison of interest, defibrotide versus placebo (one study); not comparison of interest, extended versus limited duration of anticoagulation (25 studies); not design of interest, a systematic review (one study); no outcomes of interest (two studies), and no outcome data available for cancer people (12 studies). See Characteristics of excluded studies table.
Risk of bias in included studies
Figure 2 presents the 'Risk of bias' graph while Figure 3 presents the 'Risk of bias' summary associated with the outcomes: mortality, PE, DVT, and major bleeding.
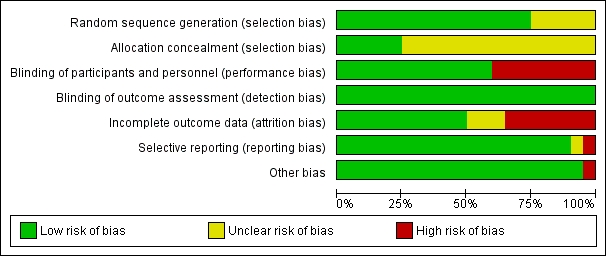
Risk of bias graph: review authors' judgments about each risk of bias item presented as percentages across all included studies.
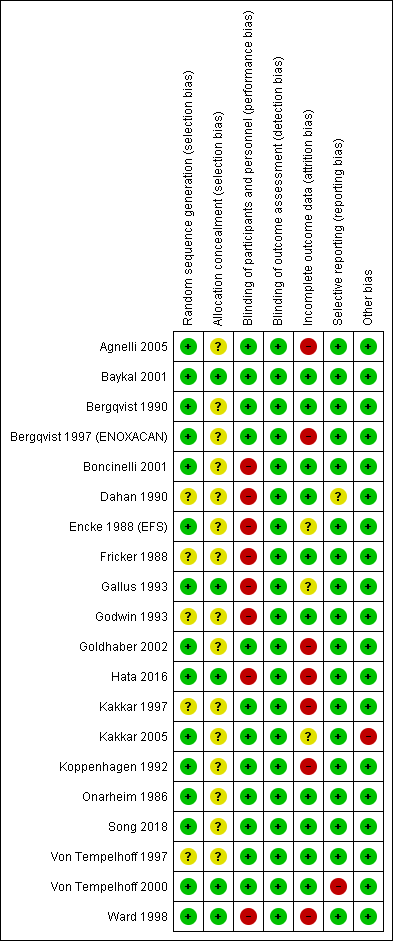
Risk of bias summary: review authors' judgments about each risk of bias item for each included study.
Allocation
The method of sequence generation was unclear in five studies (Dahan 1990; Fricker 1988; Godwin 1993; Kakkar 1997; Von Tempelhoff 1997), but adequate in the remaining one.
Allocation was adequately concealed in five trials (Baykal 2001; Gallus 1993; Hata 2016; Von Tempelhoff 2000; Ward 1998). It was unclear whether it was adequately concealed in the remaining 14 trials.
Blinding
Blinding of participants and personnel (performance bias)
We judged participants and personnel to be definitely blinded in 12 studies (Agnelli 2005; Baykal 2001; Bergqvist 1990; Bergqvist 1997 (ENOXACAN); Goldhaber 2002; Kakkar 1997; Kakkar 2005; Koppenhagen 1992; Onarheim 1986; Song 2018; Von Tempelhoff 1997; Von Tempelhoff 2000), and definitely not blinded in the remaining eight studies.
Blinding of outcome assessment (detection bias)
We judged outcome assessors to be definitely blinded in all 20 studies.
Incomplete outcome data
Follow‐up was satisfactory in all the trials with the following percentages: 72% in Agnelli 2005; 100% in Baykal 2001; 100% in Bergqvist 1990; 56% in Bergqvist 1997 (ENOXACAN); 100% in Boncinelli 2001; 100% in Dahan 1990; 100% in Encke 1988 (EFS); 100% in Fricker 1988; 95% in Gallus 1993; 100% in Godwin 1993; 96% in Goldhaber 2002; 94% in Hata 2016; 99% in Kakkar 1997; 100% in Kakkar 2005; 97% in Koppenhagen 1992; 100% in Onarheim 1986; 100% in Song 2018; 100% in Von Tempelhoff 1997; 100% in Von Tempelhoff 2000; and 97% in Ward 1998.
We judged incomplete outcome data to be with low risk of bias in 10 studies (Baykal 2001; Bergqvist 1990; Boncinelli 2001; Dahan 1990; Fricker 1988; Godwin 1993; Onarheim 1986; Song 2018; Von Tempelhoff 1997; Von Tempelhoff 2000); high risk in seven studies (Agnelli 2005; Bergqvist 1997 (ENOXACAN); Goldhaber 2002; Hata 2016; Kakkar 1997; Koppenhagen 1992; Ward 1998); and unclear risk of bias in the remaining studies.
Selective reporting
The outcomes listed in the methods section were reported in the results section for all trials. Von Tempelhoff 2000 appeared to have collected data on VTE outcomes but did not report them, so was at high risk of bias. It was unclear whether Dahan 1990 had any reporting bias.
Other potential sources of bias
The only trial that was stopped early was Kakkar 2005. We judged the associated risk of bias to be high because the reason to stop was that the study would not be sufficiently powered to show superiority of certoparin over UFH.
Effects of interventions
See: Summary of findings for the main comparison LMWH prophylaxis compared to UFH prophylaxis in people with cancer without VTE undergoing a surgery; Summary of findings 2 LMWH prophylaxis compared to fondaparinux prophylaxis in people with cancer without VTE undergoing a surgical procedure
Comparison 1: low‐molecular weight heparin versus unfractionated heparin
Fourteen trials reported LMWH versus UFH (Baykal 2001; Bergqvist 1990; Bergqvist 1997 (ENOXACAN); Boncinelli 2001; Dahan 1990; Encke 1988 (EFS); Fricker 1988; Gallus 1993; Goldhaber 2002; Kakkar 1997; Koppenhagen 1992; Onarheim 1986; Von Tempelhoff 1997; Ward 1998).
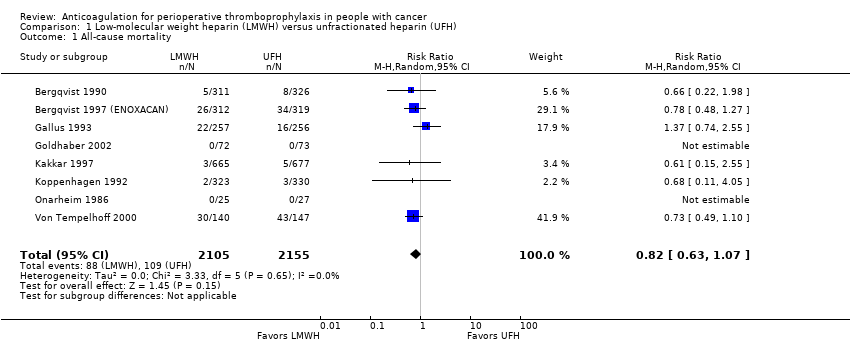
All‐cause mortality
Meta‐analysis of eight trials reporting data on 4260 participants did not conclusively rule out a mortality reduction with LMWH compared with UFH (RR 0.82, 95% CI 0.63 to 1.07; RD 9 fewer per 1000, 95% CI 19 fewer to 4 more; Analysis 1.1); the percentage of the variability in effect estimates that was due to heterogeneity between studies rather than sampling error (chance) was not important (I2 = 0%; ) (Bergqvist 1990; Bergqvist 1997 (ENOXACAN); Gallus 1993; Goldhaber 2002; Kakkar 1997; Koppenhagen 1992; Onarheim 1986; Von Tempelhoff 2000). Kakkar 2005 found no difference in outcomes between the two treatment regimens. The inverted funnel plot for the primary outcome of mortality did not suggest publication bias, but there were relatively few trials to permit an accurate assessment ().
The certainty of evidence was moderate (summary of findings Table for the main comparison).
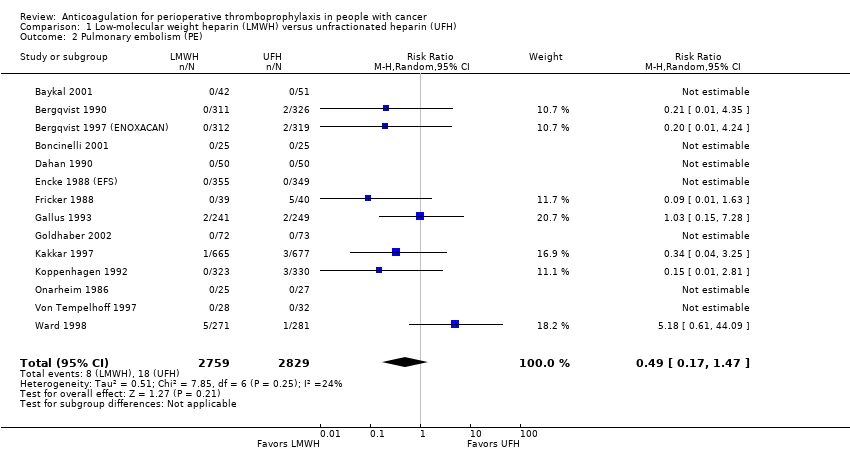
Pulmonary embolism
Meta‐analysis of 14 trials reporting data on 5588 participants did not conclusively rule out a reduction or increase in PE with LMWH compared with UFH (RR 0.49, 95% CI 0.17 to 1.47; RD 3 fewer per 1000, 95% CI 5 fewer to 3 more; I2 = 0%; Analysis 1.2) (Baykal 2001; Bergqvist 1990; Bergqvist 1997 (ENOXACAN); Boncinelli 2001; Dahan 1990; Encke 1988 (EFS); Fricker 1988; Gallus 1993; Goldhaber 2002; Kakkar 1997; Koppenhagen 1992; Onarheim 1986; Von Tempelhoff 1997; Ward 1998). These results did not change in a meta‐analysis including the study published as an abstract (RR 0.52, 95% CI 0.20 to 1.34; ) (Godwin 1993). The inverted funnel plot for PE did not suggest publication bias, but there were relatively few trials to permit an accurate assessment.
The certainty of evidence was moderate (summary of findings Table for the main comparison).
Symptomatic deep venous thrombosis
Meta‐analysis of eight trials reporting data on 2250 participants did not conclusively rule out a symptomatic DVT reduction or increase with LMWH compared with UFH (RR 0.67, 95% CI 0.27 to 1.69; RD 3 fewer per 1000, 95% CI 7 fewer to 7 more; I2 = 0%; Analysis 1.3) (Baykal 2001; Bergqvist 1997 (ENOXACAN); Boncinelli 2001; Fricker 1988; Goldhaber 2002; Koppenhagen 1992; Onarheim 1986; Ward 1998).
The certainty of evidence was moderate (summary of findings Table for the main comparison).
Asymptomatic deep venous thrombosis
Meta‐analysis of 12 trials reporting data on 4938 participants did not conclusively rule out a reduction in asymptomatic DVT with LMWH compared with UFH (RR 0.86, 95% CI 0.71 to 1.05; RD 11 fewer per 1000, 95% CI 23 fewer to 4 more; I2 = 0%;Analysis 1.4) (Bergqvist 1990; Bergqvist 1997 (ENOXACAN); Boncinelli 2001; Dahan 1990; Encke 1988 (EFS); Fricker 1988; Gallus 1993; Goldhaber 2002; Kakkar 1997; Koppenhagen 1992; Onarheim 1986; Von Tempelhoff 1997). These results did not substantively change in a meta‐analysis including the study published as an abstract (RR 0.87, 95% CI 0.70 to 1.07) (Godwin 1993). The inverted funnel plot for asymptomatic DVT did not suggest publication bias, but there were relatively few trials to permit an accurate assessment (Figure 10).
The certainty of evidence was low (summary of findings Table for the main comparison).
Bleeding outcomes
Major bleeding
Meta‐analysis of nine trials reporting data on 3473 participants did not conclusively rule out a reduction or increase in major bleeding with LMWH compared with UFH (RR 1.01, 95% CI 0.69 to 1.48; RD 0 fewer per 1000, 95% CI 10 fewer to 15 more; I2 = 0%; Analysis 1.5) (Baykal 2001; Bergqvist 1997 (ENOXACAN); Boncinelli 2001; Dahan 1990; Fricker 1988; Gallus 1993; Goldhaber 2002; Kakkar 1997; Onarheim 1986). The inverted funnel plot for major bleeding did not suggest publication bias, but there were relatively few trials to permit an accurate assessment.
The certainty of evidence was moderate (summary of findings Table for the main comparison).
Minor bleeding
Meta‐analysis of two trials reporting data on 1194 participants did not conclusively rule out a reduction or increase in minor bleeding with LMWH compared with UFH (RR 1.01, 95% CI 0.76 to 1.33; RD 1 more per 1000, 95% CI 34 fewer to 47 more; I2 = 0%; Analysis 1.6) (Bergqvist 1997 (ENOXACAN); Fricker 1988).
The certainty of evidence was moderate (summary of findings Table for the main comparison).
Wound hematoma
Meta‐analysis of six trials assessing 2827 participants found a reduction in wound hematomas with LMWH compared with UFH (RR 0.70, 95% CI 0.54 to 0.92; RD 26 fewer per 1000, 95% CI 39 fewer to 7 fewer; I2 = 0%; Analysis 1.7) (Baykal 2001; Bergqvist 1990; Boncinelli 2001; Kakkar 1997; Koppenhagen 1992; Onarheim 1986).
Since the primary meta‐analysis found a statistically significant effect, and to assess the risk of bias associated with missing participant data, we conducted sensitivity meta‐analyses used the priori plausible assumptions detailed in the Methods section. The effect estimate remained statistically significant even when using the most stringent plausible assumption (RR 0.73, 95% CI 0.56 to 0.95).
The certainty of evidence was moderate (summary of findings Table for the main comparison).
Reoperation for bleeding
Meta‐analysis of four trials reporting data on 1246 participants did not conclusively rule out a reduction or increase in re operations for bleeding with LMWH compared with UFH (RR 0.93, 95% CI 0.57 to 1.50; RD 4 fewer per 1000, 95% CI 22 fewer to 26 more; I2 = 0%; Analysis 1.8) (Bergqvist 1997 (ENOXACAN); Boncinelli 2001; Gallus 1993; Onarheim 1986).
The certainty of evidence was moderate (summary of findings Table for the main comparison).
Transfusion: intraoperative
Two trials reporting data on 737 participants found no difference in intraoperative transfusion volume with LMWH compared with UFH (MD ‐35.36 mL, 95% CI ‐253.19 to 182.47; Analysis 1.9) (Dahan 1990; Koppenhagen 1992).
The certainty of evidence was low (summary of findings Table for the main comparison).
Transfusion: postoperative
Two trials assessing 734 participants found no difference in postoperative transfusions with LMWH compared with UFH (MD 190.03 mL, 95% CI ‐23.65 to 403.72; Analysis 1.10) (Dahan 1990; Koppenhagen 1992).
The certainty of evidence was low (summary of findings Table for the main comparison).
Intraoperative blood loss
Meta‐analysis of four trials reporting data on 761 participants found no difference in intraoperative blood loss with LMWH compared with UFH (MD ‐6.75 mL, 95% CI to ‐85.49 to 71.99; Analysis 1.11) (Baykal 2001; Dahan 1990; Gallus 1993; Onarheim 1986).
The certainty of evidence was moderate (summary of findings Table for the main comparison).
Postoperative drain volume
Meta‐analysis of three trials reporting data on 1459 participants found no difference in postoperative drain volume with LMWH compared with UFH (MD 30.18 mL, 95% CI ‐36.26 to 96.62; Analysis 1.12) (Baykal 2001; Encke 1988 (EFS); Koppenhagen 1992).
The certainty of evidence was moderate (summary of findings Table for the main comparison).
Thrombocytopenia
Meta‐analysis of two trials reporting data on 683 participants did not conclusively rule out a thrombocytopenia reduction or increase with LMWH compared to UFH (RR 3.07, 95% CI 0.32 to 29.33; RD 6 more per 1000, 95% CI 2 fewer to 82 more; Analysis 1.13) (Bergqvist 1997 (ENOXACAN); Onarheim 1986). The RR was reduced substantively in a meta‐analysis including the study published as an abstract (Godwin 1993) (RR 1.20, 95% CI 0.41 to 3.50).
The certainty of evidence was moderate (summary of findings Table for the main comparison).
Heparin‐induced thrombocytopenia
We found no trials reporting the relative effects of LMWH and UFH on heparin‐induced thrombocytopenia (HIT).
Health related quality of life
We found no trials reporting the relative effects of LMWH and UFH on health related quality of life.
Comparison 2: low‐molecular weight heparin versus fondaparinux
Three trials compared LMWH versus fondaparinux (Agnelli 2005; Hata 2016; Song 2018).
All‐cause mortality
Neither trial reported all‐cause mortality.
Any pulmonary embolism
The one study reporting data on 116 participants did not rule out an increase or decrease risk of any PE with LMWH compared with fondaparinux (RR 3.13, 95% CI 0.13 to 74.64; RD 2 more per 1000, 95% CI 1 fewer to 78 more; Analysis 2.1) (Song 2018).
The certainty of evidence was low (summary of findings Table 2).
Symptomatic and asymptomatic deep venous thrombosis
Venous thromboembolism
Meta‐analysis of three trials reporting data on 1806 participants did not rule out an increase or decrease risk in VTE with LMWH compared with fondaparinux (RR 2.51, 95% CI 0.89 to 7.03; RD 57 more per 1000, 95% CI 4 fewer to 228 more; Analysis 2.2); I2 = 31%) (Agnelli 2005; Hata 2016; Song 2018).
The certainty of evidence was low (summary of findings Table 2).
Bleeding outcomes
Major bleeding
Meta‐analysis of three trials reporting data on 2339 participants did not rule out an increase or decrease in major bleeding with LMWH compared with fondaparinux (RR 0.74, 95% CI 0.45 to 1.23; RD 8 fewer per 1000, 95% CI 16 fewer to 7 more; I2 = 0%; Analysis 2.3) (Agnelli 2005; Hata 2016; Song 2018).
The certainty of evidence was low (summary of findings Table 2).
Minor bleeding
Meta‐analysis of two trials reporting data on 398 participants did not rule out an increase or decrease in minor bleeding with LMWH compared with fondaparinux (RR 0.83, 95% CI 0.34 to 2.05; RD 8 fewer per 1000, 95% CI 33 fewer to 52 more;;Analysis 2.4; ) (Hata 2016; Song 2018).
The certainty of evidence was low (summary of findings Table 2).
Wound hematoma
Neither trial reported wound hematoma.
Reoperation for bleeding
Neither trial reported reoperation for bleeding.
Transfusion: intraoperative
Neither trial reported intraoperative transfusion.
Transfusion: postoperative
Neither trial reported postoperative transfusion.
Intraoperative blood loss
Neither trial reported intraoperative blood loss.
Postoperative drain volume
The one study reporting data on 116 participants found no difference in postoperative drain volume with LMWH compared with fondaparinux (MD ‐20 mL, 95% CI ‐114.34 to 74.34; Analysis 2.5) (Song 2018).
The certainty of evidence was low (summary of findings Table 2).
Thrombocytopenia
The one study reporting data on 282 participants did not rule out an increase or decrease in thrombocytopenia with LMWH compared with fondaparinux (RR 0.35, 95% CI 0.04 to 3.30; RD 14 fewer per 1000, 95% CI 20 fewer to 48 more; Analysis 2.6) (Hata 2016).
The certainty of evidence was low (summary of findings Table 2).
Health related quality of life
We found no trials reporting the relative effects of LMWH an fondaparinux on health related quality of life.
Discussion
Summary of main results
We did not conclusively rule out either beneficial or harmful effects of LMWH compared with UFH; and LMWH compared with fondaparinux for the outcomes of mortality, symptomatic DVT, PE, minor bleeding, and major bleeding. There was a lower incidence of wound hematoma with LMWH compared to UFH; None of the trials reported on HIT. The certainty of evidence per outcome ranged from low to moderate.
Overall completeness and applicability of evidence
While the absence of a statistically significant difference might reflect a true absence of effect of LMWH on some VTE outcomes, this could also be related to insufficient power to detect important differences between drugs. Another potential explanation is the relatively low baseline risks for the different outcomes (e.g. the baseline risk for PE was 0.6%).
These trials recruited people with variety of cancer types and stages, which should increase the applicability of the results.
All included trials started anticoagulant treatment preoperatively. Consequently, it is not certain how the results apply to anticoagulant treatment started postoperatively. However, one systematic review found no statistically significant differences in blood loss when the first dose of enoxaparin was administered 12 hours before surgery versus postoperatively (Einstein 2007).
Quality of the evidence
For the comparison of LMWH versus UFH, we judged the certainty of evidence as moderate for mortality, PE, symptomatic DVT, asymptomatic DVT, minor bleeding, major bleeding, wound hematoma, reoperation for bleeding, intraoperative blood loss, postoperative drain volume, and thrombocytopenia, and as low for intraoperative transfusion and postoperative transfusion. The certainty of evidence per outcome ranged from low to moderate.
For the comparison of LMWH versus fondaparinux, we judged the certainty of evidence as low for all outcomes.
Screening participants for DVT may have biased the results of 13 included trials (Agnelli 2005; Bergqvist 1990; Bergqvist 1997 (ENOXACAN);Dahan 1990; Encke 1988 (EFS); Fricker 1988; Gallus 1993; Godwin 1993; Goldhaber 2002; Kakkar 1997; Koppenhagen 1992; Onarheim 1986; Song 2018). If screening detects thromboses, participants are typically therapeutically anticoagulated. Some of the participants with asymptomatic events may have developed symptomatic VTE, had screening testing not been undertaken and anticoagulant therapy not been administered. As a result, the number of symptomatic VTE events in this review, and the differential effect of LMWH versus UFH on symptomatic events, may have been underestimated.
Potential biases in the review process
Our systematic approach to searching, study selection, and data extraction should have minimized the likelihood of missing relevant trials. We excluded 12 trials that included participants with cancer as subgroups but did not report on their outcome data. The cancer subgroups in these trials included 3185 participants compared with 9771 randomized participants included in the current analysis. This may have introduced bias.
The relatively small number of trials and the inclusion of different types of malignancies, different types of surgical procedures, different dosing of anticoagulant medications, and different follow‐up periods in the same trials precluded us from conducting the subgroup analyses to explore effect modifiers.
Agreements and disagreements with other studies or reviews
One systematic review of thromboprophylaxis in colorectal surgery reported no differences between LMWH and UFH in their effects on preventing DVT or PE, or both (odds ratio (OR) 1.01, 95% CI 0.67 to 1.52) (Borly 2005). One systematic review compared the effects of UFH and LMWH thromboprophylaxis on thrombocytopenia and HIT (Martel 2005). Most of the included trials were in orthopedic surgery and only two trials prospectively examined HIT and reported 10 events (all in the UFH group). The meta‐analysis found an OR of 0.10 (95% CI 0.01 to 0.82) for HIT and 0.47 (95% CI 0.22 to 1.02) for thrombocytopenia, favoring LMWH. Another meta‐analysis comparing therapeutic doses of UFH and LMWH reported no differential effect on HIT (RR 1.33, 95% CI 0.77 to 2.30) (Morris 2007). One other systematic review comparing the effects of UFH and LMWH thromboprophylaxis reported no difference in minor complications, major complications, or the discontinuation of prophylaxis (Leonardi 2007).
Study flow diagram. CVC: central venous catheter; LMWH: low‐molecular weight heparin; RCT: randomized controlled trial; UFH: unfractionated heparin; VTE: venous thromboembolism.
Risk of bias graph: review authors' judgments about each risk of bias item presented as percentages across all included studies.
Risk of bias summary: review authors' judgments about each risk of bias item for each included study.
Comparison 1 Low‐molecular weight heparin (LMWH) versus unfractionated heparin (UFH), Outcome 1 All‐cause mortality.
Comparison 1 Low‐molecular weight heparin (LMWH) versus unfractionated heparin (UFH), Outcome 2 Pulmonary embolism (PE).
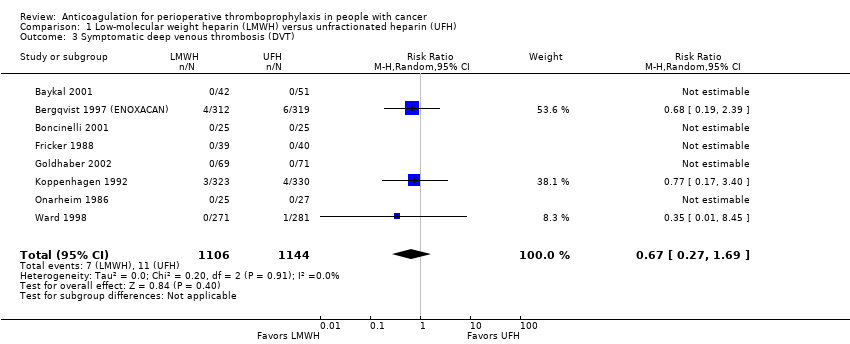
Comparison 1 Low‐molecular weight heparin (LMWH) versus unfractionated heparin (UFH), Outcome 3 Symptomatic deep venous thrombosis (DVT).
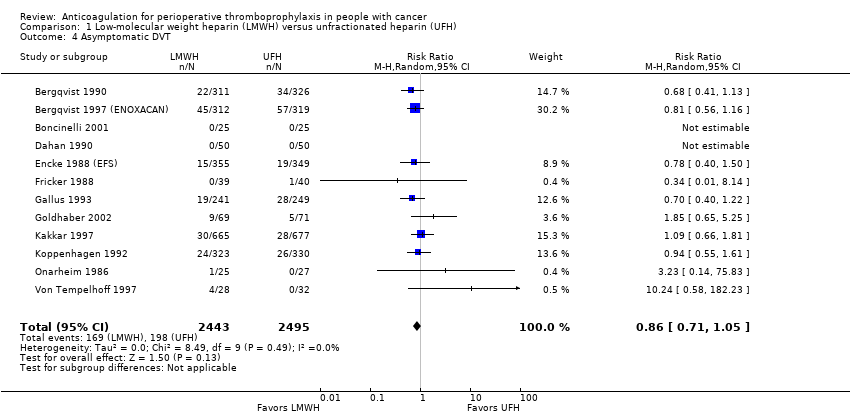
Comparison 1 Low‐molecular weight heparin (LMWH) versus unfractionated heparin (UFH), Outcome 4 Asymptomatic DVT.

Comparison 1 Low‐molecular weight heparin (LMWH) versus unfractionated heparin (UFH), Outcome 5 Major bleeding.

Comparison 1 Low‐molecular weight heparin (LMWH) versus unfractionated heparin (UFH), Outcome 6 Minor bleeding.

Comparison 1 Low‐molecular weight heparin (LMWH) versus unfractionated heparin (UFH), Outcome 7 Wound hematoma.

Comparison 1 Low‐molecular weight heparin (LMWH) versus unfractionated heparin (UFH), Outcome 8 Reoperation for bleeding.
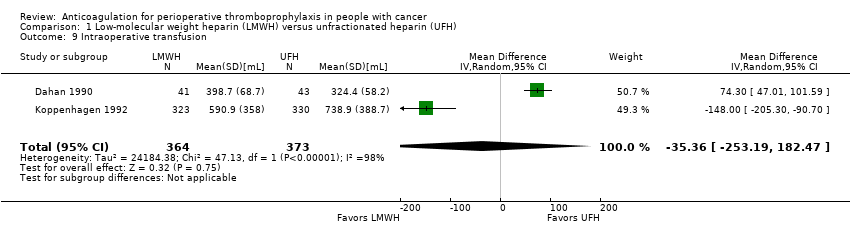
Comparison 1 Low‐molecular weight heparin (LMWH) versus unfractionated heparin (UFH), Outcome 9 Intraoperative transfusion.

Comparison 1 Low‐molecular weight heparin (LMWH) versus unfractionated heparin (UFH), Outcome 10 Postoperative transfusion.

Comparison 1 Low‐molecular weight heparin (LMWH) versus unfractionated heparin (UFH), Outcome 11 Intraoperative blood loss.
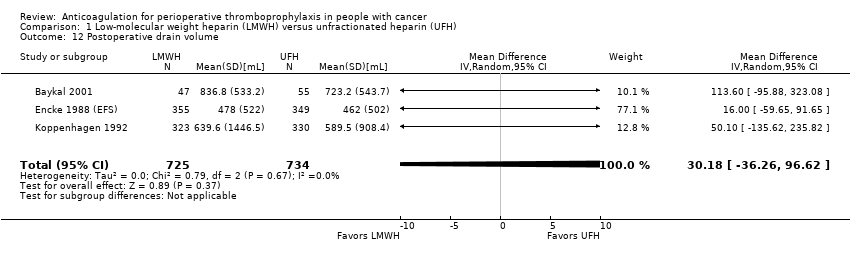
Comparison 1 Low‐molecular weight heparin (LMWH) versus unfractionated heparin (UFH), Outcome 12 Postoperative drain volume.

Comparison 1 Low‐molecular weight heparin (LMWH) versus unfractionated heparin (UFH), Outcome 13 Thrombocytopenia.
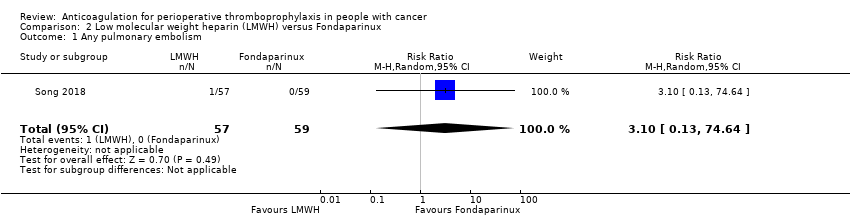
Comparison 2 Low molecular weight heparin (LMWH) versus Fondaparinux, Outcome 1 Any pulmonary embolism.
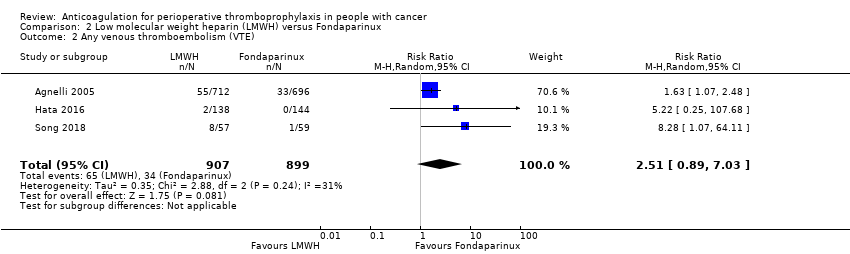
Comparison 2 Low molecular weight heparin (LMWH) versus Fondaparinux, Outcome 2 Any venous thromboembolism (VTE).
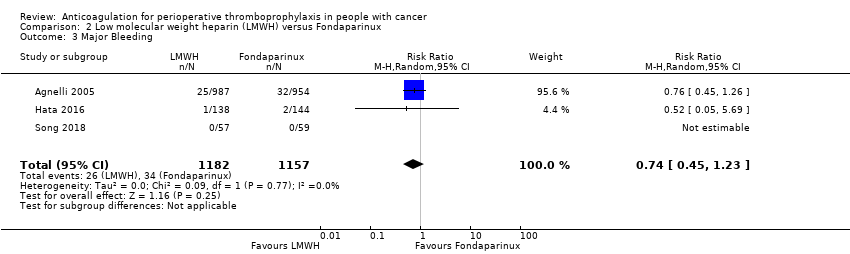
Comparison 2 Low molecular weight heparin (LMWH) versus Fondaparinux, Outcome 3 Major Bleeding.

Comparison 2 Low molecular weight heparin (LMWH) versus Fondaparinux, Outcome 4 Minor Bleeding.

Comparison 2 Low molecular weight heparin (LMWH) versus Fondaparinux, Outcome 5 Postoperative drain volume.

Comparison 2 Low molecular weight heparin (LMWH) versus Fondaparinux, Outcome 6 Thrombocytopenia.
| LMWH prophylaxis compared to UFH prophylaxis in people with cancer without VTE undergoing a surgery | |||||
| Patient or population: People with cancer with perioperative thromboprophylaxis | |||||
| Outcomes | № of participants | Certainty of the evidence | Relative effect | Anticipated absolute effects* (95% CI) | |
| Risk with UFH prophylaxis | Risk difference with LMWH prophylaxis | ||||
| Mortality | 4260 | ⊕⊕⊕⊝ | RR 0.82 | Study population | |
| 51 per 1000 | 9 fewer per 1000 | ||||
| Any PE | 5588 | ⊕⊕⊕⊝ | RR 0.49 | Study population | |
| 6 per 1000 | 3 fewer per 1000 | ||||
| Symptomatic DVT | 2250 | ⊕⊕⊕⊝ | RR 0.67 | Study population | |
| 10 per 1000 | 3 fewer per 1000 | ||||
| Symptomatic DVT measured as asymptomatic DVT | 4938 | ⊕⊕⊝⊝ | RR 0.86 | Study population | |
| 79 per 1000 | 11 fewer per 1000 | ||||
| Major bleeding | 3473 | ⊕⊕⊕⊝ | RR 1.01 | Study population | |
| 31 per 1000 | 0 fewer per 1000 | ||||
| Minor bleeding | 1194 | ⊕⊕⊕⊝ | RR 1.01 | Study population | |
| 142 per 1000 | 1 more per 1000 | ||||
| Wound hematoma | 2827 | ⊕⊕⊕⊝ | RR 0.70 | Study population | |
| 86 per 1000 | 26 fewer per 1000 | ||||
| Reoperation for bleeding | 1246 | ⊕⊕⊕⊝ | RR 0.93 | Study population | |
| 51 per 1000 | 4 fewer per 1000 | ||||
| Intraoperative transfusion | 737 | ⊕⊕⊝⊝ | ‐ | MD 35.36 lower | |
| Postoperative transfusion | 734 | ⊕⊕⊝⊝ | ‐ | MD 190.03 higher | |
| Intraoperative blood loss | 761 | ⊕⊕⊕⊝ | ‐ | MD 6.75 lower | |
| Postoperative drain volume | 1459 | ⊕⊕⊕⊝ | ‐ | MD 30.18 higher | |
| Thrombocytopenia | 683 | ⊕⊕⊕⊝ | RR 3.07 | Study population | |
| 3 per 1000 | 6 more per 1000 | ||||
| *The risk in the intervention group (and its 95% confidence interval) is based on the assumed risk in the comparison group and the relative effect of the intervention (and its 95% CI). | |||||
| GRADE Working Group grades of evidence | |||||
| 1 Downgraded due to serious imprecision. 95% CI is consistent with the possibility for important benefit (19 fewer per 1000 absolute reduction) and possibility of no effect (4 more per 1000 absolute increase), including 197 events in total. 2 Downgraded due to serious imprecision. Low event rate, 26 events in total 3 Downgraded due to serious imprecision. Low event rate, 18 events in total 4 Downgraded by one level due to serious inconsistency, outcome measured as surrogate outcome 5 Downgraded due to serious imprecision. 95% CI is consistent with the possibility of important benefit (23 fewer more per 1000 absolute reduction) and possibility of harm (4 more per 1000 increase), including 367 events in total. 6 Downgraded due to serious imprecision. 95% CI is consistent with the possibility of important benefit (10 fewer more per 1000 absolute reduction) and possibility of harm (15 more per 1000 increase), including 107 events in total. 7 Downgraded due to serious imprecision. 95% CI is consistent with the possibility for important benefit (34 fewer per 1000 absolute reduction) and possibility of no effect (47 more per 1000 absolute increase), including 170 events in total. 8 Downgraded due to serious risk of bias; allocation concealment was not clear in 5 out of 6 studies. 9 Downgraded due to serious imprecision. Low event rate, 206 events in total 10 Downgraded due to serious imprecision. 95% CI is consistent with the possibility of benefit (22 fewer per 1000 absolute reduction) and possibility of important harm (26 more per 1000 absolute increase), including 61 events in total. 11 Downgraded due to serious inconsistency. I2= 98%; Dahan 1990 included patients undergoing thoracic surgery for cancer whereas Koppenhagen 1992 included patients undergoing major elective abdominal surgery 12 Downgraded due to serious imprecision. 95% CI is consistent with the possibility for important benefit (253.19 mL less) and possibility of harm (182.47 mL more) 13 Downgraded due to serious inconsistency. I2 = 83%; Dahan 1990 included patients undergoing thoracic surgery for cancer whereas Koppenhagen 1992 included patients undergoing major elective abdominal surgery 14 Downgraded due to serious imprecision. 95% CI is consistent with the possibility for important benefit (23.65mL less) and possibility of harm (40.3.72mL more) 15 Downgraded due to serious imprecision. 95% CI is consistent with the possibility for important benefit (85.49 mL less) and possibility of harm (71.99 mL more) 16 Downgraded due to serious imprecision. 95% CI is consistent with the possibility for important benefit (36.26 mL less) and possibility of harm (96.62 mL more) 17 Downgraded due to serious imprecision. Low event rate, 4 events in total | |||||
| LMWH prophylaxis compared to fondaparinux prophylaxis in people with cancer without VTE undergoing a surgical procedure | |||||
| Patient or population: People with perioperative thromboprophylaxis in people with cancer | |||||
| Outcomes | № of participants | Certainty of the evidence | Relative effect | Anticipated absolute effects* (95% CI) | |
| Risk with Fondaparinux prophylaxis | Risk difference with LMWH prophylaxis | ||||
| Mortality ‐ not reported | ‐ | ‐ | ‐ | ‐ | ‐ |
| Any VTE | 1806 | ⊕⊕⊝⊝ | RR 2.51 | Study population | |
| 38 per 1000 | 57 more per 1000 | ||||
| Major Bleeding | 2339 | ⊕⊕⊝⊝ | RR 0.74 | Study population | |
| 29 per 1000 | 8 fewer per 1000 | ||||
| Minor Bleeding | 398 | ⊕⊕⊝⊝ | RR 0.83 | Study population | |
| 49 per 1000 | 8 fewer per 1000 | ||||
| Thrombocytopenia | 282 | ⊕⊕⊝⊝ | RR 0.35 | Study population | |
| 21 per 1000 | 14 fewer per 1000 | ||||
| Any Pulmonary embolism | 116 | ⊕⊕⊝⊝ | RR 3.10 | Study population | |
| 0 per 1000 | 0 fewer per 1000 | ||||
| Low | |||||
| 1 per 1000 | 2 more per 1000 | ||||
| Postoperative drain volume | 116 | ⊕⊕⊝⊝ | ‐ | The mean postoperative drain volume was 0 ml | MD 20 ml lower |
| *The risk in the intervention group (and its 95% confidence interval) is based on the assumed risk in the comparison group and the relative effect of the intervention (and its 95% CI). | |||||
| GRADE Working Group grades of evidence | |||||
| 1 Downgraded by one level for concerns about both imprecision and indirectness. 95% CI is consistent with the possibility for benefit (4 per 1000 absolute reduction) and possibility of important harm (22 per 1000 absolute increase), including 99 events in total. VTE events included both symptomatic and asymptomatic events for patients with cancer which introduces some level of indirectness. 2 Downgraded by one level due to high risk of bias (lack of allocation concealment and incomplete outcome data in Agnelli 2005; lack of blinding of patients and personnel and incomplete outcome data in Hata 2016 unclear allocation concealment in song 2018) 3 Although the event rate used from the fondaprinux arm includes asymptomatic events, it is very close to rate of symptomatic VTE (3.1%) found in a retrospective cohort Changolkar 2014 4 Downgraded for serious imprecision. 95% CI is consistent with the possibility for important benefit (16 per 1000 absolute reduction) and possibility of important harm (7 per 1000 absolute increase), including 60 events in total. 5 Downgraded for high risk of bias (lack of blinding of patients and personnel and incomplete outcome data in Hata 2016 and unclear allocation concealment in Song 2018) 6 Downgraded for serious imprecision. 95% CI is consistent with the possibility for important benefit (33 per 1000 absolute reduction) and possibility of important harm (52 per 1000 absolute increase), including 18 events in total. 7 Downgraded for high risk of bias (lack of blinding of patients and personnel and incomplete outcome data in Hata 2016) 8 Downgraded for serious imprecision. 95% CI is consistent with the possibility for important benefit (20 per 1000 absolute reduction) and possibility of important harm (48 per 1000 absolute increase), including 4 events in total. 9 Downgraded by two levels for very serious imprecision. 95% CI is consistent with the possibility for important benefit (1 per 1000 absolute reduction) and possibility of important harm (78 per 1000 absolute increase), including 1 event in total. 10 Downgraded due to serious imprecision. 95% CI is consistent with the possibility for important benefit (114.34 mL less) and possibility of harm (74.34 mL more) | |||||
| Outcome or subgroup title | No. of studies | No. of participants | Statistical method | Effect size |
| 1 All‐cause mortality Show forest plot | 8 | 4260 | Risk Ratio (M‐H, Random, 95% CI) | 0.82 [0.63, 1.07] |
| 2 Pulmonary embolism (PE) Show forest plot | 14 | 5588 | Risk Ratio (M‐H, Random, 95% CI) | 0.49 [0.17, 1.47] |
| 3 Symptomatic deep venous thrombosis (DVT) Show forest plot | 8 | 2250 | Risk Ratio (M‐H, Random, 95% CI) | 0.67 [0.27, 1.69] |
| 4 Asymptomatic DVT Show forest plot | 12 | 4938 | Risk Ratio (M‐H, Random, 95% CI) | 0.86 [0.71, 1.05] |
| 5 Major bleeding Show forest plot | 9 | 3473 | Risk Ratio (M‐H, Random, 95% CI) | 1.01 [0.69, 1.48] |
| 6 Minor bleeding Show forest plot | 2 | 1194 | Risk Ratio (M‐H, Random, 95% CI) | 1.01 [0.76, 1.33] |
| 7 Wound hematoma Show forest plot | 6 | 2827 | Risk Ratio (M‐H, Random, 95% CI) | 0.70 [0.54, 0.92] |
| 8 Reoperation for bleeding Show forest plot | 4 | 1246 | Risk Ratio (M‐H, Random, 95% CI) | 0.93 [0.57, 1.50] |
| 9 Intraoperative transfusion Show forest plot | 2 | 737 | Mean Difference (IV, Random, 95% CI) | ‐35.36 [‐253.19, 182.47] |
| 10 Postoperative transfusion Show forest plot | 2 | 734 | Mean Difference (IV, Random, 95% CI) | 190.03 [‐23.65, 403.72] |
| 11 Intraoperative blood loss Show forest plot | 4 | 761 | Mean Difference (IV, Random, 95% CI) | ‐6.75 [‐85.49, 71.99] |
| 12 Postoperative drain volume Show forest plot | 3 | 1459 | Mean Difference (IV, Random, 95% CI) | 30.18 [‐36.26, 96.62] |
| 13 Thrombocytopenia Show forest plot | 2 | 683 | Risk Ratio (M‐H, Random, 95% CI) | 3.07 [0.32, 29.33] |
| Outcome or subgroup title | No. of studies | No. of participants | Statistical method | Effect size |
| 1 Any pulmonary embolism Show forest plot | 1 | 116 | Risk Ratio (M‐H, Random, 95% CI) | 3.10 [0.13, 74.64] |
| 2 Any venous thromboembolism (VTE) Show forest plot | 3 | 1806 | Risk Ratio (M‐H, Random, 95% CI) | 2.51 [0.89, 7.03] |
| 3 Major Bleeding Show forest plot | 3 | 2339 | Risk Ratio (M‐H, Random, 95% CI) | 0.74 [0.45, 1.23] |
| 4 Minor Bleeding Show forest plot | 2 | 398 | Risk Ratio (M‐H, Random, 95% CI) | 0.83 [0.34, 2.05] |
| 5 Postoperative drain volume Show forest plot | 1 | 116 | Mean Difference (IV, Random, 95% CI) | ‐20.0 [‐114.34, 74.34] |
| 6 Thrombocytopenia Show forest plot | 1 | 282 | Risk Ratio (M‐H, Random, 95% CI) | 0.35 [0.04, 3.30] |