مقایسه زایمان زودهنگام برنامهریزی شده در برابر مدیریت انتظاری برای نوزاد ترم و مشکوک به در معرض خطر برای بهبود پیامدها
Referencias
منابع مطالعات واردشده در این مرور
منابع مطالعات خارجشده از این مرور
منابع اضافی
Characteristics of studies
Characteristics of included studies [ordered by study ID]
Ir a:
| Methods | Multicentre randomised equivalence trial. | |
| Participants | Setting: 8 academic and 44 non‐academic hospitals in The Netherlands between November 2004 and November 2008. Inclusion criteria: pregnant women between 36 + 0 and 41 + 0 weeks’ gestation who had a singleton fetus in cephalic presentation, suspected intrauterine growth restriction and who were under specialised obstetric care. Suspected intrauterine growth restriction was defined as fetal abdominal circumference below the 10th percentile, estimated fetal weight below the 10th percentile, flattening of the growth curve in the third trimester (as judged by a clinician), or the presence of all 3 factors. Exclusion criteria: exclusion criteria were previous caesarean section, diabetes mellitus or gestational diabetes requiring insulin therapy, renal failure, HIV seropositivity, prelabour rupture of membranes, severe pre‐eclampsia, HELLP syndrome (haemolysis, elevated liver enzymes, and low platelet count), or a fetus with aneuploidy or congenital abnormalities suspected on ultrasound. Fetuses with decreased or absent movements, and those with abnormal heart rate tracings, were also excluded. Number randomised: 650 women ‐ 321 to induction of labour and 329 to expectant management in overall study, which included women from 36 weeks' gestation. For this review data included term infants ≥ 37 weeks' gestation ‐ total 459 randomised ‐ 227 to induction of labour and 232 to expectant management. | |
| Interventions | Induction of labour group: participants allocated to the induction of labour group were induced within 48 hours of randomisation. If the Bishop score at randomisation was greater than 6, labour was induced with amniotomy and, if necessary, augmented with oxytocin. Otherwise cervical ripening was performed with intracervical or intravaginal prostaglandin or a Foley balloon catheter. Expectant management: women were monitored until the onset of spontaneous labour with daily fetal movement counts and twice‐weekly heart rate tracings, ultrasound examination, maternal blood pressure measurement, assessment of proteinuria, laboratory tests of liver and kidney function, and full blood count. Induction of labour or planned caesarean section was performed for obstetrical indications. | |
| Outcomes | Primary: initial study: Composite measure of adverse neonatal outcome defined as death before hospital discharge, 5‐minute Apgar score of less than 7, umbilical artery pH of less than 7.05, or admission to neonatal intensive care. Follow‐up study: 2‐year neurodevelopmental outcomes using ages and stages questionnaire and the child behaviour checklist. Secondary: caesarean section, instrumental vaginal delivery, length of stay in the neonatal intensive care or neonatal ward, length of stay in the maternal hospital, and maternal morbidity (defined as postpartum haemorrhage of more than 1000 mL, development of gestational hypertension or pre‐eclampsia, eclampsia, pulmonary oedema, thromboembolism, or any other serious adverse event). | |
| Notes | ||
| Risk of bias | ||
| Bias | Authors' judgement | Support for judgement |
| Random sequence generation (selection bias) | Low risk | Participant data were entered into a secure web‐based database. Women were randomly allocated to either induction or expectant monitoring in a 1:1 ratio using varied sized block randomisation with stratification for centre and parity. |
| Allocation concealment (selection bias) | Unclear risk | Secure web‐based database ‐ unclear whether centralised telephone allocation. |
| Incomplete outcome data (attrition bias) | Low risk | Complete outcome data reported and analysis by intention‐to‐treat. |
| Selective reporting (reporting bias) | Low risk | All pre‐specified outcomes reported on. |
| Other bias | Low risk | No apparent risk of other bias. |
| Blinding of participants and personnel (performance bias) | Low risk | Participants and personnel not blinded, however, this is likely to be a low risk of bias secondary to the intervention being assessed. |
| Blinding of outcome assessment (detection bias) | Low risk | Outcome assessors not blinded ‐ In initial study, primary outcomes not subject to bias, e.g. mortality, weight, gestational age, however in the follow‐up study there is potential for bias in the interpretation of the developmental measures used. |
| Methods | Prospective pilot RCT. | |
| Participants | Setting: Department of Obstetrics and Gynaecology, Karolinska University Hospital, Huddinge, Sweden from late 1999 until spring 2001. Inclusion criteria: patients referred at 41 completed weeks with uncomplicated pregnancies; amniotic fluid index < 50 mm. Exclusion criteria: estimated fetal size < ‐22%; pathological umbilical artery blood flow; abnormal cardiotocograph. Number randomised: 54 women, 26 to expectant management and 28 to induction of labour. | |
| Interventions | Induction of labour: induction of labour was performed the same or following day. Patients with unfavourable cervix had a transcervical Foley catheter inserted for a maximum of 7 hours prior to amniotomy and oxytocin infusion, while patients with a favourable cervix primarily had amniotomy and oxytocin infusion. Expectant management: no monitoring was done prior to spontaneous onset of labour. Those who did not go into labour spontaneously by 42 completed weeks were then managed according to department protocol. | |
| Outcomes | Primary maternal: mode of delivery. Secondary maternal: day at delivery. Primary fetal: umbilical cord pH; Apgar score at 1, 5 and 10 minutes. Secondary fetal: birthweight; number of admissions to the neonatal intensive care unit. | |
| Notes | ||
| Risk of bias | ||
| Bias | Authors' judgement | Support for judgement |
| Random sequence generation (selection bias) | Unclear risk | Patients were randomised, by sealed envelopes, after having given informed consent. No mention is made of how the randomisation sequence was generated. |
| Allocation concealment (selection bias) | Unclear risk | No mention is made as to how concealment was preserved. The information was stored in anonymous protocols at evaluation. |
| Incomplete outcome data (attrition bias) | Low risk | Trial was based on intention to treat. All patients completed the study and there were no treatment withdrawals. |
| Selective reporting (reporting bias) | Low risk | All pre‐specified outcomes reported on. |
| Other bias | Low risk | No apparent risk of other bias. |
| Blinding of participants and personnel (performance bias) | Low risk | This information was not provided however this is likely to be a low risk of bias secondary to the intervention being assessed. |
| Blinding of outcome assessment (detection bias) | Unclear risk | This information was not provided. |
| Methods | Pilot RCT. | |
| Participants | Setting: Department of Obstetrics and Gynaecology, Atrium Medical Centre, Heerlen, The Netherlands between January 2002 and April 2004. Inclusion criteria: pregnant women with suspected intrauterine growth restriction after 37 weeks’ gestation, based on clinical examination (measuring fundal height) and/or ultrasound biometry (fetal abdominal circumference (FAC) < 10th percentile or a declining FACcurve), singleton pregnancy; an accurate ultrasound dating scan performed before 20 weeks; a normal cardiotocograph; and doubt by the attending clinician whether to induce or to await spontaneous delivery. Exclusion criteria: patients with multifetal pregnancies, uncertain gestational age, abnormal fetal presentations, or maternal diseases requiring induction of labour. Number randomised: 33 consented to take part. 16 were allocated to the labour induction group, and 17 to await the spontaneous onset of labour. | |
| Interventions | Patients were randomly allocated after stratification for parity to either induction of labour within 48 hours (labour induction group) or to await spontaneous onset of labour (expectant management group). Methods of labour induction were prostaglandin gel for cervical ripening and amniotomy and oxytocin intravenously according to local practice and individual preference. Participants allocated to the expectant management group were monitored with weekly measurement of the umbilical artery Doppler waveform and cardiotocography twice weekly. Additional monitoring was done if indicated. Labour was induced in the expectant management group if the clinician considered this necessary on the basis of changes in foetal or maternal condition. | |
| Outcomes | Primary: obstetrical intervention rates and neonatal outcomes. | |
| Notes | ||
| Risk of bias | ||
| Bias | Authors' judgement | Support for judgement |
| Random sequence generation (selection bias) | Low risk | Patients were randomly allocated by drawing of a sealed opaque envelope. 2 series of envelopes, 1 for nulliparous and another for multiparous women, were filled at random by a statistician with a folded paper ‘‘induction’’ or ‘‘expectation’’ and numbered consecutively. The envelopes were opened in sequence of numbers in presence of the patient. No envelope was missed. |
| Allocation concealment (selection bias) | Low risk | Sealed opaque envelopes were used. |
| Incomplete outcome data (attrition bias) | Low risk | Analyses were performed by intention‐to‐treat. All patients completed the study and there were no treatment withdrawals. |
| Selective reporting (reporting bias) | Low risk | The primary outcomes were reported. |
| Other bias | Low risk | No apparent risk of other bias. |
| Blinding of participants and personnel (performance bias) | Low risk | This information was not provided however this is likely to be a low risk of bias secondary to the intervention being assessed. |
| Blinding of outcome assessment (detection bias) | Unclear risk | This information was not provided. |
RCT: randomised controlled trial
Characteristics of excluded studies [ordered by study ID]
Ir a:
| Study | Reason for exclusion |
| Abstract publication only. Unable to use data without information on numbers randomised to each arm. The author has been contacted but has not yet supplied the requested information. | |
| This study randomised women with acquired and congenital heart disease and not suspicion of fetal compromise as defined in this review. Study results not yet published. | |
| Randomised women 32 ‐ 37.5 weeks. Randomised based on pre‐specified risk factors ‐ demographic or medical. Therefore, not randomised on suspicion of fetal compromise as defined in this review. | |
| A prospective randomised controlled trial entitled "Active Management Of Risk In Pregnancy At Term to Reduce Rate of Cesarean Deliveries (AMOR‐IPAT)". It's aim was to determine if active management of risks in pregnancy at term by inducing patients would not decrease the caesarean delivery rate or change neonatal outcomes. No published results were found for this trial, only a link stating the trial had been terminated. Multiple attempts to contact the author for results were unsuccessful. |
Data and analyses
| Outcome or subgroup title | No. of studies | No. of participants | Statistical method | Effect size |
| 1 Perinatal mortality Show forest plot | 1 | 459 | Risk Ratio (M‐H, Fixed, 95% CI) | 0.0 [0.0, 0.0] |
| Analysis 1.1  Comparison 1 Planned early delivery versus expectant management, Outcome 1 Perinatal mortality. | ||||
| 2 Major neonatal morbidity Show forest plot | 1 | 459 | Risk Ratio (M‐H, Fixed, 95% CI) | 0.15 [0.01, 2.81] |
| Analysis 1.2  Comparison 1 Planned early delivery versus expectant management, Outcome 2 Major neonatal morbidity. | ||||
| 3 Neurodevelopmental disability/impairment Show forest plot | 1 | 459 | Risk Ratio (M‐H, Fixed, 95% CI) | 2.04 [0.62, 6.69] |
| Analysis 1.3  Comparison 1 Planned early delivery versus expectant management, Outcome 3 Neurodevelopmental disability/impairment. | ||||
| 4 Maternal mortality Show forest plot | 1 | 459 | Risk Ratio (M‐H, Fixed, 95% CI) | 3.07 [0.13, 74.87] |
| Analysis 1.4  Comparison 1 Planned early delivery versus expectant management, Outcome 4 Maternal mortality. | ||||
| 5 Major maternal morbidity Show forest plot | 1 | 459 | Risk Ratio (M‐H, Fixed, 95% CI) | 0.92 [0.38, 2.22] |
| Analysis 1.5  Comparison 1 Planned early delivery versus expectant management, Outcome 5 Major maternal morbidity. | ||||
| 6 Neonatal seizures Show forest plot | 1 | 336 | Risk Ratio (M‐H, Fixed, 95% CI) | 0.0 [0.0, 0.0] |
| Analysis 1.6  Comparison 1 Planned early delivery versus expectant management, Outcome 6 Neonatal seizures. | ||||
| 7 Necrotising enterocolitis Show forest plot | 1 | 333 | Risk Ratio (M‐H, Fixed, 95% CI) | 0.0 [0.0, 0.0] |
| Analysis 1.7  Comparison 1 Planned early delivery versus expectant management, Outcome 7 Necrotising enterocolitis. | ||||
| 8 Respiratory distress syndrome Show forest plot | 1 | 333 | Risk Ratio (M‐H, Fixed, 95% CI) | 0.33 [0.01, 7.98] |
| Analysis 1.8 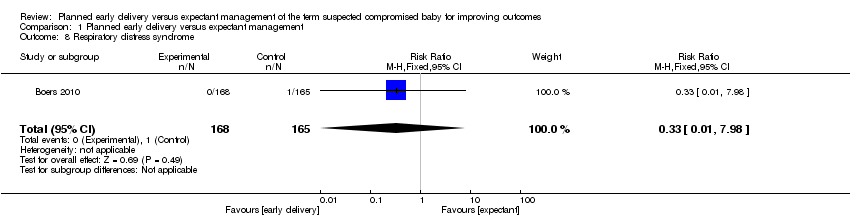 Comparison 1 Planned early delivery versus expectant management, Outcome 8 Respiratory distress syndrome. | ||||
| 9 Meconium aspiration Show forest plot | 1 | 459 | Risk Ratio (M‐H, Fixed, 95% CI) | 0.34 [0.01, 8.32] |
| Analysis 1.9 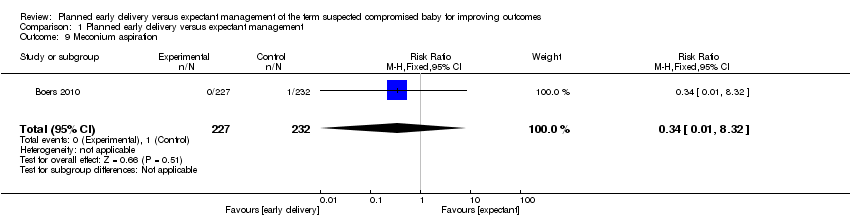 Comparison 1 Planned early delivery versus expectant management, Outcome 9 Meconium aspiration. | ||||
| 10 Gestational age at birth (days) Show forest plot | 1 | 459 | Mean Difference (IV, Fixed, 95% CI) | ‐9.5 [‐10.82, ‐8.18] |
| Analysis 1.10  Comparison 1 Planned early delivery versus expectant management, Outcome 10 Gestational age at birth (days). | ||||
| 11 Gestational age ≥ 40 weeks (not pre‐specified) Show forest plot | 1 | 33 | Risk Ratio (M‐H, Fixed, 95% CI) | 0.10 [0.01, 0.67] |
| Analysis 1.11  Comparison 1 Planned early delivery versus expectant management, Outcome 11 Gestational age ≥ 40 weeks (not pre‐specified). | ||||
| 12 Apgar score < 7 at 5 minutes Show forest plot | 3 | 546 | Risk Ratio (M‐H, Fixed, 95% CI) | 2.56 [0.50, 13.04] |
| Analysis 1.12  Comparison 1 Planned early delivery versus expectant management, Outcome 12 Apgar score < 7 at 5 minutes. | ||||
| 13 Resuscitation required Show forest plot | 1 | 459 | Risk Ratio (M‐H, Fixed, 95% CI) | 0.11 [0.01, 2.10] |
| Analysis 1.13  Comparison 1 Planned early delivery versus expectant management, Outcome 13 Resuscitation required. | ||||
| 14 Requirement for mechanical ventilation Show forest plot | 1 | 337 | Risk Ratio (M‐H, Fixed, 95% CI) | 0.20 [0.01, 4.11] |
| Analysis 1.14  Comparison 1 Planned early delivery versus expectant management, Outcome 14 Requirement for mechanical ventilation. | ||||
| 15 Birthweight < 10 centile Show forest plot | 2 | 491 | Risk Ratio (M‐H, Fixed, 95% CI) | 0.98 [0.88, 1.10] |
| Analysis 1.15  Comparison 1 Planned early delivery versus expectant management, Outcome 15 Birthweight < 10 centile. | ||||
| 16 Birthweight < 2.3 centile (not pre‐specified) Show forest plot | 2 | 491 | Risk Ratio (M‐H, Fixed, 95% CI) | 0.51 [0.36, 0.73] |
| Analysis 1.16 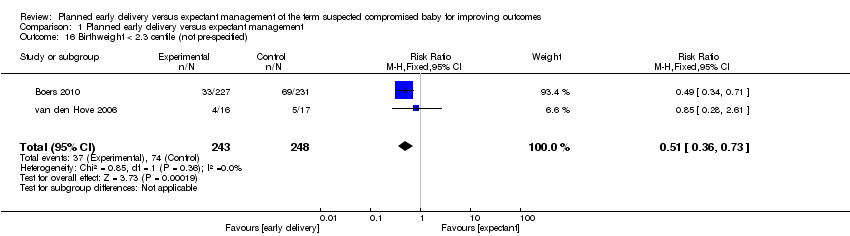 Comparison 1 Planned early delivery versus expectant management, Outcome 16 Birthweight < 2.3 centile (not pre‐specified). | ||||
| 17 Admission to NICU Show forest plot | 3 | 545 | Risk Ratio (M‐H, Fixed, 95% CI) | 0.88 [0.35, 2.23] |
| Analysis 1.17 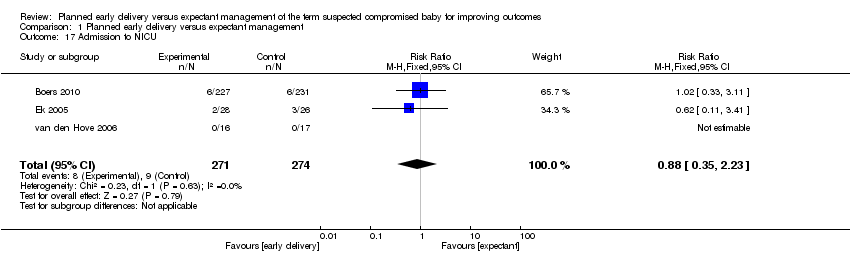 Comparison 1 Planned early delivery versus expectant management, Outcome 17 Admission to NICU. | ||||
| 18 Admission to intermediate care nursery (not pre‐specified) Show forest plot | 2 | 491 | Risk Ratio (M‐H, Fixed, 95% CI) | 1.28 [1.02, 1.61] |
| Analysis 1.18  Comparison 1 Planned early delivery versus expectant management, Outcome 18 Admission to intermediate care nursery (not pre‐specified). | ||||
| 19 Length of stay in NICU/SCN (days) Show forest plot | 1 | 459 | Mean Difference (IV, Fixed, 95% CI) | 0.0 [‐1.28, 1.28] |
| Analysis 1.19  Comparison 1 Planned early delivery versus expectant management, Outcome 19 Length of stay in NICU/SCN (days). | ||||
| 20 Interval (days) between randomisation and delivery Show forest plot | 1 | 459 | Mean Difference (IV, Fixed, 95% CI) | ‐8.68 [‐10.04, ‐7.32] |
| Analysis 1.20  Comparison 1 Planned early delivery versus expectant management, Outcome 20 Interval (days) between randomisation and delivery. | ||||
| 21 Neonatal sepsis Show forest plot | 2 | 366 | Risk Ratio (M‐H, Fixed, 95% CI) | 3.18 [0.14, 72.75] |
| Analysis 1.21  Comparison 1 Planned early delivery versus expectant management, Outcome 21 Neonatal sepsis. | ||||
| 22 Caesarean section Show forest plot | 3 | 546 | Risk Ratio (M‐H, Fixed, 95% CI) | 1.02 [0.65, 1.59] |
| Analysis 1.22  Comparison 1 Planned early delivery versus expectant management, Outcome 22 Caesarean section. | ||||
| 23 Placental abruption Show forest plot | 1 | 459 | Risk Ratio (M‐H, Fixed, 95% CI) | 3.07 [0.13, 74.87] |
| Analysis 1.23  Comparison 1 Planned early delivery versus expectant management, Outcome 23 Placental abruption. | ||||
| 24 Pre‐eclampsia Show forest plot | 1 | 459 | Risk Ratio (M‐H, Fixed, 95% CI) | 0.63 [0.27, 1.49] |
| Analysis 1.24  Comparison 1 Planned early delivery versus expectant management, Outcome 24 Pre‐eclampsia. | ||||
| 25 Induction of labour Show forest plot | 1 | 459 | Risk Ratio (M‐H, Fixed, 95% CI) | 2.05 [1.78, 2.37] |
| Analysis 1.25 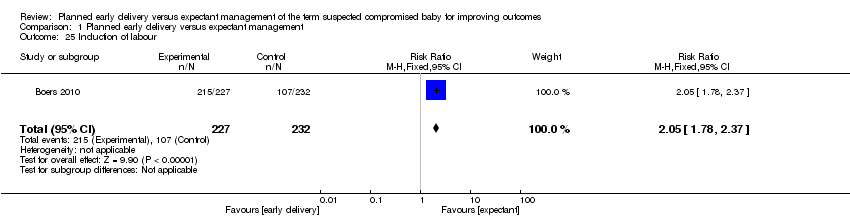 Comparison 1 Planned early delivery versus expectant management, Outcome 25 Induction of labour. | ||||
| 26 Vaginal birth Show forest plot | 3 | 546 | Risk Ratio (M‐H, Fixed, 95% CI) | 0.98 [0.90, 1.07] |
| Analysis 1.26  Comparison 1 Planned early delivery versus expectant management, Outcome 26 Vaginal birth. | ||||
| 27 Assisted vaginal birth Show forest plot | 3 | 546 | Risk Ratio (M‐H, Fixed, 95% CI) | 1.19 [0.69, 2.04] |
| Analysis 1.27  Comparison 1 Planned early delivery versus expectant management, Outcome 27 Assisted vaginal birth. | ||||
| 28 Breastfeeding Show forest plot | 1 | 218 | Risk Ratio (M‐H, Fixed, 95% CI) | 1.09 [0.85, 1.40] |
| Analysis 1.28  Comparison 1 Planned early delivery versus expectant management, Outcome 28 Breastfeeding. | ||||
| 29 Breastfeeding (weeks) Show forest plot | 1 | 124 | Mean Difference (IV, Fixed, 95% CI) | 1.74 [‐3.37, 6.85] |
| Analysis 1.29  Comparison 1 Planned early delivery versus expectant management, Outcome 29 Breastfeeding (weeks). | ||||
| 30 Maternal hospital stay (days) (not pre‐specified) Show forest plot | 1 | 33 | Mean Difference (IV, Fixed, 95% CI) | 1.0 [0.68, 1.32] |
| Analysis 1.30  Comparison 1 Planned early delivery versus expectant management, Outcome 30 Maternal hospital stay (days) (not pre‐specified). | ||||

Study flow diagram.
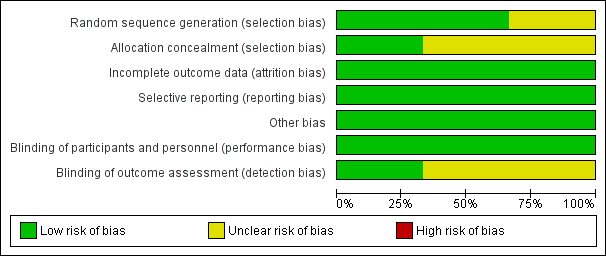
'Risk of bias' graph: review authors' judgements about each risk of bias item presented as percentages across all included studies.

'Risk of bias' summary: review authors' judgements about each risk of bias item for each included study.
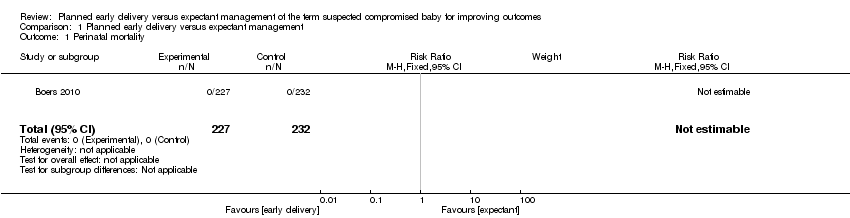
Comparison 1 Planned early delivery versus expectant management, Outcome 1 Perinatal mortality.

Comparison 1 Planned early delivery versus expectant management, Outcome 2 Major neonatal morbidity.
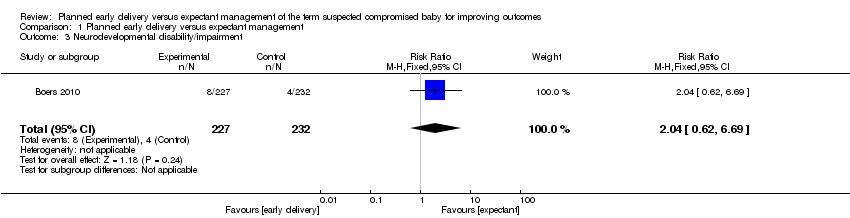
Comparison 1 Planned early delivery versus expectant management, Outcome 3 Neurodevelopmental disability/impairment.

Comparison 1 Planned early delivery versus expectant management, Outcome 4 Maternal mortality.

Comparison 1 Planned early delivery versus expectant management, Outcome 5 Major maternal morbidity.

Comparison 1 Planned early delivery versus expectant management, Outcome 6 Neonatal seizures.
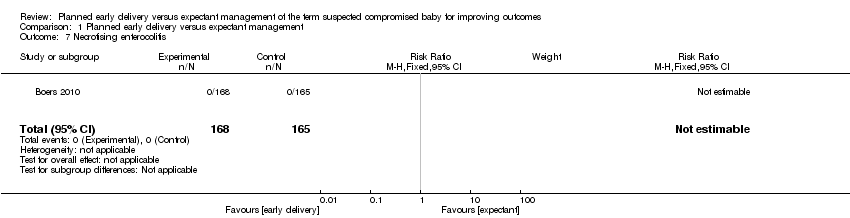
Comparison 1 Planned early delivery versus expectant management, Outcome 7 Necrotising enterocolitis.

Comparison 1 Planned early delivery versus expectant management, Outcome 8 Respiratory distress syndrome.

Comparison 1 Planned early delivery versus expectant management, Outcome 9 Meconium aspiration.
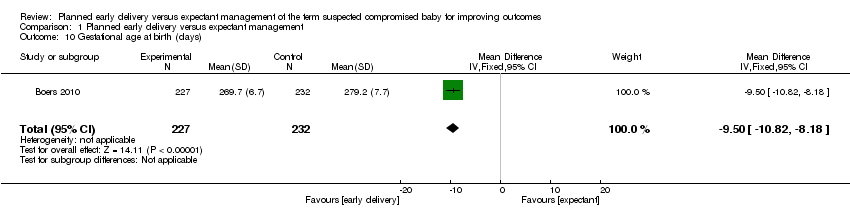
Comparison 1 Planned early delivery versus expectant management, Outcome 10 Gestational age at birth (days).
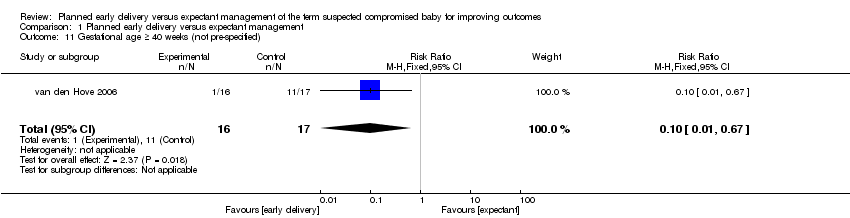
Comparison 1 Planned early delivery versus expectant management, Outcome 11 Gestational age ≥ 40 weeks (not pre‐specified).
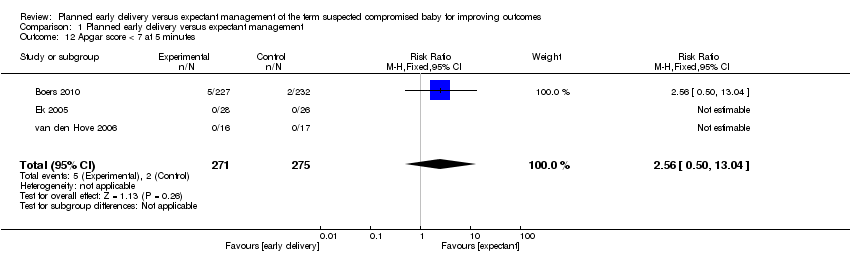
Comparison 1 Planned early delivery versus expectant management, Outcome 12 Apgar score < 7 at 5 minutes.

Comparison 1 Planned early delivery versus expectant management, Outcome 13 Resuscitation required.
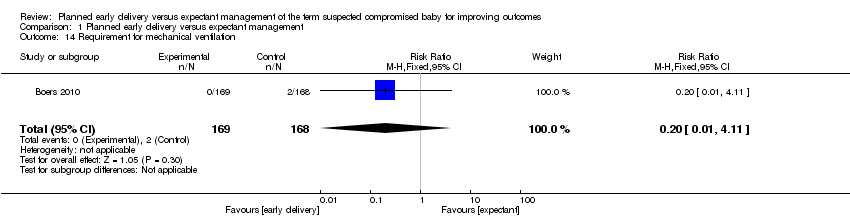
Comparison 1 Planned early delivery versus expectant management, Outcome 14 Requirement for mechanical ventilation.

Comparison 1 Planned early delivery versus expectant management, Outcome 15 Birthweight < 10 centile.

Comparison 1 Planned early delivery versus expectant management, Outcome 16 Birthweight < 2.3 centile (not pre‐specified).

Comparison 1 Planned early delivery versus expectant management, Outcome 17 Admission to NICU.
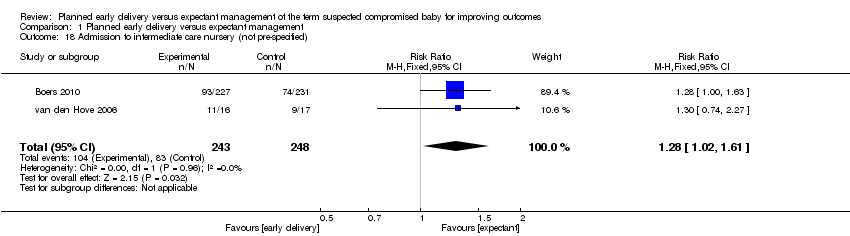
Comparison 1 Planned early delivery versus expectant management, Outcome 18 Admission to intermediate care nursery (not pre‐specified).
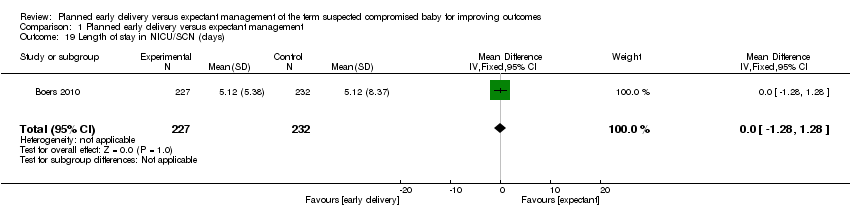
Comparison 1 Planned early delivery versus expectant management, Outcome 19 Length of stay in NICU/SCN (days).

Comparison 1 Planned early delivery versus expectant management, Outcome 20 Interval (days) between randomisation and delivery.

Comparison 1 Planned early delivery versus expectant management, Outcome 21 Neonatal sepsis.
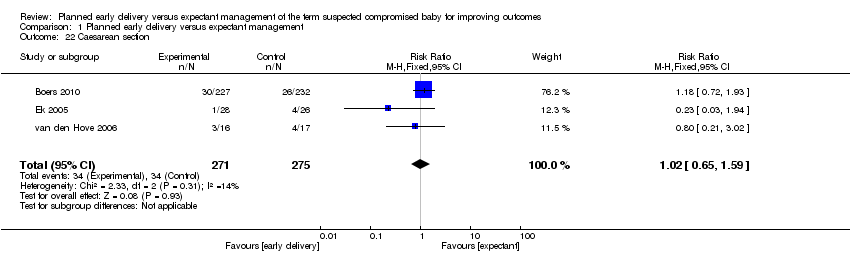
Comparison 1 Planned early delivery versus expectant management, Outcome 22 Caesarean section.
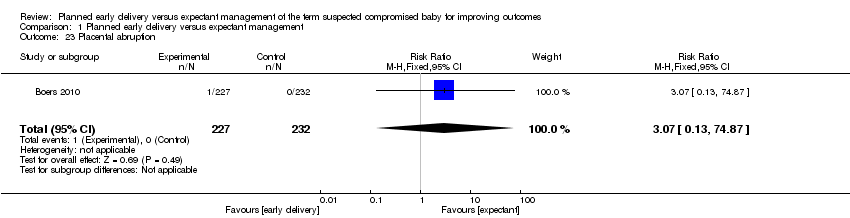
Comparison 1 Planned early delivery versus expectant management, Outcome 23 Placental abruption.
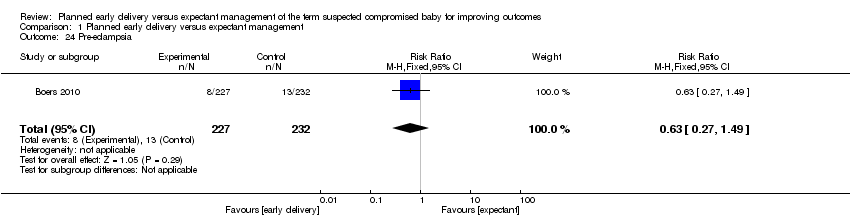
Comparison 1 Planned early delivery versus expectant management, Outcome 24 Pre‐eclampsia.

Comparison 1 Planned early delivery versus expectant management, Outcome 25 Induction of labour.
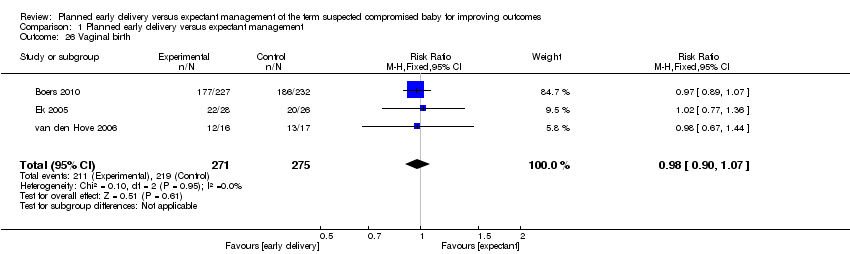
Comparison 1 Planned early delivery versus expectant management, Outcome 26 Vaginal birth.

Comparison 1 Planned early delivery versus expectant management, Outcome 27 Assisted vaginal birth.

Comparison 1 Planned early delivery versus expectant management, Outcome 28 Breastfeeding.
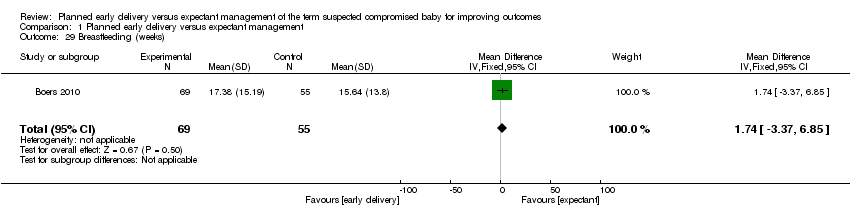
Comparison 1 Planned early delivery versus expectant management, Outcome 29 Breastfeeding (weeks).
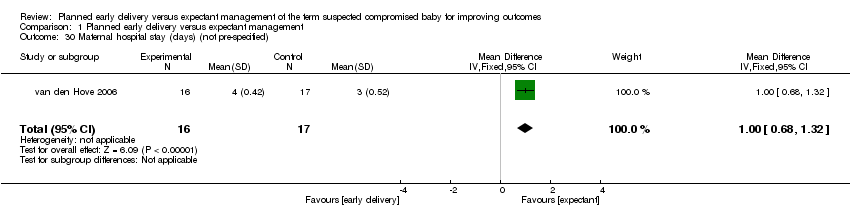
Comparison 1 Planned early delivery versus expectant management, Outcome 30 Maternal hospital stay (days) (not pre‐specified).
| Planned early delivery compared with expectant management for improving outcomes of the term suspected compromised baby | ||||||
| Patient or population: pregnant women with a term suspected compromised baby | ||||||
| Outcomes | Illustrative comparative risks* (95% CI) | Relative effect | No of participants | Quality of the evidence | Comments | |
| Assumed risk | Corresponding risk | |||||
| Expectant management | Planned early delivery | |||||
| Perinatal mortality | See comment | See comment | Not estimable | 459 | ⊕⊕⊕⊝ | |
| Major neonatal morbidity | Study population | RR 0.15 | 459 | ⊕⊕⊝⊝ | ||
| 13 per 1000 | 2 per 1000 | |||||
| Neurodevelopmental disability/impairment | Study population | RR 2.04 | 459 | ⊕⊕⊝⊝ | ||
| 17 per 1000 | 35 per 1000 | |||||
| Maternal mortality | Study population | RR 3.07 | 459 | ⊕⊕⊝⊝ | ||
| 0 per 1000 | 0 per 1000 | |||||
| Significant maternal morbidity | Study population | RR 0.92 | 459 | ⊕⊕⊝⊝ | ||
| 43 per 1000 | 40 per 1000 | |||||
| Admission to NICU | Study population | RR 0.88 | 545 | ⊕⊝⊝⊝ | ||
| 33 per 1000 | 29 per 1000 | |||||
| Moderate | ||||||
| 26 per 1000 | 23 per 1000 | |||||
| Caesarean section | Study population | RR 1.02 | 546 | ⊕⊕⊝⊝ | ||
| 124 per 1000 | 126 per 1000 | |||||
| Moderate | ||||||
| 154 per 1000 | 157 per 1000 | |||||
| *The basis for the assumed risk (e.g. the median control group risk across studies) is provided in footnotes. The corresponding risk (and its 95% confidence interval) is based on the assumed risk in the comparison group and the relative effect of the intervention (and its 95% CI). | ||||||
| GRADE Working Group grades of evidence | ||||||
| 1 There were no events for this outcome. CBCL: child behaviour checklist | ||||||
| Outcome or subgroup title | No. of studies | No. of participants | Statistical method | Effect size |
| 1 Perinatal mortality Show forest plot | 1 | 459 | Risk Ratio (M‐H, Fixed, 95% CI) | 0.0 [0.0, 0.0] |
| 2 Major neonatal morbidity Show forest plot | 1 | 459 | Risk Ratio (M‐H, Fixed, 95% CI) | 0.15 [0.01, 2.81] |
| 3 Neurodevelopmental disability/impairment Show forest plot | 1 | 459 | Risk Ratio (M‐H, Fixed, 95% CI) | 2.04 [0.62, 6.69] |
| 4 Maternal mortality Show forest plot | 1 | 459 | Risk Ratio (M‐H, Fixed, 95% CI) | 3.07 [0.13, 74.87] |
| 5 Major maternal morbidity Show forest plot | 1 | 459 | Risk Ratio (M‐H, Fixed, 95% CI) | 0.92 [0.38, 2.22] |
| 6 Neonatal seizures Show forest plot | 1 | 336 | Risk Ratio (M‐H, Fixed, 95% CI) | 0.0 [0.0, 0.0] |
| 7 Necrotising enterocolitis Show forest plot | 1 | 333 | Risk Ratio (M‐H, Fixed, 95% CI) | 0.0 [0.0, 0.0] |
| 8 Respiratory distress syndrome Show forest plot | 1 | 333 | Risk Ratio (M‐H, Fixed, 95% CI) | 0.33 [0.01, 7.98] |
| 9 Meconium aspiration Show forest plot | 1 | 459 | Risk Ratio (M‐H, Fixed, 95% CI) | 0.34 [0.01, 8.32] |
| 10 Gestational age at birth (days) Show forest plot | 1 | 459 | Mean Difference (IV, Fixed, 95% CI) | ‐9.5 [‐10.82, ‐8.18] |
| 11 Gestational age ≥ 40 weeks (not pre‐specified) Show forest plot | 1 | 33 | Risk Ratio (M‐H, Fixed, 95% CI) | 0.10 [0.01, 0.67] |
| 12 Apgar score < 7 at 5 minutes Show forest plot | 3 | 546 | Risk Ratio (M‐H, Fixed, 95% CI) | 2.56 [0.50, 13.04] |
| 13 Resuscitation required Show forest plot | 1 | 459 | Risk Ratio (M‐H, Fixed, 95% CI) | 0.11 [0.01, 2.10] |
| 14 Requirement for mechanical ventilation Show forest plot | 1 | 337 | Risk Ratio (M‐H, Fixed, 95% CI) | 0.20 [0.01, 4.11] |
| 15 Birthweight < 10 centile Show forest plot | 2 | 491 | Risk Ratio (M‐H, Fixed, 95% CI) | 0.98 [0.88, 1.10] |
| 16 Birthweight < 2.3 centile (not pre‐specified) Show forest plot | 2 | 491 | Risk Ratio (M‐H, Fixed, 95% CI) | 0.51 [0.36, 0.73] |
| 17 Admission to NICU Show forest plot | 3 | 545 | Risk Ratio (M‐H, Fixed, 95% CI) | 0.88 [0.35, 2.23] |
| 18 Admission to intermediate care nursery (not pre‐specified) Show forest plot | 2 | 491 | Risk Ratio (M‐H, Fixed, 95% CI) | 1.28 [1.02, 1.61] |
| 19 Length of stay in NICU/SCN (days) Show forest plot | 1 | 459 | Mean Difference (IV, Fixed, 95% CI) | 0.0 [‐1.28, 1.28] |
| 20 Interval (days) between randomisation and delivery Show forest plot | 1 | 459 | Mean Difference (IV, Fixed, 95% CI) | ‐8.68 [‐10.04, ‐7.32] |
| 21 Neonatal sepsis Show forest plot | 2 | 366 | Risk Ratio (M‐H, Fixed, 95% CI) | 3.18 [0.14, 72.75] |
| 22 Caesarean section Show forest plot | 3 | 546 | Risk Ratio (M‐H, Fixed, 95% CI) | 1.02 [0.65, 1.59] |
| 23 Placental abruption Show forest plot | 1 | 459 | Risk Ratio (M‐H, Fixed, 95% CI) | 3.07 [0.13, 74.87] |
| 24 Pre‐eclampsia Show forest plot | 1 | 459 | Risk Ratio (M‐H, Fixed, 95% CI) | 0.63 [0.27, 1.49] |
| 25 Induction of labour Show forest plot | 1 | 459 | Risk Ratio (M‐H, Fixed, 95% CI) | 2.05 [1.78, 2.37] |
| 26 Vaginal birth Show forest plot | 3 | 546 | Risk Ratio (M‐H, Fixed, 95% CI) | 0.98 [0.90, 1.07] |
| 27 Assisted vaginal birth Show forest plot | 3 | 546 | Risk Ratio (M‐H, Fixed, 95% CI) | 1.19 [0.69, 2.04] |
| 28 Breastfeeding Show forest plot | 1 | 218 | Risk Ratio (M‐H, Fixed, 95% CI) | 1.09 [0.85, 1.40] |
| 29 Breastfeeding (weeks) Show forest plot | 1 | 124 | Mean Difference (IV, Fixed, 95% CI) | 1.74 [‐3.37, 6.85] |
| 30 Maternal hospital stay (days) (not pre‐specified) Show forest plot | 1 | 33 | Mean Difference (IV, Fixed, 95% CI) | 1.0 [0.68, 1.32] |