Parto prematuro programado versus manejo expectante del feto con sospecha de compromiso a término para mejorar los desenlaces
Información
- DOI:
- https://doi.org/10.1002/14651858.CD009433.pub2Copiar DOI

- Base de datos:
-
- Cochrane Database of Systematic Reviews
- Versión publicada:
-
- 24 noviembre 2015see what's new
- Tipo:
-
- Intervention
- Etapa:
-
- Review
- Grupo Editorial Cochrane:
-
Grupo Cochrane de Embarazo y parto
- Copyright:
-
- Copyright © 2016 The Cochrane Collaboration. Published by John Wiley & Sons, Ltd.
Cifras del artículo
Altmetric:
Citado por:
Autores
Contributions of authors
Diana Bond is guarantor for the review. Diana Bond and Dr Adrienne Gordon were responsible for the design, co‐ordination, research and writing of the review. All authors contributed with a clinical and methodological perspective as well as providing general advice for the review.
Sources of support
Internal sources
-
No sources of support supplied
External sources
-
Stillbirth Foundation, Australia.
-
National Institute for Health Research (NIHR), UKNIHR Cochrane Programme Grant Project: 13/89/05 – Pregnancy and childbirth systematic reviews to support clinical guidelines, UK.
Declarations of interest
Diana Bond: We are grateful to the Stillbirth Foundation Australia for their generous funding to support the Sydney Stillbirth Study. SFA has had no input or influence regarding the publication of this review.
Angela Carberry: None known.
Adrienne Gordon: Diana bond is supported for her work on another project by a grant from the stillbirth foundation Australia. The charity was not involved with this review and we do not believe there is a conflict of interest.
Jon Hyett: None known.
Jonathan Morris: None known.
Bradley de Vries: I am employed by Royal Prince Alfred Hospital as a staff specialist obstetrician.
Acknowledgements
As part of the pre‐publication editorial process, this review has been commented on by three peers (an editor and two referees who are external to the editorial team), a member of the Pregnancy and Childbirth Group's international panel of consumers and the Group's Statistical Adviser.
This project was supported by the National Institute for Health Research, via Cochrane programme Grant funding to Cochrane Pregnancy and Childbirth. The views and opinions expressed therein are those of the authors and do not necessarily reflect those of the Systematic Reviews Programme, NIHR, NHS or the Department of Health.
Helen West (HW) assisted with the production of the GRADE 'Summary of findings' table. HW is supported by the NIHR Cochrane Programme Grant Project: 13/89/05 – Pregnancy and childbirth systematic reviews to support clinical guidelines.
The authors would like to thank Kim Boers and Saskia le Cessie for provision of outcome data for those women randomised at 37 weeks or greater and Sverker Ek for responding to request for additional information.
Version history
| Published | Title | Stage | Authors | Version |
| 2015 Nov 24 | Planned early delivery versus expectant management of the term suspected compromised baby for improving outcomes | Review | Diana M Bond, Adrienne Gordon, Jon Hyett, Bradley de Vries, Angela E Carberry, Jonathan Morris | |
| 2011 Nov 09 | Planned early delivery versus expectant management of the term suspected compromised baby for improving outcomes | Protocol | Diana M Bond, Adrienne Gordon, Jon Hyett, Bradley de Vries, Angela E Carberry, Jonathan Morris | |
Differences between protocol and review
This review includes additional outcomes not pre‐specified in the protocol in order to include outcomes specified in the included studies. The additional outcomes are as follows.
-
Gestational age ≥ 40 weeks
-
Birthweight < 2.3 percentile (we have indicated in the review that we did a post hoc analysis of birthweight < 2.3 percentile and the reason why)
-
Admission to intermediate care nursery
-
Maternal hospital stay
This review also changed two maternal secondary outcomes.
-
Combined elective and emergency caesarean sections into one combined outcome
-
Deleted 'mode of induction' as this referred to induced women only, so was not a randomised comparison
The methods have been updated to include the current standard methods of Cochrane Pregnancy and Childbirth, including methods for GRADE and the incorporation of a 'Summary of findings' table. The background has been edited.
We have added information relating to Types of participants to specify that we will include women presenting with oligohydramnios or polyhydramnios, and growth measurements consistent with fetal growth restriction.
Keywords
MeSH
Medical Subject Headings (MeSH) Keywords
Medical Subject Headings Check Words
Female; Humans; Infant; Infant, Newborn; Pregnancy;
PICO

Study flow diagram.
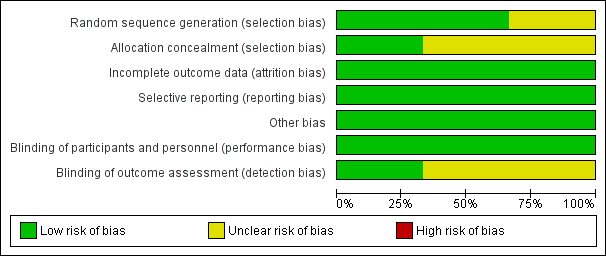
'Risk of bias' graph: review authors' judgements about each risk of bias item presented as percentages across all included studies.

'Risk of bias' summary: review authors' judgements about each risk of bias item for each included study.
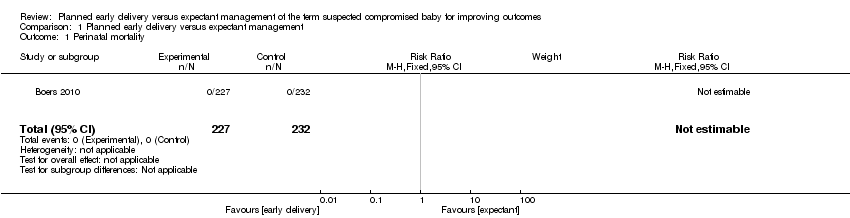
Comparison 1 Planned early delivery versus expectant management, Outcome 1 Perinatal mortality.

Comparison 1 Planned early delivery versus expectant management, Outcome 2 Major neonatal morbidity.
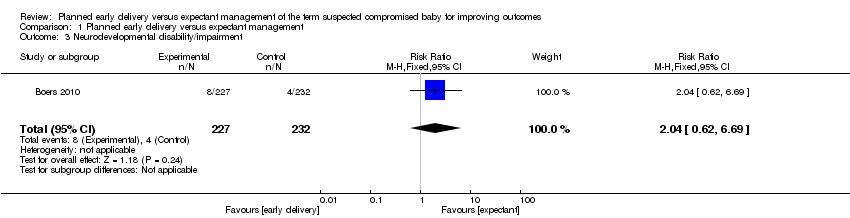
Comparison 1 Planned early delivery versus expectant management, Outcome 3 Neurodevelopmental disability/impairment.

Comparison 1 Planned early delivery versus expectant management, Outcome 4 Maternal mortality.

Comparison 1 Planned early delivery versus expectant management, Outcome 5 Major maternal morbidity.

Comparison 1 Planned early delivery versus expectant management, Outcome 6 Neonatal seizures.
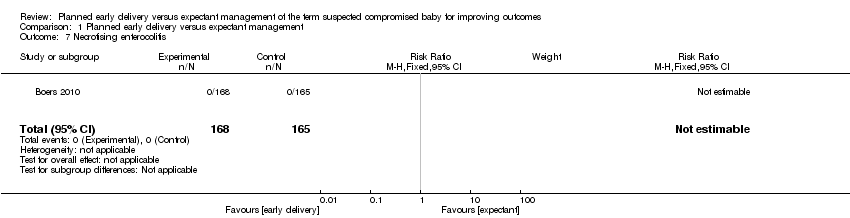
Comparison 1 Planned early delivery versus expectant management, Outcome 7 Necrotising enterocolitis.

Comparison 1 Planned early delivery versus expectant management, Outcome 8 Respiratory distress syndrome.
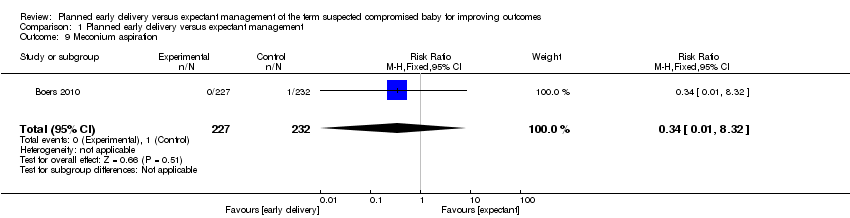
Comparison 1 Planned early delivery versus expectant management, Outcome 9 Meconium aspiration.
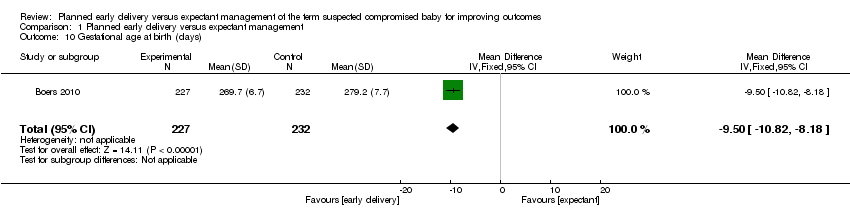
Comparison 1 Planned early delivery versus expectant management, Outcome 10 Gestational age at birth (days).
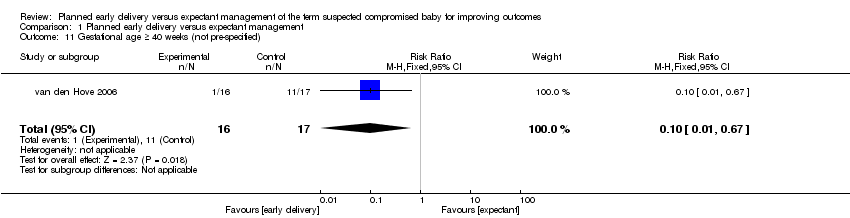
Comparison 1 Planned early delivery versus expectant management, Outcome 11 Gestational age ≥ 40 weeks (not pre‐specified).
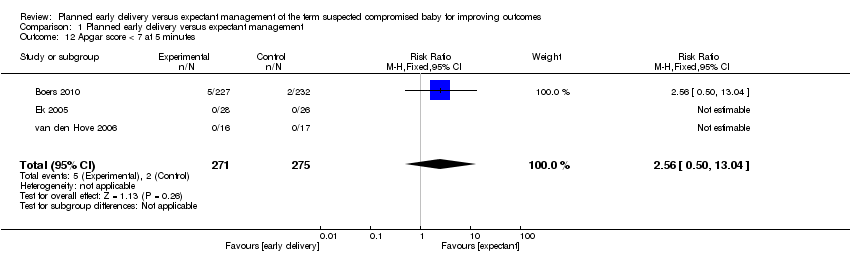
Comparison 1 Planned early delivery versus expectant management, Outcome 12 Apgar score < 7 at 5 minutes.

Comparison 1 Planned early delivery versus expectant management, Outcome 13 Resuscitation required.
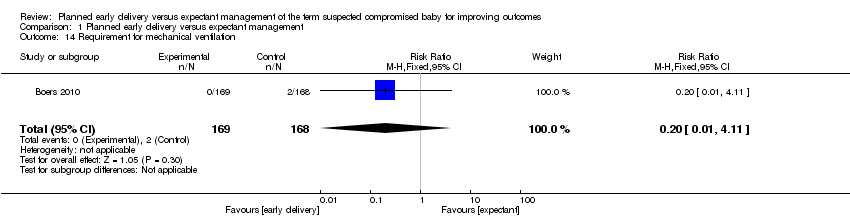
Comparison 1 Planned early delivery versus expectant management, Outcome 14 Requirement for mechanical ventilation.

Comparison 1 Planned early delivery versus expectant management, Outcome 15 Birthweight < 10 centile.
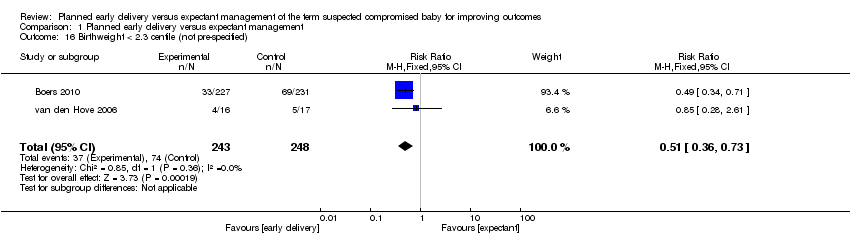
Comparison 1 Planned early delivery versus expectant management, Outcome 16 Birthweight < 2.3 centile (not pre‐specified).
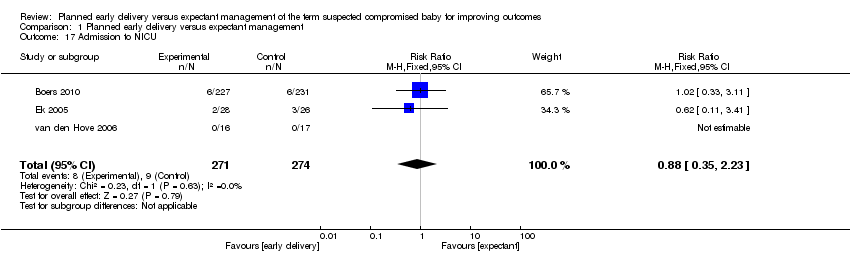
Comparison 1 Planned early delivery versus expectant management, Outcome 17 Admission to NICU.
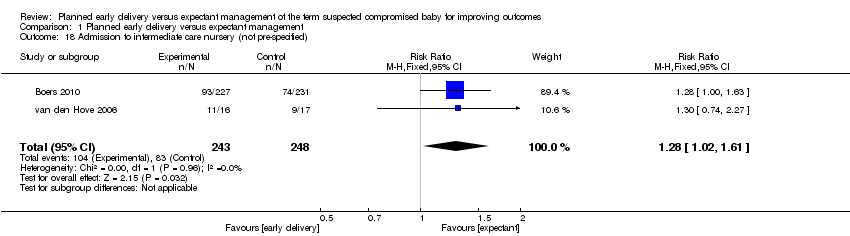
Comparison 1 Planned early delivery versus expectant management, Outcome 18 Admission to intermediate care nursery (not pre‐specified).
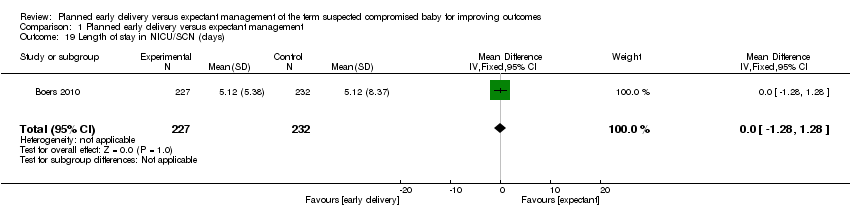
Comparison 1 Planned early delivery versus expectant management, Outcome 19 Length of stay in NICU/SCN (days).

Comparison 1 Planned early delivery versus expectant management, Outcome 20 Interval (days) between randomisation and delivery.

Comparison 1 Planned early delivery versus expectant management, Outcome 21 Neonatal sepsis.
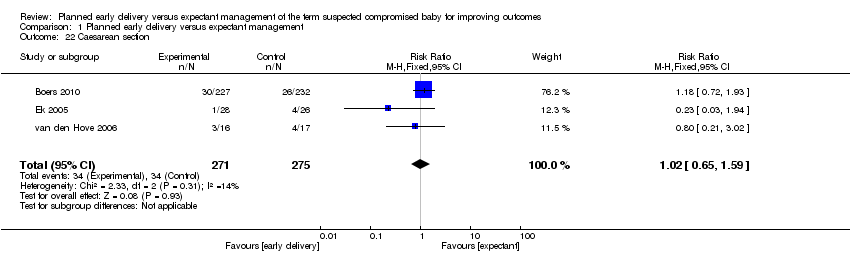
Comparison 1 Planned early delivery versus expectant management, Outcome 22 Caesarean section.
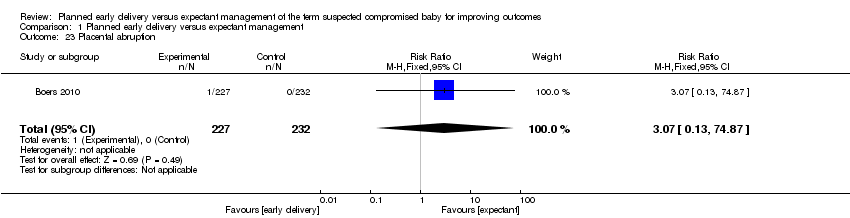
Comparison 1 Planned early delivery versus expectant management, Outcome 23 Placental abruption.
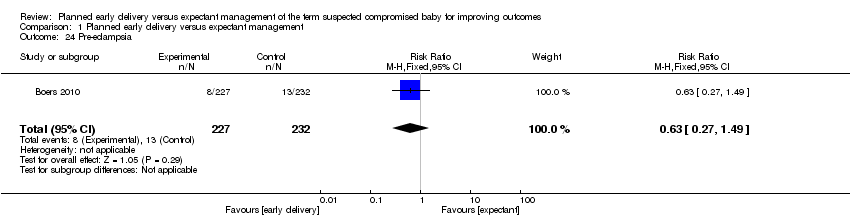
Comparison 1 Planned early delivery versus expectant management, Outcome 24 Pre‐eclampsia.

Comparison 1 Planned early delivery versus expectant management, Outcome 25 Induction of labour.
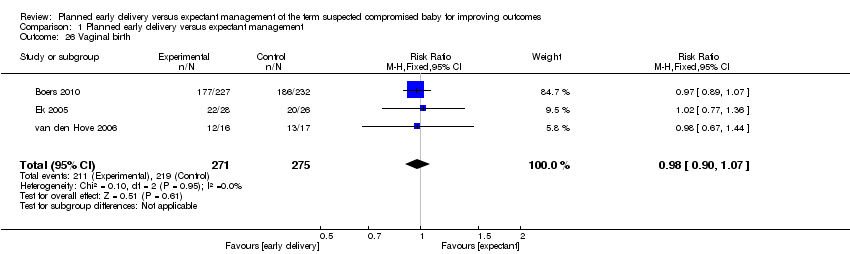
Comparison 1 Planned early delivery versus expectant management, Outcome 26 Vaginal birth.

Comparison 1 Planned early delivery versus expectant management, Outcome 27 Assisted vaginal birth.

Comparison 1 Planned early delivery versus expectant management, Outcome 28 Breastfeeding.
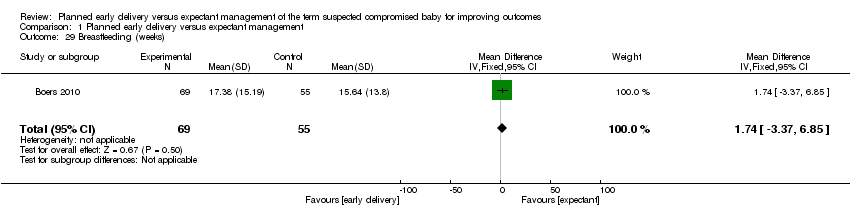
Comparison 1 Planned early delivery versus expectant management, Outcome 29 Breastfeeding (weeks).
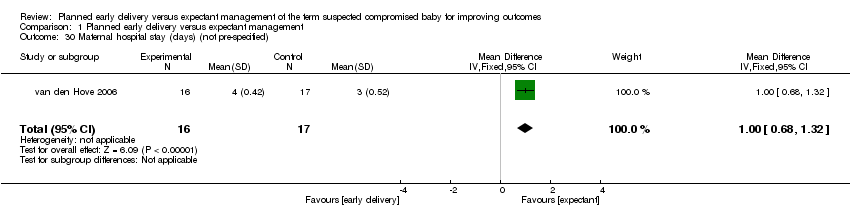
Comparison 1 Planned early delivery versus expectant management, Outcome 30 Maternal hospital stay (days) (not pre‐specified).
| Planned early delivery compared with expectant management for improving outcomes of the term suspected compromised baby | ||||||
| Patient or population: pregnant women with a term suspected compromised baby | ||||||
| Outcomes | Illustrative comparative risks* (95% CI) | Relative effect | No of participants | Quality of the evidence | Comments | |
| Assumed risk | Corresponding risk | |||||
| Expectant management | Planned early delivery | |||||
| Perinatal mortality | See comment | See comment | Not estimable | 459 | ⊕⊕⊕⊝ | |
| Major neonatal morbidity | Study population | RR 0.15 | 459 | ⊕⊕⊝⊝ | ||
| 13 per 1000 | 2 per 1000 | |||||
| Neurodevelopmental disability/impairment | Study population | RR 2.04 | 459 | ⊕⊕⊝⊝ | ||
| 17 per 1000 | 35 per 1000 | |||||
| Maternal mortality | Study population | RR 3.07 | 459 | ⊕⊕⊝⊝ | ||
| 0 per 1000 | 0 per 1000 | |||||
| Significant maternal morbidity | Study population | RR 0.92 | 459 | ⊕⊕⊝⊝ | ||
| 43 per 1000 | 40 per 1000 | |||||
| Admission to NICU | Study population | RR 0.88 | 545 | ⊕⊝⊝⊝ | ||
| 33 per 1000 | 29 per 1000 | |||||
| Moderate | ||||||
| 26 per 1000 | 23 per 1000 | |||||
| Caesarean section | Study population | RR 1.02 | 546 | ⊕⊕⊝⊝ | ||
| 124 per 1000 | 126 per 1000 | |||||
| Moderate | ||||||
| 154 per 1000 | 157 per 1000 | |||||
| *The basis for the assumed risk (e.g. the median control group risk across studies) is provided in footnotes. The corresponding risk (and its 95% confidence interval) is based on the assumed risk in the comparison group and the relative effect of the intervention (and its 95% CI). | ||||||
| GRADE Working Group grades of evidence | ||||||
| 1 There were no events for this outcome. CBCL: child behaviour checklist | ||||||
| Outcome or subgroup title | No. of studies | No. of participants | Statistical method | Effect size |
| 1 Perinatal mortality Show forest plot | 1 | 459 | Risk Ratio (M‐H, Fixed, 95% CI) | 0.0 [0.0, 0.0] |
| 2 Major neonatal morbidity Show forest plot | 1 | 459 | Risk Ratio (M‐H, Fixed, 95% CI) | 0.15 [0.01, 2.81] |
| 3 Neurodevelopmental disability/impairment Show forest plot | 1 | 459 | Risk Ratio (M‐H, Fixed, 95% CI) | 2.04 [0.62, 6.69] |
| 4 Maternal mortality Show forest plot | 1 | 459 | Risk Ratio (M‐H, Fixed, 95% CI) | 3.07 [0.13, 74.87] |
| 5 Major maternal morbidity Show forest plot | 1 | 459 | Risk Ratio (M‐H, Fixed, 95% CI) | 0.92 [0.38, 2.22] |
| 6 Neonatal seizures Show forest plot | 1 | 336 | Risk Ratio (M‐H, Fixed, 95% CI) | 0.0 [0.0, 0.0] |
| 7 Necrotising enterocolitis Show forest plot | 1 | 333 | Risk Ratio (M‐H, Fixed, 95% CI) | 0.0 [0.0, 0.0] |
| 8 Respiratory distress syndrome Show forest plot | 1 | 333 | Risk Ratio (M‐H, Fixed, 95% CI) | 0.33 [0.01, 7.98] |
| 9 Meconium aspiration Show forest plot | 1 | 459 | Risk Ratio (M‐H, Fixed, 95% CI) | 0.34 [0.01, 8.32] |
| 10 Gestational age at birth (days) Show forest plot | 1 | 459 | Mean Difference (IV, Fixed, 95% CI) | ‐9.5 [‐10.82, ‐8.18] |
| 11 Gestational age ≥ 40 weeks (not pre‐specified) Show forest plot | 1 | 33 | Risk Ratio (M‐H, Fixed, 95% CI) | 0.10 [0.01, 0.67] |
| 12 Apgar score < 7 at 5 minutes Show forest plot | 3 | 546 | Risk Ratio (M‐H, Fixed, 95% CI) | 2.56 [0.50, 13.04] |
| 13 Resuscitation required Show forest plot | 1 | 459 | Risk Ratio (M‐H, Fixed, 95% CI) | 0.11 [0.01, 2.10] |
| 14 Requirement for mechanical ventilation Show forest plot | 1 | 337 | Risk Ratio (M‐H, Fixed, 95% CI) | 0.20 [0.01, 4.11] |
| 15 Birthweight < 10 centile Show forest plot | 2 | 491 | Risk Ratio (M‐H, Fixed, 95% CI) | 0.98 [0.88, 1.10] |
| 16 Birthweight < 2.3 centile (not pre‐specified) Show forest plot | 2 | 491 | Risk Ratio (M‐H, Fixed, 95% CI) | 0.51 [0.36, 0.73] |
| 17 Admission to NICU Show forest plot | 3 | 545 | Risk Ratio (M‐H, Fixed, 95% CI) | 0.88 [0.35, 2.23] |
| 18 Admission to intermediate care nursery (not pre‐specified) Show forest plot | 2 | 491 | Risk Ratio (M‐H, Fixed, 95% CI) | 1.28 [1.02, 1.61] |
| 19 Length of stay in NICU/SCN (days) Show forest plot | 1 | 459 | Mean Difference (IV, Fixed, 95% CI) | 0.0 [‐1.28, 1.28] |
| 20 Interval (days) between randomisation and delivery Show forest plot | 1 | 459 | Mean Difference (IV, Fixed, 95% CI) | ‐8.68 [‐10.04, ‐7.32] |
| 21 Neonatal sepsis Show forest plot | 2 | 366 | Risk Ratio (M‐H, Fixed, 95% CI) | 3.18 [0.14, 72.75] |
| 22 Caesarean section Show forest plot | 3 | 546 | Risk Ratio (M‐H, Fixed, 95% CI) | 1.02 [0.65, 1.59] |
| 23 Placental abruption Show forest plot | 1 | 459 | Risk Ratio (M‐H, Fixed, 95% CI) | 3.07 [0.13, 74.87] |
| 24 Pre‐eclampsia Show forest plot | 1 | 459 | Risk Ratio (M‐H, Fixed, 95% CI) | 0.63 [0.27, 1.49] |
| 25 Induction of labour Show forest plot | 1 | 459 | Risk Ratio (M‐H, Fixed, 95% CI) | 2.05 [1.78, 2.37] |
| 26 Vaginal birth Show forest plot | 3 | 546 | Risk Ratio (M‐H, Fixed, 95% CI) | 0.98 [0.90, 1.07] |
| 27 Assisted vaginal birth Show forest plot | 3 | 546 | Risk Ratio (M‐H, Fixed, 95% CI) | 1.19 [0.69, 2.04] |
| 28 Breastfeeding Show forest plot | 1 | 218 | Risk Ratio (M‐H, Fixed, 95% CI) | 1.09 [0.85, 1.40] |
| 29 Breastfeeding (weeks) Show forest plot | 1 | 124 | Mean Difference (IV, Fixed, 95% CI) | 1.74 [‐3.37, 6.85] |
| 30 Maternal hospital stay (days) (not pre‐specified) Show forest plot | 1 | 33 | Mean Difference (IV, Fixed, 95% CI) | 1.0 [0.68, 1.32] |