Добавки витамина Е у людей с муковисцидозом
Appendices
Appendix 1. Glossary
| Term | Explanation |
| cerebellar ataxia | failure of muscular coordination and irregularity of muscular action characterized by defects in rate, range, force and direction of movement of limbs |
| myopathy | a disease of muscle or muscle tissue, especially skeletal muscle |
| peripheral neuropathy | any damage to the peripheral nerves (which are the nerves outside the brain and the spinal cord) |
| pigmented retinopathy | a disorder of the retina characterized by deposits of pigment and increasing loss of vision |
| visual field contrition | narrowing (or loss) of the visual fields ‐ which is the area simultaneously visible to one eye without movement |
Appendix 2. Search strategies
ISRCTN website and clinical trials.gov
The most recent searches were conducted on August 30, 2014.
We used the following search terms:
cystic fibrosis
cystic fibrosis AND vitamin E
cystic fibrosis AND tocopherol
cystic fibrosis AND toco*
cystic fibrosis AND alpha tocopherol

Study flow diagram

Comparison 1 Water‐miscible vitamin E supplementation versus control, Outcome 1 Serum vitamin E levels.
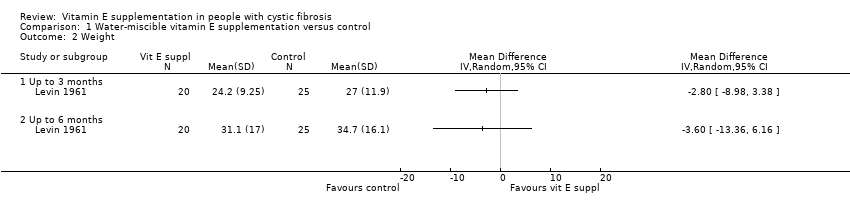
Comparison 1 Water‐miscible vitamin E supplementation versus control, Outcome 2 Weight.
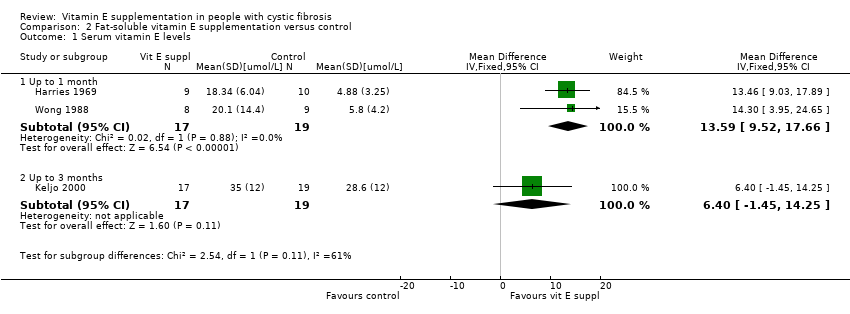
Comparison 2 Fat‐soluble vitamin E supplementation versus control, Outcome 1 Serum vitamin E levels.
| Outcome or subgroup title | No. of studies | No. of participants | Statistical method | Effect size |
| 1 Serum vitamin E levels Show forest plot | 3 | Mean Difference (IV, Fixed, 95% CI) | Subtotals only | |
| 1.1 Up to 1 month | 2 | 32 | Mean Difference (IV, Fixed, 95% CI) | 17.66 [10.59, 24.74] |
| 1.2 Up to 3 months | 1 | 45 | Mean Difference (IV, Fixed, 95% CI) | 11.61 [4.77, 18.45] |
| 1.3 Up to 6 months | 1 | 45 | Mean Difference (IV, Fixed, 95% CI) | 19.74 [13.48, 26.00] |
| 2 Weight Show forest plot | 1 | Mean Difference (IV, Random, 95% CI) | Totals not selected | |
| 2.1 Up to 3 months | 1 | Mean Difference (IV, Random, 95% CI) | 0.0 [0.0, 0.0] | |
| 2.2 Up to 6 months | 1 | Mean Difference (IV, Random, 95% CI) | 0.0 [0.0, 0.0] | |
| Outcome or subgroup title | No. of studies | No. of participants | Statistical method | Effect size |
| 1 Serum vitamin E levels Show forest plot | 3 | Mean Difference (IV, Fixed, 95% CI) | Subtotals only | |
| 1.1 Up to 1 month | 2 | 36 | Mean Difference (IV, Fixed, 95% CI) | 13.59 [9.52, 17.66] |
| 1.2 Up to 3 months | 1 | 36 | Mean Difference (IV, Fixed, 95% CI) | 6.40 [‐1.45, 14.25] |