| NMES for adults with advanced disease for muscle weakness |
| Patient or population: adults with advanced disease for muscle weakness
Settings: hospital, community, or home settings
Intervention: NMES Control: no intervention (7 studies), placebo NMES (8 studies), or resistance training (1 study) |
| Quadriceps muscle strength
Handheld or fixed dynamometry
Follow‐up: median 6 weeks | The mean change was 0.43 standard deviations from baseline. | The mean change in the intervention groups was 0.53 standard deviations higher (ranging from 0.19 to 0.87 standard deviations higher). | 781
(12 studies) | ⊕⊕⊝⊝
low1,2 |
| Safety
Serious adverse events
Follow‐up: median 6 weeks | No serious adverse events related to control interventions reported. | No serious adverse events related to NMES reported. | 933
(18 studies) | ⊕⊕⊕⊝
moderate3 |
| Safety Adverse events: Muscle discomfort
Follow‐up: median 6 weeks | 0/415 (0%) participants reported muscle discomfort following control interventions. | 19/518 (3.7%) participants reported muscle discomfort following NMES. | 933 (18 studies) | ⊕⊕⊕⊝
moderate3 |
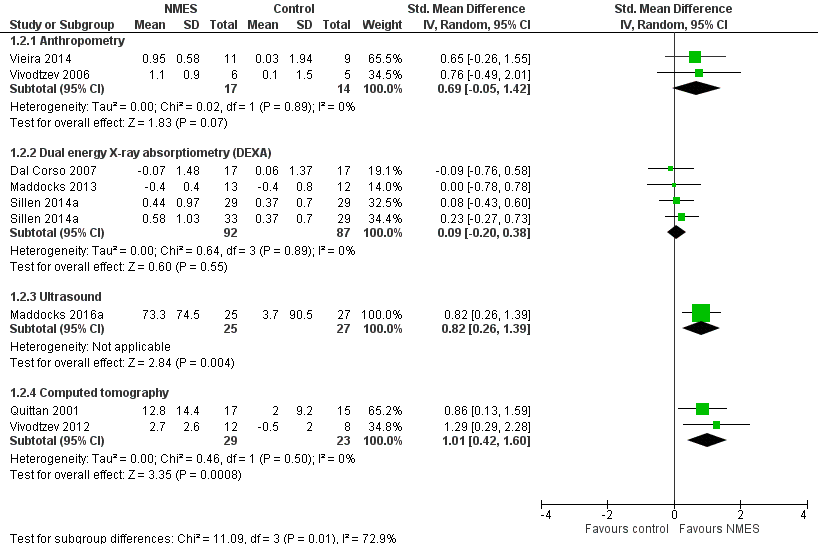
| Muscle mass
Anthropometry, DEXA, ultrasound, computed tomography
Follow‐up: 4 to 9 weeks | The mean change in muscle mass ranged from 0.04 to 0.49 standard deviations from baseline across the different assessment modalities used. | The mean change in muscle mass ranged from 0.09 to 1.01 standard deviations higher across the different assessment modalities used. | 314
(8 studies) | ⊕⊝⊝⊝
very low4,5,6,7 |
| Exercise performance ‐ walking distance
6MWT, ISWT, ESWT
Follow‐up: median 6 weeks | The mean change in distance walked was 21, 36, and 37 metres from baseline across the different walking tests used. | The mean change in distance walked was 35, 9, and 64 metres further across the different walking tests used. | 788
(13 studies) | ⊕⊝⊝⊝
very low2,7,8,9 |
| Exercise performance ‐ peak oxygen uptake
Follow‐up: median 6 weeks | The mean change in peak oxygen uptake was ‐0.4 mL/min from baseline. | The mean exercise performance ‐ peak oxygen uptake in the intervention groups was 44.8 mL/min higher (95% CI 7.3 lower to 97.0 higher) | 109
(4 studies) | ⊕⊕⊝⊝
low7,9 |
| *The basis for the assumed risk is the mean change from baseline in the control groups. The corresponding risk (and its 95% confidence interval) is based on the assumed risk in the comparison group and the relative effect of the intervention (and its 95% CI).
6MWT: 6‐minute walk test; CI: confidence interval; DEXA: dual energy X‐ray absorptiometry; ESWT: endurance shuttle walk test; ISWT: incremental shuttle walk test |
| GRADE Working Group grades of evidence
High quality: Further research is very unlikely to change our confidence in the estimate of effect.
Moderate quality: Further research is likely to have an important impact on our confidence in the estimate of effect and may change the estimate.
Low quality: Further research is very likely to have an important impact on our confidence in the estimate of effect and is likely to change the estimate.
Very low quality: We are very uncertain about the estimate. |