Interventionen zur Vorbeugung oder Minderung häuslicher Gewalt gegenüber schwangeren Frauen
Abstract
Background
Domestic violence during pregnancy is a major public health concern. This preventable risk factor threatens both the mother and baby. Routine perinatal care visits offer opportunities for healthcare professionals to screen and refer abused women for effective interventions. It is, however, not clear which interventions best serve mothers during pregnancy and postpartum to ensure their safety.
Objectives
To examine the effectiveness and safety of interventions in preventing or reducing domestic violence against pregnant women.
Search methods
We searched the Cochrane Pregnancy and Childbirth Group's Trials Register (31 July 2014), scanned bibliographies of published studies and corresponded with investigators.
Selection criteria
We included randomised controlled trials (RCTs) including cluster‐randomised trials, and quasi‐randomised controlled trials (e.g. where there was alternate allocation) investigating the effect of interventions in preventing or reducing domestic violence during pregnancy.
Data collection and analysis
Two review authors independently assessed trials for inclusion and risk of bias, extracted data and checked them for accuracy.
Main results
We included 10 trials with a total of 3417 women randomised. Seven of these trials, recruiting 2629 women, contributed data to the review. However, results for all outcomes were based on single studies. There was limited evidence for the primary outcomes of reduction of episodes of violence (physical, sexual, and/or psychological) and prevention of violence during and up to one year after pregnancy (as defined by the authors of trials). In one study, women who received the intervention reported fewer episodes of partner violence during pregnancy and in the postpartum period (risk ratio (RR) 0.62, 95% confidence interval (CI) 0.43 to 0.88, 306 women, moderate quality). Groups did not differ for Conflict Tactics Score ‐ the mean partner abuse scores in the first three months postpartum (mean difference (MD) 4.20 higher, 95% CI ‐10.74 to 19.14, one study, 46 women, very low quality). The Current Abuse Score for partner abuse in the first three months was also similar between groups (MD ‐0.12 lower, 95% CI ‐0.31 lower to 0.07 higher, one study, 191 women, very low quality). Evidence for the outcomes episodes of partner abuse during pregnancy or episodes during the first three months postpartum was not significant (respectively, RR 0.50, 95% CI 0.25 to 1.02, one study with 220 women, very low quality; and RR 0.60, 95% CI 0.35 to 1.04, one study, 271 women, very low quality). Finally, the risk for low birthweight (< 2500 g) did not differ between groups (RR 0.74, 95 % CI 0.41 to 1.32, 306 infants, low quality).
There were few statistically significant differences between intervention and control groups for depression during pregnancy and the postnatal period. Only one study reported findings for neonatal outcomes such as preterm delivery and birthweight, and there were no clinically significant differences between groups. None of the studies reported results for other secondary outcomes: Apgar score less than seven at one minute and five minutes, stillbirth, neonatal death, miscarriage, maternal mortality, antepartum haemorrhage, and placental abruption.
Authors' conclusions
There is insufficient evidence to assess the effectiveness of interventions for domestic violence on pregnancy outcomes. There is a need for high‐quality, RCTs with adequate statistical power to determine whether intervention programs prevent or reduce domestic violence episodes during pregnancy, or have any effect on maternal and neonatal mortality and morbidity outcomes.
PICO
Laienverständliche Zusammenfassung
Vorbeugung oder Minderung von Partnergewalt gegen Frauen während der Schwangerschaft
Gewalt gegen schwangere Frauen vonseiten ihrer Partner ist ein wichtiges Thema für die öffentlichen Gesundheit. Sie kann den Frauen körperlichen und seelischen Schaden zufügen, Komplikationen in der Schwangerschaft verursachen und der Gesundheit des Kindes schaden. Es ist unklar, welche Art von Intervention am besten geeignet ist, die Frauen und ihre Kinder während der Schwangerschaft und nach der Geburt zu schützen. Zu den Interventionen, die funktionieren können, gehören Beratung und Psychotherapie, um das Selbstvertrauen der Frauen zu stärken und sie zu ermutigen, Strategien zu entwickeln, um Misshandlung zu vermeiden. Auch das Überweisen an Sozialarbeiter, Mutter‐Kind‐Häuser oder andere gemeindenahe Angebote könnten helfen. Gewalttätige Partner können in spezialisierte Therapieprogramme aufgenommen werden.
Die üblichen Geburtsvorbereitungsangebote bieten dem Gesundheitspersonal die Möglichkeit, Frauen zu identifizieren, die einem Risiko für Misshandlung ausgesetzt sind. In diesem Review betrachteten wir 10 randomisierte Studien mit insgesamt 3417 Frauen. Sieben dieser Studien betrafen schwangere Frauen, die einem hohen Risiko von Partnergewalt ausgesetzt waren. Die in den Studien untersuchten Interventionen umfassten eine einmalige kurze Einzelberatung, Fallmanagement und die Überweisung an Sozialarbeiter sowie mehrere Therapiesitzungen während der Schwangerschaft und nach der Geburt. Aufgrund mangelnder Daten und der Tatsache, dass die Auswirkung der Interventionen unterschiedlich erfasst wurden, waren wir nicht in der Lage, Interventionen auszumachen, die besser geeignet waren als andere. Die Studien konzentrierten sich auf unterschiedliche Auswirkungen und wir waren nicht in der Lage, die Informationen so zusammenzufassen, dass Schlussfolgerungen zur Gesamtwirksamkeit der Interventionen möglich waren. Die meisten Studien gaben nicht Aufschluss darüber, ob die Gewaltepisoden zurückgegangen waren oder nicht. Eine einzige Studie belegte, dass die Gesamtanzahl der Frauen, die über Partnergewalt während der Schwangerschaft und nach der Geburt berichteten, zurückging, wenn sie psychotherapeutisch behandelt wurden. Mehrere Studien untersuchten, ob die behandelten Frauen weniger depressiv waren nach der Geburt des Kindes. Die Evidenz war jedoch nicht schlüssig. Über andere Folgen für das Baby, wie geringeres Geburtsgewicht und Frühgeburt, wurde nur in einer einzigen Studie berichtet. Die Intervention verringerte das Risiko einer Frühgeburt (< 2500 g) nicht. Keine der Studien berichtete über Ergebnisse hinsichtlich schwerwiegender Folgen wie Totgeburt, Tod des Neugeborenen, Fehlgeburt, Tod der Mutter während oder nach der Schwangerschaft, vorgeburtliche Blutung und vorzeitige Plazentaablösung. Es werden weitere Daten aus gut durchgeführten Studien benötigt, bevor ein bestimmter Interventionsansatz empfohlen werden kann.
Authors' conclusions
Summary of findings
| Any intervention to prevent violence (all interventions) versus standard care for preventing or reducing domestic violence against pregnant women | ||||||
| Patient or population: all pregnant women | ||||||
| Outcomes | Illustrative comparative risks* (95% CI) | Relative effect | No of Participants | Quality of the evidence | Comments | |
| Assumed risk | Corresponding risk | |||||
| Control | Any intervention to prevent violence (all interventions) versus standard care | |||||
| Partner abuse: episodes during pregnancy | Study population | RR 0.5 | 220 | ⊕⊝⊝⊝ | ||
| 182 per 1000 | 91 per 1000 | |||||
| Partner abuse: episodes during the first 3 months postpartum | Study population | RR 0.6 | 271 | ⊕⊝⊝⊝ | ||
| 212 per 1000 | 127 per 1000 | |||||
| Partner abuse: abuse score in the first 3 months postpartum (Conflict Tactics Score*) The CTS is a 19‐item self‐report scale listing behaviours that the respondent’s partner might use in conflicts. Women report the frequency of partner behaviours over the past year on a 7‐point scale where 0 = never and 6 = 20 or more times. | The mean partner abuse: abuse score in the first 3 months postpartum in the intervention groups was | 46 | ⊕⊝⊝⊝ | |||
| Partner abuse in the first 3 months postpartum (Current Abuse Score**) The Current abuse score consists of 2 scales: 1) Abuse Assessment Screen (AAS) and 2) Prenatal Psychosocial Profile (PPP). | The mean partner abuse in the first 3 months postpartum (current abuse score) in the intervention groups was | 191 | ⊕⊝⊝⊝ | |||
| Partner abuse: total episodes at final study assessment (pregnancy and up to 10 weeks postpartum) | Study population | RR 0.62 | 306 | ⊕⊕⊕⊝ | ||
| 378 per 1000 | 234 per 1000 | |||||
| Number of low‐birthweight (< 2500 g) babies | Study population | RR 0.74 | 306 | ⊕⊕⊝⊝ | ||
| 154 per 1000 | 114 per 1000 | |||||
| *The Abuse Assessment Screen (AAS) tool was used to for screening. Respondents who answered ‘yes’ to being physically or emotionally hurt by someone or forced to have sexual activities within the last year were considered abused. These women, who responded "Yes" to AAS tool, were administered the Conflict Tactics Score (CTS). RR: risk ratio; CI: confidence interval | ||||||
| GRADE Working Group grades of evidence | ||||||
| 1 All studies contributing data had design limitations. | ||||||
Background
Description of the condition
Violence against women and girls is a major health and human rights concern (Beydoun 2010). Women can experience physical or mental abuse throughout their lifecycle, in infancy, childhood, adolescence, during adulthood or older age (Parker 1994; Petersen 1997). Violence has severe health consequences (Feder 2009), and is a social problem that warrants an immediate co‐ordinated response from multiple sectors including healthcare providers and social workers (Goodwin 1990; Newberger 1992).
Violence against women by partners is referred to as domestic violence (DV), spousal assault, intimate partner violence (IPV), wife abuse, wife assault, and battered wife syndrome (Bohn 1996; McFarlane 1996). Most researchers define DV as threats of, or actual physical injury from hitting, slapping, punching, choking, kicking, injury with a weapon, or otherwise injuring an intimate partner (Browne 1997; Campbell 1992; Parker 2002; Stark 1999). Assault and coercive behaviours include physical, sexual, and psychological/emotional attacks, and threats against property, children and pets, economic coercion, and many more such acts. Some are injurious and criminal in nature, while others are not (Hedin 2000). The consequences of abuse are varied, and women suffering DV do not present with a particular set of symptoms. Given this variation, the concept of DV should not be conceptualised as a disease or syndrome, nor should it be considered as a specific health problem (e.g. injury or reproductive, physical, or mental health problem). In fact, more often than not, victims demonstrate strength and ability to take care of themselves and their infant in spite of often untenable situations. However, it is clear that abuse puts the victim at greatly increased risk of a multitude of physical and mental health problems (Howard 2010).
Although estimating the prevalence of DV is difficult (Ballard 1998) and estimates vary, especially during pregnancy, it is likely that most providers of women's healthcare services will encounter many pregnant women who are survivors of DV. For almost 30% of women who experience DV, the first incident occurs in pregnancy (Rodriguez 2001). The prevalence of physical abuse during pregnancy varies around the world: in Canada, reported prevalence ranges from 1.0% to 10.9% (Daoud 2012); in the United States, 0.9% to 20.1% (Gazmararian 1996 ); in the United Kingdom, 1.8% at booking, 5.8% at 34 weeks of gestation and 5.0% at 10 days postpartum (Bacchus 2004); in Sweden, 4.3% (Hedin 1999); in South Africa, 6.8% (Jewkes 2001); and Jejeebhoy 1998 has reported high rates of abuse in India. The prevalence of psychological and sexual maltreatment of women during pregnancy has also been reported at between 13% and 60% (Hedin 1999; Jahanfar 2007; Valladares 2005). DV is reported within all socio‐economic class groupings, but it is most prevalent within the working and lower middle socio‐economic classes (Babu 2009; Nagassar 2010).
Abuse during pregnancy is of particular concern because it is a threat to both maternal and child health (Lewis 2007; Lewis 2011; Shah 2010). It directly (e.g. via trauma to the abdomen) and indirectly affects the mortality and morbidity of fetus and mother. Other health‐related problems and adverse economic circumstances enhance the risk of adverse pregnancy outcomes. It is a chronic problem for mothers and infants as violence exposure tends to continue after pregnancy (Taft 2009b).
Studies to date have demonstrated that physical abuse before, during, and after pregnancy is associated with reproductive health problems such as sexually transmitted diseases (Rodriguez 2001), urinary tract infection (Gazmararian 1996), depression, substance abuse (Rose 2010) and other mental health problems (Browne 1997; Canterino 1999; El Kady 2005). Domestic violence is associated with a higher incidence of unwanted pregnancy (Browne 1997; Parker 2002) and intentional abortions (Canadian Centre for Justice Statistics 2000).
There are many negative effects of DV on pregnancy. The following harms have been clearly documented: maternal deaths (Lewis 2007; Lewis 2011; Saltzman 2003), low birthweight (Chamberlain 2000; Jewkes 2001; Lipsky 2003), placental abruption (Hedin 2000), preterm labour and delivery (Harwin 2006), fetomaternal haemorrhage, fetal death (Mezey 2000), intrauterine growth restriction (Janssen 2003), pregnancy complications due to trauma (Jejeebhoy 1998), miscarriage (Chamberlain 2000), maternal infections, and poor weight gain (Wiist 1999). In addition, DV negatively affects pregnant women's health behaviours (World Health Organization 2000) leading to delayed entry into prenatal care or to women seeking no care at all (Diaz‐Olavarrieta 2002), and increases behavioural risks such as the use of tobacco, alcohol, and illicit drugs, and poor maternal nutrition (Bacchus 2004; Family Violence Prevention Fund 1999; Ng 2005; Parsons 2000; Wathen 2003).
Physical injuries to fetuses and infants, such as bruising, broken bones, and stab wounds, as well as death, have also been described (Ezechi 2004; Valladares 2005). Child abuse is also reported more often among families with a history of DV (Feldhaus 1997) and antenatal violence is associated with an increased risk of child behavioural problems (Flach 2011).
Description of the intervention
There are a number of interventions that have been examined in relation to violence prevention for pregnant women. A review by Sharps 2008 suggested that perinatal home‐visiting programs are likely to reduce the incidence of physical abuse and improve pregnancy and infant outcomes. Another review by Van Parys 2014 stated that there is a lack of evidence as to which intervention is effective during the perinatal period. Nevertheless, some interventions such as home visitation programs and some multifaceted counselling interventions showed promising results. Several studies show that interventions such as wallet‐size cards with community resources listed, spending time in a shelter, individual counselling, and home social support programs, alone or in combination, may decrease physical abuse (McFarlane 2006; Parker 1999). A review focusing on women recruited in DV shelters or refuges suggests that intensive advocacy may reduce physical abuse one to two years after the intervention (Ramsay 2009). There is currently no systematic review examining interventions specifically focusing on pregnant women.
During routine prenatal checkups, the clinician has the opportunity to screen women and then refer to various intervention programs. For women, both screening and intervention programs could lead to referral of identified individuals to appropriate healthcare specialists or agencies for support such as referral to social workers, shelters, counselling or other community‐based resources. For partners, referral can be made to 'batterer' treatment programs. The effectiveness of these programs is not clear (Arias 2002).
Available studies to date have investigated the effectiveness of DV screening on reduction of violence or improving women's health outcomes (Feder 2009; Nelson 2012; Spangaro 2010), but these studies have not investigated pregnancy outcomes.
It is clear that unless DV risk is reduced, screening efforts are of little use. Thus reviews investigating the effectiveness of screening alone are relevant to the topic in hand and worth mentioning. Acceptability and effectiveness of screening for women presenting in prenatal clinics has been studied (Ramsay 2002) and findings suggest that screening programs in antenatal clinics generally increased rates of identification of women experiencing DV. More recent studies provide evidence that universal screening is associated with improved pregnancy outcomes (Coker 2012). Screening programs that took a comprehensive approach (i.e., incorporated multiple program components, including institutional support) were successful in increasing DV identification rates (O'Campo 2011). This evidence suggests that screening for DV may be a useful component of routine antenatal assessment (Janssen 2006).
How the intervention might work
Often, the goal of intervention is to reduce further abuse. Some interventions are designed to improve women's empowerment and to enhance their independence and control. Some attempt to keep women from danger of extreme violence and teach women how to stay safe. Generally, safeguarding women from harm, managing symptoms, conducting a safe communication with others when in an abusive relationship, increasing women's confidence, and improving family networks and relationships are the major objectives of interventional programs (Ford‐Gilboe 2011). Healthcare providers may make positive contributions to women's access to special services designed to reduce violence. These interventions may reduce women's exposure to violence and more generally improve women's health (Kramer 2004; McCloskey 2006). Reducing the contact between partners in violent relationships also reduces opportunities for further abuse and potential harmful activities (Dugan 2003).
Why it is important to do this review
Current literature on the subject is inconclusive (O'Reilly 2010). Some reviews have concluded that there is insufficient evidence to show whether or not interventions or screening are effective (Nelson 2012). Conversely, Horiuchi 2009 has suggested that screening and interventions for pregnant women would be beneficial. It is therefore necessary to obtain a more comprehensive review of the existing evidence to identify the benefit or harm attributed to commonly practiced interventions to prevent or reduce DV.
Moreover, pregnancy is a unique window of opportunity to screen for DV. Women may welcome the opportunity to be asked about DV (Gazmararian 1996), although they need to be able to trust the care giver and be assured of confidentiality of the information exchanged (Gazmararian 2000). Healthcare professionals are in a unique position to identify and assist women during pregnancy.
Objectives
The objective of this review was to examine the effectiveness and safety of interventions in preventing or reducing domestic violence against pregnant women.
Methods
Criteria for considering studies for this review
Types of studies
Randomised controlled trials including cluster‐randomised trials and quasi‐randomised controlled trials (e.g. where there was alternate allocation) investigating the effect of interventions in preventing or reducing domestic violence during pregnancy.
Types of participants
Pregnant women of any age at any stage of pregnancy and their partners (if the intervention involved them). We planned to include studies that recruited both pregnant and non‐pregnant women, provided that data were reported separately for pregnant women, and would consider the data reported for pregnant women only in our analysis (no such studies were identified for this version of the review).
Types of interventions
Any intervention without screening or with screening (for those who screen positive) provided during pregnancy and aimed at preventing or reducing the number of episodes of domestic violence. Studies could include interventions carried out in any setting, including healthcare services and community‐based studies.
Types of outcome measures
Although we focused on interventions during pregnancy, violence during pregnancy has an impact on the longer‐term health of women and infants, and we have included some outcomes measured in the postnatal period.
Primary outcomes
-
Reduction of episodes of violence (physical, sexual, and/or psychological)
-
Prevention of violence during and up to one year after pregnancy as defined by the authors of trials
Secondary outcomes
Maternal and fetal outcomes
-
Depression including prenatal or postnatal depression
-
Miscarriage
-
Antepartum haemorrhage
-
Premature labour
-
Abruptio placenta
-
Maternal mortality
Neonatal outcomes
-
Birthweight
-
Apgar score first minute
-
Apgar score fifth minute
-
Stillbirth
-
Perinatal death
Search methods for identification of studies
The following methods section of this review is based on a standard template used by the Cochrane Pregnancy and Childbirth Group.
Electronic searches
We contacted the Trials Search Co‐ordinator to search the Cochrane Pregnancy and Childbirth Group’s Trials Register on 31 July 2014.
The Cochrane Pregnancy and Childbirth Group’s Trials Register is maintained by the Trials Search Co‐ordinator and contains trials identified from:
-
monthly searches of the Cochrane Central Register of Controlled Trials (CENTRAL);
-
weekly searches of MEDLINE;
-
weekly searches of Embase;
-
handsearches of 30 journals and the proceedings of major conferences;
-
weekly current awareness alerts for a further 44 journals plus monthly BioMed Central email alerts.
Details of the search strategies for CENTRAL, MEDLINE and Embase, the list of handsearched journals and conference proceedings, and the list of journals reviewed via the current awareness service can be found in the ‘Specialized Register’ section within the editorial information about the Cochrane Pregnancy and Childbirth Group.
Trials identified through the searching activities described above are each assigned to a review topic (or topics). The Trials Search Co‐ordinator searches the register for each review using the topic list rather than keywords.
Searching other resources
We contacted organisations that work in the area of violence for further trials. We also checked references of retrieved articles.
We did not apply any language restrictions.
Data collection and analysis
For methods used in the previous version of this review, seeJahanfar 2013.
For this update, the following methods, which are based on a standard template used by the Cochrane Pregnancy and Childbirth Group, were used for assessing the five reports that were identified as a result of the updated search.
Selection of studies
Two review authors independently assessed for inclusion all the potential studies identified as a result of the search strategy. We resolved any disagreement through discussion or, if required, we consulted the third review author.
Data extraction and management
We designed a form to extract data. For eligible studies, two review authors extracted the data using the agreed form. We resolved discrepancies through discussion or, if required, we consulted the third review author. Data were entered into Review Manager software (RevMan 2014) and checked for accuracy.
When information regarding any of the above was unclear, we planned to contact authors of the original reports to provide further details.
Assessment of risk of bias in included studies
Two review authors independently assessed risk of bias for each study using the criteria outlined in the Cochrane Handbook for Systematic Reviews of Interventions (Higgins 2011). Any disagreement was resolved by discussion or by involving a third assessor.
(1) Random sequence generation (checking for possible selection bias)
We described for each included study the method used to generate the allocation sequence in sufficient detail to allow an assessment of whether it should produce comparable groups.
We assessed the method as:
-
low risk of bias (any truly random process, e.g. random number table; computer random number generator);
-
high risk of bias (any non‐random process, e.g. odd or even date of birth; hospital or clinic record number);
-
unclear risk of bias.
(2) Allocation concealment (checking for possible selection bias)
We described for each included study the method used to conceal allocation to interventions prior to assignment and assessed whether intervention allocation could have been foreseen in advance of, or during recruitment, or changed after assignment.
We assessed the methods as:
-
low risk of bias (e.g. telephone or central randomisation; consecutively numbered sealed opaque envelopes);
-
high risk of bias (open random allocation; unsealed or non‐opaque envelopes, alternation; date of birth);
-
unclear risk of bias.
(3.1) Blinding of participants and personnel (checking for possible performance bias)
We described for each included study the methods used, if any, to blind study participants and personnel from knowledge of which intervention a participant received. We considered that studies were at low risk of bias if they were blinded, or if we judged that the lack of blinding unlikely to affect results. We assessed blinding separately for different outcomes or classes of outcomes.
We assessed the methods as:
-
low, high or unclear risk of bias for participants;
-
low, high or unclear risk of bias for personnel.
(3.2) Blinding of outcome assessment (checking for possible detection bias)
We described for each included study the methods used, if any, to blind outcome assessors from knowledge of which intervention a participant received. We assessed blinding separately for different outcomes or classes of outcomes.
We assessed methods used to blind outcome assessment as:
-
low, high or unclear risk of bias.
(4) Incomplete outcome data (checking for possible attrition bias due to the amount, nature and handling of incomplete outcome data)
We described for each included study, and for each outcome or class of outcomes, the completeness of data including attrition and exclusions from the analysis. We stated whether attrition and exclusions were reported and the numbers included in the analysis at each stage (compared with the total randomised participants), reasons for attrition or exclusion where reported, and whether missing data were balanced across groups or were related to outcomes. Where sufficient information was reported, or could be supplied by the trial authors, we planned to re‐include missing data in the analyses which we undertook.
We assessed methods as:
-
low risk of bias (e.g. no missing outcome data; missing outcome data balanced across groups);
-
high risk of bias (e.g. numbers or reasons for missing data imbalanced across groups; ‘as treated’ analysis done with substantial departure of intervention received from that assigned at randomisation);
-
unclear risk of bias.
(5) Selective reporting (checking for reporting bias)
We described for each included study how we investigated the possibility of selective outcome reporting bias and what we found.
We assessed the methods as:
-
low risk of bias (where it is clear that all of the study’s pre‐specified outcomes and all expected outcomes of interest to the review have been reported);
-
high risk of bias (where not all the study’s pre‐specified outcomes have been reported; one or more reported primary outcomes were not pre‐specified; outcomes of interest are reported incompletely and so cannot be used; study fails to include results of a key outcome that would have been expected to have been reported);
-
unclear risk of bias.
(6) Other bias (checking for bias due to problems not covered by (1) to (5) above)
We described for each included study any important concerns we had about other possible sources of bias.
(7) Overall risk of bias
We made explicit judgements about whether studies were at high risk of bias, according to the criteria given in the Handbook (Higgins 2011). With reference to (1) to (6) above, we assessed the likely magnitude and direction of the bias and whether this would impact on the findings. In future updates, we will explore the impact of the level of bias through undertaking sensitivity analyses ‐ seeSensitivity analysis.
For this update the quality of the evidence was assessed using the GRADE approach (Schunemann 2009). We assessed the quality of the body of evidence relating to the following outcomes for the comparison 'Any intervention to prevent violence (all interventions) versus standard care'.
-
Partner abuse: episodes during pregnancy
-
Partner abuse: episodes during the first three months postpartum
-
Partner abuse: score in the first three months postpartum (Conflict Tactics Scale)
-
Partner abuse in the first three months postpartum (Current abuse score)
-
Partner abuse: total episodes at final study assessment (pregnancy and to 10 weeks postpartum)
-
Number of low birthweight babies (< 2500 g)
GRADEprofiler (GRADE 2008) was used to import data from Review Manager (RevMan 2014) in order to create a ’Summary of findings’ table. A summary of the intervention effect and a measure of quality for each of the above outcomes was produced using the GRADE approach. The GRADE approach uses five considerations (study limitations, consistency of effect, imprecision, indirectness and publication bias) to assess the quality of the body of evidence for each outcome. The evidence can be downgraded from 'high quality' by one level for serious (or by two levels for very serious) limitations, depending on assessments for risk of bias, indirectness of evidence, serious inconsistency, imprecision of effect estimates or potential publication bias.
Measures of treatment effect
Dichotomous data
For dichotomous data, we presented results as summary risk ratio with 95% confidence intervals.
Continuous data
For continuous data, we used the mean difference with 95% confidence intervals.
Unit of analysis issues
Cluster‐randomised trials
For this update, there was one mixed‐methods trial identified (Sharps 2013). In this trial, one group of urban women were individually randomised to treatment and 12 rural sites were also randomised. The only outcome reported for this review was retention rates, and therefore no relevant analysis was undertaken. If in future updates we included more cluster‐randomised trials, we will adjust appropriate data using the methods described in the Handbook [Section 16.3.4 or 16.3.6] using an estimate of the intracluster correlation co‐efficient (ICC) derived from the trial (if possible), from a similar trial or from a study of a similar population. If we use ICCs from other sources, we will report this and conduct sensitivity analyses to investigate the effect of variation in the ICC. If we identify both cluster‐randomised trials and individually‐randomised trials, we plan to synthesise the relevant information. We will consider it reasonable to combine the results from both if there is little heterogeneity between the study designs and the interaction between the effect of intervention and the choice of randomisation unit is considered to be unlikely.
We will also acknowledge heterogeneity in the randomisation unit and perform a sensitivity or subgroup analysis to investigate the effects of the randomisation unit.
Cross‐over trials
This review does not include cross‐over trials. It is unlikely that cross‐over designs would be a relevant trial design for Cochrane Pregnancy and Childbirth Group reviews.
Other unit of analysis issues
We did not detect any studies with multiple pregnancies. It is unlikely that this target population will be studied as there are many complications due to other clinical issues such as birthweight discordance, twin‐to‐twin transfusion, higher risk of congential anomalies that impact on the birthweight and other pregnancy outcomes. Confounding factors are many. Thus we did not include twins in the review, given that it is unlikely multiple pregnancies would be included in randomised controlled trials of interventions to prevent or reduce domestic violence.
Dealing with missing data
For included studies, we noted levels of attrition. In future updates, if more eligible studies are included, we will explore the impact of including studies with high levels of missing data in the overall assessment of treatment effect by using sensitivity analysis.
For all outcomes, we carried out analyses, as far as possible, on an intention‐to‐treat basis, i.e. we attempted to include all participants randomised to each group in the analyses. The denominator for each outcome in each trial was the number randomised minus any participants whose outcomes were known to be missing.
Assessment of heterogeneity
We assessed statistical heterogeneity in each meta‐analysis using the Tau², I² and Chi² statistics. We regarded heterogeneity as substantial if the I² was greater than 30% and either the Tau² was greater than zero, or there was a low P value (less than 0.10) in the Chi² test for heterogeneity. Had we identified substantial heterogeneity (above 30%), we planned to explore it by pre‐specified subgroup analysis.
Assessment of reporting biases
In future updates, if there are 10 or more studies in the meta‐analysis we will investigate reporting biases (such as publication bias) using funnel plots. We will assess funnel plot asymmetry visually. If asymmetry is suggested by a visual assessment, we will perform exploratory analyses to investigate it.
Data synthesis
We carried out statistical analysis using the Review Manager software (RevMan 2014). Had we conducted pooled analyses in this review, we planned to use fixed‐effect meta‐analysis for combining data where it was reasonable to assume that studies were estimating the same underlying treatment effect: i.e. where trials were examining the same intervention, and the trials’ populations and methods were judged sufficiently similar.
If we had pooled data and noted clinical heterogeneity sufficient to expect that the underlying treatment effects differed between trials, or if we had detected substantial statistical heterogeneity, we planned to use random‐effects meta‐analysis to produce an overall summary, if an average treatment effect across trials was considered clinically meaningful. We would have treated the random‐effects summary as the average range of possible treatment effects, and discussed the clinical implications of treatment effects differing between trials. If the average treatment effect was not clinically meaningful, we would not have combined trials.
If in future updates of this review we use random‐effects analyses, we will present the results as the average treatment effect with 95% confidence intervals, and the estimates of Tau² and I².
Subgroup analysis and investigation of heterogeneity
Where data were available, we planned to undertake analysis of subgroups by severity of violence. However, no such analyses were undertaken due to lack of data. We planned to assess subgroup differences by interaction tests available within RevMan (RevMan 2014) and to report the results of subgroup analyses quoting the Chi² statistic and P value, and the interaction test I² value.
We did not conduct pooled analyses in this review. If, in future updates, such pooled analyses are possible and heterogeneity is identified, we will investigate it using subgroup analyses and sensitivity analyses. We will consider whether an overall summary is meaningful, and if so, we will used random‐effects analysis to produce it.
Sensitivity analysis
In future updates, if data allow, we plan to carry out sensitivity analyses to explore the effect of trial quality assessed by concealment of allocation, high attrition rates, or both, with poor quality studies being excluded from the analyses in order to assess whether this makes any difference to the overall result.
Results
Description of studies
Results of the search
The original search of the Pregnancy and Childbirth Group Trials Register retrieved 27 reports and, excluding duplicates, further searching identified an additional 10 reports for possible inclusion. A total of 27 trials (37 study reports) were assessed. After assessment we included nine trials and excluded 17. One study is awaiting further assessment (Loree 2008) and more information about this study is in the Characteristics of studies awaiting classification table.
For this update, we identified eight additional reports. One trial was included but with no relevant outcome data reported (Sharps 2013). One trial was an additional report for an included study (Kiely 2010), and one trial was excluded (Bhandari 2012). Five trials are ongoing studies (Feder 2013; Krishnan 2012; Sharma 2013; Taft 2009a; Temmerman 2010). The final numbers are 10 included studies, 18 excluded studies and six studies awaiting assessment or ongoing. We contacted the authors for additional information and data where possible. Only one author (Temmerman 2010) replied that no reportable data are available at this point in time because the study is ongoing.
Included studies
We included 10 randomised trials involving 3417 women. Seven of these trials (2629 women) contributed data to the review. The studies were predominantly carried out in the USA, although there was one trial in Peru (Cripe 2010) and one in Hong Kong (Tiwari 2005).
Participants
Eight of the 10 studies randomised women who were assessed during pregnancy and were identified as being at high risk of partner violence (Calderon 2008; Cripe 2010; Curry 2006; Kiely 2010; McFarlane 2000; Sharps 2013; Tiwari 2005; Zlotnick 2011). In the study by Olds 2004, the women recruited were not specifically at high risk of abuse; women were recruited if they were young (less than 19 years of age), unmarried or in receipt of Medicaid. In the Nagle 2002 trial, it was not clear that participants were at high risk of partner violence.
Interventions and comparisons
The interventions in the included trials varied considerably and ranged from single, brief sessions through to multiple intensive sessions during pregnancy and extending into the postnatal period.
-
Calderon 2008 described a single brief intervention that involved an interactive computer assessment and tailored advice encouraging women to seek help, and care providers were alerted of a high‐risk status.
-
In the trial by Cripe 2010, women received a single counselling session by social workers; Tiwari 2005 described a similar brief counselling intervention tailored specifically for Chinese women.
-
In the Curry 2006 study, women in the intervention group received video advice and then individually‐tailored case management by a nurse with referral as appropriate.
-
Two trials (Kiely 2010; Zlotnick 2011) described psychological therapy interventions involving multiple sessions during pregnancy with booster sessions in the postnatal period. In the Kiely 2010 trial, sessions were based on cognitive behavioural therapy, while Zlotnick 2011 examined an intervention underpinned by theory relating to interpersonal psychotherapy.
-
In a three‐arm trial McFarlane 2000 compared a brief intervention with a counselling intervention, or a counselling intervention plus home visits.
-
In Sharps 2013, the usual care (UC) group received the standard home visitation (HV) and the Domestic Violence Enhanced Home Visitation Program (DOVE) was the intervention. The DOVE intervention group received the standard HV and an additional three prenatal and three postnatal DOVE sessions.
-
Nagle 2002 examined home visits during pregnancy and the postnatal period as did Olds 2004, although in this latter study one group received visits from a nurse and one from para‐professionals.
The comparison groups mainly received usual care, although this may have included, or been supplemented by, written information on safety planning and, or a list of local resources where women could seek further help or advice on partner abuse.
Outcomes
A serious problem in this review was the lack of consistency in reported outcomes, and the limited range of outcomes reported, and the varied way that outcomes such as depression or experience of violence were measured. Only one of the included studies (Kiely 2010) reported episodes of partner abuse during pregnancy, while four studies (Curry 2006; Kiely 2010; Tiwari 2005; Zlotnick 2011) reported some data on partner abuse in the early postpartum period (up to three months after the birth), we were unable to combine data in a meta‐analysis as results from each study were reported in different ways. For example, while Tiwari 2005 and Zlotnick 2011 both reported scores on the Conflict Tactics Scale in the postnatal period, Zlotnick 2011 reported overall scores whereas Tiwari 2005 reported scores for separate dimensions, and we were unable to collapse these results into a single score. In a further study, results on partner abuse were not reported in a way that allowed us to include them in data and analysis tables (mean results were reported without standard deviations and there was insufficient information to allow us to impute values) (McFarlane 2000); this study also included some data on the use of community resources.
Several of the included studies did not report on episodes of abuse. Calderon 2008, for example, focused on whether or not women discussed partner violence with those providing care; it was not clear whether such discussions had any tangible effect. Nagle 2002 predominantly reported process outcomes, while Cripe 2010 focused on safety planning. Sharps 2013 reported only recruitment and retention rates. In the study by Olds 2004, a multiplicity of outcomes were reported over a series of papers. These included partner violence along with pregnancy outcomes and long‐term developmental outcomes in children, although it was not clear whether these outcomes were prespecified. Overall, there was little information on other review outcomes including depression and stress in pregnancy and the postnatal period, and outcomes for babies including birthweight and preterm birth.
Excluded studies
We excluded 18 studies. The main reason for excluding studies was that the interventions were not aimed at pregnant women. Three studies examined home visitation interventions to support women after the birth of the child; Armstrong 1999 focused on support by child health nurses, while Quinlivan 2003 examined visits by nurse‐midwives during the period following the birth; Bair‐Merritt 2010 looked at a parent support intervention over three years by para‐professionals. None of these trials specifically aimed to reduce or prevent partner violence during pregnancy. In the study by Eddy 2008 the intervention was aimed at professionals rather than pregnant women, and in the Koziol‐McLain 2010 trial, women were recruited in hospital emergency departments and were not necessarily pregnant. Miller 2011 focused on women attending family planning clinics and the aim of the intervention was to prevent reproductive coercion. The study by Taft 2009a focused on women at high risk of abuse but included women with children under five, pregnant women and other women who were perceived as being at risk. Separate results were not reported for pregnant women.
In five studies, while the focus was on partner violence, participants were not randomly allocated to groups (Janssen 2003; Lipsky 2003; Macy 2007; McFarlane 1996; Parker 1999). Bhandari 2012 conducted convenience sampling for a qualitative study.
The remaining studies were excluded because the intervention was not designed specifically to prevent or reduce abuse (Blackmore 2006; Bullock 2009; Marcenko 1994). While Kataoka 2010 did focus on partner violence, the aim of the intervention was to identify the best means of increasing disclosure of abuse by women rather than to prevent abuse. One of the reports identified by the search was a trial registration for a study that did not take place (Janssen 2011).
Risk of bias in included studies
The studies were mixed in terms of overall risk of bias; while many of the studies used methods of sequence generation and allocation concealment that were at low risk of bias, blinding and sample attrition were frequent problems. One of the studies contributing outcome data was considered to be of low risk of bias (Tiwari 2005).
Allocation
Six of the included studies used methods of sequence generation that we assessed as low risk of bias (Calderon 2008; Kiely 2010; Nagle 2002; Olds 2004; Tiwari 2005; Zlotnick 2011); methods included computer‐generated randomisation sequences, or the use of external randomisation services. In three trials, the methods for generating the randomisation sequence were not clear (Cripe 2010; Curry 2006, Sharps 2013), and in one study, the method was assessed as high risk of bias (McFarlane 2000), where group assignment was according to clinic.
Six studies were judged to use methods at low risk of bias for concealing allocation at the point of randomisation. Consecutively numbered opaque sealed envelopes were used in the trials by Tiwari 2005 and Zlotnick 2011, and external telephone randomisation services were utilised by Kiely 2010, Nagle 2002 and Olds 2004. In Calderon 2008, an automated interactive computer programme carried out randomisation. Methods were unclear for Cripe 2010, Sharps 2013, and Curry 2006, and the quasi‐randomisation approach used for sequence generation in the McFarlane 2000 trial meant that it was judged as high risk of bias for allocation concealment as it was possible that allocation could be anticipated by those carrying out randomisation.
Blinding
Blinding women, clinical staff, staff providing interventions, and those collecting outcome data is very difficult for this type of intervention. Blinding was not attempted or not mentioned in six of the included studies, although Cripe 2010, Kiely 2010, Olds 2004 and Tiwari 2005 all reported attempting to blind outcome assessment. It was not clear whether this was successful. The overall impact of lack of blinding in these studies is difficult to assess. It is possible that for outcomes such as self‐reported episodes of partner violence, the lack of blinding may have caused some response bias. For other outcomes, such as preterm birth, lack of blinding may have been less of a problem.
Incomplete outcome data
Loss of women to follow‐up did not appear to be a serious problem in the studies by Cripe 2010, Olds 2004, Tiwari 2005, and Zlotnick 2011, although there were missing data for some outcomes in the Olds 2004 trial, and Zlotnick 2011 did not provide information on reasons for loss to follow‐up. In the study by Curry 2006, more than 1000 women were randomised but results were reported only for the small sub‐sample assessed as being at high risk of DV. In the trials by McFarlane 2000 and Nagle 2002 there were high levels of sample attrition. Loss of women to follow‐up may be a serious problem even with low or modest sample attrition; it is possible that those women most at risk of poor outcomes (such as abuse) would be more likely than others to be lost to long‐term follow‐up (Higgins 2011).
In two studies, women were assessed for a broad range of risk factors including smoking and other factors associated with poor pregnancy outcomes (Calderon 2008; Kiely 2010). The women randomised to partner violence interventions may have formed only a small proportion of the total sample randomised, and women may have received interventions for more than one risk factor. The impact of this on particular outcomes was difficult to assess. Multiple interventions may have had a synergistic or interactive effect, and for some outcomes, if women had more than one intervention, it would be difficult to ascertain which intervention led to any possible differences between groups. For example, women may have smoked and have been at high risk for DV, and therefore received multiple interventions; under these circumstances it would not be easy to disentangle which intervention, if any, influenced outcomes such as infant birthweight or preterm birth.
Selective reporting
It was difficult to assess outcome reporting bias without access to trial registrations and study protocols and most studies were judged to be at unclear risk of bias because we only had access to published study reports. We have already mentioned the difficulty interpreting outcomes with stratified samples and multiple interventions in the studies by Calderon 2008 and Kiely 2010. Interpreting findings from the Olds 2004 study was also hampered by possible outcome reporting bias. Several papers have been published on this trial and different papers focus on different outcomes, it was not clear that all outcomes reported were pre‐specified, nor was it clear how different aspects of the interventions were associated with particular outcomes.
Other potential sources of bias
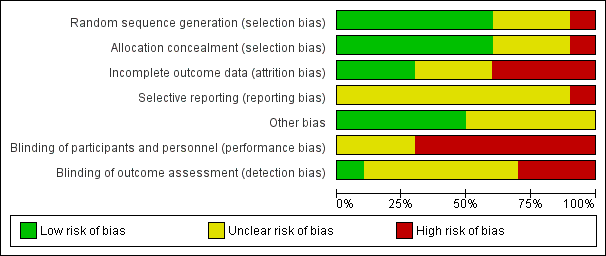
Most of the studies appeared to have comparable groups at baseline in terms of participant characteristics. Some of the studies provided little information on methods so assessment of overall risk of bias was difficult. We have set out findings for overall risk of bias in Figure 1 and for individual studies in Figure 2.

'Risk of bias' graph: review authors' judgements about each risk of bias item presented as percentages across all included studies.

'Risk of bias' summary: review authors' judgements about each risk of bias item for each included study.
Effects of interventions
Comparison: Any intervention to prevent violence (all interventions) versus standard care
Due to lack of consistency in the outcomes reported in included studies, we were unable to combine results from trials in meta‐analysis, and results are derived from single studies.
Primary outcomes
Kiely 2010 suggests that women randomised to the group receiving a psychological therapy intervention were less likely to have recurrent episodes of abuse during pregnancy compared with those receiving usual care, although the difference between groups did not reach statistical significance (risk ratio (RR) 0.50, 95% confidence interval (CI) 0.25 to 1.02, 220 women, very low quality) (Analysis 1.1). The protective effect of psychological therapy continued during the first three months of follow‐up postpartum although again, results were not statistically significant (RR 0.60, 95% CI 0.35 to 1.04, 271 women, very low quality) (Analysis 1.2). In this study there was a significant difference between groups in the total number of women reporting DV at any point during pregnancy and/or in the postnatal period, with women in the intervention group being less likely to report abuse (RR 0.62, 95% CI 0.43 to 0.88, 306 women, moderate quality) (Analysis 1.6).
In other studies examining DV in the postnatal period, findings were inconsistent, and most of the results were not statistically significant. The Zlotnick 2011 study examined a psychotherapy intervention and DV in the first three months after the birth was measured using the Conflict Tactics Scale; the difference between the intervention and control group was not statistically significant (mean difference (MD) 4.20, 95% CI ‐10.74 to 19.14, 46 women, very low quality) (Analysis 1.3). Differences between group scores for DV in the first three months postpartum in the study by Curry 2006 had a MD of ‐0.12 (95% CI ‐0.31 to 0.07, 191 women, very low quality); the evidence of a difference between groups receiving nurse case management or usual care was not statistically significant (Analysis 1.5).
Tiwari 2005 also used the Conflict Tactics Scale to assess DV in the first three months postpartum following a brief antenatal counselling intervention that focused on improving relationships with partners and strengthening social networks. For this study, mean scores on subscales measuring psychological, physical (minor and severe) and sexual abuse were reported separately. The intervention appeared to be effective in reducing minor physical violence (MD ‐0.46, 95% CI ‐0.82 to ‐0.10) and psychological abuse (MD ‐0.81, 95% CI ‐1.45,to ‐0.17). Severe physical violence and sexual abuse scores were not significantly different between the intervention and control groups (MD 0.08, 95% CI ‐0.28 to 0.44, and MD ‐0.09, 95% CI ‐0.24 to 0.06, respectively) (Analysis 1.4).
Nagle 2002 examined the effects of a nurse home‐visiting intervention and found no significant difference between groups for the number of women reporting DV at seven to eight months postpartum (Analysis 1.7).
In a study examining a counselling intervention with or without support from a mentor compared with a brief intervention, authors reported that the severity of abuse decreased over the study period in all groups. However, there were no clear differences between different intervention groups for mean physical violence scores at up to 18 months postpartum (McFarlane 2000). (We have not included data from this study in the data and analysis tables as standard deviations were not reported, and we did not have sufficient information to impute values.)
Secondary outcomes
There was no strong evidence that risk of a major depression episode during pregnancy was lower in the intervention group than in the control group in the study by Zlotnick 2011 (RR 0.42, 95% CI 0.04 to 4.31) (Analysis 1.8) and there was no statistically significant difference in the mean number of depression episodes (Psychiatric Status Rating) (MD ‐0.46, 95% CI ‐0.97 to 0.05) (Zlotnick 2011) (Analysis 1.9).
The number of women with depression at up to three months postpartum was reported in two studies examining empowerment training and interpersonal psychotherapy respectively (Tiwari 2005; Zlotnick 2011). In view of differences between the interventions and statistical heterogeneity in findings (I2 = 66%), we decided not to pool results from these studies and have reported sub‐totals only. Tiwari 2005 reported a positive treatment effect following a brief prenatal intervention (RR 0.39, 95% CI 0.20 to 0.75), whereas, an interpersonal psychotherapy intervention involving multiple sessions (Zlotnick 2011) did not appear reduce the number of women with depression (RR 1.40, 95% CI 0.38 to 5.18) (Analysis 1.11). Zlotnick 2011 also reported mean scores on the Edinburgh Postnatal Depression Scale at three months postpartum and identified no clear difference between groups (MD ‐1.88, 95% CI ‐5.24 to 1.48) (Analysis 1.12).
Nagle 2002 reported the number of women with depression (scoring greater than 16 on the Beck Depression Inventory) and mean depression scores at seven to eight months postpartum; there was no strong evidence of differences between groups for either outcome (RR 0.85, 95% CI 0.37 to 1.98, and MD ‐0.65, 95% CI ‐2.41 to 1.11, respectively) (Analysis 1.13; Analysis 1.14).
The study by Kiely 2010 and colleagues examining the effectiveness of a psycho‐behavioural intervention was the only one that reported neonatal outcomes. Mean birthweight was similar for babies whose mothers were in the intervention group who received individually‐tailored therapy sessions compared with women receiving usual care (3139 g ± 593 versus 3098 g ± 717) (MD 41.00, 95% CI ‐106.19 to 188.19) (Analysis 1.23). The number of low birthweight babies (less than 2500 g) was also similar in the two groups (RR 0.74; 95% CI 0.41 to 1.32, 306 infants, low quality) (Analysis 1.24). The intervention was not associated with any significant reduction in the overall number of preterm births in this study (RR 0.69, 95% CI 0.40 to 1.20) (Analysis 1.25), although there was a significant increase in mean gestational age at delivery for women in the intervention group (MD 1.40 weeks, 95% CI 0.33 to 2.47) (non‐prespecified outcome, Analysis 1.26).
Other secondary outcomes
None of the studies reported results for several of our secondary outcomes: Apgar score less than seven at one minute, and five minutes; stillbirth, neonatal death, miscarriage, maternal mortality, antepartum haemorrhage, and placental abruption.
Non‐prespecified outcomes
Several studies reported data on outcomes that we had not prespecified. Cripe 2010 examined an empowerment intervention in pregnancy compared with usual care. Results showed that women in the intervention group were more likely to make plans to avoid abuse by adopting safety behaviours (RR 2.60, 95% CI 1.41 to 4.79) (Analysis 1.27).
Curry 2006 investigated active case management by nurses aiming to reduce stress among pregnant women, and reported some reduction in stress scores for women receiving the intervention (MD ‐2.06, 95% CI ‐3.34 to 0.78) (Analysis 1.28).
Calderon 2008 examined an intervention that aimed to increase identification of women suffering violence in pregnancy and reported that the intervention led to more women discussing abuse with their healthcare providers (Analysis 1.29).
Women were followed up over several years following home visits by public health nurses during pregnancy and the postnatal period in the study by Olds 2004. It was not clear in this study whether or not prevention or reduction of DV was a pre‐specified outcome, nor whether the intervention was tailored for women at risk of abuse. The number of women reporting violence two to four years after the birth was not significantly different in the intervention and control groups (Analysis 1.30).
Sharps 2013 compared the usual care (UC) group, who received the standard home visitation (HV), with the Domestic Violence Enhanced Home Visitation Program (DOVE), which was the intervention. The DOVE intervention group received the standard HV in addition to the DOVE IPV intervention. Women in the DOVE intervention group received three prenatal and three postnatal DOVE sessions in addition to their HV protocols. The recruitment and retention rates were reported. Women who received the DOVE intervention had a higher retention rate.
Discussion
Summary of main results
Our review set out to examine the effectiveness of interventions in preventing or reducing domestic violence (DV) against pregnant women. In this review, there were 10 identified studies of prevention of DV in pregnancy (Calderon 2008; Cripe 2010; Curry 2006; Kiely 2010; McFarlane 2000; Nagle 2002; Olds 2004; Sharps 2013; Tiwari 2005; Zlotnick 2011), eight of which studied pregnant women who were at high risk of partner violence (all except Nagle 2002 and Olds 2004). Six of these studies reported on at least one of our pre‐specified outcomes (Cripe 2010; Curry 2006; Kiely 2010; Nagle 2002; Tiwari 2005; Zlotnick 2011). The interventions examined in the studies varied significantly and included a single brief individualised consultation, case management and referral to social care workers, and multiple therapy sessions during pregnancy and postpartum.
Results for many outcomes were not consistent and most differences between groups were not statistically significant. We were not able to combine results from different studies, in the hope of identifying patterns among study results, source of disagreement (if any) among results, or other interesting relationships that may appear in the context of a meta‐analysis. Due to the lack of data and the disparate way outcomes were reported, we were unable to single out one intervention that works better than the others.
In one study, compared with women receiving usual care, women receiving a psychological therapy intervention were less likely to report DV at any point during pregnancy and/or in the postnatal period (Kiely 2010). An intervention which aimed to improve women's relationships with their partners and strengthen social networks slightly reduced psychological abuse and minor physical violence scores, but had no significant effect on severe physical violence scores (Tiwari 2005). There was no strong evidence that an educational video focusing on abusive relationships along with tailored case management was effective in reducing intimate partner abuse in the first three months postpartum.
Several trials examined the effects of interventions on postpartum depression but results were inconsistent.
There was very little information on outcomes relating to pregnancy complications and neonatal outcomes. The non‐significant effect of psycho‐behavioural intervention on birthweight or preterm birth could be due to the reported effect measures being unadjusted for the confounding effect of gestational age (Kiely 2010).
We did not find any evidence that interventions had a negative, harmful effect.
Overall completeness and applicability of evidence
There was a limited range and lack of consistency in the outcomes reported in the studies included in the review, and in cases where studies measured and reported similar outcomes (such as frequency of violence or depression), they were measured with various tools and at different time points. This meant we were unable to carry out meta‐analysis and this limited our ability to draw conclusions about the overall effect of interventions.
We also noted the paucity of data on various important outcomes that should be the centre of attention for healthcare providers during pregnancy. Only one study investigated outcomes related to newborn babies (Kiely 2010) and none investigated maternal pregnancy outcomes such as miscarriage, maternal mortality, antepartum haemorrhage, and placental abruption.
Quality of the evidence
The risk of bias of the included trials was mixed.
Only six of the included studies used adequate randomisation techniques or allocation concealment. The nature of interventions was such that they did not allow for blinding of women and the staff providing care, thus compromising the validity of study results (i.e. lack of blinding may have led to response bias for outcomes such depression or frequency of DV episodes). Loss of follow‐up was not a major problem in trials for pregnant women as the clinicians had enough time to assess the risk of DV, implement interventions and collect outcome data during routine prenatal and postpartum visits, although sample attrition was a source of concern in some of the included studies (Curry 2006; Kiely 2010; McFarlane 2000; Nagle 2002).
Outcome data for partner abuse episodes during pregnancy and during the first three months postpartum were graded of very low quality, as were the data for the current abuse score and the Conflict Tactics Score. The assessments of very low quality were due to imprecise effect estimates, high risk of bias in the study contributing data, and small sample size. Outcome data for the Conflict Tactics score, broken down into four components, was considered to be of moderate quality, due primarily to the low risk of bias for the study contributing data. Evidence for the outcome of the number of low birthweight babies was graded as of low quality.
Potential biases in the review process
We are aware that there was a risk of introducing bias at all stages of the review process and we took various steps to minimise this. Two review authors assessed eligibility, risk of bias and carried out data extraction and a third author checked assessments. Data were entered by one review author and were checked by a second review author. However, assessing risk of bias, for example, requires individual judgement about the impact of bias on outcomes, so it is possible that a different review team may not have agreed with all of our assessments.
Agreements and disagreements with other studies or reviews
Our conclusions are compatible with the only review (O'Reilly 2010) that appraised both the effect of screening and preventive interventions for DV. The latter part of the review looked at four studies (El‐Mohandes 2008; McFarlane 2000; Parker 1999; Tiwari 2005) focusing on the effectiveness of interventions on prevention of DV. We did not include one of these trials in this review for methodological reasons (Parker 1999).
'Risk of bias' graph: review authors' judgements about each risk of bias item presented as percentages across all included studies.

'Risk of bias' summary: review authors' judgements about each risk of bias item for each included study.
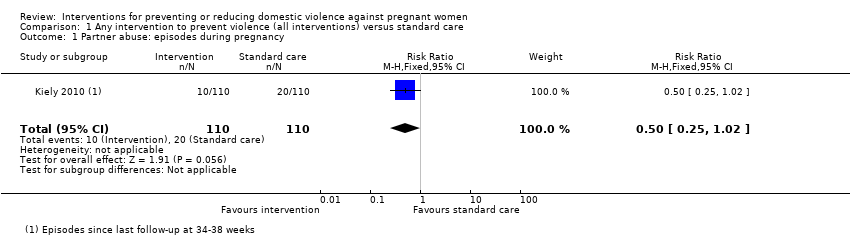
Comparison 1 Any intervention to prevent violence (all interventions) versus standard care, Outcome 1 Partner abuse: episodes during pregnancy.
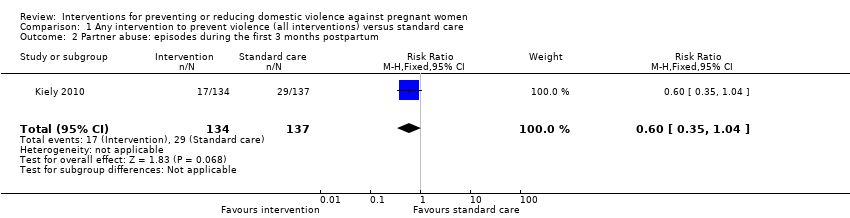
Comparison 1 Any intervention to prevent violence (all interventions) versus standard care, Outcome 2 Partner abuse: episodes during the first 3 months postpartum.
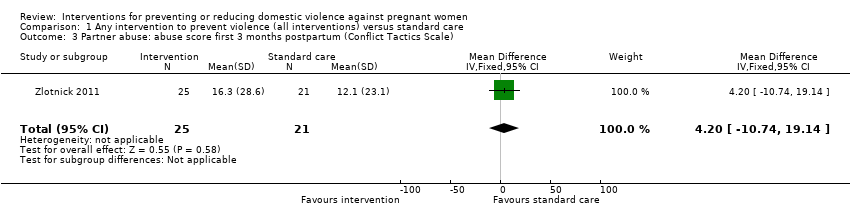
Comparison 1 Any intervention to prevent violence (all interventions) versus standard care, Outcome 3 Partner abuse: abuse score first 3 months postpartum (Conflict Tactics Scale).

Comparison 1 Any intervention to prevent violence (all interventions) versus standard care, Outcome 4 Partner abuse: abuse score in first 3 months postpartum (Conflict Tactics Scale).
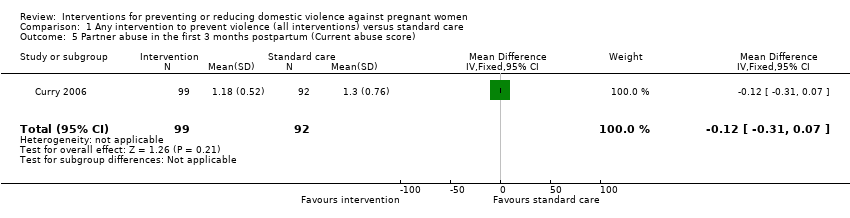
Comparison 1 Any intervention to prevent violence (all interventions) versus standard care, Outcome 5 Partner abuse in the first 3 months postpartum (Current abuse score).
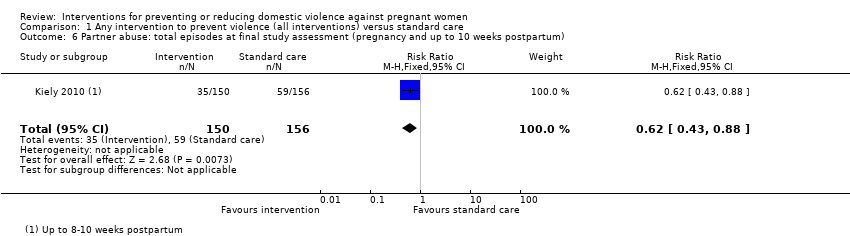
Comparison 1 Any intervention to prevent violence (all interventions) versus standard care, Outcome 6 Partner abuse: total episodes at final study assessment (pregnancy and up to 10 weeks postpartum).
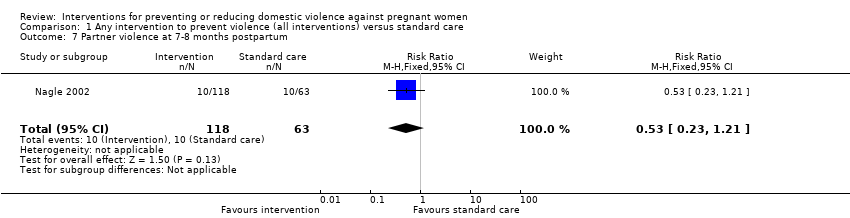
Comparison 1 Any intervention to prevent violence (all interventions) versus standard care, Outcome 7 Partner violence at 7‐8 months postpartum.
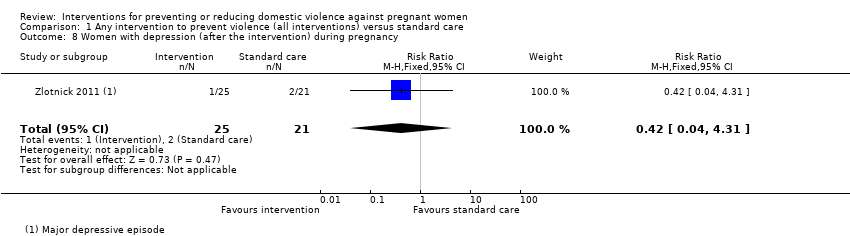
Comparison 1 Any intervention to prevent violence (all interventions) versus standard care, Outcome 8 Women with depression (after the intervention) during pregnancy.
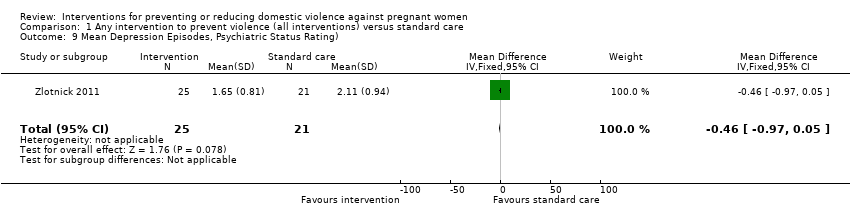
Comparison 1 Any intervention to prevent violence (all interventions) versus standard care, Outcome 9 Mean Depression Episodes, Psychiatric Status Rating).
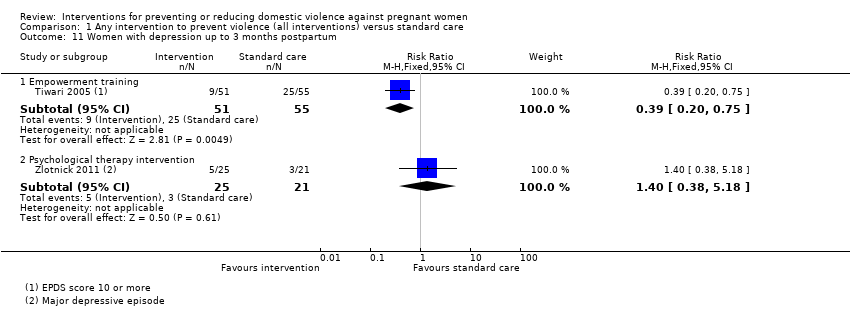
Comparison 1 Any intervention to prevent violence (all interventions) versus standard care, Outcome 11 Women with depression up to 3 months postpartum.
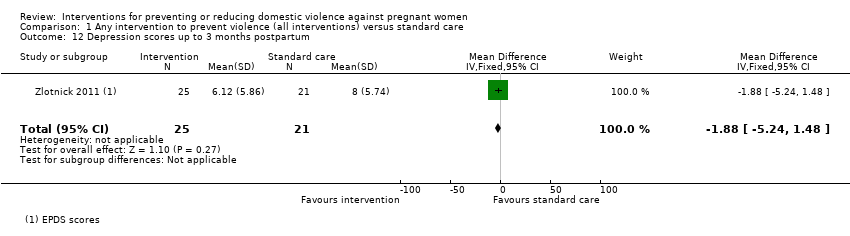
Comparison 1 Any intervention to prevent violence (all interventions) versus standard care, Outcome 12 Depression scores up to 3 months postpartum.

Comparison 1 Any intervention to prevent violence (all interventions) versus standard care, Outcome 13 Women with depression up to 1 year postpartum.

Comparison 1 Any intervention to prevent violence (all interventions) versus standard care, Outcome 14 Depression scores up to 1 year postpartum.
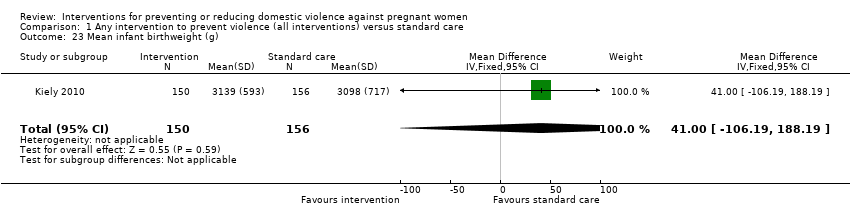
Comparison 1 Any intervention to prevent violence (all interventions) versus standard care, Outcome 23 Mean infant birthweight (g).

Comparison 1 Any intervention to prevent violence (all interventions) versus standard care, Outcome 24 Number of low‐birthweight (< 2500 g) babies.

Comparison 1 Any intervention to prevent violence (all interventions) versus standard care, Outcome 25 Preterm labour (before 37 weeks' gestation).

Comparison 1 Any intervention to prevent violence (all interventions) versus standard care, Outcome 26 (Non‐prespecified outcome) Mean gestational age at birth (weeks).
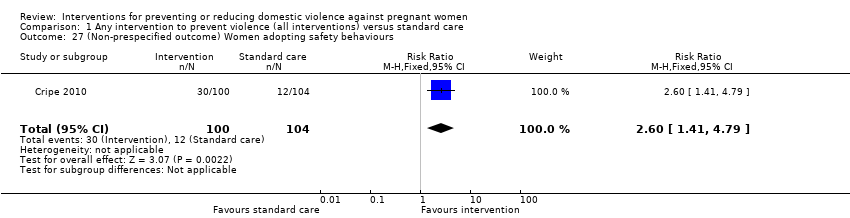
Comparison 1 Any intervention to prevent violence (all interventions) versus standard care, Outcome 27 (Non‐prespecified outcome) Women adopting safety behaviours.
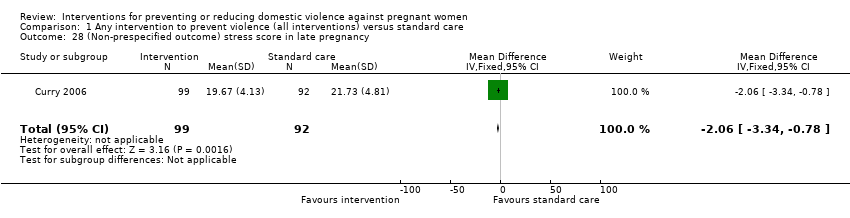
Comparison 1 Any intervention to prevent violence (all interventions) versus standard care, Outcome 28 (Non‐prespecified outcome) stress score in late pregnancy.
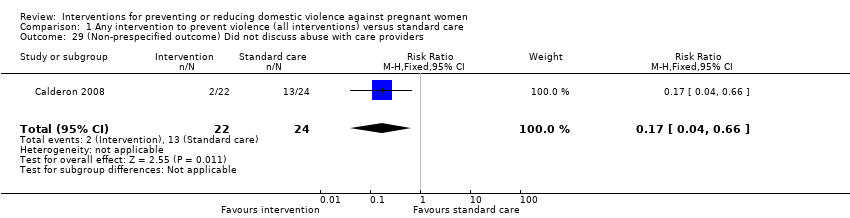
Comparison 1 Any intervention to prevent violence (all interventions) versus standard care, Outcome 29 (Non‐prespecified outcome) Did not discuss abuse with care providers.

Comparison 1 Any intervention to prevent violence (all interventions) versus standard care, Outcome 30 (Non‐prespecified outcome) Women reporting any domestic violence 2‐4 years postpartum.
| Any intervention to prevent violence (all interventions) versus standard care for preventing or reducing domestic violence against pregnant women | ||||||
| Patient or population: all pregnant women | ||||||
| Outcomes | Illustrative comparative risks* (95% CI) | Relative effect | No of Participants | Quality of the evidence | Comments | |
| Assumed risk | Corresponding risk | |||||
| Control | Any intervention to prevent violence (all interventions) versus standard care | |||||
| Partner abuse: episodes during pregnancy | Study population | RR 0.5 | 220 | ⊕⊝⊝⊝ | ||
| 182 per 1000 | 91 per 1000 | |||||
| Partner abuse: episodes during the first 3 months postpartum | Study population | RR 0.6 | 271 | ⊕⊝⊝⊝ | ||
| 212 per 1000 | 127 per 1000 | |||||
| Partner abuse: abuse score in the first 3 months postpartum (Conflict Tactics Score*) The CTS is a 19‐item self‐report scale listing behaviours that the respondent’s partner might use in conflicts. Women report the frequency of partner behaviours over the past year on a 7‐point scale where 0 = never and 6 = 20 or more times. | The mean partner abuse: abuse score in the first 3 months postpartum in the intervention groups was | 46 | ⊕⊝⊝⊝ | |||
| Partner abuse in the first 3 months postpartum (Current Abuse Score**) The Current abuse score consists of 2 scales: 1) Abuse Assessment Screen (AAS) and 2) Prenatal Psychosocial Profile (PPP). | The mean partner abuse in the first 3 months postpartum (current abuse score) in the intervention groups was | 191 | ⊕⊝⊝⊝ | |||
| Partner abuse: total episodes at final study assessment (pregnancy and up to 10 weeks postpartum) | Study population | RR 0.62 | 306 | ⊕⊕⊕⊝ | ||
| 378 per 1000 | 234 per 1000 | |||||
| Number of low‐birthweight (< 2500 g) babies | Study population | RR 0.74 | 306 | ⊕⊕⊝⊝ | ||
| 154 per 1000 | 114 per 1000 | |||||
| *The Abuse Assessment Screen (AAS) tool was used to for screening. Respondents who answered ‘yes’ to being physically or emotionally hurt by someone or forced to have sexual activities within the last year were considered abused. These women, who responded "Yes" to AAS tool, were administered the Conflict Tactics Score (CTS). RR: risk ratio; CI: confidence interval | ||||||
| GRADE Working Group grades of evidence | ||||||
| 1 All studies contributing data had design limitations. | ||||||
| Outcome or subgroup title | No. of studies | No. of participants | Statistical method | Effect size |
| 1 Partner abuse: episodes during pregnancy Show forest plot | 1 | 220 | Risk Ratio (M‐H, Fixed, 95% CI) | 0.5 [0.25, 1.02] |
| 2 Partner abuse: episodes during the first 3 months postpartum Show forest plot | 1 | 271 | Risk Ratio (M‐H, Fixed, 95% CI) | 0.60 [0.35, 1.04] |
| 3 Partner abuse: abuse score first 3 months postpartum (Conflict Tactics Scale) Show forest plot | 1 | 46 | Mean Difference (IV, Fixed, 95% CI) | 4.20 [‐10.74, 19.14] |
| 4 Partner abuse: abuse score in first 3 months postpartum (Conflict Tactics Scale) Show forest plot | 1 | Mean Difference (IV, Fixed, 95% CI) | Subtotals only | |
| 4.1 Psychological abuse | 1 | 106 | Mean Difference (IV, Fixed, 95% CI) | ‐0.81 [‐1.45, ‐0.17] |
| 4.2 Minor physical violence score | 1 | 106 | Mean Difference (IV, Fixed, 95% CI) | ‐0.46 [‐0.82, ‐0.10] |
| 4.3 Severe physical violence score | 1 | 106 | Mean Difference (IV, Fixed, 95% CI) | 0.08 [‐0.28, 0.44] |
| 4.4 Sexual abuse score | 1 | 106 | Mean Difference (IV, Fixed, 95% CI) | ‐0.09 [‐0.24, 0.06] |
| 5 Partner abuse in the first 3 months postpartum (Current abuse score) Show forest plot | 1 | 191 | Mean Difference (IV, Fixed, 95% CI) | ‐0.12 [‐0.31, 0.07] |
| 6 Partner abuse: total episodes at final study assessment (pregnancy and up to 10 weeks postpartum) Show forest plot | 1 | 306 | Risk Ratio (M‐H, Fixed, 95% CI) | 0.62 [0.43, 0.88] |
| 7 Partner violence at 7‐8 months postpartum Show forest plot | 1 | 181 | Risk Ratio (M‐H, Fixed, 95% CI) | 0.53 [0.23, 1.21] |
| 8 Women with depression (after the intervention) during pregnancy Show forest plot | 1 | 46 | Risk Ratio (M‐H, Fixed, 95% CI) | 0.42 [0.04, 4.31] |
| 9 Mean Depression Episodes, Psychiatric Status Rating) Show forest plot | 1 | 46 | Mean Difference (IV, Fixed, 95% CI) | ‐0.46 [‐0.97, 0.05] |
| 10 Depression scores (after the intervention) during pregnancy | 0 | 0 | Mean Difference (IV, Fixed, 95% CI) | 0.0 [0.0, 0.0] |
| 11 Women with depression up to 3 months postpartum Show forest plot | 2 | Risk Ratio (M‐H, Fixed, 95% CI) | Subtotals only | |
| 11.1 Empowerment training | 1 | 106 | Risk Ratio (M‐H, Fixed, 95% CI) | 0.39 [0.20, 0.75] |
| 11.2 Psychological therapy intervention | 1 | 46 | Risk Ratio (M‐H, Fixed, 95% CI) | 1.40 [0.38, 5.18] |
| 12 Depression scores up to 3 months postpartum Show forest plot | 1 | 46 | Mean Difference (IV, Fixed, 95% CI) | ‐1.88 [‐5.24, 1.48] |
| 13 Women with depression up to 1 year postpartum Show forest plot | 1 | 182 | Risk Ratio (M‐H, Fixed, 95% CI) | 0.85 [0.37, 1.98] |
| 14 Depression scores up to 1 year postpartum Show forest plot | 1 | 182 | Mean Difference (IV, Fixed, 95% CI) | ‐0.65 [‐2.41, 1.11] |
| 15 Apgar score less than 7 at 1 minute | 0 | 0 | Risk Ratio (M‐H, Fixed, 95% CI) | 0.0 [0.0, 0.0] |
| 16 Apgar score less than 7 at 5 minutes | 0 | 0 | Risk Ratio (M‐H, Fixed, 95% CI) | 0.0 [0.0, 0.0] |
| 17 Stillbirth | 0 | 0 | Risk Ratio (M‐H, Fixed, 95% CI) | 0.0 [0.0, 0.0] |
| 18 Neonatal death | 0 | 0 | Risk Ratio (M‐H, Fixed, 95% CI) | 0.0 [0.0, 0.0] |
| 19 Miscarriage (up to 20 weeks) | 0 | 0 | Risk Ratio (M‐H, Fixed, 95% CI) | 0.0 [0.0, 0.0] |
| 20 Maternal mortality | 0 | 0 | Risk Ratio (M‐H, Fixed, 95% CI) | 0.0 [0.0, 0.0] |
| 21 Antepartum haemorrhage | 0 | 0 | Risk Ratio (M‐H, Fixed, 95% CI) | 0.0 [0.0, 0.0] |
| 22 Placental abruption | 0 | 0 | Risk Ratio (M‐H, Fixed, 95% CI) | 0.0 [0.0, 0.0] |
| 23 Mean infant birthweight (g) Show forest plot | 1 | 306 | Mean Difference (IV, Fixed, 95% CI) | 41.0 [‐106.19, 188.19] |
| 24 Number of low‐birthweight (< 2500 g) babies Show forest plot | 1 | 306 | Risk Ratio (M‐H, Fixed, 95% CI) | 0.74 [0.41, 1.32] |
| 25 Preterm labour (before 37 weeks' gestation) Show forest plot | 1 | 306 | Risk Ratio (M‐H, Fixed, 95% CI) | 0.69 [0.40, 1.20] |
| 26 (Non‐prespecified outcome) Mean gestational age at birth (weeks) Show forest plot | 1 | 306 | Mean Difference (IV, Fixed, 95% CI) | 1.40 [0.33, 2.47] |
| 27 (Non‐prespecified outcome) Women adopting safety behaviours Show forest plot | 1 | 204 | Risk Ratio (M‐H, Fixed, 95% CI) | 2.6 [1.41, 4.79] |
| 28 (Non‐prespecified outcome) stress score in late pregnancy Show forest plot | 1 | 191 | Mean Difference (IV, Fixed, 95% CI) | ‐2.06 [‐3.34, ‐0.78] |
| 29 (Non‐prespecified outcome) Did not discuss abuse with care providers Show forest plot | 1 | 46 | Risk Ratio (M‐H, Fixed, 95% CI) | 0.17 [0.04, 0.66] |
| 30 (Non‐prespecified outcome) Women reporting any domestic violence 2‐4 years postpartum Show forest plot | 1 | 735 | Risk Ratio (M‐H, Fixed, 95% CI) | 0.81 [0.60, 1.08] |