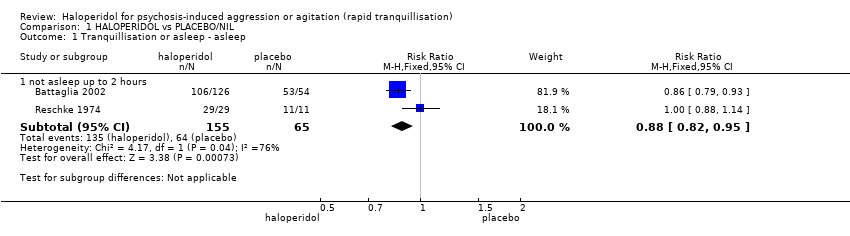
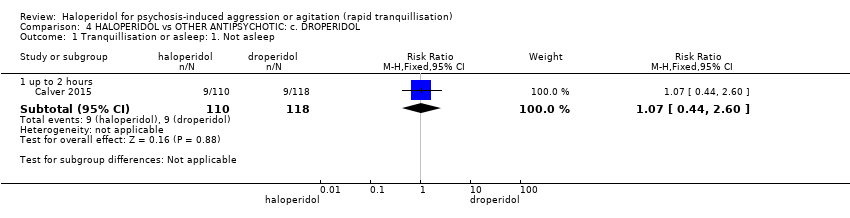
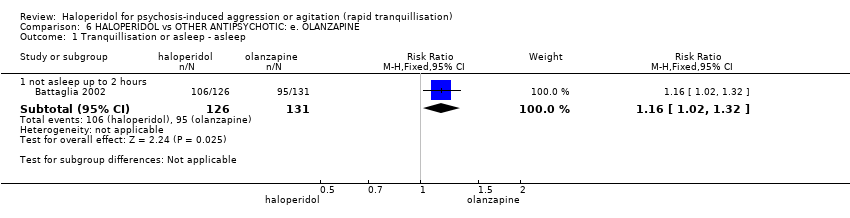
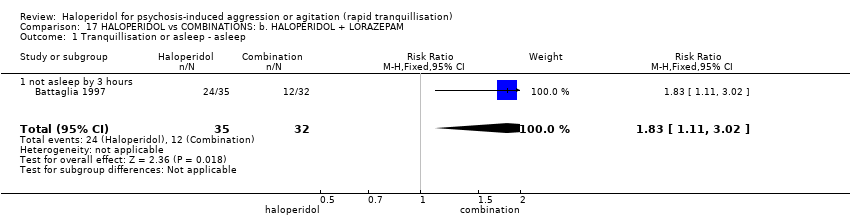
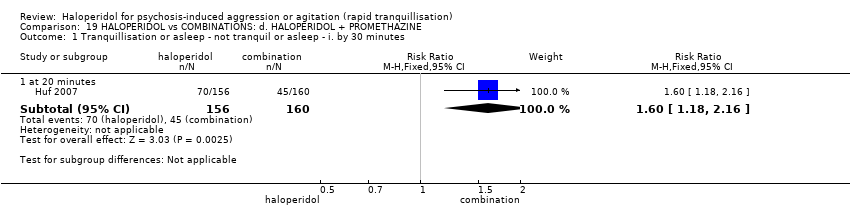
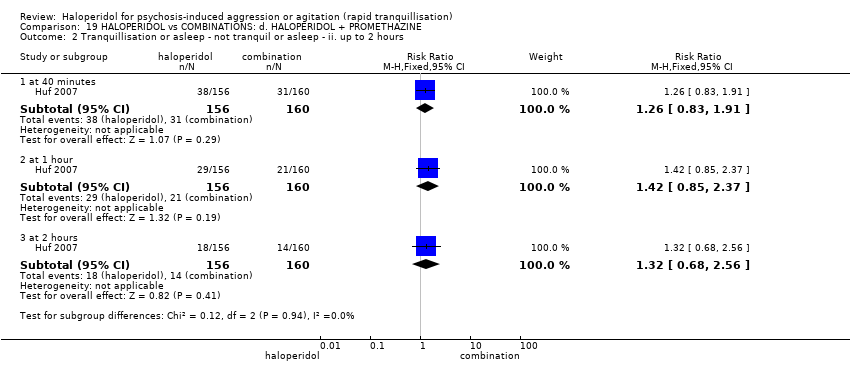
| 1 Tranquillisation or asleep ‐ asleep Show forest plot | 1 | | Risk Ratio (M‐H, Fixed, 95% CI) | Subtotals only |
|
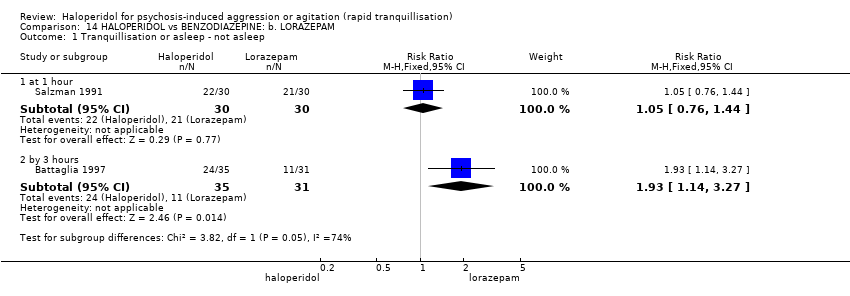
| 1.1 not asleep up to 2 hours | 1 | 257 | Risk Ratio (M‐H, Fixed, 95% CI) | 1.16 [1.02, 1.32] |
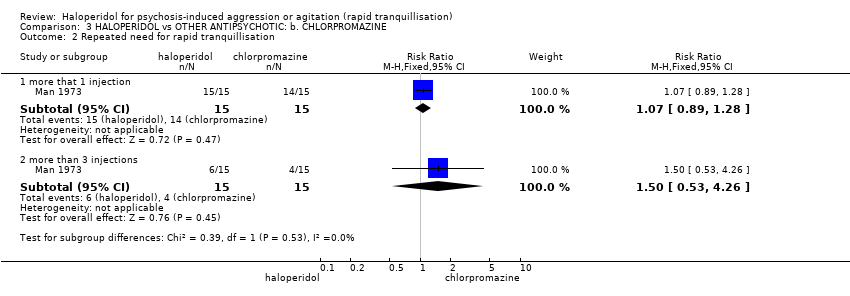
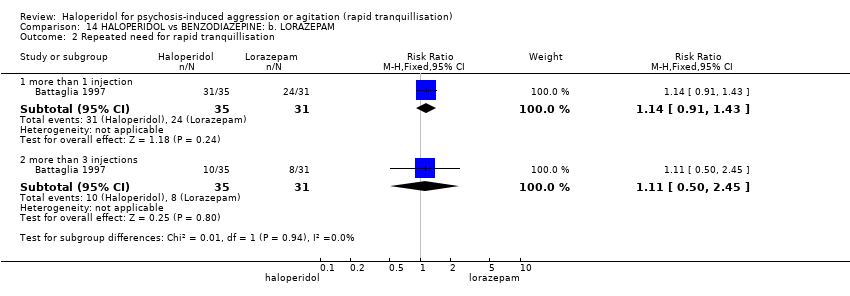
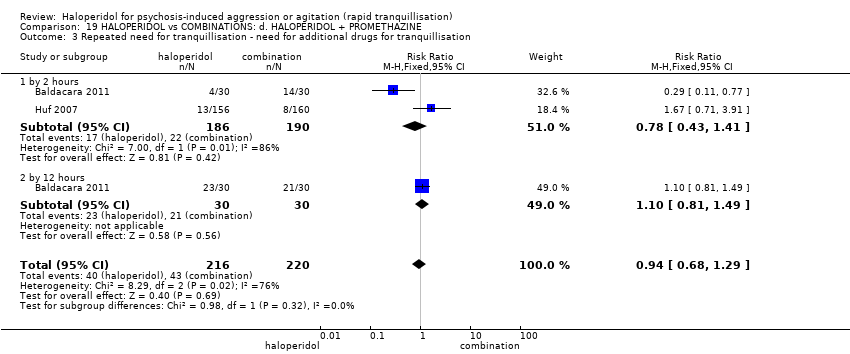
| 2 Repeated need for tranquillisation ‐ needing additional injection Show forest plot | 4 | | Risk Ratio (M‐H, Fixed, 95% CI) | Subtotals only |
|
| 2.1 by 2 hours | 1 | 60 | Risk Ratio (M‐H, Fixed, 95% CI) | 4.0 [0.47, 33.73] |
| 2.2 by 12 hours | 1 | 60 | Risk Ratio (M‐H, Fixed, 95% CI) | 3.29 [1.67, 6.47] |
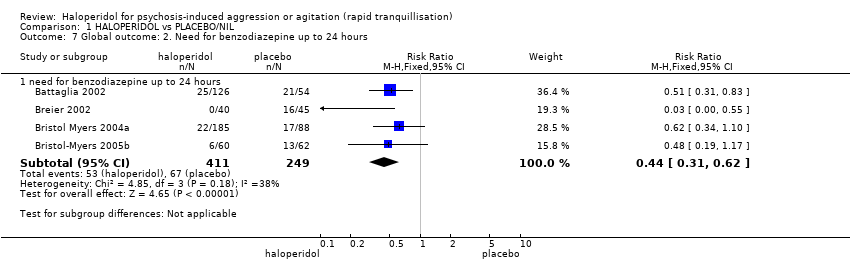
| 2.3 by 24 hours | 3 | 392 | Risk Ratio (M‐H, Fixed, 95% CI) | 1.06 [0.75, 1.51] |
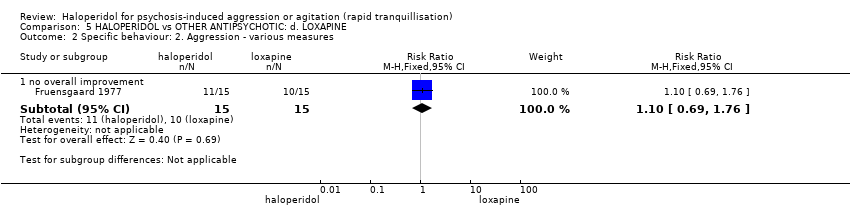
| 3 Specific behaviour: 1a. Agitation ‐ various measures Show forest plot | 2 | | Risk Ratio (M‐H, Fixed, 95% CI) | Subtotals only |
|
| 3.1 response ‐ up to 2 hours (≥40% reduction in PANSS‐EC) | 1 | 45 | Risk Ratio (M‐H, Fixed, 95% CI) | 0.96 [0.58, 1.58] |
| 3.2 agitation ‐ reported as 'adverse effect' | 1 | 49 | Risk Ratio (M‐H, Fixed, 95% CI) | 1.04 [0.07, 15.73] |
| 3.3 agitation during 21 days (if occurred in ≧10% at P < 0.05) ‐ reported as 'adverse effect' | 1 | 100 | Risk Ratio (M‐H, Fixed, 95% CI) | 1.08 [0.33, 3.51] |
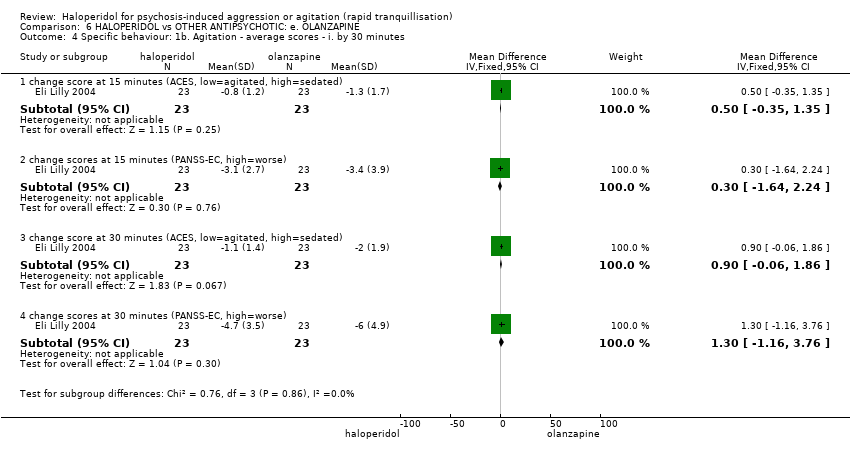
| 4 Specific behaviour: 1b. Agitation ‐ average scores ‐ i. by 30 minutes Show forest plot | 1 | | Mean Difference (IV, Fixed, 95% CI) | Subtotals only |
|
| 4.1 change score at 15 minutes (ACES, low=agitated, high=sedated) | 1 | 46 | Mean Difference (IV, Fixed, 95% CI) | 0.5 [‐0.35, 1.35] |
| 4.2 change scores at 15 minutes (PANSS‐EC, high=worse) | 1 | 46 | Mean Difference (IV, Fixed, 95% CI) | 0.30 [‐1.64, 2.24] |
| 4.3 change score at 30 minutes (ACES, low=agitated, high=sedated) | 1 | 46 | Mean Difference (IV, Fixed, 95% CI) | 0.90 [‐0.06, 1.86] |
| 4.4 change scores at 30 minutes (PANSS‐EC, high=worse) | 1 | 46 | Mean Difference (IV, Fixed, 95% CI) | 1.30 [‐1.16, 3.76] |
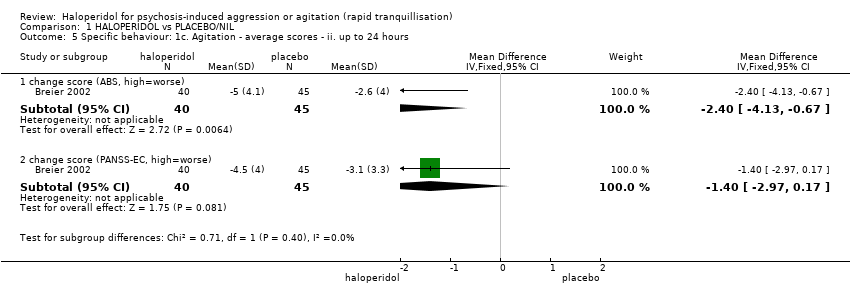
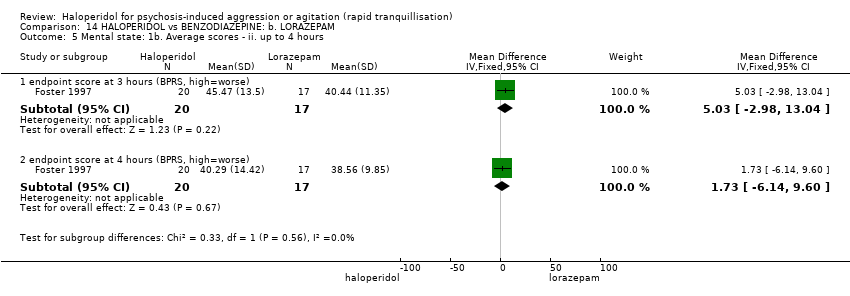
| 5 Specific behaviour: 1c. Agitation ‐ average scores ‐ ii. up to 2 hours Show forest plot | 5 | | Mean Difference (IV, Fixed, 95% CI) | Subtotals only |
|
| 5.1 change score (ABS, high=worse) | 1 | 85 | Mean Difference (IV, Fixed, 95% CI) | 2.7 [0.38, 5.02] |
| 5.2 change score at 1 hour (ACES, low=agitated, high=sedated) | 1 | 46 | Mean Difference (IV, Fixed, 95% CI) | 1.2 [0.06, 2.34] |
| 5.3 endpoint score at 1 hour (OASS, high=worse) | 1 | 60 | Mean Difference (IV, Fixed, 95% CI) | 2.00 [1.18, 2.82] |
| 5.4 change score at 1 hour (PANSS‐EC, high=worse) | 1 | 46 | Mean Difference (IV, Fixed, 95% CI) | 2.2 [‐0.50, 4.90] |
| 5.5 change score at 2 hours (ACES, low=agitated, high=sedated) | 1 | 46 | Mean Difference (IV, Fixed, 95% CI) | 0.30 [‐0.74, 1.34] |
| 5.6 endpoint score at 2 hours (OASS, high=worse) | 1 | 60 | Mean Difference (IV, Fixed, 95% CI) | 4.20 [3.54, 4.86] |
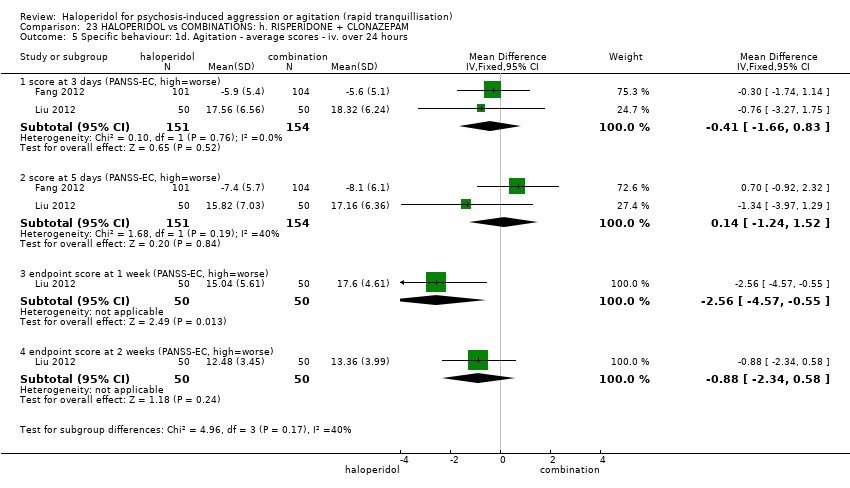
| 5.7 score at 2 hours (PANSS‐EC, high=worse) | 3 | 332 | Mean Difference (IV, Fixed, 95% CI) | ‐0.31 [‐1.49, 0.86] |
| 5.8 endpoint score at 2 hours (PANSS‐PAS, high=worse) | 1 | 29 | Mean Difference (IV, Fixed, 95% CI) | 2.10 [‐2.56, 6.76] |
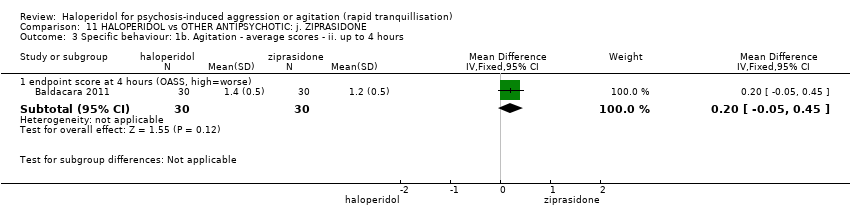
| 6 Specific behaviour: 1d. Agitation ‐ average scores ‐ iii. up to 4 hours Show forest plot | 1 | 60 | Mean Difference (IV, Fixed, 95% CI) | 0.20 [‐0.05, 0.45] |
|
| 6.1 endpoint score at 4 hours (OASS, high=worse) | 1 | 60 | Mean Difference (IV, Fixed, 95% CI) | 0.20 [‐0.05, 0.45] |
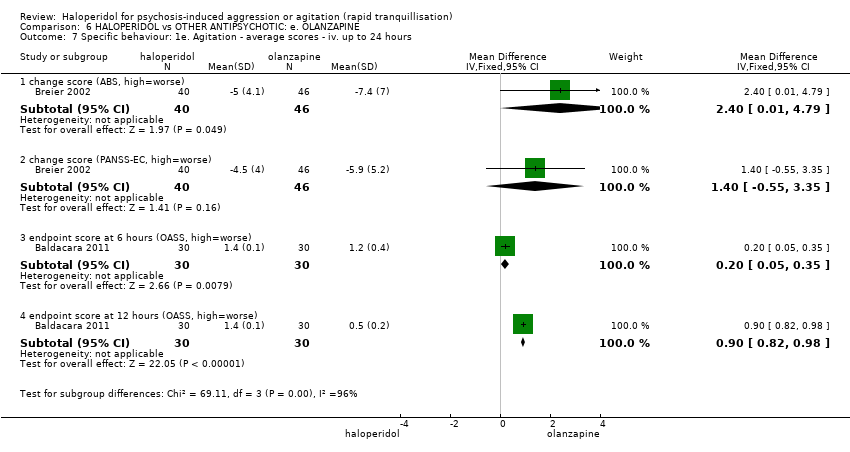
| 7 Specific behaviour: 1e. Agitation ‐ average scores ‐ iv. up to 24 hours Show forest plot | 2 | | Mean Difference (IV, Fixed, 95% CI) | Subtotals only |
|
| 7.1 change score (ABS, high=worse) | 1 | 86 | Mean Difference (IV, Fixed, 95% CI) | 2.40 [0.01, 4.79] |
| 7.2 change score (PANSS‐EC, high=worse) | 1 | 86 | Mean Difference (IV, Fixed, 95% CI) | 1.40 [‐0.55, 3.35] |
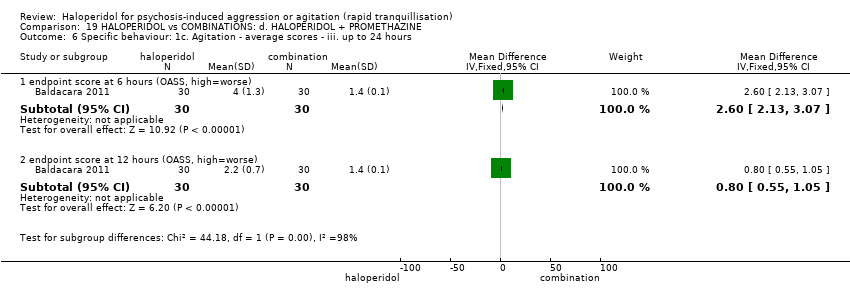
| 7.3 endpoint score at 6 hours (OASS, high=worse) | 1 | 60 | Mean Difference (IV, Fixed, 95% CI) | 0.20 [0.05, 0.35] |
| 7.4 endpoint score at 12 hours (OASS, high=worse) | 1 | 60 | Mean Difference (IV, Fixed, 95% CI) | 0.9 [0.82, 0.98] |
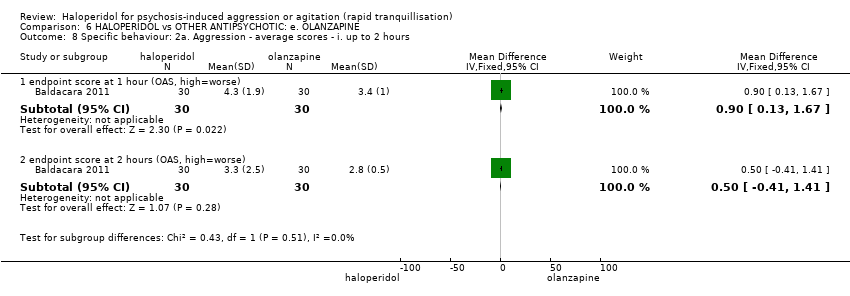
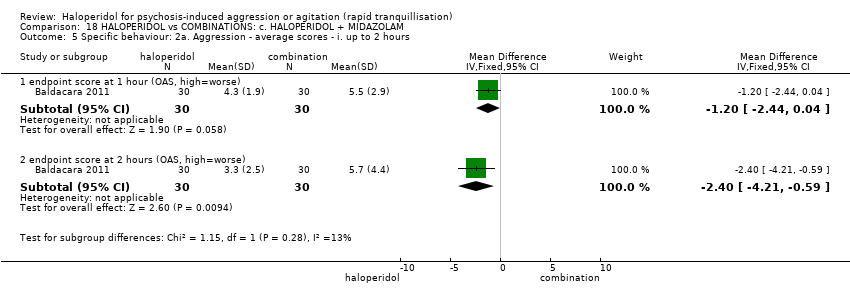
| 8 Specific behaviour: 2a. Aggression ‐ average scores ‐ i. up to 2 hours Show forest plot | 1 | | Mean Difference (IV, Fixed, 95% CI) | Subtotals only |
|
| 8.1 endpoint score at 1 hour (OAS, high=worse) | 1 | 60 | Mean Difference (IV, Fixed, 95% CI) | 0.90 [0.13, 1.67] |
| 8.2 endpoint score at 2 hours (OAS, high=worse) | 1 | 60 | Mean Difference (IV, Fixed, 95% CI) | 0.5 [‐0.41, 1.41] |
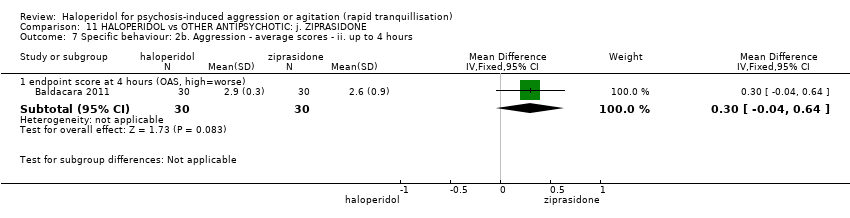
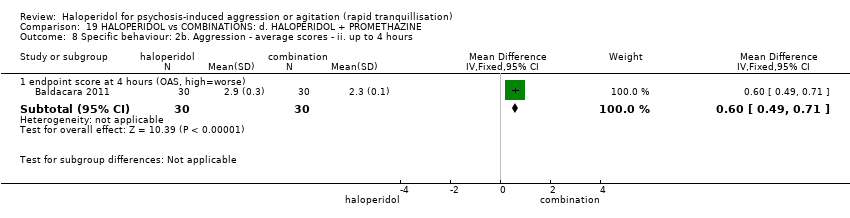
| 9 Specific behaviour: 2b. Aggression ‐ average scores ‐ ii. up to 4 hours Show forest plot | 1 | | Mean Difference (IV, Fixed, 95% CI) | Subtotals only |
|
| 9.1 endpoint score at 4 hours (OAS, high=worse) | 1 | 60 | Mean Difference (IV, Fixed, 95% CI) | 0.10 [‐0.11, 0.31] |
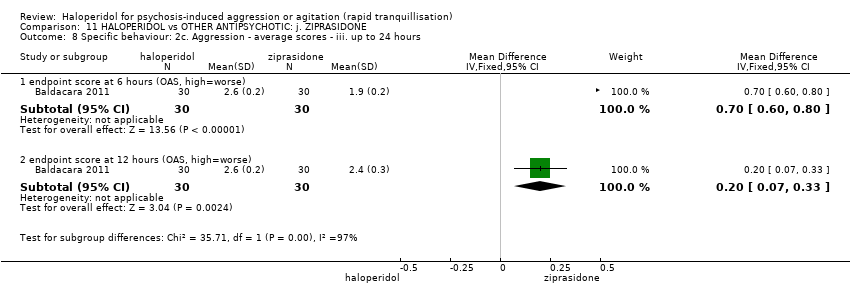
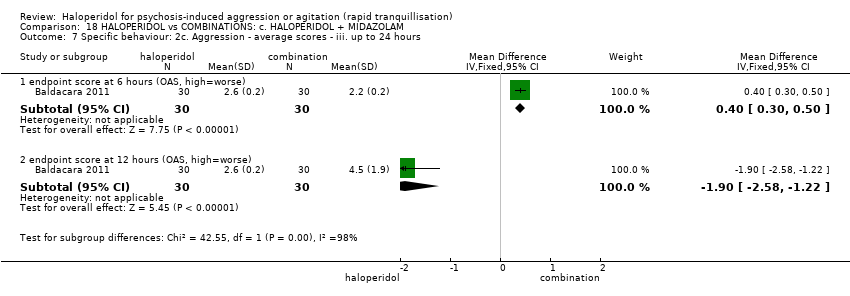
| 10 Specific behaviour: 2c. Aggression ‐ average scores ‐ iii. up to 24 hours Show forest plot | 1 | | Mean Difference (IV, Fixed, 95% CI) | Subtotals only |
|
| 10.1 endpoint score at 6 hours (OAS, high=worse) | 1 | 60 | Mean Difference (IV, Fixed, 95% CI) | ‐0.10 [‐0.26, 0.06] |
| 10.2 endpoint score at 12 hours (OAS, high=worse) | 1 | 60 | Mean Difference (IV, Fixed, 95% CI) | ‐0.20 [‐0.39, ‐0.01] |
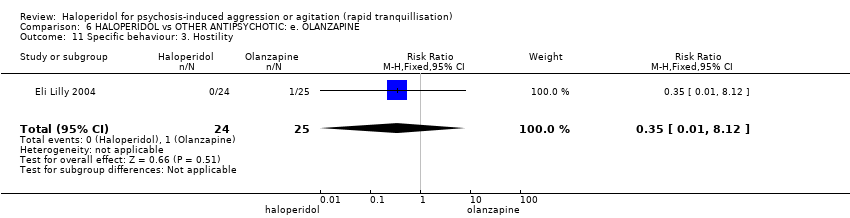
| 11 Specific behaviour: 3. Hostility Show forest plot | 1 | 49 | Risk Ratio (M‐H, Fixed, 95% CI) | 0.35 [0.01, 8.12] |
|
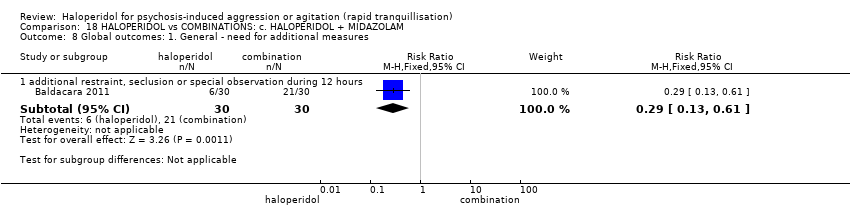
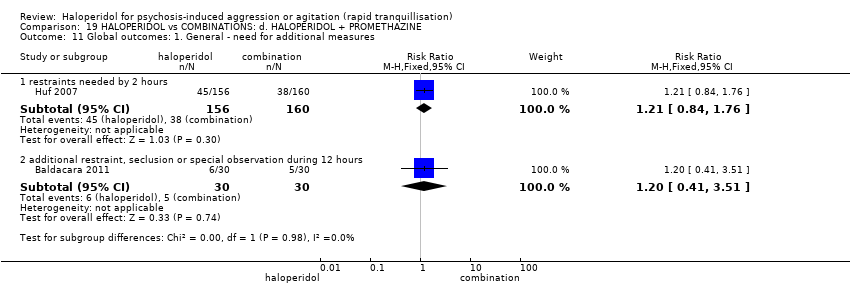
| 12 Global outcome: 1a. General ‐ need for additional measures Show forest plot | 4 | | Risk Ratio (M‐H, Fixed, 95% CI) | Subtotals only |
|
| 12.1 need for benzodiazepine during 24 hours | 2 | 343 | Risk Ratio (M‐H, Fixed, 95% CI) | 1.05 [0.63, 1.74] |
| 12.2 need for benzodiazepine during 7 days | 1 | 100 | Risk Ratio (M‐H, Fixed, 95% CI) | 1.00 [0.79, 1.27] |
| 12.3 additional restraint, seclusion or special observation | 2 | 160 | Risk Ratio (M‐H, Fixed, 95% CI) | 1.49 [0.70, 3.17] |
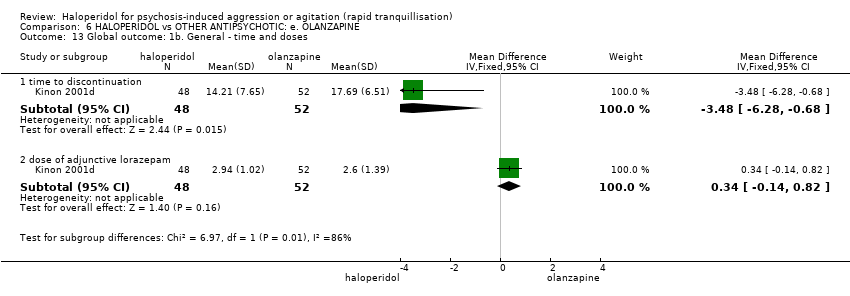
| 13 Global outcome: 1b. General ‐ time and doses Show forest plot | 1 | | Mean Difference (IV, Fixed, 95% CI) | Subtotals only |
|
| 13.1 time to discontinuation | 1 | 100 | Mean Difference (IV, Fixed, 95% CI) | ‐3.48 [‐6.28, ‐0.68] |
| 13.2 dose of adjunctive lorazepam | 1 | 100 | Mean Difference (IV, Fixed, 95% CI) | 0.34 [‐0.14, 0.82] |
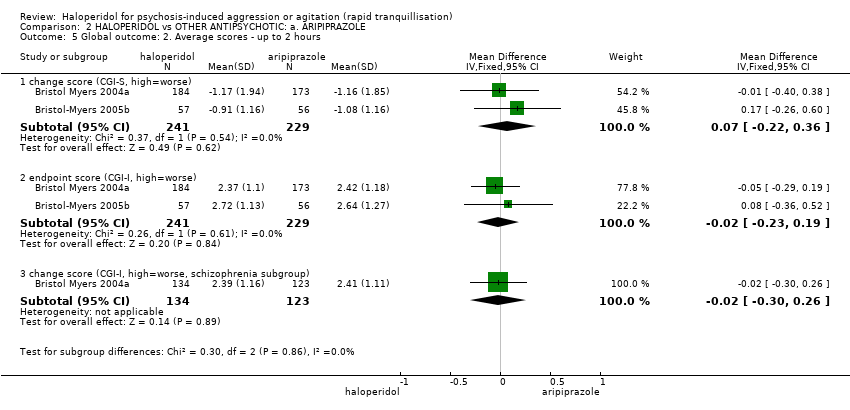
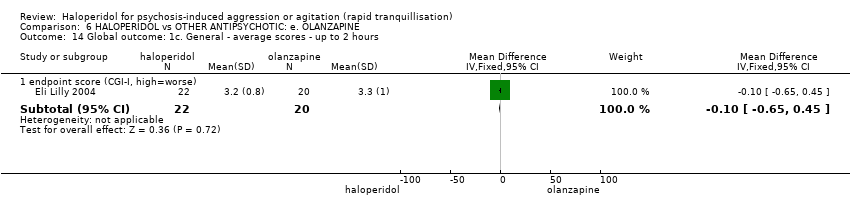
| 14 Global outcome: 1c. General ‐ average scores ‐ up to 2 hours Show forest plot | 1 | | Mean Difference (IV, Fixed, 95% CI) | Subtotals only |
|
| 14.1 endpoint score (CGI‐I, high=worse) | 1 | 42 | Mean Difference (IV, Fixed, 95% CI) | ‐0.10 [‐0.65, 0.45] |
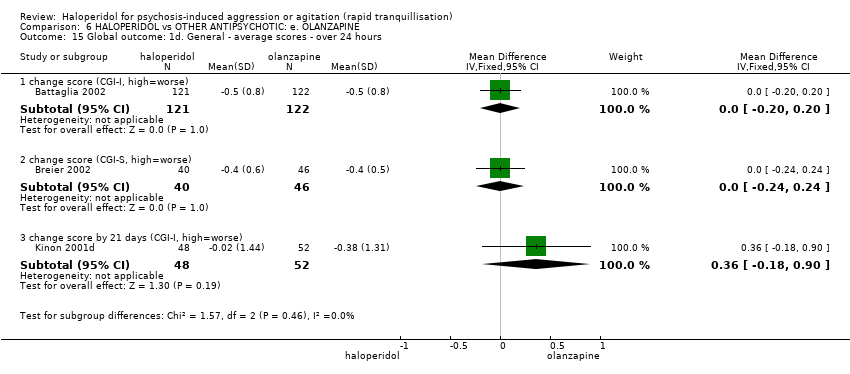
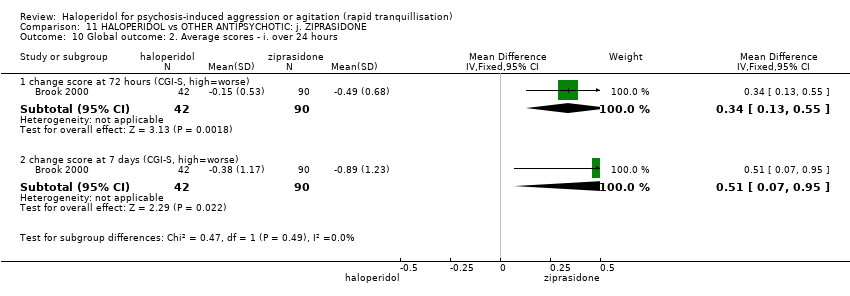
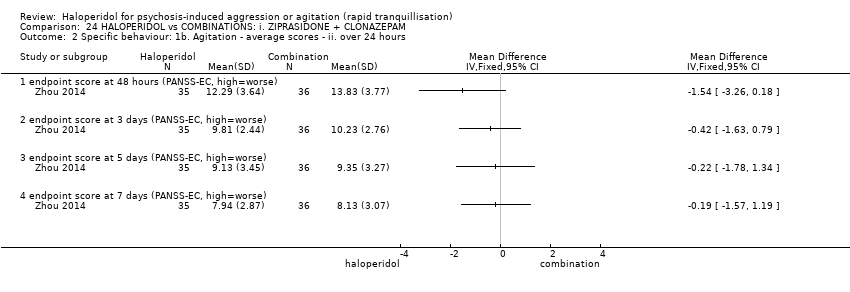
| 15 Global outcome: 1d. General ‐ average scores ‐ over 24 hours Show forest plot | 3 | | Mean Difference (IV, Fixed, 95% CI) | Subtotals only |
|
| 15.1 change score (CGI‐I, high=worse) | 1 | 243 | Mean Difference (IV, Fixed, 95% CI) | 0.0 [‐0.20, 0.20] |
| 15.2 change score (CGI‐S, high=worse) | 1 | 86 | Mean Difference (IV, Fixed, 95% CI) | 0.0 [‐0.24, 0.24] |
| 15.3 change score by 21 days (CGI‐I, high=worse) | 1 | 100 | Mean Difference (IV, Fixed, 95% CI) | 0.36 [‐0.18, 0.90] |
| 16 Global outcome: 2a. Specific ‐ alert ‐ i. up to 2 hours Show forest plot | 1 | | Risk Ratio (M‐H, Fixed, 95% CI) | Subtotals only |
|
| 16.1 alert at 1 hour | 1 | 100 | Risk Ratio (M‐H, Fixed, 95% CI) | 1.24 [0.99, 1.55] |
| 17 Global outcome: 2b. Specific ‐ alert ‐ ii. up to 4 hours Show forest plot | 1 | | Risk Ratio (M‐H, Fixed, 95% CI) | Subtotals only |
|
| 17.1 alert at 4 hours | 1 | 100 | Risk Ratio (M‐H, Fixed, 95% CI) | 0.96 [0.66, 1.42] |
| 18 Global outcome: 2c. Specific ‐ alert ‐ iii. up to 24 hours Show forest plot | 1 | | Risk Ratio (M‐H, Fixed, 95% CI) | Subtotals only |
|
| 18.1 alert at 8 hours | 1 | 100 | Risk Ratio (M‐H, Fixed, 95% CI) | 1.04 [0.67, 1.60] |
| 18.2 alert at 16 hours | 1 | 100 | Risk Ratio (M‐H, Fixed, 95% CI) | 1.02 [0.58, 1.78] |
| 18.3 alert at 24 hours | 1 | 100 | Risk Ratio (M‐H, Fixed, 95% CI) | 0.85 [0.60, 1.20] |
| 19 Global outcome: 2d. Specific ‐ tranquil ‐ i. up to 2 hours Show forest plot | 1 | | Risk Ratio (M‐H, Fixed, 95% CI) | Subtotals only |
|
| 19.1 tranquil at 1 hour | 1 | 100 | Risk Ratio (M‐H, Fixed, 95% CI) | 0.62 [0.29, 1.34] |
| 20 Global outcome: 2e. Specific ‐ tranquil ‐ ii. up to 4 hours Show forest plot | 1 | | Risk Ratio (M‐H, Fixed, 95% CI) | Subtotals only |
|
| 20.1 tranquil at 4 hours | 1 | 100 | Risk Ratio (M‐H, Fixed, 95% CI) | 1.84 [0.94, 3.62] |
| 21 Global outcome: 2f. Specific ‐ tranquil ‐ iii. up to 24 hours Show forest plot | 1 | | Risk Ratio (M‐H, Fixed, 95% CI) | Subtotals only |
|
| 21.1 tranquil at 8 hours | 1 | 100 | Risk Ratio (M‐H, Fixed, 95% CI) | 1.01 [0.55, 1.87] |
| 21.2 tranquil at 16 hours | 1 | 100 | Risk Ratio (M‐H, Fixed, 95% CI) | 0.72 [0.36, 1.45] |
| 21.3 tranquil at 24 hours | 1 | 100 | Risk Ratio (M‐H, Fixed, 95% CI) | 1.50 [0.83, 2.72] |
| 22 Global outcome: 2g. Specific ‐ sedated ‐ i. up to 2 hours Show forest plot | 1 | | Risk Ratio (M‐H, Fixed, 95% CI) | Subtotals only |
|
| 22.1 sedated at 1 hour | 1 | 100 | Risk Ratio (M‐H, Fixed, 95% CI) | 0.22 [0.01, 4.39] |
| 23 Global outcome: 2h. Specific ‐ sedated ‐ ii. up to 4 hours Show forest plot | 1 | | Risk Ratio (M‐H, Fixed, 95% CI) | Subtotals only |
|
| 23.1 sedated at 4 hours | 1 | 100 | Risk Ratio (M‐H, Fixed, 95% CI) | 0.43 [0.18, 1.03] |
| 24 Global outcome: 2i. Specific ‐ sedated ‐ iii. up to 24 hours Show forest plot | 1 | | Risk Ratio (M‐H, Fixed, 95% CI) | Subtotals only |
|
| 24.1 sedated at 8 hours | 1 | 100 | Risk Ratio (M‐H, Fixed, 95% CI) | 1.08 [0.49, 2.37] |
| 24.2 sedated at 16 hours | 1 | 100 | Risk Ratio (M‐H, Fixed, 95% CI) | 0.84 [0.47, 1.50] |
| 24.3 sedated at 24 hours | 1 | 100 | Risk Ratio (M‐H, Fixed, 95% CI) | 0.62 [0.19, 1.98] |
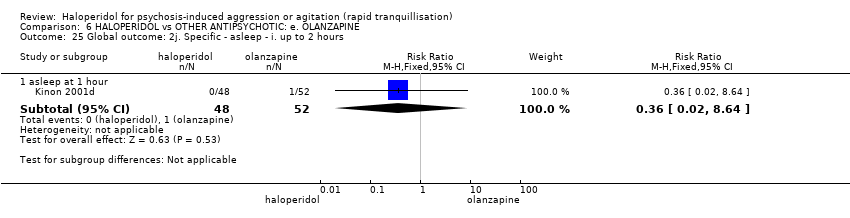
| 25 Global outcome: 2j. Specific ‐ asleep ‐ i. up to 2 hours Show forest plot | 1 | | Risk Ratio (M‐H, Fixed, 95% CI) | Subtotals only |
|
| 25.1 asleep at 1 hour | 1 | 100 | Risk Ratio (M‐H, Fixed, 95% CI) | 0.36 [0.02, 8.64] |
| 26 Global outcome: 2k. Specific ‐ asleep ‐ ii. up to 4 hours Show forest plot | 1 | | Risk Ratio (M‐H, Fixed, 95% CI) | Subtotals only |
|
| 26.1 asleep at 4 hours | 1 | 100 | Risk Ratio (M‐H, Fixed, 95% CI) | 1.08 [0.07, 16.84] |
| 27 Global outcome: 2l. Specific ‐ asleep ‐ iii. up to 24 hours Show forest plot | 1 | | Risk Ratio (M‐H, Fixed, 95% CI) | Subtotals only |
|
| 27.1 asleep at 8 hours | 1 | 100 | Risk Ratio (M‐H, Fixed, 95% CI) | 0.27 [0.03, 2.34] |
| 27.2 asleep at 16 hours | 1 | 100 | Risk Ratio (M‐H, Fixed, 95% CI) | 4.33 [0.97, 19.40] |
| 27.3 asleep at 24 hours | 1 | 100 | Risk Ratio (M‐H, Fixed, 95% CI) | 3.24 [0.14, 77.79] |
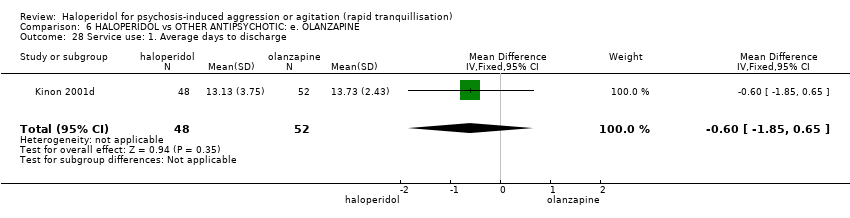
| 28 Service use: 1. Average days to discharge Show forest plot | 1 | 100 | Mean Difference (IV, Fixed, 95% CI) | ‐0.60 [‐1.85, 0.65] |
|
| 29 Service use: 2. Average patient‐hours used during 24 hours (skewed data) Show forest plot | | | Other data | No numeric data |
|
| 29.1 days 1‐7 | | | Other data | No numeric data |
| 29.2 days 8‐14 | | | Other data | No numeric data |
| 29.3 days 15‐21 | | | Other data | No numeric data |
| 30 Mental state: 1. Various outcomes reported as 'adverse events' Show forest plot | 2 | | Risk Ratio (M‐H, Fixed, 95% CI) | Subtotals only |
|
| 30.1 anxiety | 1 | 49 | Risk Ratio (M‐H, Fixed, 95% CI) | 0.35 [0.01, 8.12] |
| 30.2 anxiety during 21 days (if occurred in ≧10% at P < 0.05) | 1 | 100 | Risk Ratio (M‐H, Fixed, 95% CI) | 0.36 [0.08, 1.70] |
| 30.3 delusions | 1 | 49 | Risk Ratio (M‐H, Fixed, 95% CI) | 0.35 [0.01, 8.12] |
| 30.4 nervousness during 21 days (if occurred in ≧10% at P < 0.05) | 1 | 100 | Risk Ratio (M‐H, Fixed, 95% CI) | 2.17 [0.70, 6.74] |
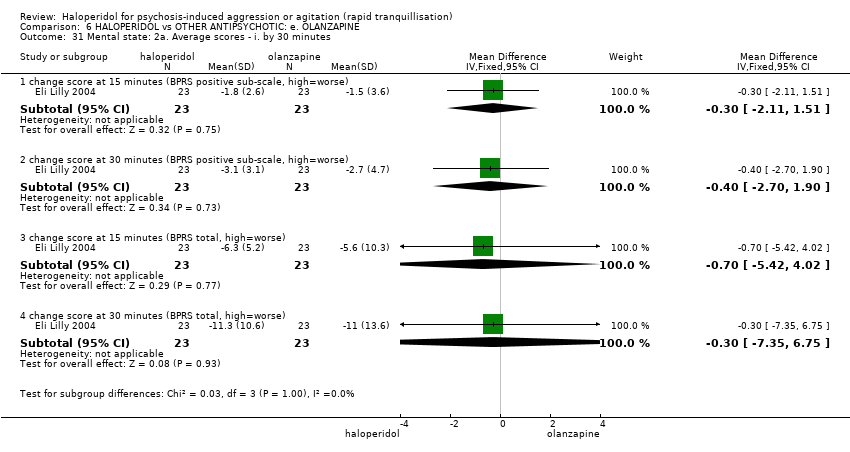
| 31 Mental state: 2a. Average scores ‐ i. by 30 minutes Show forest plot | 1 | | Mean Difference (IV, Fixed, 95% CI) | Subtotals only |
|
| 31.1 change score at 15 minutes (BPRS positive sub‐scale, high=worse) | 1 | 46 | Mean Difference (IV, Fixed, 95% CI) | ‐0.30 [‐2.11, 1.51] |
| 31.2 change score at 30 minutes (BPRS positive sub‐scale, high=worse) | 1 | 46 | Mean Difference (IV, Fixed, 95% CI) | ‐0.40 [‐2.70, 1.90] |
| 31.3 change score at 15 minutes (BPRS total, high=worse) | 1 | 46 | Mean Difference (IV, Fixed, 95% CI) | ‐0.70 [‐5.42, 4.02] |
| 31.4 change score at 30 minutes (BPRS total, high=worse) | 1 | 46 | Mean Difference (IV, Fixed, 95% CI) | ‐0.30 [‐7.35, 6.75] |
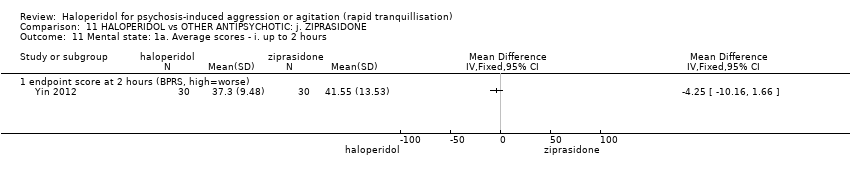
| 32 Mental state: 2b. Average scores ‐ ii. up to 2 hours Show forest plot | 3 | | Mean Difference (IV, Fixed, 95% CI) | Subtotals only |
|
| 32.1 change score at 1 hour (BPRS positive sub‐scale, high=worse) | 1 | 46 | Mean Difference (IV, Fixed, 95% CI) | 0.60 [‐2.74, 3.94] |
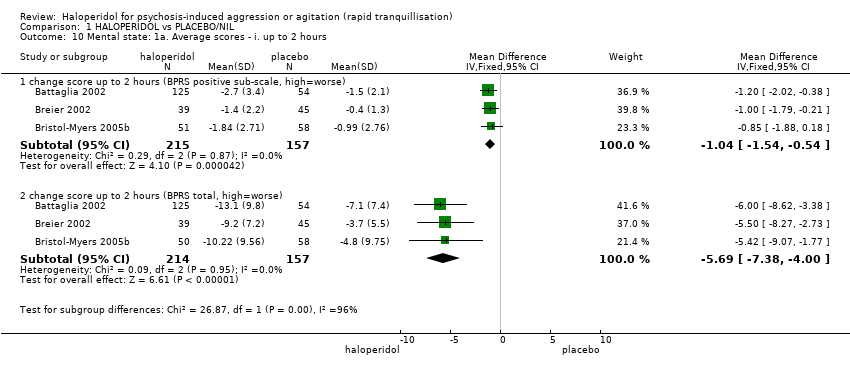
| 32.2 change score at 2 hours (BPRS positive sub‐scale, high=worse) | 3 | 385 | Mean Difference (IV, Fixed, 95% CI) | 0.28 [‐0.34, 0.89] |
| 32.3 change score at 1 hour (BPRS total, high=worse) | 1 | 46 | Mean Difference (IV, Fixed, 95% CI) | 4.70 [‐5.03, 14.43] |
| 32.4 change score at 2 hours (BPRS total, high=worse) | 3 | 385 | Mean Difference (IV, Fixed, 95% CI) | 1.75 [‐0.12, 3.62] |
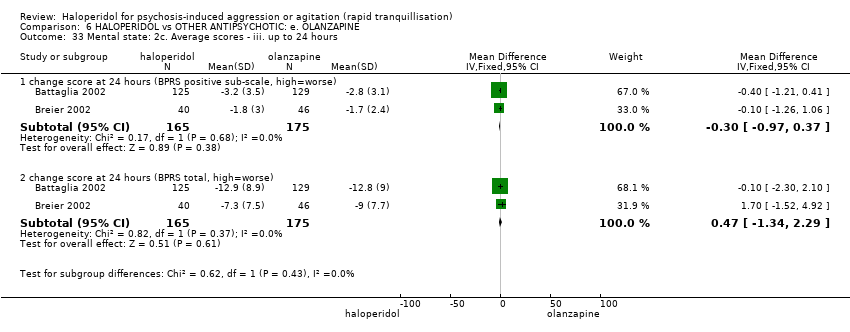
| 33 Mental state: 2c. Average scores ‐ iii. up to 24 hours Show forest plot | 2 | | Mean Difference (IV, Fixed, 95% CI) | Subtotals only |
|
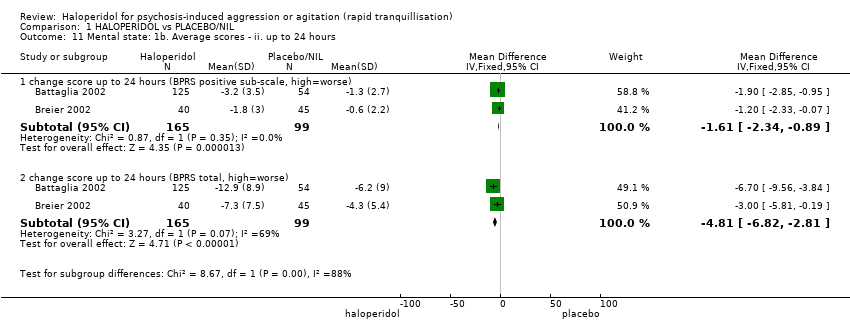
| 33.1 change score at 24 hours (BPRS positive sub‐scale, high=worse) | 2 | 340 | Mean Difference (IV, Fixed, 95% CI) | ‐0.30 [‐0.97, 0.37] |
| 33.2 change score at 24 hours (BPRS total, high=worse) | 2 | 340 | Mean Difference (IV, Fixed, 95% CI) | 0.47 [‐1.34, 2.29] |
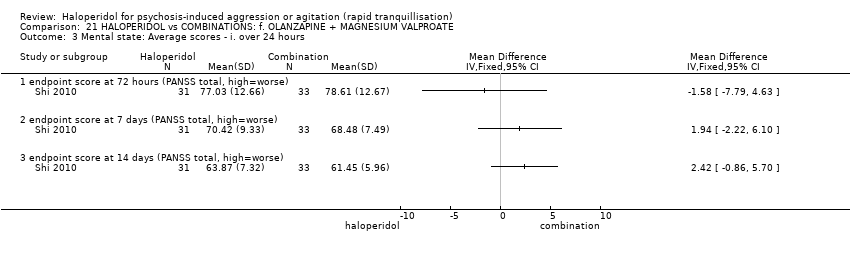
| 34 Mental state: 2d. Average scores ‐ iv. over 24 hours Show forest plot | 1 | 100 | Mean Difference (IV, Fixed, 95% CI) | 4.70 [‐0.18, 9.58] |
|
| 34.1 change score at 21 days (PANSS total, high=worse) | 1 | 100 | Mean Difference (IV, Fixed, 95% CI) | 4.70 [‐0.18, 9.58] |
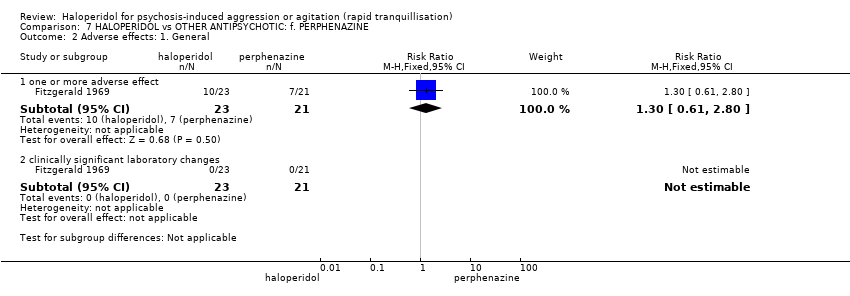
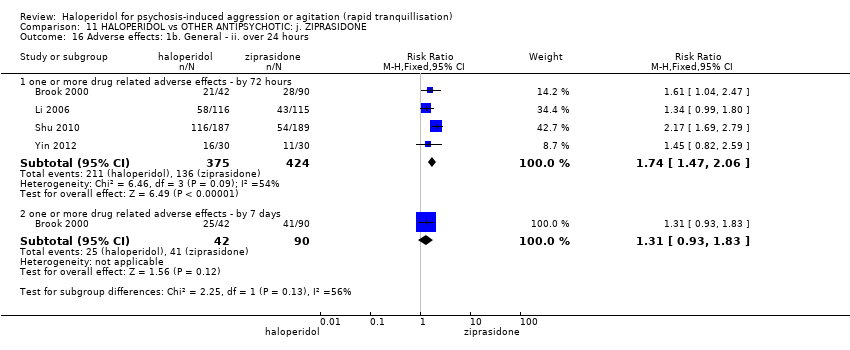
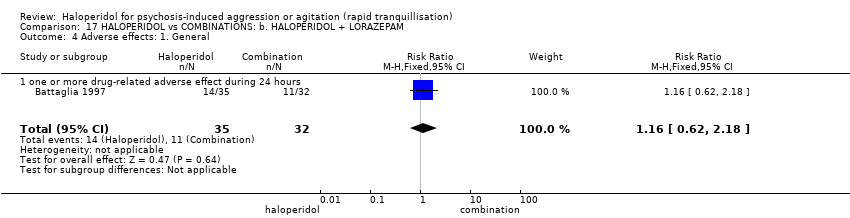
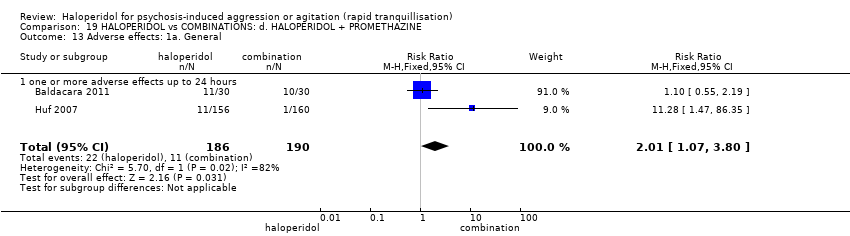
| 35 Adverse effects: 1a. General Show forest plot | 3 | | Risk Ratio (M‐H, Fixed, 95% CI) | Subtotals only |
|
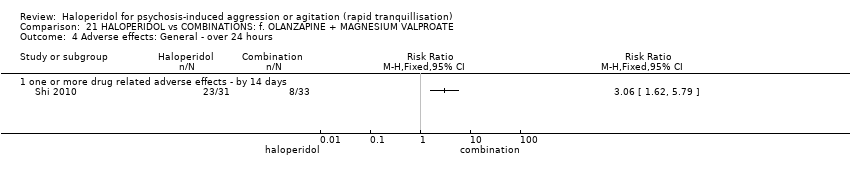
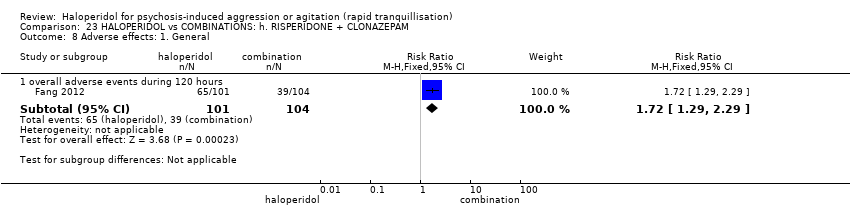
| 35.1 one or more drug related adverse events | 3 | 209 | Risk Ratio (M‐H, Fixed, 95% CI) | 1.38 [1.09, 1.76] |
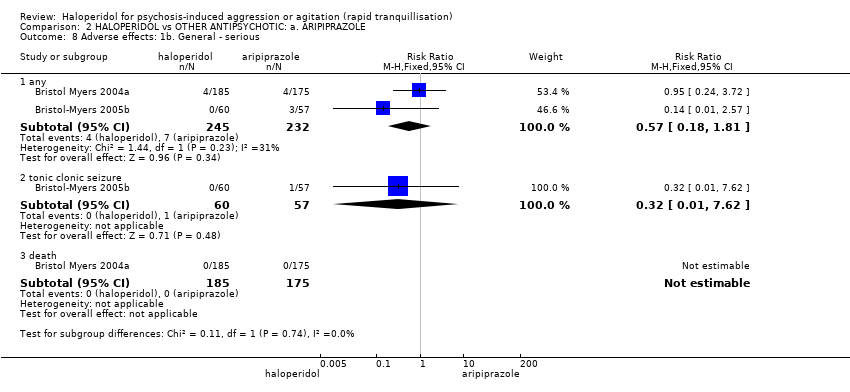
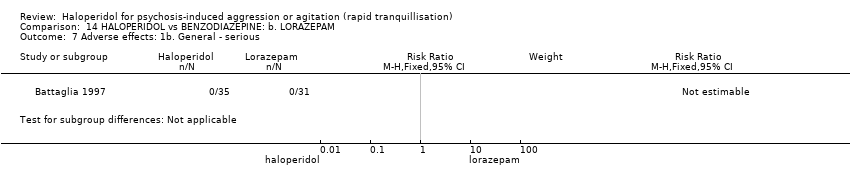
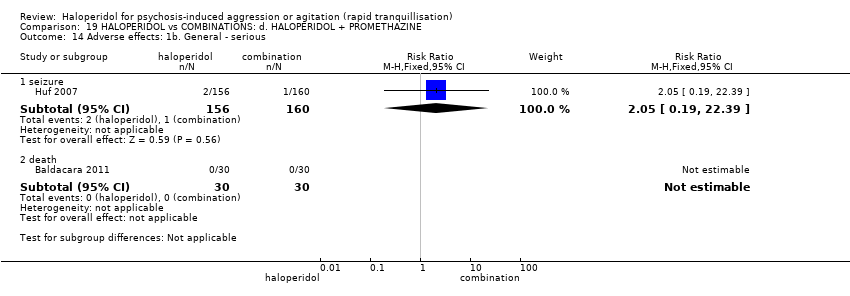
| 36 Adverse effects: 1b. General ‐ serious Show forest plot | 3 | | Risk Ratio (M‐H, Fixed, 95% CI) | Subtotals only |
|
| 36.1 one or more treatment emergent adverse events | 1 | 49 | Risk Ratio (M‐H, Fixed, 95% CI) | 0.81 [0.36, 1.83] |
| 36.2 treatment emergent adverse events ‐ all | 1 | 49 | Risk Ratio (M‐H, Fixed, 95% CI) | 1.23 [0.69, 2.19] |
| 36.3 overall serious adverse effects | 1 | 49 | Risk Ratio (M‐H, Fixed, 95% CI) | 0.0 [0.0, 0.0] |
| 36.4 death | 3 | 138 | Risk Ratio (M‐H, Fixed, 95% CI) | 0.0 [0.0, 0.0] |
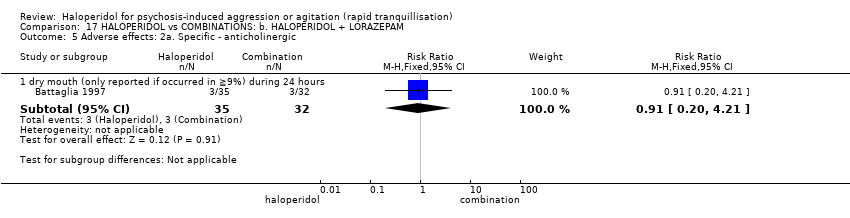
| 37 Adverse effects: 2a. Specific ‐ anticholinergic Show forest plot | 1 | | Risk Ratio (M‐H, Fixed, 95% CI) | Subtotals only |
|
| 37.1 increased salivation during 21 days (if occurred in ≧10% at P < 0.05) | 1 | 100 | Risk Ratio (M‐H, Fixed, 95% CI) | 9.73 [0.54, 176.18] |
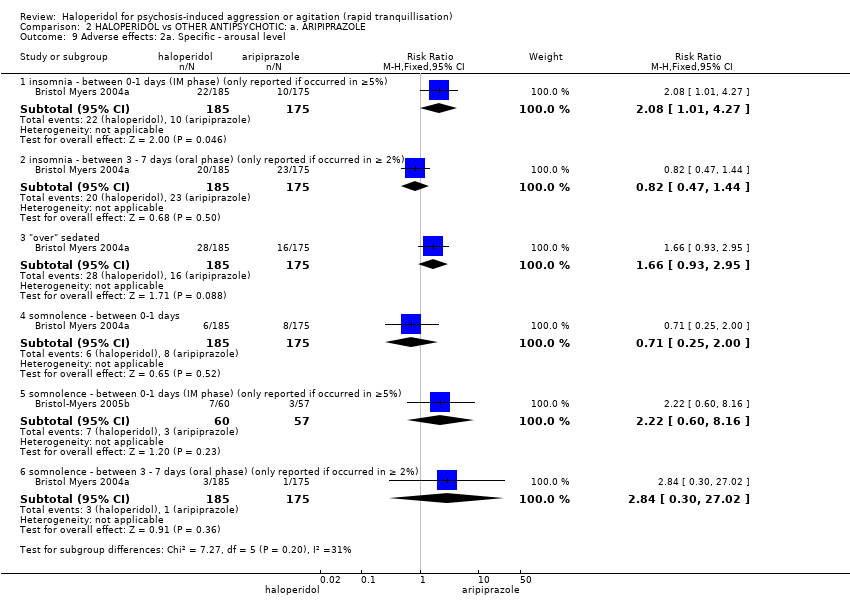
| 38 Adverse effects: 2b. Specific ‐ arousal level ‐ i. various Show forest plot | 4 | | Risk Ratio (M‐H, Fixed, 95% CI) | Subtotals only |
|
| 38.1 insomnia | 1 | 49 | Risk Ratio (M‐H, Fixed, 95% CI) | 1.04 [0.39, 2.78] |
| 38.2 insomnia during 21 days (if occurred in ≧10% at P < 0.05) | 1 | 100 | Risk Ratio (M‐H, Fixed, 95% CI) | 2.17 [0.57, 8.19] |
| 38.3 somnolence at 24 hours | 1 | 257 | Risk Ratio (M‐H, Fixed, 95% CI) | 1.04 [0.45, 2.41] |
| 38.4 somnolence during 21 days (if occurred in ≧10% at P < 0.05) | 1 | 100 | Risk Ratio (M‐H, Fixed, 95% CI) | 1.44 [0.67, 3.12] |
| 38.5 excessive sedation during 24 hours | 1 | 60 | Risk Ratio (M‐H, Fixed, 95% CI) | 3.0 [0.33, 27.23] |
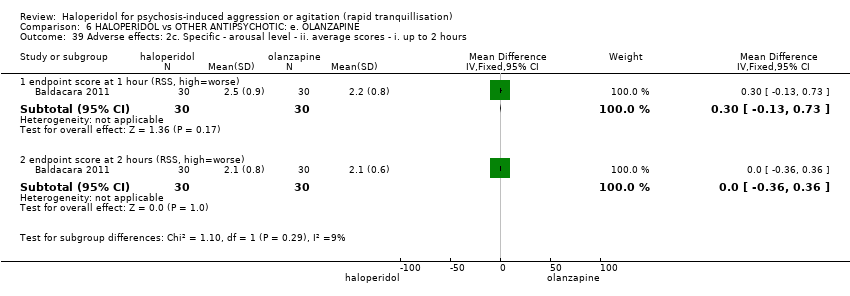
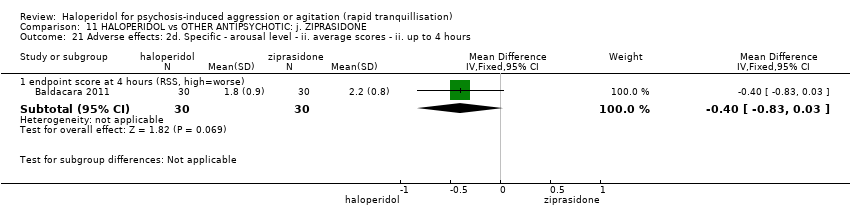
| 39 Adverse effects: 2c. Specific ‐ arousal level ‐ ii. average scores ‐ i. up to 2 hours Show forest plot | 1 | | Mean Difference (IV, Fixed, 95% CI) | Subtotals only |
|
| 39.1 endpoint score at 1 hour (RSS, high=worse) | 1 | 60 | Mean Difference (IV, Fixed, 95% CI) | 0.30 [‐0.13, 0.73] |
| 39.2 endpoint score at 2 hours (RSS, high=worse) | 1 | 60 | Mean Difference (IV, Fixed, 95% CI) | 0.0 [‐0.36, 0.36] |
| 40 Adverse effects: 2d. Specific ‐ arousal level ‐ ii. average scores ‐ ii. up to 4 hours Show forest plot | 1 | | Mean Difference (IV, Fixed, 95% CI) | Subtotals only |
|
| 40.1 endpoint score at 4 hours (RSS, high=worse) | 1 | 60 | Mean Difference (IV, Fixed, 95% CI) | ‐0.20 [‐0.61, 0.21] |
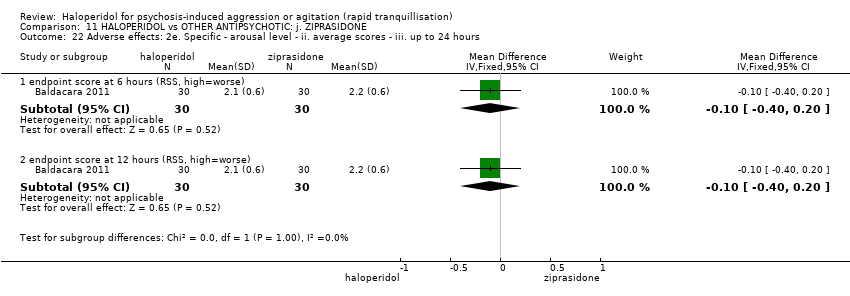
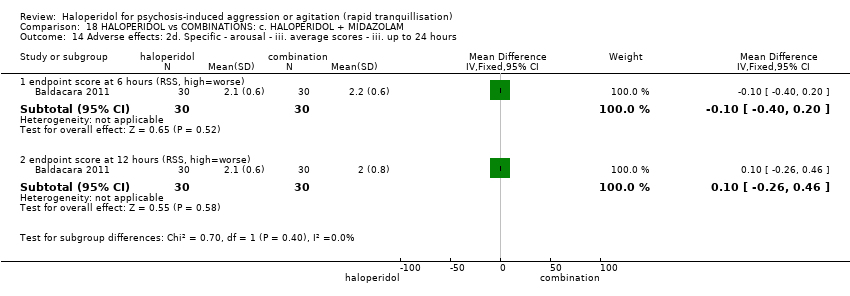
| 41 Adverse effects: 2e. Specific ‐ arousal level ‐ ii. average scores ‐ iii. up to 24 hours Show forest plot | 1 | | Mean Difference (IV, Fixed, 95% CI) | Subtotals only |
|
| 41.1 endpoint score at 6 hours (RSS, high=worse) | 1 | 60 | Mean Difference (IV, Fixed, 95% CI) | ‐0.10 [‐0.38, 0.18] |
| 41.2 endpoint score at 12 hours (RSS, high=worse) | 1 | 60 | Mean Difference (IV, Fixed, 95% CI) | 0.0 [‐0.26, 0.26] |
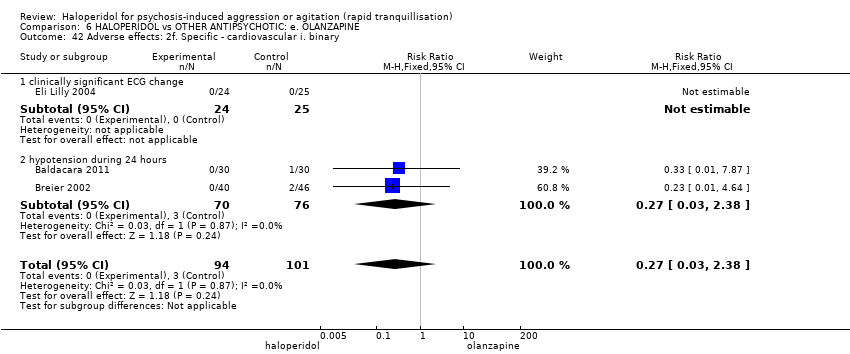
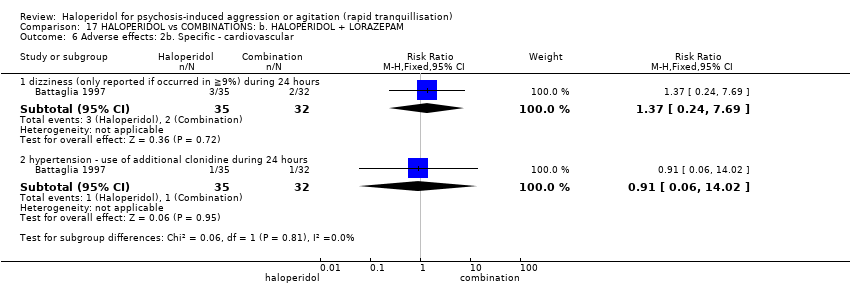
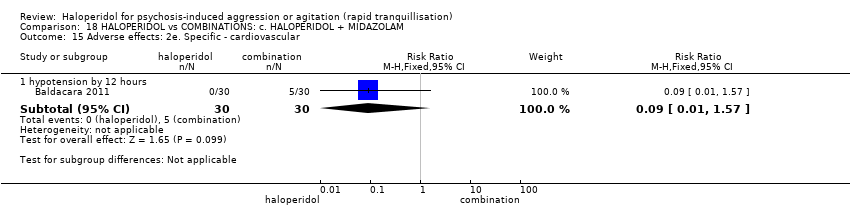
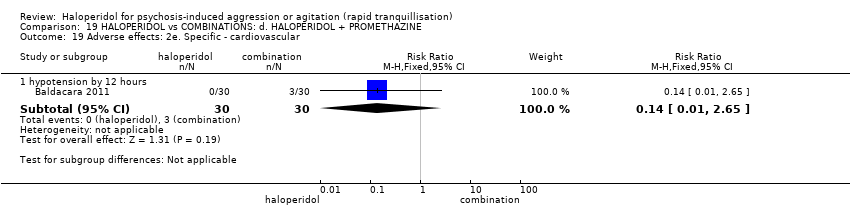
| 42 Adverse effects: 2f. Specific ‐ cardiovascular i. binary Show forest plot | 3 | 195 | Risk Ratio (M‐H, Fixed, 95% CI) | 0.27 [0.03, 2.38] |
|
| 42.1 clinically significant ECG change | 1 | 49 | Risk Ratio (M‐H, Fixed, 95% CI) | 0.0 [0.0, 0.0] |
| 42.2 hypotension during 24 hours | 2 | 146 | Risk Ratio (M‐H, Fixed, 95% CI) | 0.27 [0.03, 2.38] |
| 43 Adverse effects: 2g. Specific ‐ cardiovascular ii. continuous Show forest plot | 2 | | Mean Difference (IV, Fixed, 95% CI) | Subtotals only |
|
| 43.1 QT interval: average change at 24 hours | 1 | 257 | Mean Difference (IV, Fixed, 95% CI) | 1.8 [‐3.81, 7.41] |
| 43.2 QT interval: average endpoint score at 24 hours | 1 | 86 | Mean Difference (IV, Fixed, 95% CI) | 8.5 [‐3.28, 20.28] |
| 44 Adverse effects: 2h. Specific ‐ gastrointestinal Show forest plot | 1 | | Risk Ratio (M‐H, Fixed, 95% CI) | Subtotals only |
|
| 44.1 abdominal pain | 1 | 49 | Risk Ratio (M‐H, Fixed, 95% CI) | 3.12 [0.13, 73.04] |
| 44.2 vomiting | 1 | 49 | Risk Ratio (M‐H, Fixed, 95% CI) | 5.2 [0.26, 103.03] |
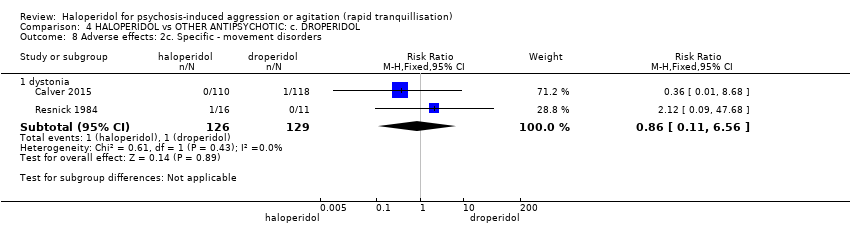
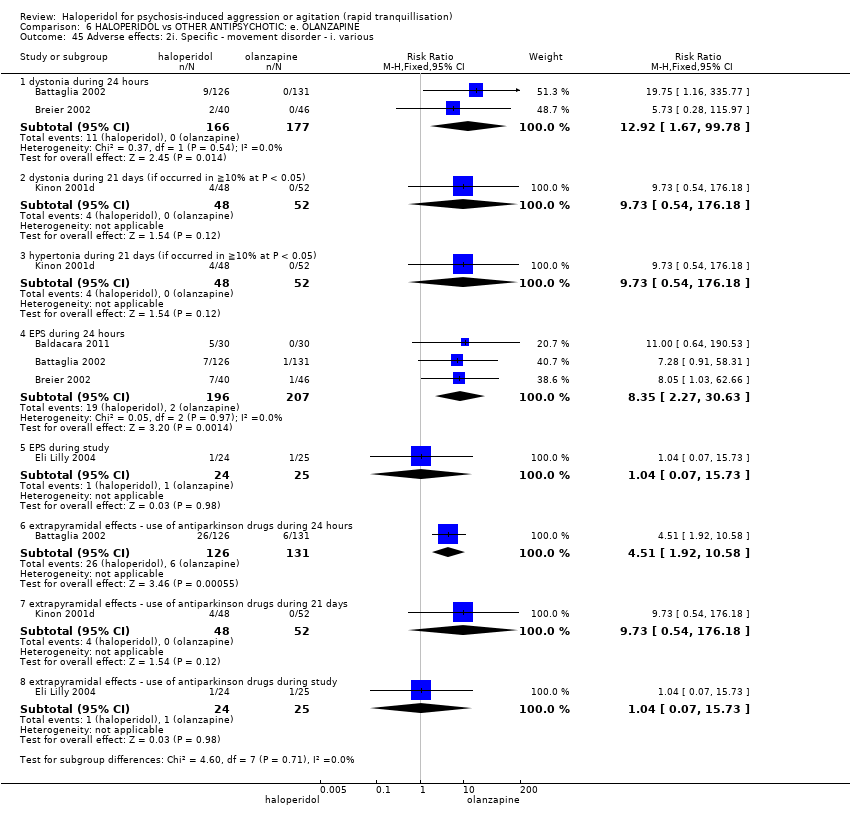
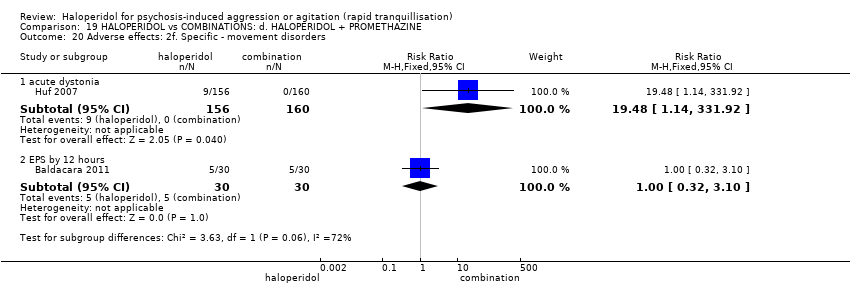
| 45 Adverse effects: 2i. Specific ‐ movement disorder ‐ i. various Show forest plot | 5 | | Risk Ratio (M‐H, Fixed, 95% CI) | Subtotals only |
|
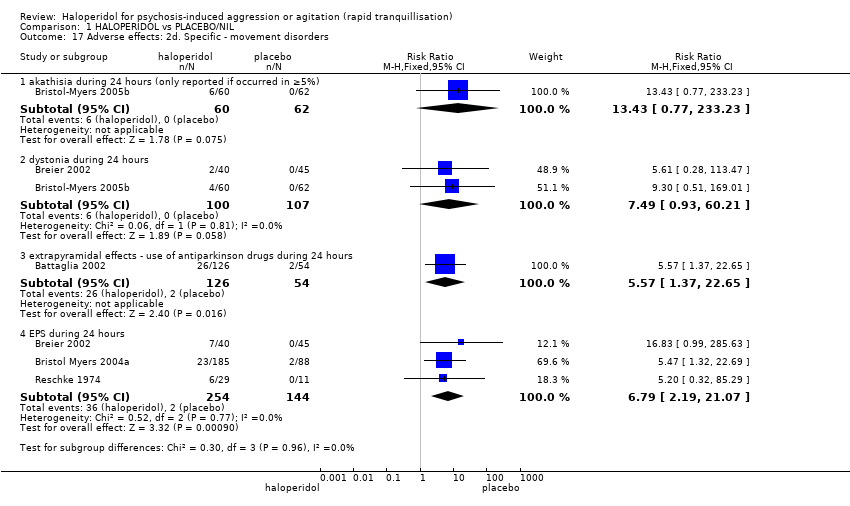
| 45.1 dystonia during 24 hours | 2 | 343 | Risk Ratio (M‐H, Fixed, 95% CI) | 12.92 [1.67, 99.78] |
| 45.2 dystonia during 21 days (if occurred in ≧10% at P < 0.05) | 1 | 100 | Risk Ratio (M‐H, Fixed, 95% CI) | 9.73 [0.54, 176.18] |
| 45.3 hypertonia during 21 days (if occurred in ≧10% at P < 0.05) | 1 | 100 | Risk Ratio (M‐H, Fixed, 95% CI) | 9.73 [0.54, 176.18] |
| 45.4 EPS during 24 hours | 3 | 403 | Risk Ratio (M‐H, Fixed, 95% CI) | 8.35 [2.27, 30.63] |
| 45.5 EPS during study | 1 | 49 | Risk Ratio (M‐H, Fixed, 95% CI) | 1.04 [0.07, 15.73] |
| 45.6 extrapyramidal effects ‐ use of antiparkinson drugs during 24 hours | 1 | 257 | Risk Ratio (M‐H, Fixed, 95% CI) | 4.51 [1.92, 10.58] |
| 45.7 extrapyramidal effects ‐ use of antiparkinson drugs during 21 days | 1 | 100 | Risk Ratio (M‐H, Fixed, 95% CI) | 9.73 [0.54, 176.18] |
| 45.8 extrapyramidal effects ‐ use of antiparkinson drugs during study | 1 | 49 | Risk Ratio (M‐H, Fixed, 95% CI) | 1.04 [0.07, 15.73] |
| 46 Adverse effects: 2j. Specific ‐ movement disorder ‐ ii. average scores ‐ i. up to 24 hours Show forest plot | 1 | 483 | Mean Difference (IV, Fixed, 95% CI) | 0.34 [0.16, 0.53] |
|
| 46.1 change score at 24 hours (SAS, high=worse) | 1 | 242 | Mean Difference (IV, Fixed, 95% CI) | 1.31 [0.56, 2.06] |
| 46.2 change score at 24 hours (BAS, high=worse) | 1 | 241 | Mean Difference (IV, Fixed, 95% CI) | 0.28 [0.09, 0.47] |
| 47 Adverse effects: 2k. Specific ‐ movement disorder ‐ iii. average scores ‐ i. up to 24 hours Show forest plot | | | Other data | No numeric data |
|
| 47.1 endpoint score at 24 hours (SAS, high=worse) ‐ (skewed data) | | | Other data | No numeric data |
| 47.2 endpoint score at 24 hours (BAS, high=worse) ‐ (skewed data) | | | Other data | No numeric data |
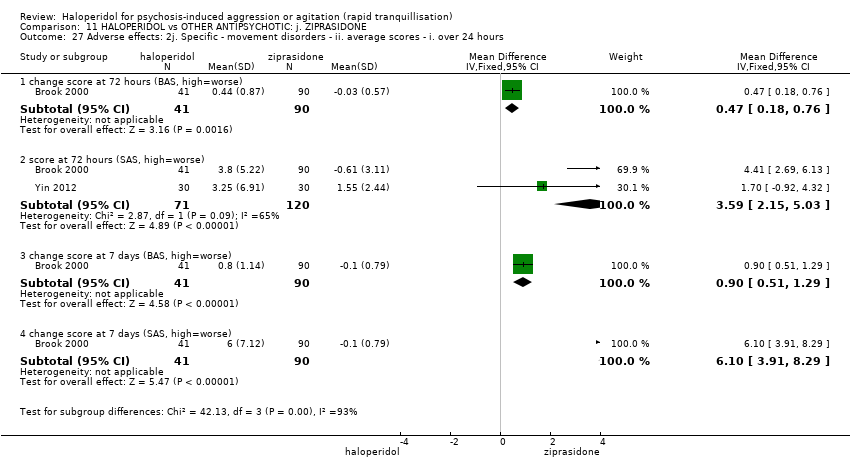
| 48 Adverse effects: 2l. Specific ‐ movement disorder ‐ vi. average scores ‐ i. over 24 hours Show forest plot | 1 | | Mean Difference (IV, Fixed, 95% CI) | Subtotals only |
|
| 48.1 endpoint score at 96 hours (AIMS, high=worse) | 1 | 29 | Mean Difference (IV, Fixed, 95% CI) | 0.20 [‐0.87, 1.27] |
| 48.2 endpoint score at 96 hours (BARS, high=worse) | 1 | 29 | Mean Difference (IV, Fixed, 95% CI) | 0.8 [‐0.01, 1.61] |
| 48.3 endpoint score at 96 hours (SAS, high=worse) | 1 | 29 | Mean Difference (IV, Fixed, 95% CI) | 2.2 [‐0.07, 4.47] |
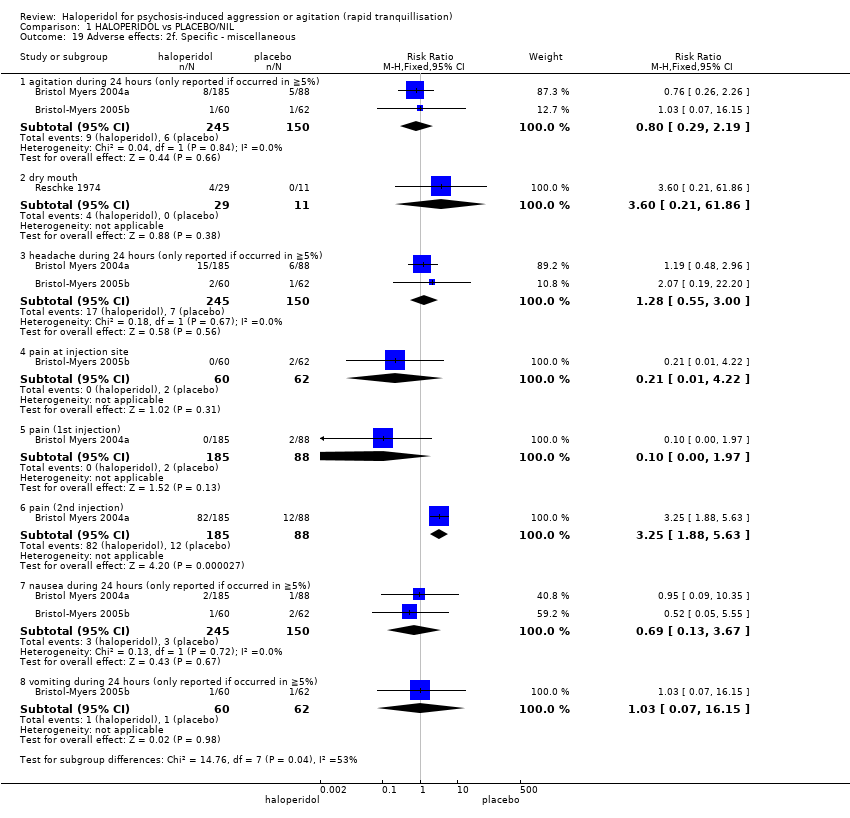
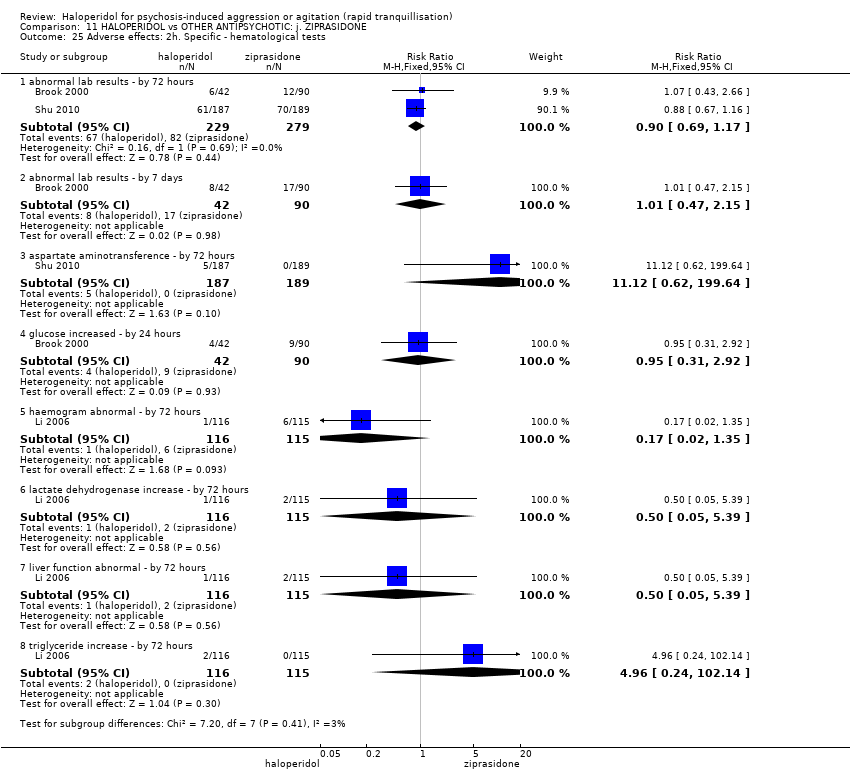
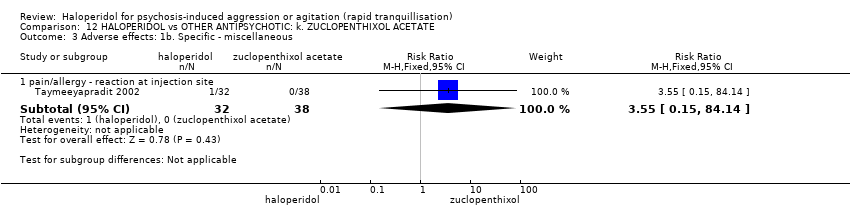
| 49 Adverse effects: 2m. Specific ‐ miscellaneous Show forest plot | 2 | | Risk Ratio (M‐H, Fixed, 95% CI) | Subtotals only |
|
| 49.1 pain | 1 | 49 | Risk Ratio (M‐H, Fixed, 95% CI) | 3.12 [0.13, 73.04] |
| 49.2 pain during 21 days (if occurred in ≧10% at P < 0.05) | 1 | 100 | Risk Ratio (M‐H, Fixed, 95% CI) | 1.08 [0.33, 3.51] |
| 49.3 pain ‐ headache during 21 days (if occurred in ≧10% at P < 0.05) | 1 | 100 | Risk Ratio (M‐H, Fixed, 95% CI) | 2.17 [0.88, 5.32] |
| 49.4 other ‐ nose bleed | 1 | 49 | Risk Ratio (M‐H, Fixed, 95% CI) | 3.12 [0.13, 73.04] |
| 49.5 other ‐ clinically relevant laboratory changes | 2 | 149 | Risk Ratio (M‐H, Fixed, 95% CI) | 0.0 [0.0, 0.0] |
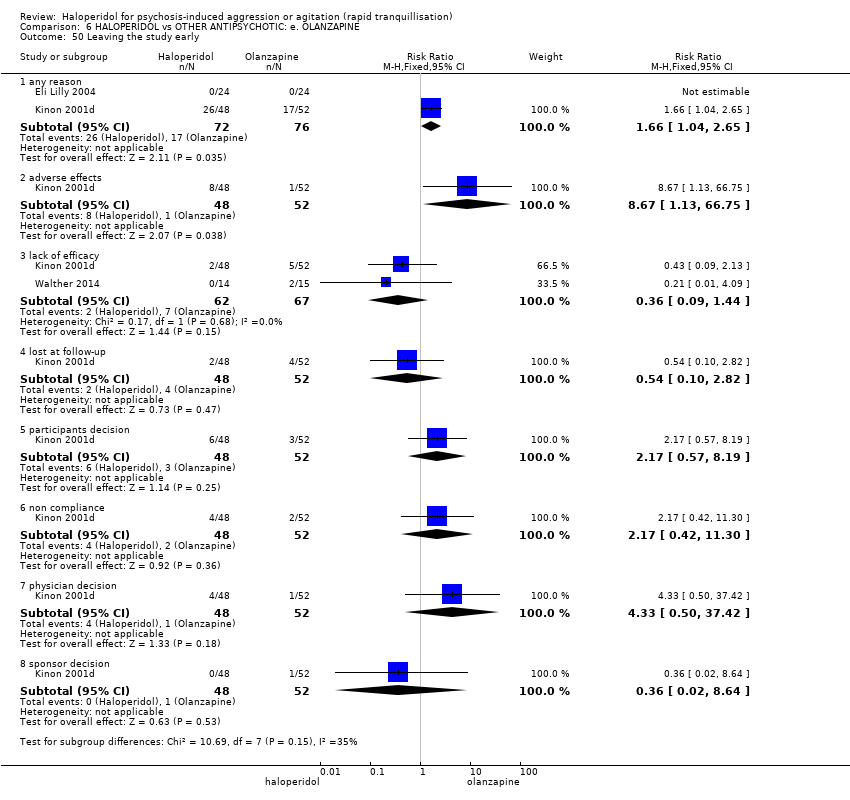
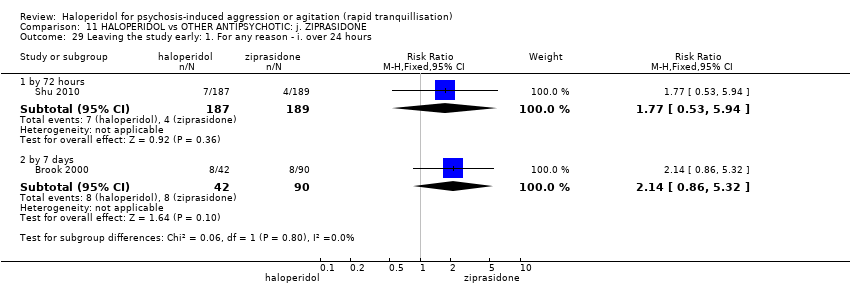
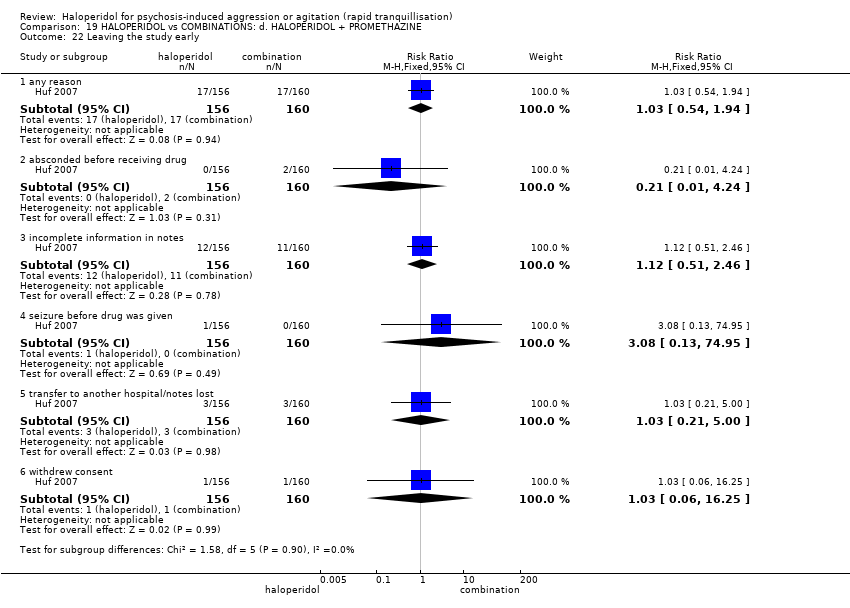
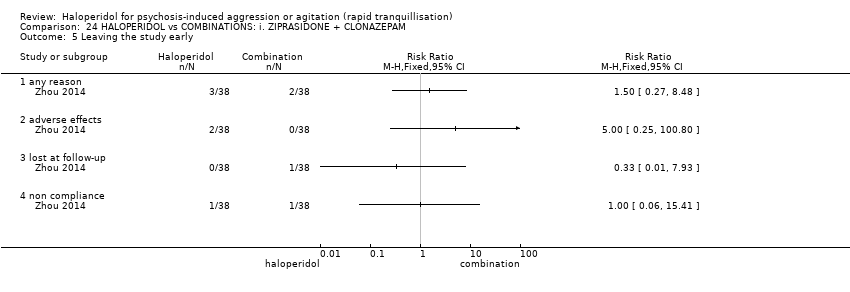
| 50 Leaving the study early Show forest plot | 3 | | Risk Ratio (M‐H, Fixed, 95% CI) | Subtotals only |
|
| 50.1 any reason | 2 | 148 | Risk Ratio (M‐H, Fixed, 95% CI) | 1.66 [1.04, 2.65] |
| 50.2 adverse effects | 1 | 100 | Risk Ratio (M‐H, Fixed, 95% CI) | 8.67 [1.13, 66.75] |
| 50.3 lack of efficacy | 2 | 129 | Risk Ratio (M‐H, Fixed, 95% CI) | 0.36 [0.09, 1.44] |
| 50.4 lost at follow‐up | 1 | 100 | Risk Ratio (M‐H, Fixed, 95% CI) | 0.54 [0.10, 2.82] |
| 50.5 participants decision | 1 | 100 | Risk Ratio (M‐H, Fixed, 95% CI) | 2.17 [0.57, 8.19] |
| 50.6 non compliance | 1 | 100 | Risk Ratio (M‐H, Fixed, 95% CI) | 2.17 [0.42, 11.30] |
| 50.7 physician decision | 1 | 100 | Risk Ratio (M‐H, Fixed, 95% CI) | 4.33 [0.50, 37.42] |
| 50.8 sponsor decision | 1 | 100 | Risk Ratio (M‐H, Fixed, 95% CI) | 0.36 [0.02, 8.64] |