Fingolimod bei rezidiverend‐remittierender multipler Sklerose
Referencias
References to studies included in this review
References to studies excluded from this review
References to studies awaiting assessment
References to ongoing studies
Additional references
References to other published versions of this review
Characteristics of studies
Characteristics of included studies [ordered by study ID]
| Methods | Randomised, double‐blind, placebo‐controlled parallel groups, phase III trial Multicentre (117 centres) performed across eight countries, predominantly in USA (101), 1 centre in Australia, 1 centre in Austria, 2 centres in Canada, 3 centres in Poland, 3 centres in Romania, 5 centres in Turkey, 1 centre in United Kingdom Enrollment: from June 2006 to March 2009 Acronym: FREEDOMS II | |
| Participants | 1083 participants with RRMS Inclusion criteria: 1. 18 to 55 years of age 2. Diagnosis of RRMS according to the 2005 revised McDonald criteria (Polman 2005) 3. One or more confirmed relapses during the preceding year (or two or more confirmed relapses during the previous two years) 4. EDSS score between 0 to 5.5 points (Kurtzke 1983) 5. No relapse or steroid treatment within 30 days before randomisation 6. Both treatment‐naive and previously treated people 7. Previously treated participants were eligible if interferon beta or glatiramer acetate therapy was stopped at least three months before randomisation and natalizumab treatment at least six months before randomisation Exclusion criteria: 1. Clinically significant systemic disease 2. Immune suppression (drug‐induced or disease induced) 3. Active infection or macular oedema, diabetes mellitus 4. History of malignancy (apart from successfully treated basal or squamous‐cell skin carcinoma) 5. Participants with specific cardiac, pulmonary, or hepatic disorders 6. Varicella ZV IgG antibody negative (Calabresi 2014, Supplementary web appendix) | |
| Interventions | Participants were randomly allocated to one of the three groups: 1. Fingolimod 0.5 mg orally once‐daily (358 participants) 2. Fingolimod 1.25 mg orally once‐daily (370 participants) 3. Placebo orally once‐daily (355 participants) After review of data from the FREEDOMS and TRANSFORMS studies, on Nov 12, 2009, participants treated with the 1.25 mg dose, owing to the absence of clear added benefits and a higher risk for safety events such as infections and macular oedema (Calabresi 2014, Supplementary web appendix), were subsequently switched to the 0.5 mg dose in a blinded manner | |
| Outcomes | Primary endpoint was the annualised relapse rate (defined as the number of confirmed relapses) at 24 month period A relapse was confirmed when it was accompanied by an increase of at least half a point on EDSS score, an increase of 1‐point in 2 different functional systems, or 2‐points in 1 functional system (excluding bowel, bladder, or cerebral functional systems) The clinical secondary objectives were as follows. 1. Time to disability progression confirmed at 3 months 2. Time to disability progression confirmed at 6 months Progression was defined as 1‐point EDSS change or 0.5‐point if baseline EDSS was > 5.0 3. Safety and tolerability 4. Time to first relapse 5. Proportion of relapse‐free patients 6. Change from baseline to the end of study on the MSFC score 7. Quality of life using the EQ‐5D and Patient Reported Indices in Multiple Sclerosis (PRIMUS) 8. Fatigue using the Modified Fatigue Impact Scale (MFIS) The MRI secondary objectives were: 1. Percent brain‐volume change from baseline at 24 months 2. Number and volume of gadolinium‐enhancing T1 lesions 3. Number of new or newly enlarged T2 lesions 4. Proportion of participants free of gadolinium‐enhancing T1 lesions 5. Proportion of participants free of new or newly enlarged T2 lesions 6. Proportion of participants free of new inflammatory activity (no gadolinium‐enhancing T1 lesions and no new or newly enlarged T2 lesions) 7. Percentage change from baseline in volume of gadolinium‐enhancing T1 lesions 8. Percentage change from baseline in volume of new or newly enlarged T2 lesions 9. Percentage change from baseline in brain volume | |
| Notes | The trial was registered with clinicaltrials.gov, number NCT00355134 The study was sponsored by Novartis Pharma | |
| Risk of bias | ||
| Bias | Authors' judgement | Support for judgement |
| Random sequence generation (selection bias) | Low risk | "randomly allocated patients (1:1:1; stratified by study centre). The randomisation sequence was generated with an automated system" pg 546 |
| Allocation concealment (selection bias) | Unclear risk | "the randomisation sequence was generated with an automated system" under the supervision of the Novartis Drug Supply Management team" pg 546 |
| Blinding of participants and personnel (performance bias) | Low risk | "both Fingolimod and placebo were dispensed in hard gelatin capsules of identical colour and size and packed in identical bottles" pg 546 |
| Blinding of outcome assessment (detection bias) | Low risk | "The efficacy assessments (i.e., confirmation of relapses, scheduled EDSS, and Multiple Sclerosis Functional Composite [MSFC] were done by an independent, specially trained, and certified assessor not otherwise involved in the treatment of patient"."In order to maintain the blind, efficacy assessments (i.e., scheduled EDSS and confirmation of relapses) were performed by an independent evaluating physician, not involved with any other aspects of subject care and management. Patients were instructed not to discuss adverse events with the independent evaluating physician" (Supplementary web appendix) |
| Incomplete outcome data (attrition bias) | High risk | Overall, 28.2% (305/1083) discontinued the study [32.2% (119/370) in fingolimod 1.25 mg, 24.0% (86/358) in fingolimod 0.5 mg, and 28.2% (100/ 355) in placebo], with some significant differences in reasons: unsatisfactory therapeutic effect (2.7% in fingolimod 1.25 mg, 1.7% in fingolimod 0.5 mg, and 4.8% in placebo) and adverse events or abnormal laboratory values (12.7% in fingolimod 1.25 mg, 10.1% in fingolimod 0.5 mg, and 5.1% in placebo) |
| Selective reporting (reporting bias) | Unclear risk | Differences between study design described in the article (protocol not available) and reported findings were not found. After 9 months from enrolment conclusion, participants treated with 1.25 mg were shifted to 0.5 mg. The number of participants shifted to 0.5 mg and the treatment duration were unknown |
| Other bias | High risk | The study was sponsored by Novartis Pharma, "The study sponsor participated in the design of the study, conduct of the study, data collection, data management, data analysis and interpretation, and preparation, review, and approval of the paper" pg 550, and four co‐authors of the published paper were affiliated to the pharmaceutical company |
| Methods | Randomised, double‐blind, 3 parallel group phase III trial Multicentre (172 centres) performed in 18 countries (Argentina, Australia, Austria, Belgium, Brazil, Canada, Egypt, France, Germany, Greece, Hungary, Italy, Republic of Korea, Portugal, Spain, Switzerland, UK, USA). Duration: 12 months Enrollment: from May 2006 to September 2007 Acronym: TRANSFORMS | |
| Participants | 1292 participants with RRMS Inclusion criteria: 1. 18 to 55 years of age 2. Relapsing‐remitting course 3. At least 1 documented relapse in the previous year or at least 2 documented relapses in the previous 2 years 4. EDSS score between 0 to 5.5 Exclusion criteria: 1. A documented relapse or corticosteroid treatment within 30 days before randomisation 2. Active infection 3. Macular edema 4. Immune‐suppression (either drug‐ or disease‐induced) 5. Clinically significant coexisting systemic disease Previous disease‐modifying therapy was not considered an exclusion criteria. The percentage of previously treated participants was 56.7%, in details 56.3% in interferon beta‐1a group, 55.2% in fingolimod 0.5 mg and 58.5% in fingolimod 1.25 mg. Most of them were treated with any interferon beta. Glatiramer acetate was previously administered in 15.7%, 13.1% and 15.4%, and natalizumab in 0.2%, 0.9% and 0.7% respectively | |
| Interventions | Participants were randomly allocated to one of the three groups: 1. Fingolimod 1.25 mg orally once‐daily (426 participants) 2. Fingolimod 0.5 mg orally once‐daily (431 participants) 3. Interferon beta‐1a 30 ug intramuscularly once a week (435 participants) | |
| Outcomes | Primary endpoint was the annualised relapse rate (defined as the number of confirmed relapses) at 12‐month period Relapse was defined as new, worsening, or recurrent neurologic symptoms that occurred at least 30 days after the onset of a preceding relapse, that lasted at least 24 hours without fever or infection, and that were accompanied by an increase of at least half a point on EDSS or an increase of at least 1‐point in 2 functional systems scores or of at least 2‐points in 1 functional system score (excluding changes in bowel or bladder function and cognition) Secondary endpoints: 1. Number of new or enlarged lesions on T2‐weighted MRI scans at 12 months 2. Time to confirmed disability progression Progression of disability was defined as a 1‐point increase in EDSS score (or a half point increase for participants with a baseline score 5.5) that was confirmed 3 months later in the absence of relapse | |
| Notes | The trial was registered with clinicaltrials.gov, number: NCT00340834 The study was sponsored by Novartis Pharma | |
| Risk of bias | ||
| Bias | Authors' judgement | Support for judgement |
| Random sequence generation (selection bias) | Low risk | "Randomisation was performed in blocks of six within each site and was stratified according to site" pg 403 |
| Allocation concealment (selection bias) | Low risk | "Randomisation was performed centrally" and "Study‐group assignments were performed with the use of an interactive voice‐response system" pg 403 |
| Blinding of participants and personnel (performance bias) | Low risk | "During the trial, patients, study personnel, steering‐committee members, and the study statistician were unaware of study‐group assignments and leukocyte counts. Capsules, syringes, and packaging materials for active and placebo treatments were indistinguishable" pg 404 |
| Blinding of outcome assessment (detection bias) | Low risk | "At each site, a treating neurologist supervised medical management", "Patients were instructed to cover injection sites at visits, to not to discuss adverse events with clinical evaluators", and "Potential relapses triggered an unscheduled visit and were confirmed by the treating neurologist on the basis of blinded examination by the examining neurologist" pg 403‐404 MRI evaluators were unaware of study group assignment and leukocyte counts. An independent data and safety monitoring board evaluated overall safety in the fingolimod phase 3 program |
| Incomplete outcome data (attrition bias) | Low risk | Overall, 10.8% (139/1292) discontinued the study [13.4% (57/426) in fingolimod 1.25 mg, 7.7% (33/43) in fingolimod 0.5 mg, and 11.3% (49/435) in interferon beta‐1a)], with some non‐significant differences in reasons: unsatisfactory therapeutic effect (0.7% in fingolimod 1.25 mg, 0.7% in fingolimod 0.5 mg, and 1.6% in interferon beta‐1a) adverse events (6.1% in fingolimod 1.25 mg, 2.1% in fingolimod 0.5 mg, and 2.1% in interferon beta‐1a) and abnormal laboratory values (0.9% in fingolimod 1.25 mg, 1.4% in fingolimod 0.5 mg, and 0.2% in interferon beta‐1a) |
| Selective reporting (reporting bias) | Low risk | Additional MRI data from the key endpoints were reported (protocol not available) |
| Other bias | High risk | The study was sponsored by Novartis Pharma, "data were analysed by the sponsor" pg 403, and five co‐authors of the published paper were affiliated to the pharmaceutical company |
| Methods | Randomised active comparator, parallel group, open‐label, phase IV trial Duration: 6 months Enrollment: between August 2010 and August 2012. Acronymus: EPOC | |
| Participants | 1053 participants with RRMS Inclusion criteria 1. 18 to 65 years of age 2. Diagnosis of relapsing MS in accordance with the 2005 McDonald criteria (Polman 2005) 3. EDSS score between 0 to 5.5 4. Treated with an injectable (DMD for at least 6 months before screening 5. Participants must be candidates for a change in therapy as determined by the treating physician 6. Treatment‐naïve to fingolimod Exclusion criteria 1. History of chronic disease of the immune system (except for MS) 2. Immunodeficiency 3. Malignancy other than localized basal cell carcinoma within the past 5 years 4. Cardiac arrest, myocardial infarction, ischaemic heart disease, or coronary spasm within 6 months 5. Mobitz type II second‐degree heart block, third‐degree atrioventricular block, or an increased QTc interval (4470 ms) 6. Uncontrolled diabetes mellitus (glycated haemoglobin > 7%) 7. Bone marrow transplant 8. Alcohol abuse within the past 5 years 9. Macular edema present at screening 10. Negative test for varicella zoster immunoglobulin G antibodies 11. Positive tests for hepatitis B, hepatitis C, or HIV 12. Active systemic bacterial, viral or fungal infections, tuberculosis 13. Pregnancy 14. Uncontrolled or poorly controlled cardiovascular and pulmonary disorders (hypertension or asthma; cardiac failure; severe respiratory disease or pulmonary fibrosis) 15. Chronic liver or biliary disease 16. Previous treatment with immunosuppressants, immunoglobulins, or monoclonal antibodies within 6 months before screening; any live or live attenuated vaccines within 1 month before screening; cladribine, cyclophosphamide, or mitoxantrone at any time; and class Ia or class III antiarrhythmic drugs at time of screening Participants randomly assigned to treatment with fingolimod changed from their pre‐randomisation DMD with no washout | |
| Interventions | Participants were randomly allocated to one of the two groups: 1. Fingolimod 0.5 mg orally once‐daily (790 participants) 2. DMD (263 participants): interferon beta 1‐b (Extavia® or Betaseron®) 0.25 mg injected subcutaneously every other day (46 participants); interferon beta 1‐a (Avonex®)30 μg intramuscular injected once a week (60 participants); interferon beta‐1a (Rebif®) 22 μg or 44 μg injected subcutaneously three times a week (65 participants); or glatiramer acetate (Copaxone®) 20 mg injected subcutaneously once‐daily (92 participants) | |
| Outcomes | Primary endpoint was to evaluate differences in satisfaction as measured by the Global Satisfaction subscale score on the Treatment Satisfaction Questionnaire for Medication (Atkinson 2004) Secondary objectives were 1, Effectiveness 2. Side effects 3. Fatigue 4. Depression 5. Activities of daily living 6. Health‐related QOL measured using the 36‐item Short‐Form Health Survey v2 (SF‐36 v2) (Jenkinson 1999) | |
| Notes | The trial was registered with clinicaltrials.gov, number: NCT01216072 Four co‐authors of the published paper were affiliated to the pharmaceutical company (Novartis) | |
| Risk of bias | ||
| Bias | Authors' judgement | Support for judgement |
| Random sequence generation (selection bias) | Low risk | "Patients were randomised using an interactive voice response system (IVRS) to either the once‐daily fingolimod (FTY720; GilenyaTM, Novartis Pharma AG, Basel, Switzerland) 0.5 mg arm or the injectable DMT arm, in a 3:1 ratio. A patient randomisation list was produced by an interactive voice response system using a validated system that automated the random assignment of patient numbers to the different treatment arms" pg 5 |
| Allocation concealment (selection bias) | Low risk | "A patient randomisation list was produced by the IVRS using a validated system that automated the random assignment of patient numbers to the different treatment arms" |
| Blinding of participants and personnel (performance bias) | High risk | "Fingolimod capsules (0.5 mg) were supplied, packaged, and labelled in accordance with the US Code of Federal Regulations governing the handling of investigational treatments. The capsules were dispensed by the study physician and supplied by Novartis Drug Supply Management. Patients randomised to the DMT group could choose to either remain on the same therapy" |
| Blinding of outcome assessment (detection bias) | High risk | The study was open‐ label |
| Incomplete outcome data (attrition bias) | High risk | Overall, 10.4% (110/1053) discontinued the study (9.6% ‐ 76/790 ‐ in fingolimod 0.5 mg, and 12.9% ‐ 34/263 ‐ in DMD), with some significant differences in reasons: unsatisfactory therapeutic effect (0.4% in fingolimod 0.5 mg, and 1.5% in DMD), adverse events (5.3% in fingolimod 0.5 mg, and 1.5% in DMD group) |
| Selective reporting (reporting bias) | Low risk | Inclusion and exclusion criteria were detailed in the protocol Cascione 2013 and summarised in the published primary study (Fox 2014). Missing data (SD of QOL values) request to the Authors (12 March 2015) were not provided |
| Other bias | High risk | The study was sponsored by Novartis Pharma, and 4 co‐authors of the published paper were affiliated to the pharmaceutical company. The criteria for changing treatment were undefined " Participants must be candidates for a change in therapy as determined by the treating physician. Participants randomised to the DMD group could have choose to either remain on the same therapy or, following a consultation with a physician, switch immediately to another approved DMD " |
| Methods | Randomised, double‐blind, 3 parallel groups double‐dummy phase II (proof of concept) trial Multicentre (32 centres) performed in Canada and in 10 European countries (Denmark, Finland, France, Germany, Italy, Poland, Portugal, Spain, Switzerland, UK Duration: 6 months Enrollment: from May 2003 to April 2004 Acronym: FTY720 D2201 | |
| Participants | 281 patients with MS, 246 with RRMS and 31 with SPMS Inclusion criteria: 1. Age 18‐60 years 2. Diagnosis of relapsing multiple sclerosis (Mc Donald 2001) 3. At least one of the following: two or more documented relapses during the previous 2 years, one or more documented relapses in the year before enrolment, and one or more gadolinium‐enhancing lesions detected on magnetic resonance imaging (MRI) at screening. 4. EDSS score between 0 to 6 5. Neurologically stable condition, with no evidence of relapse for at least 30 days before screening and during the screening and baseline phases Exclusion criteria: 1. Use of corticosteroids (within the previous 30 days) 2. Immunomodulatory therapy (within the previous 3 months) 3. Immunosuppressive treatment (azathioprine or methotrexate within 6 months, cyclophosphamide within 12 months, or mitoxantrone or cladribine within 24 months) 4. History of cardiac conditions that might increase the risk of a decrease in heart rate 5. White‐cell count less than 3500 per cubic millimetre 6. Lymphocyte count of less than 800 per cubic millimetre | |
| Interventions | Participants were randomly allocated to one of the three groups: 1. Fingolimod 5.0 mg orally once‐ daily (94 patients) 2. Fingolimod 1.25 mg orally once‐ daily (94 patients) 3. Placebo orally once‐ daily (93 patients) | |
| Outcomes | Primary endpoint was the total number of gadolinium‐enhancing lesions per patient recorded on T1‐weighted MRI at monthly intervals for 6 months. The clinical secondary objectives were: 1.Number of participants remaining free of relapse 2. Annualised relapse rate 3. Time to the first relapse Confirmed relapse was defined as the occurrence of new symptoms or worsening of previously stable or improving symptoms and signs not associated with fever, lasting more than 24 hours and accompanied by an increase of at least half a point in EDSS score or 1‐point in the score for at least 1 of the functional system (excluding the bowel and bladder and mental systems) The MRI secondary objectives were: 1. Total volume of gadolinium‐enhancing lesions per patient 2. Proportion of participants with gadolinium‐enhancing lesions 3. Total number of new lesion per patient on T‐weighted images 4. Changes in lesion volume on T2‐weighted images 5. Brain volume from baseline to month 6 | |
| Notes | The study was sponsored by Novartis Pharma The trial was registered with clinicaltrials.gov,numbers: NCT00333138 (for core study) and NCT00235430 (for the extension) After the core study, participants could continue in the extension study; participants who had received active treatment in the core study continued with the same dose, and those who had received placebo were randomly assigned to receive 1.25 or 5.0 mg of fingolimod. The results have been reported for 227 out of 281 (81%) at 1 year (Kappos 2006), for 189 (67%) at 2 (O'Connor 2009), for 173 (62%) at 3 (Comi 2010), for 140 (49.8%) at 5 (Izquierdo 2013; Montalban 2011b,) for 122 (43.4%) at 7 years (Antel 2012; Montalban 2012) | |
| Risk of bias | ||
| Bias | Authors' judgement | Support for judgement |
| Random sequence generation (selection bias) | Low risk | "In the core study, patients were randomly assigned, in a 1:1:1 ratio, to 1.25 mg of fingolimod, 5.0 mg of fingolimod, or a matching placebo once daily" pg 1125 |
| Allocation concealment (selection bias) | Low risk | "Randomisation was stratified according to disease course (relapsing–remitting or secondary progressive) with the use of a centralized automated system that provided randomised packages of the study drug to each centre" pg 1125 |
| Blinding of participants and personnel (performance bias) | Low risk | "All drugs were given as identical capsules" and "The medication was prepackaged on the basis of a block size of 3; this information was not disclosed to investigators and monitors" pg 1125 and " Laboratory values that might have revealed the treatment assignment (e.g., lymphocyte counts) were not disclosed to treating physicians unless they exceeded prespecified safety limits" pg 1126 |
| Blinding of outcome assessment (detection bias) | Low risk | Information about participants assignments was not disclosed to investigators and monitors, "Relapses were confirmed by the treating physician on the basis of an examination by the EDSS rater who was not otherwise involved in patient care. When warranted, relapses were managed by the treating physician according to a standardized scheme" and "Neurologic assessments were performed by specially trained, independent neurologists who were unaware of the treatment assignments, were not involved in the everyday care of the patients, and had no access to their medical records" pg 1126 |
| Incomplete outcome data (attrition bias) | Low risk | Overall, 1.4% (4/281) discontinued the study [2.1% (2/94) in fingolimod 5.0 mg, 1.1% (1/94) in fingolimod 1.25 mg, and 1.1% (1/93) in placebo] pg 1128 Reasons for lost‐to follow up were not reported |
| Selective reporting (reporting bias) | Low risk | Quality of life assessment was not registered either among the study endpoints of the published RCT or in the study registration at the clinicaltrials.gov. The data have been published Montalban 2011a |
| Other bias | Low risk | The study was supported by Novartis Pharma, Basel, Switzerland. There are no potential risks for other biases. The steering‐committee members and the sponsors designed the study. The authors had access to all data. An independent external data and safety monitoring board evaluated adverse events and other safety data as well as clinical and MRI efficacy data |
| Methods | Randomised, double‐blind, 3 parallel group placebo controlled phase III trial Multicentre (138 centres) performed in 22 countries (Australia, Belgium, Canada, Czech Republic, Estonia, Finland, France, Germany, Greece, Hungary, Ireland, Israel, Netherlands, Poland, Romania, Russia, Slovakia, South Africa, Sweden, Switzerland, Turkey, UK) Duration: 2 years Enrollment: from January 2006 to August 2007 Acronym: FREEDOMS | |
| Participants | 1272 participants with RRMS Inclusion criteria: 1. 18 to 55 years of age 2. Diagnosis of multiple sclerosis, according to the revised McDonald criteria (Polman 2005) 3. Relapsing–remitting course 4. One or more documented relapses in the previous year or two or more in the previous 2 years 5. EDSS score between 0 to 5.5 Exclusion criteria: 1. Relapse or corticosteroid treatment within 30 days before randomisation 2. Active infection 3. Macular edema 4. Diabetes mellitus 5. Immune suppression (drug‐ or disease‐induced) 6. Clinically significant systemic disease 7. Interferon beta or glatiramer acetate therapy within 3 months | |
| Interventions | Participants were randomly allocated to one of the three groups: 1. Fingolimod 0.5 mg orally once‐daily (425) 2. Fingolimod 1.25 mg orally once‐daily (429) 3. Placebo orally once‐daily (418) | |
| Outcomes | Primary endpoint was the annualised relapse rate (defined as the number of confirmed relapses per year) To constitute a confirmed relapse, the symptoms must have been accompanied by an increase of at least half a point in the EDSS score, of 1 point in each of 2 EDSS functional system scores, or of 2 points in 1 EDSS functional‐system score (excluding scores for the bowel–bladder or cerebral functional systems) The clinical secondary objectives were: 1. Time to the first relapse 2. Time to confirmed disability progression confirmed at 3 months 3. Time to confirmed disability progression confirmed at 6 months Time to confirmed disability progression was defined as an increase of 1‐point in the EDSS score (or half a point if the baseline EDSS score was equal to 5.5), confirmed after 3 months, with an absence of relapse at the time of assessment and with all EDSS scores measured during that time 4. Changes in the EDSS score and MSFC z score between baseline and 24 months 5. Safety and tolerability The MRI secondary objectives were: 1. Number of gadolinium‐enhancing lesions 2. Proportion of participants free from gadolinium‐enhancing lesions 3. Number of new or enlarged lesions on T2‐weighted MRI scans 4. Proportion of participants free from new or enlarged lesions on T2‐weighted scans 5. Volume of hyperintense lesions on T2‐weighted scans 6. Volume of hypointense lesions on T1‐weighted scans 7. Change in brain volume between baseline and 24 months | |
| Notes | The trial was registered with clinicaltrials.gov number: NCT00289978 The study was sponsored by Novartis Pharma | |
| Risk of bias | ||
| Bias | Authors' judgement | Support for judgement |
| Random sequence generation (selection bias) | Low risk | "Randomization was performed centrally with the use of stratification according to site, with a block size of six within each site" pg 388 |
| Allocation concealment (selection bias) | Low risk | " Patients were randomly assigned, in a 1:1:1 ratio, to receive oral fingolimod capsules in a dose of 0.5 mg or 1.25 mg or matching placebo. Randomisation was performed centrally, with the use of a validated system and stratification according to site, with a block size of six within each site" pg 388 |
| Blinding of participants and personnel (performance bias) | Low risk | "Double blind" (pg 388) procedure and methods "to ensure that all assessments remained unbiased regarding the study‐group assignments (i.e., unaffected by awareness of them) were adopted pg 388 |
| Blinding of outcome assessment (detection bias) | Low risk | "To ensure that all assessments remained unbiased regarding the study‐group assignments (i.e., unaffected by awareness of them), an independent examining neurologist determined all the EDSS scores , this examining neurologist or a trained technician administered the Multiple Sclerosis Functional Composite pg 388. Another independent physician monitored patients for 6 or more hours after administration of the first dose of the study drug pg 389. Relapses were verified by the examining neurologist within 7 days after the onset of symptoms" MRI scans were analysed at a central MRI evaluation centre by radiologists who were unaware of the study group assignments and an independent data and safety monitoring board evaluated the safety and overall benefit–risk profiles |
| Incomplete outcome data (attrition bias) | High risk | Overall, 18.7% (238/1272) discontinued the study [22.4% (96/429) in fingolimod 1.25 mg, 13.2% (56/425) in fingolimod 0.5 mg, and 20.6% (86/418) in placebo], with some significant differences in reasons: unsatisfactory therapeutic effect (3.0% in fingolimod 1.25 mg, 1.4% in fingolimod 0.5 mg, and 6.0% in placebo) and abnormal laboratory values (4.7% in fingolimod 1.25 mg, 2.1% in fingolimod 0.5 mg, and 0.2% in placebo) |
| Selective reporting (reporting bias) | Low risk | Differences between study design described in the article (protocol not available) and reported findings were not found |
| Other bias | High risk | The study was sponsored by Novartis Pharma, "data were analysed by the sponsor" pg 388, and 4 co‐authors of the published paper were affiliated to the pharmaceutical company |
| Methods | Randomised, double‐blind, parallel group phase II trial Multicentre (43 centres) performed in Japan Duration: 6 months Enrollment: from October 2007 to February 2010 Acronym: none | |
| Participants | 171 Japanese participants with MS, 167 with RRMS and 4 with SPMS Inclusion criteria: 1. 18–60 years of age 2. Diagnosis of MS according to the revised McDonald criteria (Polman 2005) 3. Relapsing course of the disease (relapsing–remitting or secondary progressive) 4. One or more relapses in the previous year or 2 or more relapses in the previous two years or at least one gadolinium enhanced T1‐weighted brain lesion within the 30 days prior to study commencement 5. EDSS score between 0 to 6 6. At least one T2‐weighted brain lesion Exclusion criteria 1. Long cord lesions of at least three vertebral segments on spinal MRI 2. Primary progressive MS 3. Relapse or corticosteroid treatment within 30 days before randomisation 4. Malignancy 5. Macular oedema 6. Diabetes mellitus 7. Active infection 8. Clinically significant systemic disease 9. Pregnancy 10. Received cladribine, cyclophosphamide, mitoxantrone, or other immunosuppressive or immunoglobulin medication in the six months prior to randomisation, or who had had plasmapheresis immunoadsorption or interferon beta therapy in the three months prior to randomisation 11. History of cardiac disorder including arrhythmia 12. Pulmonary condition including asthma 13. Leukopenia less than 3500 cell/mm3 or lymphocyte count of less than 800 14. Abnormal liver enzyme 15. Negative for varicella zoster at screening 16. Received any live or live attenuated vaccines | |
| Interventions | Participants were randomly allocated to one of the three groups: 1. Fingolimod 0.5 mg orally once‐daily (57) 2. Fingolimod 1.25 mg orally once‐daily (57) 3. Placebo orally once‐daily (57) Relapses were treated with methylprednisolone up to 1000 mg/day for 3–5 days without an oral taper | |
| Outcomes | Primary endpoint was the percentage of participants free from gadolinium‐enhancing lesions at 3 and 6 months Secondary endpoints were 1. Percentage of participants free from relapses over six months 2. Safety measures Confirmed relapse was defined as new, worsening, or recurrent neurological symptoms that occurred at least 30 days after the onset of a preceding relapse, lasted at least 24 hours without fever or infection and were accompanied by an increase of at least half a point in EDSS score or an increase of at least 1‐point in 2 functional systems scores or of at least 2‐points in 1 functional system (excluding changes in bowel‐bladder function and cognition) | |
| Notes | The trial was registered with clinicaltrials.gov number: NCT00537082 The work was supported by Novartis Pharma KK and Mitsubishi Tanabe Pharma Corp., Tokyo, Japan | |
| Risk of bias | ||
| Bias | Authors' judgement | Support for judgement |
| Random sequence generation (selection bias) | Low risk | "Patients were randomly assigned, in a 1:1:1 ratio, to receive once‐daily fingolimod capsules, 0.5 mg or 1.25 mg, or matching placebo for six months" pg 2 |
| Allocation concealment (selection bias) | Low risk | Randomisation was performed by a central centre (Bellsystem 24 Inc., Tokyo), with the use of a validated system that assigned randomisation numbers to participants and automated the dynamic allocation of treatment arms to randomisation numbers. |
| Blinding of participants and personnel (performance bias) | Low risk | The identity of treatments was concealed by the use of study drugs that were identical in appearance, packaging, labelling and schedule of administration. "Patients, investigators, site personnel, first‐dose administrators remained blinded during the six‐month core study" pg 2 |
| Blinding of outcome assessment (detection bias) | Low risk | "MRI evaluators and data analysts remained blinded during the six‐month core study" pg 2 |
| Incomplete outcome data (attrition bias) | Low risk | Overall, 14.0% (24/171) discontinued the study [15.8% (9/57) in fingolimod 1.25 mg, 15.8% (9/57) in fingolimod 0.5 mg, and 10.5% (6/57) in placebo] with some non‐significant differences in reasons: adverse events (10.5% in fingolimod 1.25 mg, 10.5% in fingolimod 0.5 mg, and 5.3% in placebo) unsatisfactory therapeutic effect (0% in fingolimod 1.25 mg, 0% in fingolimod 0.5 mg, and 3.5% in placebo) |
| Selective reporting (reporting bias) | Low risk | All relevant study endpoints were reported. Protocol was not available |
| Other bias | Low risk | The study was sponsored by Novartis Pharma, and 3 co‐authors of the published paper were affiliated to the pharmaceutical company. The inclusion criteria of participants are unclear (number at least one T2‐weighted brain lesion and diagnosis according to Polman 2005) |
DMD: disease‐modifying drug; EDSS: Expanded Disability Status Scale; EQ‐5D; Euro quality of life scale; IgG: immunoglobulin G; MRI: magnetic resonance imaging; MS: multiple sclerosis; MSFC: Multiple Sclerosis Functional Composite; RRMS: relapsing‐remitting multiple sclerosis; SPMS: secondary progressive multiple sclerosis
Characteristics of excluded studies [ordered by study ID]
| Study | Reason for exclusion |
| Type of participants: RCT evaluating the effect of fingolimod on pulmonary function in otherwise healthy people with moderate asthma | |
| Pooled data of RCTs: subgroup analysis on Hispanic population | |
| Design: not randomised study (FIRST study) | |
| Pooled data of RCTs on safety: relationship between lymphocyte counts and infections | |
| Design: not randomised study on cardiac safety | |
| Type of participants: RCT evaluating acute optic neuritis | |
| Design: not randomised study on people with relapsing‐remitting MS during the first year after switching from natalizumab to fingolimod | |
| Pooled data of RCTs on safety | |
| Pooled data of RCTs: subgroup analysis on participants previously treated with glatiramer acetate | |
| Type of intervention: RCT evaluating immune response to influenza vaccine administered to people with MS treated with fingolimod or placebo | |
| Design: cross‐over study evaluating the optimal timing for initiating fingolimod therapy following natalizumab discontinuation in RRMS. After baseline infusion of Natalizumab, patients were subsequently randomised to one of three treatment groups: a) 8‐week washout (8 weeks no treatment) followed by 24 weeks of treatment with fingolimod, b) 12‐week washout (8 weeks no treatment and 4 weeks placebo) followed by 20 weeks of treatment with fingolimod, or c) 16‐week washout (8 weeks no treatment and 8 weeks placebo) followed by 16 weeks of treatment with fingolimod | |
| Overview of studies reporting outcomes of pregnancies that occurred during fingolimod treatment | |
| Design: not randomised study on safety of the first dose of fingolimod in people with MS | |
| Design: not randomised study of the cardiac safety profile of the initiation of fingolimod treatment (START study) | |
| Type of participants: primary progressive MS (INFORMS study) | |
| Design: not randomised study on ophthalmic findings (macular volume) in people with MS | |
| Design: not randomised study | |
| Pooled data of RCTs on disease outcome after fingolimod discontinuation | |
| Overview reporting ophthalmic outcomes of people with MS receiving fingolimod |
MS: multiple sclerosis; RCT: randomised controlled trial
Characteristics of studies awaiting assessment [ordered by study ID]
| Methods | Randomised study evaluating the change in patient‐reported treatment satisfaction after 6 months of treatment with fingolimod 0.5 mg/day versus DMD standard of care, using the global satisfaction subscale of the Treatment Satisfaction Questionnaire for Medication (TSQM‐9) |
| Participants | RRMS |
| Interventions | Experimental: fingolimod Active comparator: standard therapy |
| Outcomes | Primary outcome measure: change in patient‐reported treatment satisfaction |
| Notes | This study has been completed (June 2014). Partial results on 61 patients of the EPOC study have been reported in the site clinicaltrials.gov (accessed 22 February 2016) |
| Methods | An 18‐month, open‐label, rater‐blinded, randomised, multicentre, active‐controlled, parallel group pilot study to assess efficacy and safety of fingolimod in comparison to interferon beta‐1b in treating the cognitive symptoms associated to RRMS and to assess possible relationship of these effects to regional brain atrophy |
| Participants | RRMS |
| Interventions | Experimental: fingolimod Active comparator: interferon beta‐1b |
| Outcomes | Cognitive dysfunction progression |
| Notes | The study has been completed (September 2015) (accessed 22 February 2016) |
| Methods | Phase IV, 6‐month, randomised, active comparator, open‐label, multicentre study to evaluate patient outcomes, safety and tolerability of fingolimod 0.5 mg/day in patients with relapsing‐remitting multiple sclerosis who are candidates for MS therapy change from previous DMD |
| Participants | RRMS |
| Interventions | Experimental: fingolimod Active comparator: standard DMD |
| Outcomes | Primary outcome measure: change in patient‐reported treatment satisfaction |
| Notes | This study has been completed (June 2013) and partial results on 298 participants of the EPOC study comparing fingolimod versus Interferon beta‐1a and glatiramer acetate have been reported in the site clinicaltrials.gov (accessed 22 February 2016) |
| Methods | Evaluation of patient retention of fingolimod versus currently approved DMD in patients with RRMS (PREFERMS). A 12‐month study where 1000 participants with RRMS will be randomised 1:1 to fingolimod or approved DMD. Participants will be in early stages of the disease and be treatment‐naive or have only been treated with one class of DMD (Interferon beta or glatiramer acetate) for no more than 5 years total exposure |
| Participants | RRMS |
| Interventions | Experimental: fingolimod Active comparator: disease modifying therapy |
| Outcomes | Primary outcome measures: retention on treatment |
| Notes | The study has been completed (August 2015) (accessed 22 February 2016) |
DMD: disease‐modifying drugs; MS: multiple sclerosis; RRMS: relapsing‐remitting multiple sclerosis;
Characteristics of ongoing studies [ordered by study ID]
| Trial name or title | A multicenter, randomised, open‐label study to assess the impact of natalizumab versus fingolimod on central nervous system tissue damage and recovery in active relapsing‐remitting multiple sclerosis subjects |
| Methods | Multicentre, randomised, open‐label study |
| Participants | Relapsing‐Remitting multiple sclerosis (RRMS) |
| Interventions | Experimental: fingolimod Active comparator: natalizumab |
| Outcomes | The effect of natalizumab compared to fingolimod on the evolution of |
| Starting date | 10 November 2014 |
| Contact information | |
| Notes | Authorised‐recruitment may be ongoing or finished (EUCTR) (access 6 August 2015) |
| Trial name or title | MS study evaluating safety and efficacy of two doses of fingolimod versus Copaxone |
| Methods | 12‐month, randomised, rater‐ and dose‐blinded study to compare the efficacy and safety of fingolimod 0.25 mg and 0.5 mg administered orally once‐daily with glatiramer acetate 20 mg administered subcutaneously once‐daily in patients with RRMS |
| Participants | RRMS |
| Interventions | Experimental: fingolimod Active comparator: glatiramer acetate |
| Outcomes | Primary outcome measure annualised relapse rate up to 12 months |
| Starting date | August 2012 |
| Contact information | Novartis Pharmaceuticals |
| Notes | This study is currently recruiting participants |
| Trial name or title | Two‐year, double‐blind, randomised multicenter, active‐controlled study to evaluate safety and efficacy of oral fingolimod versus intramuscular Interferon beta‐1a in paediatric patients with multiple sclerosis |
| Methods | Randomised controlled study |
| Participants | Paediatric patients with MS |
| Interventions | Oral fingolimod versus intramuscular Interferon beta‐1a |
| Outcomes | Primary outcome measure: frequency of relapses in patients treated for up to 24 months |
| Starting date | July 2013 |
| Contact information | Contact: Novartis Pharmaceuticals |
| Notes | This study is currently recruiting participants |
| Trial name or title | Computerised exercise training for cognitive remediation in adults with multiple sclerosis treated with Gilenya |
| Methods | RCT investigating the efficacy of computer‐based cognitive exercises as a means of cognitive remediation in patients with MS who are beginning Gileyna |
| Participants | MS |
| Interventions | Experimental: PACR program: plasticity based, adaptive cognitive remediation Active Comparator: Ordinary Computer Games |
| Outcomes | Primary outcome measure: change from baseline in neuropsychological test results at 12 weeks |
| Starting date | August 2013 |
| Contact information | Lauren Krupp, Stony Brook University |
| Notes | This study is ongoing, but not recruiting participants |
| Trial name or title | Long‐term follow‐up at 10 years of patients enrolled in the fingolimod phase II program in relapsing multiple sclerosis |
| Methods | Observational: to collect follow‐up data on patients who were randomised and received one dose of study drug (fingolimod) |
| Participants | RRMS |
| Interventions | None |
| Outcomes | Change from baseline in Expanded Disability Status Scale at 10 years |
| Starting date | June 2014 |
| Contact information | Novartis Pharmaceuticals |
| Notes | This study is currently recruiting participants |
| Trial name or title | The impact of natalizumab versus fingolimod on central nervous system tissue damage and recovery in active RRMS subjects (REVEAL) |
| Methods | To assess the effect of natalizumab compared to fingolimod on the evolution of new on‐treatment T1‐gadolinium‐enhancing (Gd+) lesions to persistent black holes over 52 weeks |
| Participants | RRMS |
| Interventions | Experimental: natalizumab Active Comparator: fingolimod |
| Outcomes | Cumulative number of ≥ 6‐months confirmed T1‐hypointense lesions arising from new on‐treatment T1 Gd+ |
| Starting date | November 2014 |
| Contact information | Contact: Biogen Idec |
| Notes | This study is currently recruiting participants |
MS: multiple sclerosis; RCT: randomised controlled trial; RRMS: relapsing‐remitting multiple sclerosis;
Data and analyses
| Outcome or subgroup title | No. of studies | No. of participants | Statistical method | Effect size |
| 1 At 6 months Show forest plot | 2 | Risk Ratio (M‐H, Random, 95% CI) | Subtotals only | |
| Analysis 1.1 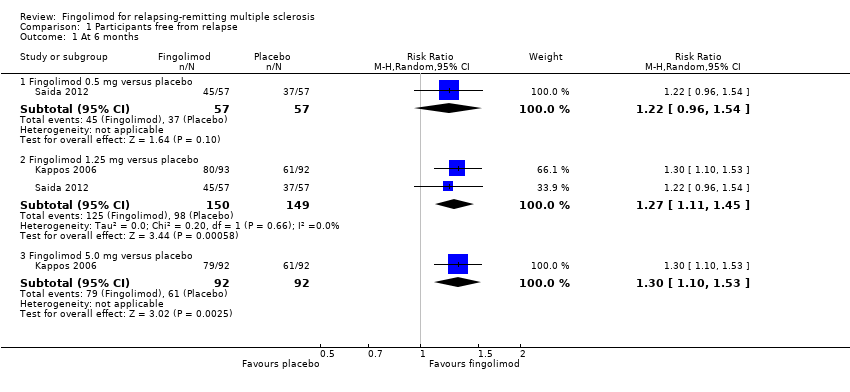 Comparison 1 Participants free from relapse, Outcome 1 At 6 months. | ||||
| 1.1 Fingolimod 0.5 mg versus placebo | 1 | 114 | Risk Ratio (M‐H, Random, 95% CI) | 1.22 [0.96, 1.54] |
| 1.2 Fingolimod 1.25 mg versus placebo | 2 | 299 | Risk Ratio (M‐H, Random, 95% CI) | 1.27 [1.11, 1.45] |
| 1.3 Fingolimod 5.0 mg versus placebo | 1 | 184 | Risk Ratio (M‐H, Random, 95% CI) | 1.30 [1.10, 1.53] |
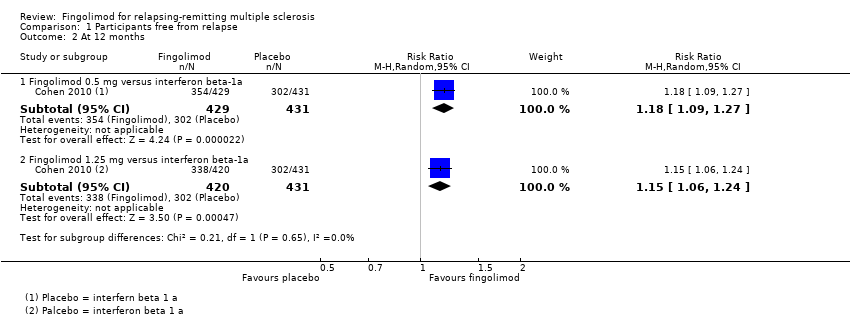
| 2 At 12 months Show forest plot | 1 | Risk Ratio (M‐H, Random, 95% CI) | Subtotals only | |
| Analysis 1.2  Comparison 1 Participants free from relapse, Outcome 2 At 12 months. | ||||
| 2.1 Fingolimod 0.5 mg versus interferon beta‐1a | 1 | 860 | Risk Ratio (M‐H, Random, 95% CI) | 1.18 [1.09, 1.27] |
| 2.2 Fingolimod 1.25 mg versus interferon beta‐1a | 1 | 851 | Risk Ratio (M‐H, Random, 95% CI) | 1.15 [1.06, 1.24] |
| 3 At 24 months Show forest plot | 2 | Risk Ratio (M‐H, Random, 95% CI) | Subtotals only | |
| Analysis 1.3 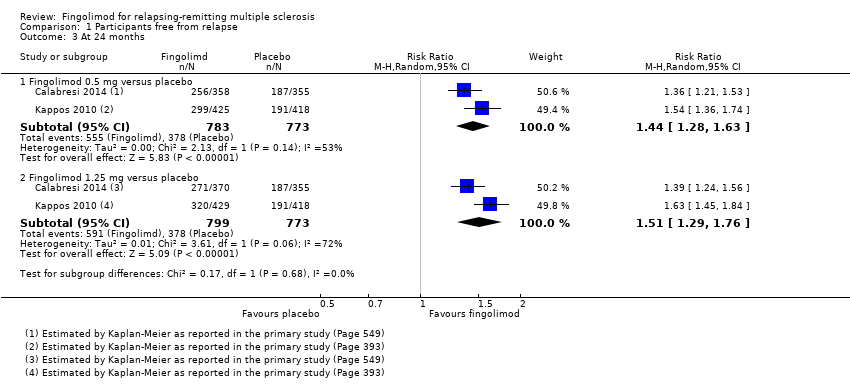 Comparison 1 Participants free from relapse, Outcome 3 At 24 months. | ||||
| 3.1 Fingolimod 0.5 mg versus placebo | 2 | 1556 | Risk Ratio (M‐H, Random, 95% CI) | 1.44 [1.28, 1.63] |
| 3.2 Fingolimod 1.25 mg versus placebo | 2 | 1572 | Risk Ratio (M‐H, Random, 95% CI) | 1.51 [1.29, 1.76] |
| Outcome or subgroup title | No. of studies | No. of participants | Statistical method | Effect size |
| 1 At 12 months Show forest plot | 1 | Risk Ratio (M‐H, Random, 95% CI) | Subtotals only | |
| Analysis 2.1 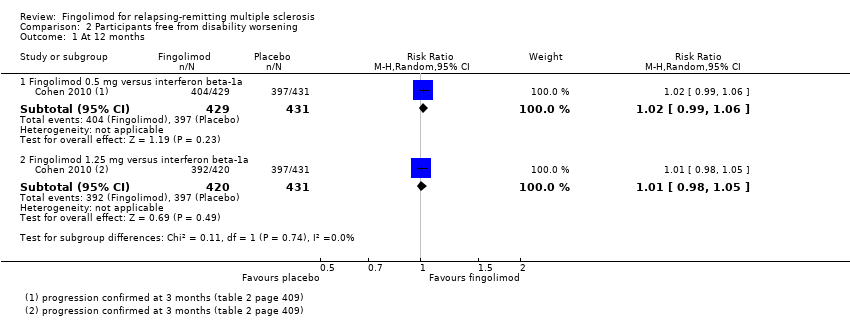 Comparison 2 Participants free from disability worsening, Outcome 1 At 12 months. | ||||
| 1.1 Fingolimod 0.5 mg versus interferon beta‐1a | 1 | 860 | Risk Ratio (M‐H, Random, 95% CI) | 1.02 [0.99, 1.06] |
| 1.2 Fingolimod 1.25 mg versus interferon beta‐1a | 1 | 851 | Risk Ratio (M‐H, Random, 95% CI) | 1.01 [0.98, 1.05] |
| 2 At 24 months Show forest plot | 2 | Risk Ratio (M‐H, Random, 95% CI) | Subtotals only | |
| Analysis 2.2  Comparison 2 Participants free from disability worsening, Outcome 2 At 24 months. | ||||
| 2.1 Fingolimod 0.5 mg versus placebo | 2 | 1556 | Risk Ratio (M‐H, Random, 95% CI) | 1.07 [1.02, 1.11] |
| 2.2 Fingolimod 1.25 mg versus placebo | 2 | 1572 | Risk Ratio (M‐H, Random, 95% CI) | 1.08 [1.03, 1.12] |
| Outcome or subgroup title | No. of studies | No. of participants | Statistical method | Effect size |
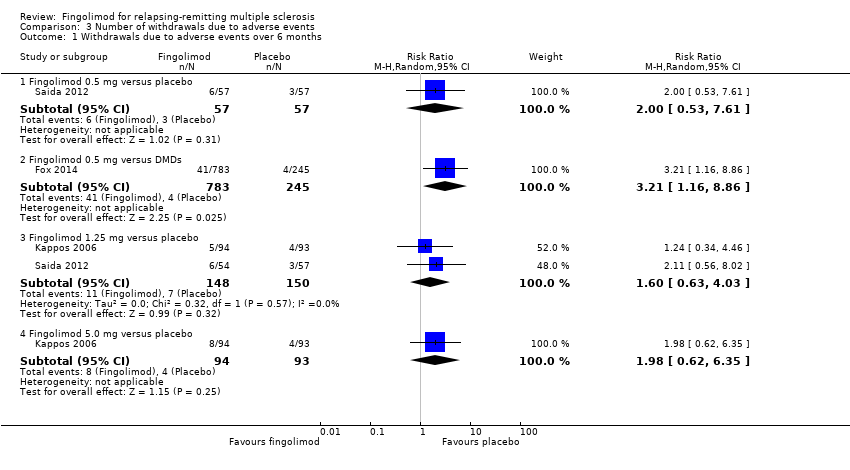
| 1 Withdrawals due to adverse events over 6 months Show forest plot | 3 | Risk Ratio (M‐H, Random, 95% CI) | Subtotals only | |
| Analysis 3.1  Comparison 3 Number of withdrawals due to adverse events, Outcome 1 Withdrawals due to adverse events over 6 months. | ||||
| 1.1 Fingolimod 0.5 mg versus placebo | 1 | 114 | Risk Ratio (M‐H, Random, 95% CI) | 2.0 [0.53, 7.61] |
| 1.2 Fingolimod 0.5 mg versus DMDs | 1 | 1028 | Risk Ratio (M‐H, Random, 95% CI) | 3.21 [1.16, 8.86] |
| 1.3 Fingolimod 1.25 mg versus placebo | 2 | 298 | Risk Ratio (M‐H, Random, 95% CI) | 1.60 [0.63, 4.03] |
| 1.4 Fingolimod 5.0 mg versus placebo | 1 | 187 | Risk Ratio (M‐H, Random, 95% CI) | 1.98 [0.62, 6.35] |
| 2 Withdrawals due to adverse events over 12 months Show forest plot | 1 | Risk Ratio (M‐H, Random, 95% CI) | Subtotals only | |
| Analysis 3.2 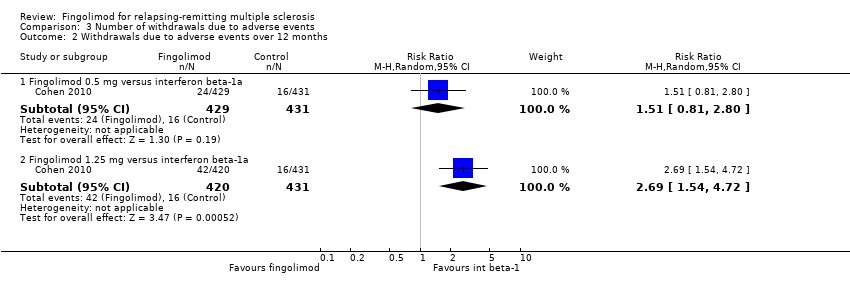 Comparison 3 Number of withdrawals due to adverse events, Outcome 2 Withdrawals due to adverse events over 12 months. | ||||
| 2.1 Fingolimod 0.5 mg versus interferon beta‐1a | 1 | 860 | Risk Ratio (M‐H, Random, 95% CI) | 1.51 [0.81, 2.80] |
| 2.2 Fingolimod 1.25 mg versus interferon beta‐1a | 1 | 851 | Risk Ratio (M‐H, Random, 95% CI) | 2.69 [1.54, 4.72] |
| 3 Withdrawals due to adverse events over 24 months Show forest plot | 2 | Risk Ratio (M‐H, Random, 95% CI) | Subtotals only | |
| Analysis 3.3 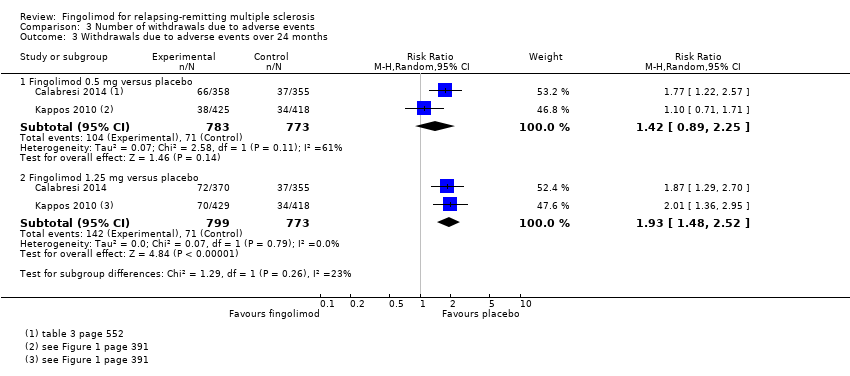 Comparison 3 Number of withdrawals due to adverse events, Outcome 3 Withdrawals due to adverse events over 24 months. | ||||
| 3.1 Fingolimod 0.5 mg versus placebo | 2 | 1556 | Risk Ratio (M‐H, Random, 95% CI) | 1.42 [0.89, 2.25] |
| 3.2 Fingolimod 1.25 mg versus placebo | 2 | 1572 | Risk Ratio (M‐H, Random, 95% CI) | 1.93 [1.48, 2.52] |
| 4 Withdrawals due to serious adverse events over 6 months Show forest plot | 3 | Risk Ratio (M‐H, Random, 95% CI) | Subtotals only | |
| Analysis 3.4  Comparison 3 Number of withdrawals due to adverse events, Outcome 4 Withdrawals due to serious adverse events over 6 months. | ||||
| 4.1 Fingolimod 0.5 mg versus placebo | 1 | 114 | Risk Ratio (M‐H, Random, 95% CI) | 1.67 [0.42, 6.65] |
| 4.2 Fingolimod 0.5 mg versus DMDs | 1 | 1028 | Risk Ratio (M‐H, Random, 95% CI) | 2.71 [0.83, 8.88] |
| 4.3 Fingolimod 1.25 mg versus placebo | 2 | 298 | Risk Ratio (M‐H, Random, 95% CI) | 2.36 [0.99, 5.66] |
| 4.4 Fingolimod 5.0 mg versus placebo | 1 | 187 | Risk Ratio (M‐H, Random, 95% CI) | 2.77 [1.04, 7.38] |
| 5 Withdrawals due to serious adverse events over 12 months Show forest plot | 1 | Risk Ratio (M‐H, Random, 95% CI) | Subtotals only | |
| Analysis 3.5 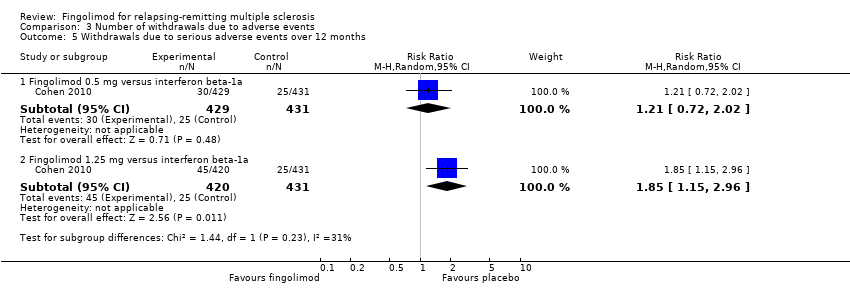 Comparison 3 Number of withdrawals due to adverse events, Outcome 5 Withdrawals due to serious adverse events over 12 months. | ||||
| 5.1 Fingolimod 0.5 mg versus interferon beta‐1a | 1 | 860 | Risk Ratio (M‐H, Random, 95% CI) | 1.21 [0.72, 2.02] |
| 5.2 Fingolimod 1.25 mg versus interferon beta‐1a | 1 | 851 | Risk Ratio (M‐H, Random, 95% CI) | 1.85 [1.15, 2.96] |
| 6 Withdrawals due to serious adverse events over 24 months Show forest plot | 2 | Risk Ratio (M‐H, Random, 95% CI) | Subtotals only | |
| Analysis 3.6  Comparison 3 Number of withdrawals due to adverse events, Outcome 6 Withdrawals due to serious adverse events over 24 months. | ||||
| 6.1 Fingolimod 0.5 mg versus placebo | 2 | 1556 | Risk Ratio (M‐H, Random, 95% CI) | 0.91 [0.55, 1.50] |
| 6.2 Fingolimod 1.25 mg versus placebo | 2 | 1572 | Risk Ratio (M‐H, Random, 95% CI) | 0.98 [0.74, 1.29] |
| Outcome or subgroup title | No. of studies | No. of participants | Statistical method | Effect size |
| 1 At 6 months Show forest plot | 2 | Rate Ratio (Random, 95% CI) | Subtotals only | |
| Analysis 4.1 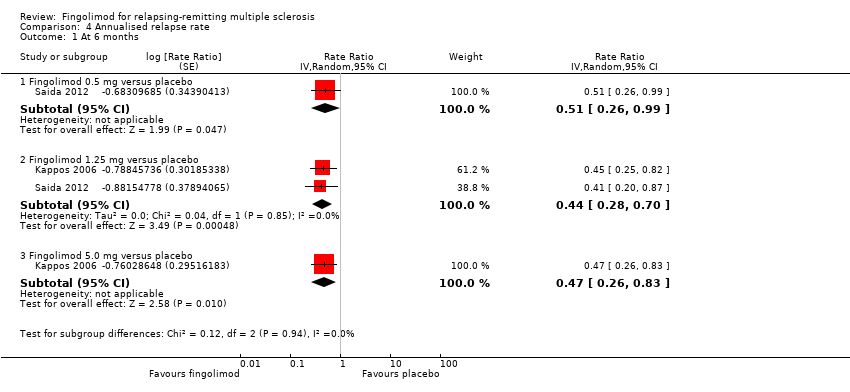 Comparison 4 Annualised relapse rate, Outcome 1 At 6 months. | ||||
| 1.1 Fingolimod 0.5 mg versus placebo | 1 | Rate Ratio (Random, 95% CI) | 0.51 [0.26, 0.99] | |
| 1.2 Fingolimod 1.25 mg versus placebo | 2 | Rate Ratio (Random, 95% CI) | 0.44 [0.28, 0.70] | |
| 1.3 Fingolimod 5.0 mg versus placebo | 1 | Rate Ratio (Random, 95% CI) | 0.47 [0.26, 0.83] | |
| 2 At 12 months Show forest plot | 1 | Rate Ratio (Random, 95% CI) | 0.56 [0.46, 0.69] | |
| Analysis 4.2  Comparison 4 Annualised relapse rate, Outcome 2 At 12 months. | ||||
| 2.1 Fingolimod 0.5 mg versus interferon beta‐1a | 1 | Rate Ratio (Random, 95% CI) | 0.48 [0.34, 0.70] | |
| 2.2 Fingolimod 1.25 versus interferon beta‐1a | 1 | Rate Ratio (Random, 95% CI) | 0.61 [0.47, 0.78] | |
| 3 At 24 months Show forest plot | 2 | Rate Ratio (Random, 95% CI) | Subtotals only | |
| Analysis 4.3  Comparison 4 Annualised relapse rate, Outcome 3 At 24 months. | ||||
| 3.1 Fingolimod 0.5 mg versus placebo | 2 | Rate Ratio (Random, 95% CI) | 0.50 [0.40, 0.62] | |
| 3.2 Fingolimod 1.25 mg versus placebo | 2 | Rate Ratio (Random, 95% CI) | 0.47 [0.38, 0.59] | |
| Outcome or subgroup title | No. of studies | No. of participants | Statistical method | Effect size |
| 1 At 6 months Show forest plot | 4 | Risk Ratio (M‐H, Random, 95% CI) | Subtotals only | |
| Analysis 5.1  Comparison 5 Participants free from gadolinium‐enhancing lesions, Outcome 1 At 6 months. | ||||
| 1.1 Fingolimod 0.5 mg versus placebo | 3 | 1519 | Risk Ratio (M‐H, Random, 95% CI) | 1.42 [1.33, 1.51] |
| 1.2 Fingolimod 1.25 mg versus placebo | 4 | 1674 | Risk Ratio (M‐H, Random, 95% CI) | 1.43 [1.34, 1.53] |
| 1.3 Fingolimod 5 mg versus placebo | 1 | 158 | Risk Ratio (M‐H, Random, 95% CI) | 1.74 [1.35, 2.25] |
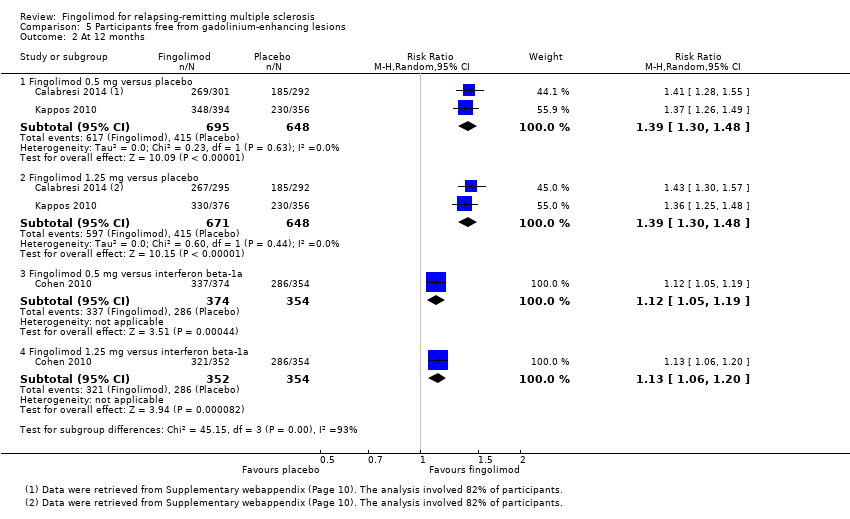
| 2 At 12 months Show forest plot | 3 | Risk Ratio (M‐H, Random, 95% CI) | Subtotals only | |
| Analysis 5.2  Comparison 5 Participants free from gadolinium‐enhancing lesions, Outcome 2 At 12 months. | ||||
| 2.1 Fingolimod 0.5 mg versus placebo | 2 | 1343 | Risk Ratio (M‐H, Random, 95% CI) | 1.39 [1.30, 1.48] |
| 2.2 Fingolimod 1.25 mg versus placebo | 2 | 1319 | Risk Ratio (M‐H, Random, 95% CI) | 1.39 [1.30, 1.48] |
| 2.3 Fingolimod 0.5 mg versus interferon beta‐1a | 1 | 728 | Risk Ratio (M‐H, Random, 95% CI) | 1.12 [1.05, 1.19] |
| 2.4 Fingolimod 1.25 mg versus interferon beta‐1a | 1 | 706 | Risk Ratio (M‐H, Random, 95% CI) | 1.13 [1.06, 1.20] |
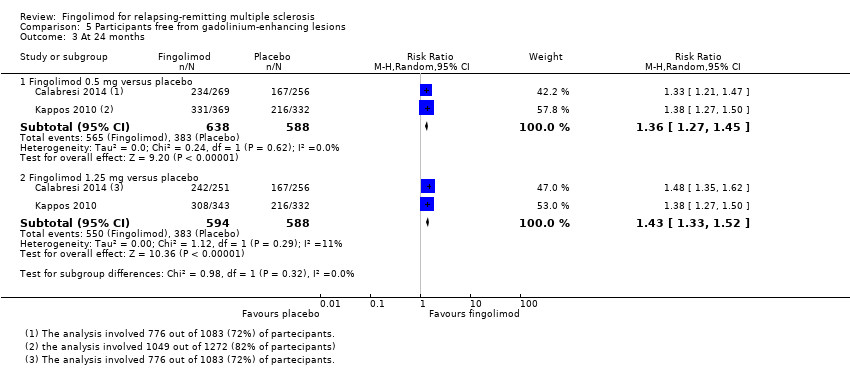
| 3 At 24 months Show forest plot | 2 | Risk Ratio (M‐H, Random, 95% CI) | Subtotals only | |
| Analysis 5.3  Comparison 5 Participants free from gadolinium‐enhancing lesions, Outcome 3 At 24 months. | ||||
| 3.1 Fingolimod 0.5 mg versus placebo | 2 | 1226 | Risk Ratio (M‐H, Random, 95% CI) | 1.36 [1.27, 1.45] |
| 3.2 Fingolimod 1.25 mg versus placebo | 2 | 1182 | Risk Ratio (M‐H, Random, 95% CI) | 1.43 [1.33, 1.52] |
| Outcome or subgroup title | No. of studies | No. of participants | Statistical method | Effect size |
| 1 At 12 months Show forest plot | 2 | Mean Difference (IV, Random, 95% CI) | Subtotals only | |
| Analysis 6.1 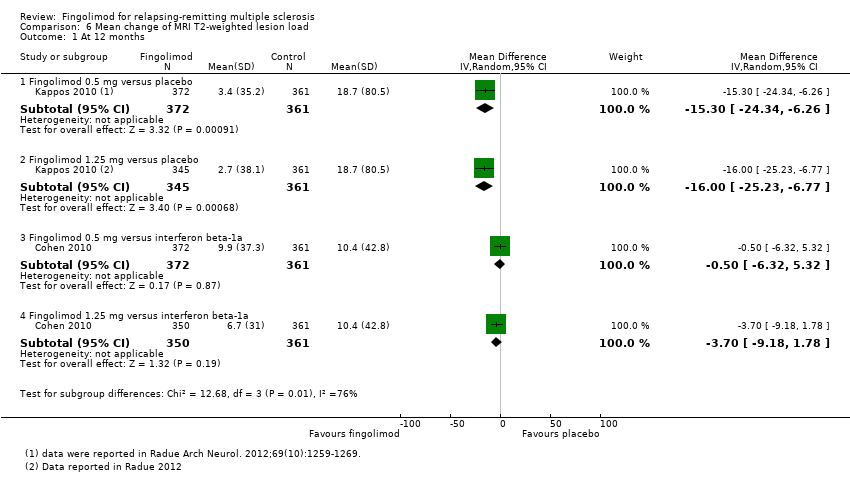 Comparison 6 Mean change of MRI T2‐weighted lesion load, Outcome 1 At 12 months. | ||||
| 1.1 Fingolimod 0.5 mg versus placebo | 1 | 733 | Mean Difference (IV, Random, 95% CI) | ‐15.30 [‐24.34, ‐6.26] |
| 1.2 Fingolimod 1.25 mg versus placebo | 1 | 706 | Mean Difference (IV, Random, 95% CI) | ‐16.0 [‐25.23, ‐6.77] |
| 1.3 Fingolimod 0.5 mg versus interferon beta‐1a | 1 | 733 | Mean Difference (IV, Random, 95% CI) | ‐0.5 [‐6.32, 5.32] |
| 1.4 Fingolimod 1.25 mg versus interferon beta‐1a | 1 | 711 | Mean Difference (IV, Random, 95% CI) | ‐3.7 [‐9.18, 1.78] |
| 2 At 24 months Show forest plot | 2 | Mean Difference (IV, Random, 95% CI) | Subtotals only | |
| Analysis 6.2 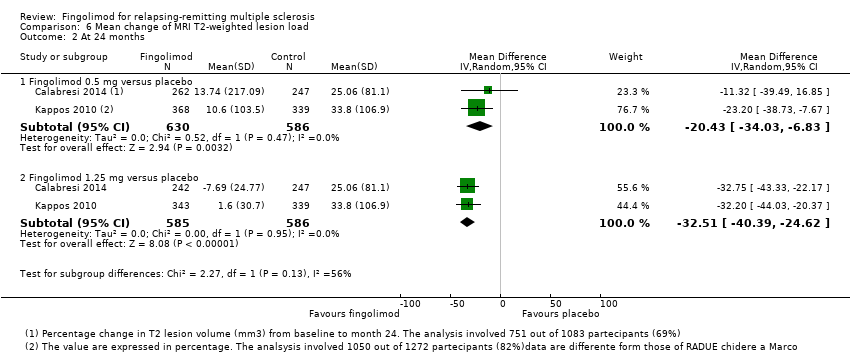 Comparison 6 Mean change of MRI T2‐weighted lesion load, Outcome 2 At 24 months. | ||||
| 2.1 Fingolimod 0.5 mg versus placebo | 2 | 1216 | Mean Difference (IV, Random, 95% CI) | ‐20.43 [‐34.03, ‐6.83] |
| 2.2 Fingolimod 1.25 mg versus placebo | 2 | 1171 | Mean Difference (IV, Random, 95% CI) | ‐32.51 [‐40.39, ‐24.62] |
| Outcome or subgroup title | No. of studies | No. of participants | Statistical method | Effect size |
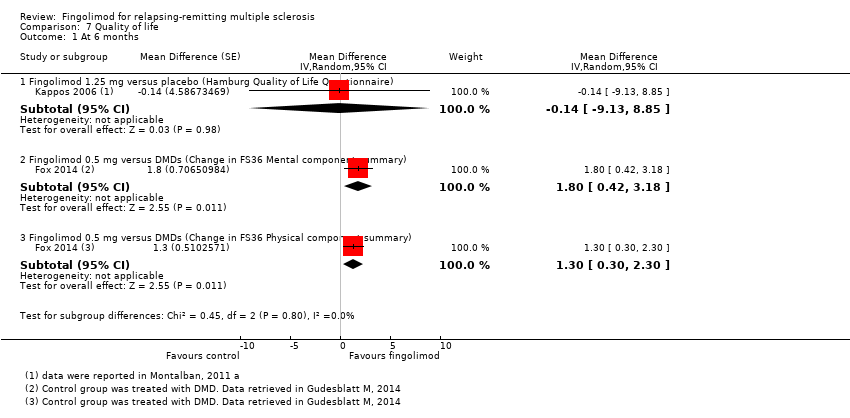
| 1 At 6 months Show forest plot | 2 | Mean Difference (Random, 95% CI) | Subtotals only | |
| Analysis 7.1  Comparison 7 Quality of life, Outcome 1 At 6 months. | ||||
| 1.1 Fingolimod 1.25 mg versus placebo (Hamburg Quality of Life Questionnaire) | 1 | Mean Difference (Random, 95% CI) | ‐0.14 [‐9.13, 8.85] | |
| 1.2 Fingolimod 0.5 mg versus DMDs (Change in FS36 Mental component summary) | 1 | Mean Difference (Random, 95% CI) | 1.8 [0.42, 3.18] | |
| 1.3 Fingolimod 0.5 mg versus DMDs (Change in FS36 Physical component summary) | 1 | Mean Difference (Random, 95% CI) | 1.30 [0.30, 2.30] | |
| 2 At 24 months Show forest plot | 1 | Mean Difference (IV, Random, 95% CI) | Subtotals only | |
| Analysis 7.2 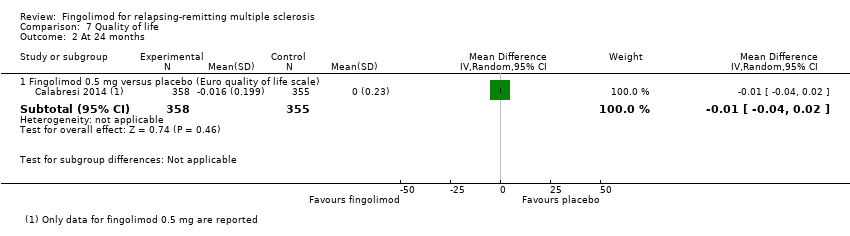 Comparison 7 Quality of life, Outcome 2 At 24 months. | ||||
| 2.1 Fingolimod 0.5 mg versus placebo (Euro quality of life scale) | 1 | 713 | Mean Difference (IV, Random, 95% CI) | ‐0.01 [‐0.04, 0.02] |

Study flow diagram.

Risk of bias summary: review authors' judgements about each risk of bias item for each included study.
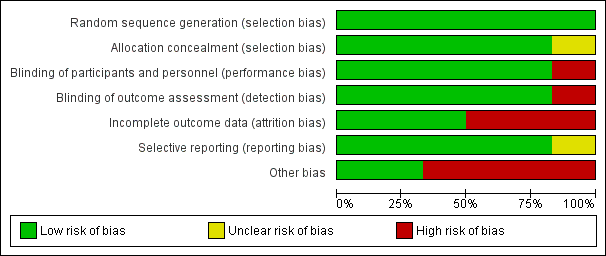
Risk of bias graph: review authors' judgements about each risk of bias item presented as percentages across all included studies.

N, number of patients; n, number of events.
Significant differences (based on Fisher exact test) are reported in red.

N, number of patients; n, number of events.
* One case of basal‐cell carcinoma was not reported as a serious adverse event by the site investigator (Calabresi 2014).
Significant differences (based on Fisher exact test) are reported in red.

Comparison 1 Participants free from relapse, Outcome 1 At 6 months.
Comparison 1 Participants free from relapse, Outcome 2 At 12 months.

Comparison 1 Participants free from relapse, Outcome 3 At 24 months.

Comparison 2 Participants free from disability worsening, Outcome 1 At 12 months.

Comparison 2 Participants free from disability worsening, Outcome 2 At 24 months.
Comparison 3 Number of withdrawals due to adverse events, Outcome 1 Withdrawals due to adverse events over 6 months.

Comparison 3 Number of withdrawals due to adverse events, Outcome 2 Withdrawals due to adverse events over 12 months.

Comparison 3 Number of withdrawals due to adverse events, Outcome 3 Withdrawals due to adverse events over 24 months.

Comparison 3 Number of withdrawals due to adverse events, Outcome 4 Withdrawals due to serious adverse events over 6 months.

Comparison 3 Number of withdrawals due to adverse events, Outcome 5 Withdrawals due to serious adverse events over 12 months.

Comparison 3 Number of withdrawals due to adverse events, Outcome 6 Withdrawals due to serious adverse events over 24 months.

Comparison 4 Annualised relapse rate, Outcome 1 At 6 months.

Comparison 4 Annualised relapse rate, Outcome 2 At 12 months.

Comparison 4 Annualised relapse rate, Outcome 3 At 24 months.

Comparison 5 Participants free from gadolinium‐enhancing lesions, Outcome 1 At 6 months.
Comparison 5 Participants free from gadolinium‐enhancing lesions, Outcome 2 At 12 months.
Comparison 5 Participants free from gadolinium‐enhancing lesions, Outcome 3 At 24 months.

Comparison 6 Mean change of MRI T2‐weighted lesion load, Outcome 1 At 12 months.

Comparison 6 Mean change of MRI T2‐weighted lesion load, Outcome 2 At 24 months.
Comparison 7 Quality of life, Outcome 1 At 6 months.

Comparison 7 Quality of life, Outcome 2 At 24 months.
| Fingolimod 0.5 mg versus placebo for relapsing‐remitting multiple sclerosis | |||||
| Participants or population: people with relapsing‐remitting multiple sclerosis | |||||
| Outcomes at 24 months | Illustrative comparative risks* (95% CI) | Relative effect | No. of Participants | Quality of the evidence | |
| Assumed risk | Corresponding risk | ||||
| Control (placebo) | Fingolimod 0.5 mg | ||||
| Participants free from relapse | 49 per 100 | 70 per 100 | RR 1.44 | 1556 | ⊕⊕⊕⊝ |
| Participants free from disability worsening | 82 per 100 | 87 per 100 | RR 1.07 | 1556 | ⊕⊕⊝⊝ |
| Withdrawals due to adverse events | 9 per 100 | 13 per 100 | RR 1.42 | 1556 | ⊕⊝⊝⊝ |
| Annualised relapse rate | ‐ | ‐ | Rate ratio 0.50 | 1556 | ⊕⊕⊕⊝ |
| Participants free from MRI gadolinium‐enhancing lesions | 65 per 100 | 89 per 100 | RR 1.36 | 1226 | ⊕⊕⊝⊝ |
| *For dichotomous outcomes, the corresponding risk with fingolimod 0.5 mg (and its 95% CI) is based on the assumed risk with the control group (i.e. the mean proportion of events in the control group across the two studies) and the relative effect of fingolimod (and its 95% CI). For the annualised relapse rate, only the relative effect (i.e., the rate ratio) is given, because the assumed risk with the control group is not estimable. | |||||
| GRADE Working Group grades of evidence | |||||
| a Study limitations: significant differences in reasons for incomplete outcome data between treatment and control groups. | |||||
| Fingolimod 0.5 mg versus intramuscular interferon beta‐1a for relapsing‐remitting multiple sclerosis | |||||
| Participants or population: people with relapsing‐remitting multiple sclerosis | |||||
| Outcomes at 12 months | Illustrative comparative risks* (95% CI) | Relative effect | No. of Participants | Quality of the evidence | |
| Assumed risk | Corresponding risk | ||||
| Control (interferon beta‐1a) | Fingolimod 0.5 mg | ||||
| Participants free from relapse | 70 per 100 | 83 per 100 | RR 1.18 | 860 | ⊕⊕⊕⊝ |
| Participants free from disability worsening | 92 per 100 | 94 per 100 | RR 1.02 | 860 | ⊕⊕⊝⊝ |
| Withdrawals due to adverse events | 4 per 100 | 6 per 100 | RR 1.51 | 860 | ⊕⊕⊕⊝ |
| Annualised relapse rate | ‐ | ‐ | Rate ratio 0.48 | 860 | ⊕⊕⊕⊝ |
| Participants free from MRI gadolinium‐enhancing lesions | 81 per 100 | 90 per 100 | RR 1.12 | 728 | ⊕⊕⊕⊝ |
| *For dichotomous outcomes, the corresponding risk with the intervention (and its 95% CI) is based on the assumed risk with the control (i.e. the mean proportion of events in the control group across studies) and the relative effect of the intervention (and its 95% CI). For the annualised relapse rate, only the relative effect (i.e., the rate ratio) is given. | |||||
| GRADE Working Group grades of evidence | |||||
| a Imprecision: total number of events (i.e. the number of participants with disability worsening/gadolinium‐enhancing lesions) was less than 300 (the threshold rule‐of‐thumb value), and thus the available evidence did not meet the optimal information size criteria. b Indirectness: surrogate outcome (progression confirmed at three months of follow‐up). | |||||
| Study name | Clinical outcomes | Time point assessment | MRI outcomes | Time point assessment |
| 1.Annualised relapse rate 2. Time to disability progression confirmed at 3 months 3. Time to disability progression confirmed at 6 months 4. Safety 5. Time to first relapse 6. Proportion of relapse‐free participants 7. Change from baseline to the end of study on the MSFC score 8. Quality of life using the Euro quality of life scale (EQ‐5D) 9. Patient Reported Indices in Multiple Sclerosis 10. Fatigue using the Modified Fatigue Impact Scale | 24 months | 1.Percent brain‐volume change from baseline at 24 months 2.Number and volume of gadolinium‐enhancing T1 lesions 3. Number of new or newly enlarged T2 lesions 4. Proportion of participants free of gadolinium‐enhancing T1 lesions 5. Proportion of participants free of new or newly enlarged T2 lesions 6. Proportion of participants free of new inflammatory activity (no gadolinium‐enhancing T1 lesions and no new or newly enlarged T2 lesions) 7. Percentage change from baseline in volume of gadolinium‐enhanced T1 lesions 8. Percentage change from baseline in volume of new or newly enlarged T2 lesions 9. Brain volume | 24 months | |
| 1. Annualised relapse rate 2. Progression of disability (confirmed at 3 months) | 12 months | Number of new or enlarged lesions on T2‐weighted scans | 12 months | |
| 1. Treatment satisfaction 2. Fatigue 3. Depression 4. Activities of daily living 5. Health‐related Quality Of Life 6, Side effects | 6 months | Not included | ||
| 1. Number of participants remaining free of relapse 2. Annualised relapse rate 3, Time to the first relapse | 6 months | 1.Number of gadolinium‐enhanced lesions per participant recorded on T1‐weighted MRI at monthly intervals for 6 months 2.Total volume of gadolinium‐enhanced lesions per participants 3. Proportion of participants with gadolinium‐enhanced lesions 4. Total number of new lesion per participant on T‐weighted images 5. Changes in lesion volume on T2‐weighted images 6. Brain volume from baseline to month 6 | 6 months | |
| 1. Annualised relapse rate 2. Time to confirmed disability progression (confirmed after 3 months ) 3. Time to a first relapse 4. Time to disability progression (confirmed after 6 months) 5. Changes in the EDSS score 6. Changes in the MSFC z score between baseline and 24 months | 24 months | 1. Number of gadolinium‐enhancing lesions 2. Proportion of participants free from gadolinium‐enhancing lesions 3. Number of new or enlarged lesions on T2‐weighted MRI scans 4. Proportion of participants free from new or enlarged lesions on T2‐weighted scan 5. Volumes of hyperintense lesions on T2‐weighted scan 6. Volumes of hypointense lesions on T1‐weighted scans 7. Change in brain volume between baseline and 24 months 8. Safety and tolerability measures | 24 months | |
| Percentage of participants free from relapse | 6 months | Participants free from gadolinium‐enhancing lesions | 6 months | |
| EDSS: Expanded Disability Status Scale; MSFC: Multiple Sclerosis Functional Composite The primary outcome of each study is underlined | ||||
| Study name | Drugs | No. participants | Female (%) | Course of disease of RR‐SP (%) | Age, years, mean (SD) | Mean EDSS score (SD) | Disease duration, mean (SD) | Pre‐1 year number of relapses, mean (SD) | Percentage of pre‐study treatment‐naive participants | Percentage of participants with MRI enhancing lesions | Mean lesion volume on T2‐weighted images (mm3 ) (SD) |
| Placebo | 355 | 81 | 100 ‐ 0 | 40·1 (8·4) | 2·2 (1·5) | 10·6 (7·9) | 1·5 (0·9) | 27 | 36 | 5553 (7841) | |
| Fingolimod 0.5 mg | 358 | 77 | 100 ‐ 0 | 40·6 (8·4) | 2·2 (1·4) | 10·4 (8·0) | 1·4 (0·9) | 26 | 39 | 5484 (8000) | |
| Fingolimod 1.25 mg | 370 | 76 | 100 ‐ 0 | 40·9 (8·9) | 2·3 (2·0) | 10·8 (8·2) | 1·5 (1·0) | 22 | 31 | 4936 (7286) | |
| Interferon beta‐1a (Avonex) | 435 | 67.8 | 100 ‐ 0 | 36.0 (8.3) | 2.19 (1.26) | 7.4 (6.3) | 1.5 (0.8) | 43.7 | 36.9 | 4924 (5711) | |
| Fingolimod 0.5 mg | 431 | 65.4 | 100 ‐ 0 | 36.7 (8.8) | 2.24 (1.33) | 7.5 (6.2) | 1.5 (1.2) | 44.8 | 32.6 | 5170 (6642) | |
| Fingolimod 1.25 mg | 426 | 68.8 | 100 ‐ 0 | 35.8 (8.4) | 2.21 (1.31) | 7.3 (6.0) | 1.5 (0.9) | 41.5 | 34.5 | 5085 (5962) | |
| DMD§ | 263 | 79.1 | 100 ‐ 0 | 45.1 (9.82) | 2.4 (1.32) | 11.7 (8.44) | 0.8 (1.32) | 0 | NR | NR | |
| Fingolimod 0.5 mg | 790 | 76.1 | 100 ‐ 0 | 46.0 (9.82) | 2.4 (1.32) | 12.1 (8.38) | 0.8 (1.20) | 0 | NR | NR | |
| Placebo | 93 | 66 | 90 ‐ 10 | 37.1 (19‐56)* | 2.6 (0.0‐6.5)* | 8.4 (0.2‐28.2)* | 1.2 (0‐5)* | NR | 51 | 8805 (123‐62,218)* | |
| Fingolimod 1.25 mg | 94 | 75 | 89 ‐ 11 | 38.0 (19‐60)* | 2.7 (0.0‐6.0)* | 8.6 (0.3‐50.2)* | 1.3 (0‐5)* | NR | 47 | 10,219 (293‐104,504)* | |
| Fingolimod 5.0 mg | 94 | 71 | 87 ‐ 13 | 38.3 (18‐59)* | 2.5 (0.0‐6.0)* | 9.5 (0.5‐42.2)* | 1.3 (0‐4)* | NR | 57 | 8722 (349‐70,218)* | |
| Placebo | 418 | 71.3 | 100 ‐ 0 | 37.2 (8.6) | 2.5 (1.3) | 8.1 (6.4) | 1.4 (0.7) | 59.6 | 37 | 6162 (7085) | |
| Fingolimod 0.5 mg | 425 | 69.6 | 100 ‐ 0 | 36.6 (8.8) | 2.3 (1.3) | 8.0 (6.6) | 1.5 (0.8) | 57.4 | 38 | 6128 (7623) | |
| Fingolimod 1.25 mg | 429 | 68.8 | 100 ‐ 0 | 37.4 (8.9) | 2.4 (1.4) | 8.4 (6.9) | 1.5 (0.8) | 60.4 | 39.4 | 6829 (8491) | |
| Placebo | 57 | 68.4 | 100 ‐ 0 | 35.0 (8.9) | 2.1 (1.7) | 8.2 (7.3) | 1.7 (1.6) | NR | 42.1 | 31.6 (22.6)** | |
| Fingolimod 0.5 mg | 57 | 70.2 | 94.7 ‐ 5.3 | 35.0 (9.0) | 2.3 (1.9) | 8.2 (6.8) | 1.4 (1.0) | NR | 42.1 | 30.4 (22.7)** | |
| Fingolimod 1.25 mg | 57 | 68.4 | 98.2 ‐ 1.8 | 36.0 (9.3) | 1.8 (1.7) | 7.1 (5.3) | 1.5 (0.9) | NR | 49.1 | 31.7 (23.3)** | |
| DMD: disease‐modifying drug;EDSS: Expanded Disability Status Scale; MRI: magnetic resonance imaging; NR: not reported; RR: relapsing‐remitting; SD: standard deviation; SP: secondary progressive * Range (SD was not provided) | |||||||||||
| Study name | Risk of bias | Did the researchers actively monitor for adverse events (AEs) (low risk of bias) or did they simply provide spontaneous reporting of AEs that arose (high risk of bias)? | Risk of bias | Did the authors define serious AEs (SAEs) according to an accepted international classification and report the number of SAEs? |
| Low | "We did extensive safety and tolerability assessments, in part as a response to preclinical safety concerns raised by the FDA and additional safety areas of interest identified in previous phase 2 and earlier clinical studies. We also recorded adverse events, serious adverse events, serious adverse events of special interest, 24 h Holter electrocardiography (ECG) post first‐dose and at 3 months, first‐dose bradycardia events, infections, laboratory tests, vital signs, ECG, echocardiography, pulmonary function. tests, chest high‐resolution CT,chest radiographs, ophthalmic examinations, including serial optical coherence tomography, and dermatological assessments." Clinical assessments were performed at screening and at randomisation (baseline), and study visits, including safety assessments, were scheduled at 2 weeks and 1, 2, 3, 6, 9, 12, 15, 18, 21, and 24 months after randomisation" | Unclear | "We also recorded adverse events, serious adverse events, serious adverse events of special interest, 24 h Holter electrocardiography (ECG) post fist‐dose and at 3 months, first‐dose bradycardia events, infections, laboratory tests, vital signs, ECG, echocardiography, pulmonary function tests, chest high‐resolution CT,chest radiographs, ophthalmic examinations, including serial optical coherence tomography, and dermatological assessments" | |
| Low | "An independent data and safety monitoring board evaluated overall safety in the fingolimod phase 3 program" and "Safety assessments were conducted during screening, at baseline, and at months 1, 2, 3, 6, 9, and 12" (pg 404) | Low | SAEs were predefined per standard criteria (death, life‐threatening event, persistent disability, congenital defect, unplanned hospitalisation, or otherwise medically significant) (FDA 2010 Clinical review of safety pg 151) | |
| Low | "Safety and tolerability (secondary study objectives) were assessed via reporting of | Unclear | Not specified | |
| Low | "An independent external data and safety monitoring board evaluated adverse events and other safety data" and "Adverse events were assessed and reported at each visit (scheduled and unscheduled) by the treating physicians. Laboratory evaluations were undertaken at a central laboratory". "Vital signs were obtained at each visit, and laboratory and hematologic measures were obtained at baseline, day 1, and months 1,3,6,9, and 12. Electrocardiograms were obtained at baseline, on days 1 and 7, and at months 1,3,6,12, and 24 hour Holter electrocardiographic monitoring was performed at selected sites at baseline, day 1, and month 3. Pulmonary function tests... were performed at screening and months 6 and 12" (pg 1126) | Low | Categorisation of SAEs conformed to ICH guidelines (International Conference on Harmonisation of Technical Requirements for Registration of Pharmaceuticals for Human Use) | |
| Low | "An independent data and safety monitoring board evaluated the safety" and "Study visits, including safety assessments, were scheduled at 2 weeks and 1, 2, 3, 6, 9, 12, 15, 18, 21, and 24 months after randomization" (pg 389) | Low | SAEs were predefined per standard criteria (death, life‐threatening event, persistent disability, congenital defect, unplanned hospitalisation, or otherwise medically significant) (FDA 2010 Clinical review of safety pg 151) | |
| Low | "Adverse events, serious adverse events assessments were conducted at screening, baseline, days 1 and 15, and months 1,2,3,4,5 and 6" (pg 2) and "Safety assessment included recording of AEs, SAEs, hematology values, vital signs, results of dermatological and ophthalmological examinations and results of pulmonary and liver function tests" (Supplementary data online appendix) | Low | Categorisation of SAEs conformed to ICH guidelines (International Conference on Harmonisation of Technical Requirements for Registration of Pharmaceuticals for Human Use) | |
| AE: adverse event; CT: chest tomography; ECG: electrocardiography; FDA: Food and Drug Administration; SAE: serious adverse event | ||||
| Outcome or subgroup title | No. of studies | No. of participants | Statistical method | Effect size |
| 1 At 6 months Show forest plot | 2 | Risk Ratio (M‐H, Random, 95% CI) | Subtotals only | |
| 1.1 Fingolimod 0.5 mg versus placebo | 1 | 114 | Risk Ratio (M‐H, Random, 95% CI) | 1.22 [0.96, 1.54] |
| 1.2 Fingolimod 1.25 mg versus placebo | 2 | 299 | Risk Ratio (M‐H, Random, 95% CI) | 1.27 [1.11, 1.45] |
| 1.3 Fingolimod 5.0 mg versus placebo | 1 | 184 | Risk Ratio (M‐H, Random, 95% CI) | 1.30 [1.10, 1.53] |
| 2 At 12 months Show forest plot | 1 | Risk Ratio (M‐H, Random, 95% CI) | Subtotals only | |
| 2.1 Fingolimod 0.5 mg versus interferon beta‐1a | 1 | 860 | Risk Ratio (M‐H, Random, 95% CI) | 1.18 [1.09, 1.27] |
| 2.2 Fingolimod 1.25 mg versus interferon beta‐1a | 1 | 851 | Risk Ratio (M‐H, Random, 95% CI) | 1.15 [1.06, 1.24] |
| 3 At 24 months Show forest plot | 2 | Risk Ratio (M‐H, Random, 95% CI) | Subtotals only | |
| 3.1 Fingolimod 0.5 mg versus placebo | 2 | 1556 | Risk Ratio (M‐H, Random, 95% CI) | 1.44 [1.28, 1.63] |
| 3.2 Fingolimod 1.25 mg versus placebo | 2 | 1572 | Risk Ratio (M‐H, Random, 95% CI) | 1.51 [1.29, 1.76] |
| Outcome or subgroup title | No. of studies | No. of participants | Statistical method | Effect size |
| 1 At 12 months Show forest plot | 1 | Risk Ratio (M‐H, Random, 95% CI) | Subtotals only | |
| 1.1 Fingolimod 0.5 mg versus interferon beta‐1a | 1 | 860 | Risk Ratio (M‐H, Random, 95% CI) | 1.02 [0.99, 1.06] |
| 1.2 Fingolimod 1.25 mg versus interferon beta‐1a | 1 | 851 | Risk Ratio (M‐H, Random, 95% CI) | 1.01 [0.98, 1.05] |
| 2 At 24 months Show forest plot | 2 | Risk Ratio (M‐H, Random, 95% CI) | Subtotals only | |
| 2.1 Fingolimod 0.5 mg versus placebo | 2 | 1556 | Risk Ratio (M‐H, Random, 95% CI) | 1.07 [1.02, 1.11] |
| 2.2 Fingolimod 1.25 mg versus placebo | 2 | 1572 | Risk Ratio (M‐H, Random, 95% CI) | 1.08 [1.03, 1.12] |
| Outcome or subgroup title | No. of studies | No. of participants | Statistical method | Effect size |
| 1 Withdrawals due to adverse events over 6 months Show forest plot | 3 | Risk Ratio (M‐H, Random, 95% CI) | Subtotals only | |
| 1.1 Fingolimod 0.5 mg versus placebo | 1 | 114 | Risk Ratio (M‐H, Random, 95% CI) | 2.0 [0.53, 7.61] |
| 1.2 Fingolimod 0.5 mg versus DMDs | 1 | 1028 | Risk Ratio (M‐H, Random, 95% CI) | 3.21 [1.16, 8.86] |
| 1.3 Fingolimod 1.25 mg versus placebo | 2 | 298 | Risk Ratio (M‐H, Random, 95% CI) | 1.60 [0.63, 4.03] |
| 1.4 Fingolimod 5.0 mg versus placebo | 1 | 187 | Risk Ratio (M‐H, Random, 95% CI) | 1.98 [0.62, 6.35] |
| 2 Withdrawals due to adverse events over 12 months Show forest plot | 1 | Risk Ratio (M‐H, Random, 95% CI) | Subtotals only | |
| 2.1 Fingolimod 0.5 mg versus interferon beta‐1a | 1 | 860 | Risk Ratio (M‐H, Random, 95% CI) | 1.51 [0.81, 2.80] |
| 2.2 Fingolimod 1.25 mg versus interferon beta‐1a | 1 | 851 | Risk Ratio (M‐H, Random, 95% CI) | 2.69 [1.54, 4.72] |
| 3 Withdrawals due to adverse events over 24 months Show forest plot | 2 | Risk Ratio (M‐H, Random, 95% CI) | Subtotals only | |
| 3.1 Fingolimod 0.5 mg versus placebo | 2 | 1556 | Risk Ratio (M‐H, Random, 95% CI) | 1.42 [0.89, 2.25] |
| 3.2 Fingolimod 1.25 mg versus placebo | 2 | 1572 | Risk Ratio (M‐H, Random, 95% CI) | 1.93 [1.48, 2.52] |
| 4 Withdrawals due to serious adverse events over 6 months Show forest plot | 3 | Risk Ratio (M‐H, Random, 95% CI) | Subtotals only | |
| 4.1 Fingolimod 0.5 mg versus placebo | 1 | 114 | Risk Ratio (M‐H, Random, 95% CI) | 1.67 [0.42, 6.65] |
| 4.2 Fingolimod 0.5 mg versus DMDs | 1 | 1028 | Risk Ratio (M‐H, Random, 95% CI) | 2.71 [0.83, 8.88] |
| 4.3 Fingolimod 1.25 mg versus placebo | 2 | 298 | Risk Ratio (M‐H, Random, 95% CI) | 2.36 [0.99, 5.66] |
| 4.4 Fingolimod 5.0 mg versus placebo | 1 | 187 | Risk Ratio (M‐H, Random, 95% CI) | 2.77 [1.04, 7.38] |
| 5 Withdrawals due to serious adverse events over 12 months Show forest plot | 1 | Risk Ratio (M‐H, Random, 95% CI) | Subtotals only | |
| 5.1 Fingolimod 0.5 mg versus interferon beta‐1a | 1 | 860 | Risk Ratio (M‐H, Random, 95% CI) | 1.21 [0.72, 2.02] |
| 5.2 Fingolimod 1.25 mg versus interferon beta‐1a | 1 | 851 | Risk Ratio (M‐H, Random, 95% CI) | 1.85 [1.15, 2.96] |
| 6 Withdrawals due to serious adverse events over 24 months Show forest plot | 2 | Risk Ratio (M‐H, Random, 95% CI) | Subtotals only | |
| 6.1 Fingolimod 0.5 mg versus placebo | 2 | 1556 | Risk Ratio (M‐H, Random, 95% CI) | 0.91 [0.55, 1.50] |
| 6.2 Fingolimod 1.25 mg versus placebo | 2 | 1572 | Risk Ratio (M‐H, Random, 95% CI) | 0.98 [0.74, 1.29] |
| Outcome or subgroup title | No. of studies | No. of participants | Statistical method | Effect size |
| 1 At 6 months Show forest plot | 2 | Rate Ratio (Random, 95% CI) | Subtotals only | |
| 1.1 Fingolimod 0.5 mg versus placebo | 1 | Rate Ratio (Random, 95% CI) | 0.51 [0.26, 0.99] | |
| 1.2 Fingolimod 1.25 mg versus placebo | 2 | Rate Ratio (Random, 95% CI) | 0.44 [0.28, 0.70] | |
| 1.3 Fingolimod 5.0 mg versus placebo | 1 | Rate Ratio (Random, 95% CI) | 0.47 [0.26, 0.83] | |
| 2 At 12 months Show forest plot | 1 | Rate Ratio (Random, 95% CI) | 0.56 [0.46, 0.69] | |
| 2.1 Fingolimod 0.5 mg versus interferon beta‐1a | 1 | Rate Ratio (Random, 95% CI) | 0.48 [0.34, 0.70] | |
| 2.2 Fingolimod 1.25 versus interferon beta‐1a | 1 | Rate Ratio (Random, 95% CI) | 0.61 [0.47, 0.78] | |
| 3 At 24 months Show forest plot | 2 | Rate Ratio (Random, 95% CI) | Subtotals only | |
| 3.1 Fingolimod 0.5 mg versus placebo | 2 | Rate Ratio (Random, 95% CI) | 0.50 [0.40, 0.62] | |
| 3.2 Fingolimod 1.25 mg versus placebo | 2 | Rate Ratio (Random, 95% CI) | 0.47 [0.38, 0.59] | |
| Outcome or subgroup title | No. of studies | No. of participants | Statistical method | Effect size |
| 1 At 6 months Show forest plot | 4 | Risk Ratio (M‐H, Random, 95% CI) | Subtotals only | |
| 1.1 Fingolimod 0.5 mg versus placebo | 3 | 1519 | Risk Ratio (M‐H, Random, 95% CI) | 1.42 [1.33, 1.51] |
| 1.2 Fingolimod 1.25 mg versus placebo | 4 | 1674 | Risk Ratio (M‐H, Random, 95% CI) | 1.43 [1.34, 1.53] |
| 1.3 Fingolimod 5 mg versus placebo | 1 | 158 | Risk Ratio (M‐H, Random, 95% CI) | 1.74 [1.35, 2.25] |
| 2 At 12 months Show forest plot | 3 | Risk Ratio (M‐H, Random, 95% CI) | Subtotals only | |
| 2.1 Fingolimod 0.5 mg versus placebo | 2 | 1343 | Risk Ratio (M‐H, Random, 95% CI) | 1.39 [1.30, 1.48] |
| 2.2 Fingolimod 1.25 mg versus placebo | 2 | 1319 | Risk Ratio (M‐H, Random, 95% CI) | 1.39 [1.30, 1.48] |
| 2.3 Fingolimod 0.5 mg versus interferon beta‐1a | 1 | 728 | Risk Ratio (M‐H, Random, 95% CI) | 1.12 [1.05, 1.19] |
| 2.4 Fingolimod 1.25 mg versus interferon beta‐1a | 1 | 706 | Risk Ratio (M‐H, Random, 95% CI) | 1.13 [1.06, 1.20] |
| 3 At 24 months Show forest plot | 2 | Risk Ratio (M‐H, Random, 95% CI) | Subtotals only | |
| 3.1 Fingolimod 0.5 mg versus placebo | 2 | 1226 | Risk Ratio (M‐H, Random, 95% CI) | 1.36 [1.27, 1.45] |
| 3.2 Fingolimod 1.25 mg versus placebo | 2 | 1182 | Risk Ratio (M‐H, Random, 95% CI) | 1.43 [1.33, 1.52] |
| Outcome or subgroup title | No. of studies | No. of participants | Statistical method | Effect size |
| 1 At 12 months Show forest plot | 2 | Mean Difference (IV, Random, 95% CI) | Subtotals only | |
| 1.1 Fingolimod 0.5 mg versus placebo | 1 | 733 | Mean Difference (IV, Random, 95% CI) | ‐15.30 [‐24.34, ‐6.26] |
| 1.2 Fingolimod 1.25 mg versus placebo | 1 | 706 | Mean Difference (IV, Random, 95% CI) | ‐16.0 [‐25.23, ‐6.77] |
| 1.3 Fingolimod 0.5 mg versus interferon beta‐1a | 1 | 733 | Mean Difference (IV, Random, 95% CI) | ‐0.5 [‐6.32, 5.32] |
| 1.4 Fingolimod 1.25 mg versus interferon beta‐1a | 1 | 711 | Mean Difference (IV, Random, 95% CI) | ‐3.7 [‐9.18, 1.78] |
| 2 At 24 months Show forest plot | 2 | Mean Difference (IV, Random, 95% CI) | Subtotals only | |
| 2.1 Fingolimod 0.5 mg versus placebo | 2 | 1216 | Mean Difference (IV, Random, 95% CI) | ‐20.43 [‐34.03, ‐6.83] |
| 2.2 Fingolimod 1.25 mg versus placebo | 2 | 1171 | Mean Difference (IV, Random, 95% CI) | ‐32.51 [‐40.39, ‐24.62] |
| Outcome or subgroup title | No. of studies | No. of participants | Statistical method | Effect size |
| 1 At 6 months Show forest plot | 2 | Mean Difference (Random, 95% CI) | Subtotals only | |
| 1.1 Fingolimod 1.25 mg versus placebo (Hamburg Quality of Life Questionnaire) | 1 | Mean Difference (Random, 95% CI) | ‐0.14 [‐9.13, 8.85] | |
| 1.2 Fingolimod 0.5 mg versus DMDs (Change in FS36 Mental component summary) | 1 | Mean Difference (Random, 95% CI) | 1.8 [0.42, 3.18] | |
| 1.3 Fingolimod 0.5 mg versus DMDs (Change in FS36 Physical component summary) | 1 | Mean Difference (Random, 95% CI) | 1.30 [0.30, 2.30] | |
| 2 At 24 months Show forest plot | 1 | Mean Difference (IV, Random, 95% CI) | Subtotals only | |
| 2.1 Fingolimod 0.5 mg versus placebo (Euro quality of life scale) | 1 | 713 | Mean Difference (IV, Random, 95% CI) | ‐0.01 [‐0.04, 0.02] |