Финголимод при рецидивирующе‐ремиттирующем рассеянном склерозе
Abstract
Background
Fingolimod was approved in 2010 for the treatment of patients with the relapsing‐remitting (RR) form of multiple sclerosis (MS). It was designed to reduce the frequency of exacerbations and to delay disability worsening. Issues on its safety and efficacy, mainly as compared to other disease modifying drugs (DMDs), have been raised.
Objectives
To assess the safety and benefit of fingolimod versus placebo, or other disease‐modifying drugs (DMDs), in reducing disease activity in people with relapsing‐remitting multiple sclerosis (RRMS).
Search methods
We searched the Cochrane Multiple Sclerosis and Rare Diseases of the Central Nervous System (CNS) Group's Specialised Trials Register and US Food and Drug Administration reports (15 February 2016).
Selection criteria
Randomised controlled trials (RCTs) assessing the beneficial and harmful effects of fingolimod versus placebo or other approved DMDs in people with RRMS.
Data collection and analysis
We used standard methodological procedures as expected by Cochrane.
Main results
Six RCTs met our selection criteria. The overall population included 5152 participants; 1621 controls and 3531 treated with fingolimod at different doses; 2061 with 0.5 mg, 1376 with 1.25 mg, and 94 with 5.0 mg daily. Among the controls, 923 participants were treated with placebo and 698 with others DMDs. The treatment duration was six months in three, 12 months in one, and 24 months in two trials. One study was at high risk of bias for blinding, three studies were at high risk of bias for incomplete outcome reporting, and four studies were at high risk of bias for other reasons (co‐authors were affiliated with the pharmaceutical company). We retrieved 10 ongoing trials; four of them have been completed.
Comparing fingolimod administered at the approved dose of 0.5 mg to placebo, we found that the drug at 24 months increased the probability of being relapse‐free (risk ratio (RR) 1.44, 95% confidence interval (CI) (1.28 to 1.63); moderate quality of evidence), but it might lead to little or no difference in preventing disability progression (RR 1.07, 95% CI 1.02 to 1.11; primary clinical endpoints; low quality evidence). Benefit was observed for other measures of inflammatory disease activity including clinical (annualised relapse rate): rate ratio 0.50, 95% CI 0.40 to 0.62; moderate quality evidence; and magnetic resonance imaging (MRI) activity (gadolinium‐enhancing lesions): RR of being free from (MRI) gadolinium‐enhancing lesions: 1.36, 95% CI 1.27 to 1.45; low quality evidence.The mean change of MRI T2‐weighted lesion load favoured fingolimod at 12 and 24 months.
No significant increased risk of discontinuation due to adverse events was observed for fingolimod 0.5 mg compared to placebo at six and 24 months. The risk of fingolimod discontinuation was significantly higher compared to placebo for the dose 1.25 mg at 24 months (RR 1.93, 95% CI 1.48 to 2.52).
No significant increased risk of discontinuation due to serious adverse events was observed for fingolimod 0.5 mg compared to placebo at six and 24 months. A significant increased risk of discontinuation due to serious adverse events was found for fingolimod 5.0 mg (RR 2.77, 95% CI 1.04 to 7.38) compared to placebo at six months.
Comparing fingolimod 0.5 mg to intramuscular interferon beta‐1a, we found moderate quality evidence that the drug at one year slightly increased the number of participants free from relapse (RR 1.18, 95% CI 1.09 to 1.27) or from gadolinium‐enhancing lesions (RR 1.12, 95% CI 1.05 to 1.19), and decreased the relapse rate (rate ratio 0.48, 95% CI 0.34 to 0.70). We did not detect any advantage for preventing disability progression (RR 1.02, 95% CI 0.99 to 1.06; low quality evidence). We did not detect any significant difference for MRI T2‐weighted lesion load change.
We found a greater likelihood of participants discontinuing fingolimod, as compared to other DMDs, due to adverse events in the short‐term (six months) (RR 3.21, 95% CI 1.16 to 8.86), but there was no significant difference versus interferon beta‐1a at 12 months (RR 1.51, 95% CI 0.81 to 2.80; moderate quality evidence). A higher incidence of adverse events was suggestive of the lower tolerability rate of fingolimod compared to interferon‐beta 1a.
Quality of life was improved in participants after switching from a different DMD to fingolimod at six months, but this effect was not found compared to placebo at 24 months.
All studies were sponsored by Novartis Pharma.
Authors' conclusions
Treatment with fingolimod compared to placebo in RRMS patients is effective in reducing inflammatory disease activity, but it may lead to little or no difference in preventing disability worsening. The risk of withdrawals due to adverse events requires careful monitoring of patients over time. The evidence on the risk/benefit profile of fingolimod compared with intramuscular interferon beta‐1a was uncertain, based on a low number of head‐to‐head RCTs with short follow‐up duration. The ongoing trial results will possibly satisfy these issues.
PICO
Резюме на простом языке
Финголимод при рецидивирующе‐ремиттирующем рассеянном склерозе
Актуальность
Так как в основе патогенеза рассеянного склероза (РС) лежат аутоиммунные механизмы, большинство видов лечения основаны на иммуномодулирующих и иммуносупрессивных свойствах лекарств, таких как интерфероны, глатирамер, азатиоприн, циклофосфамид и митоксантрон.
Финголимод был первым средством, одобренным для перорального лечения, в 2010 году. Он хорошо всасывается, его всасывание не зависит от приема пищи и, как пероральный препарат, он вызвал большой интерес со стороны пациентов, для которых пероральный способ применения более приемлем, чем инъекции.
Цель обзора
Оценить безопасность и пользу финголимода в снижении активности заболевания у людей с рецидивирующе‐ремиттирующим РС (РРРС). Уже появился целый ряд опасений в отношении безопасности финголимода, включая серьезные инфекции и неблагоприятные эффекты со стороны сердечно‐сосудистой системы.
Характеристика исследований
В этот обзор были включены 6 исследований, опубликованных за период с 2006 по 2014 годы, в которых приняли участие 5152 человека с РРРС. Продолжительность лечения составила 6 месяцев в трех исследованиях, 12 месяцев – в одном исследовании, и 24 месяца – в двух исследованиях.
Основные результаты и качество доказательств
Главным выводом этого обзора было то, что финголимод в дозе 0,5 мг в день, в виде монотерапии, повышает вероятность отсутствия рецидивов через 24 месяца, по сравнению с плацебо. Польза была подтверждена мерами активности заболевания, определяемыми с помощью магнитно‐резонансной томографии (МРТ). Однако, не было эффекта в отношении предотвращения прогрессирующего нарушения трудоспособности. Лечение не было связано с повышенным риском выбывания пациентов из исследования из‐за неблагоприятных событий.
При сравнении финголимода (в той же дозе) с внутримышечным интерфероном бета‐1а, через год после лечения финголимодом немного повысилось число участников без рецидива или воспалительных поражений и снизилась частота рецидивов. И снова, мы не выявили каких‐либо преимуществ в предотвращении прогрессирующего нарушения трудоспособности. Мы обнаружили большую вероятность прекращения лечения из‐за неблагоприятных событий в коротком периоде наблюдения (6 месяцев) при использовании финголимода, по сравнению с иммуномодулирующими лекарствами; при сравнении с интерфероном бета не было обнаружено существенных различий через 12 месяцев после лечения.
Продолжительность всех исследований была 24 месяца или менее, поэтому эффективность финголимода (и, в основном, безопасность) в более отдаленные сроки (более 24 месяцев) остается неопределенной. Однако, это крайне важно для пожизненного заболевания, требующего постоянного лечения, такого как РС.
Риск неблагоприятных событий требует тщательного мониторирования (контроля) пациентов в течение длительного времени и предполагает необходимость проведения исследований с более длительным периодом наблюдения, особенно с учетом недавних предупреждений о риске развития прогрессирующей мультифокальной лейкоэнцефалопатии.
Шесть из включенных исследований были спонсированы компанией "Новартис Фарма" и большинство из соавторов опубликованных работ были связаны с фармацевтической компанией; это рассматривается как потенциальный источник смещения.
Authors' conclusions
Summary of findings
| Fingolimod 0.5 mg versus placebo for relapsing‐remitting multiple sclerosis | |||||
| Participants or population: people with relapsing‐remitting multiple sclerosis | |||||
| Outcomes at 24 months | Illustrative comparative risks* (95% CI) | Relative effect | No. of Participants | Quality of the evidence | |
| Assumed risk | Corresponding risk | ||||
| Control (placebo) | Fingolimod 0.5 mg | ||||
| Participants free from relapse | 49 per 100 | 70 per 100 | RR 1.44 | 1556 | ⊕⊕⊕⊝ |
| Participants free from disability worsening | 82 per 100 | 87 per 100 | RR 1.07 | 1556 | ⊕⊕⊝⊝ |
| Withdrawals due to adverse events | 9 per 100 | 13 per 100 | RR 1.42 | 1556 | ⊕⊝⊝⊝ |
| Annualised relapse rate | ‐ | ‐ | Rate ratio 0.50 | 1556 | ⊕⊕⊕⊝ |
| Participants free from MRI gadolinium‐enhancing lesions | 65 per 100 | 89 per 100 | RR 1.36 | 1226 | ⊕⊕⊝⊝ |
| *For dichotomous outcomes, the corresponding risk with fingolimod 0.5 mg (and its 95% CI) is based on the assumed risk with the control group (i.e. the mean proportion of events in the control group across the two studies) and the relative effect of fingolimod (and its 95% CI). For the annualised relapse rate, only the relative effect (i.e., the rate ratio) is given, because the assumed risk with the control group is not estimable. | |||||
| GRADE Working Group grades of evidence | |||||
| a Study limitations: significant differences in reasons for incomplete outcome data between treatment and control groups. | |||||
| Fingolimod 0.5 mg versus intramuscular interferon beta‐1a for relapsing‐remitting multiple sclerosis | |||||
| Participants or population: people with relapsing‐remitting multiple sclerosis | |||||
| Outcomes at 12 months | Illustrative comparative risks* (95% CI) | Relative effect | No. of Participants | Quality of the evidence | |
| Assumed risk | Corresponding risk | ||||
| Control (interferon beta‐1a) | Fingolimod 0.5 mg | ||||
| Participants free from relapse | 70 per 100 | 83 per 100 | RR 1.18 | 860 | ⊕⊕⊕⊝ |
| Participants free from disability worsening | 92 per 100 | 94 per 100 | RR 1.02 | 860 | ⊕⊕⊝⊝ |
| Withdrawals due to adverse events | 4 per 100 | 6 per 100 | RR 1.51 | 860 | ⊕⊕⊕⊝ |
| Annualised relapse rate | ‐ | ‐ | Rate ratio 0.48 | 860 | ⊕⊕⊕⊝ |
| Participants free from MRI gadolinium‐enhancing lesions | 81 per 100 | 90 per 100 | RR 1.12 | 728 | ⊕⊕⊕⊝ |
| *For dichotomous outcomes, the corresponding risk with the intervention (and its 95% CI) is based on the assumed risk with the control (i.e. the mean proportion of events in the control group across studies) and the relative effect of the intervention (and its 95% CI). For the annualised relapse rate, only the relative effect (i.e., the rate ratio) is given. | |||||
| GRADE Working Group grades of evidence | |||||
| a Imprecision: total number of events (i.e. the number of participants with disability worsening/gadolinium‐enhancing lesions) was less than 300 (the threshold rule‐of‐thumb value), and thus the available evidence did not meet the optimal information size criteria. b Indirectness: surrogate outcome (progression confirmed at three months of follow‐up). | |||||
Background
Description of the condition
Multiple sclerosis (MS) is the most common nontraumatic cause of neurologic disability in young adults (Compston 2002; Noseworthy 2000). The overall incidence of MS is between 3.5 to 6.6 people per 100,000, while the prevalence rate is between 100 to 120 people per 100,000 (Alonso 2008; Richards 2002). A recent review showed an increase in the prevalence and incidence rate over time around the Mediterranean Basin, particularly in women ( Elhami 2011). Western Europe and North America are high prevalence areas (Koch‐Henriksen 2010). The social cost associated with MS is high because of its long duration, the early loss of productivity, the need for assistance in activities of daily living and the use of highly expensive immunotherapy and multidisciplinary health care (Koutsouraki 2010). It is widely believed that MS is an immune‐mediated disease whose clinical manifestations and course, as well as response to therapy, appear to be heterogeneous, as may be the underlying pathogenic mechanisms (Compston 2008).
Different clinical subtypes of MS are distinguishable. Approximately 80% of patients have an initial disease course characterised by relapses and remissions (relapsing‐remitting MS (RRMS)). The remaining have primary or transitional progressive MS and experience progressive decline in neurological function from onset. In patients with RRMS, disability can result from one or more of the following: incomplete recovery from relapses, development of secondary progressive MS (SPMS), or cognitive impairment. However, as many as 17% of patients with benign MS never develop a clinically important physical disability (Pittock 2004).
Considering the autoimmune pathogenesis of the disease, the mainstay of treatment has been based on immunomodulatory drugs, including interferon beta and glatiramer acetate, which are generally perceived as very safe drugs. However, they allow only a partial control of the disease. The available armamentarium has been expanding in recent years, with injectable and oral agents with more selective mechanisms of action and more efficacy (Oh J 2013).
Description of the intervention
Fingolimod is a sphingosine‐1‐phosphate (S1P)–receptor modulator, 2‐amino‐2‐(2‐[4‐octylphenyl]ethyl)‐1, 3‐propanediol (Brinkmann 2002).
It is a prodrug, phosphorylated by sphingosine kinases to active phosphofingolimod. There are at least five S1P receptor subtypes, known as S1P subtypes 1‐5 (S1P1‐5), four of which bind fingolimod‐phosphate (Chun 2010). S1P1 is highly expressed on T and B lymphocytes. Fingolimod induces lymphocytes S1P1 down‐regulation, preventing the egress of cells from secondary lymphoid tissues (Chun 2010; Pinschewer 2000). Therefore, lymphocytes are retained away from the Central Nervous System (CNS) (Matloubian 2004; Pinschewer 2000). After oral administration, fingolimod is efficiently absorbed and its absorption is unaffected by dietary intake. After administration of one dose, blood concentration of fingolimod increases steadily over the first 12 hours and remains elevated during the 24‐hour period until the next dose. It has a half‐life of six to nine days. Steady‐state blood concentrations are reached within one to two months following once‐daily administration and steady‐state levels are approximately 10‐fold greater than with the initial dose (David 2012).
Other effects of fingolimod are the transient activation of S1P receptors in atrial myocytes (associated with transient reduction of heart rate), the increase of lung hyperreactivity (associated with bronchospasm and airway constriction effects), mediated by S1P1 and S1P3 and a role in the regulation of endothelial permeability and vascular tone. Fingolimod has also been reported to be a competitive antagonist of cannabinoid receptors, and cannabinoid receptor activation has been shown to stimulate sphingomyelin catabolism (Paugh 2006).
Fingolimod can prevent renal graft rejections and suppress a variety of autoimmune disorders (Liu 2013).
Fingolimod marketed as Gilenya ® (Novartis Pharma) is provided as 0.5 mg hard gelatin capsules for oral use, once‐daily. Each capsule contains 0.56 mg of fingolimod hydrochloride, equivalent to 0.5 mg of fingolimod.
How the intervention might work
Fingolimod has been shown to reduce disease activity and established neurologic deficits in animal models (Brinkmann 2002). Prophylactic administration of fingolimod to animals with experimental autoimmune encephalitis (EAE), a model of MS, completely prevents development of EAE, whereas therapeutic administration significantly reduces the clinical severity of EAE (Chun 2010). Phase II and phase III trials in RRMS patients showed significant reduction of the relapse rate and of the number of gadolinium‐enhancing, and new and/or enlarging T2 lesions on magnetic resonance imaging (MRI), as compared with placebo and with interferon beta‐1a (Oh J 2013). These effects have been related to sequestration of lymphocytes within lymph nodes, and a significant decrease in peripherally circulating lymphocytes, preventing autoaggressive lymphocytes from crossing the blood‐brain barrier. Some studies have shown that fingolimod may promote neuroprotective and reparative processes within the CNS through modulation of S1P receptors on glial and neural cells (Miron 2008; Paugh 2006; Pinschewer 2000).
Fingolimod was the first drug to gain approval as an oral treatment in the United States on 21 September, 2010, by the US Food and Drug Administration (FDA), "for the treatment of patients with relapsing forms of MS to reduce the frequency of clinical exacerbations and to delay the accumulation of physical disability." Marketing authorisation was approved only for the 0.5 mg dose, due to a more favourable safety profile of this dosage compared to the 1.25 mg dose: "the higher dose, while exposing patients to more risk, did not expose patients to significantly increased efficacy," and specific recommendations for monitoring patients and contraindications for use has been provided (FDA 2010).
The approval by the European Medicines Agency Committee for Medicinal Products for Human Use on 27 January, 2011 (EMA 2011), has been recently updated (EMA 2015). Gilenya® is indicated as single disease modifying therapy in highly active RRMS for the following adult patient groups.
-
Patients with high disease activity despite treatment with at least one disease modifying drug (DMD). These patients may be defined as those who have failed to respond to a full and adequate course (normally at least one year of treatment) of at least one DMD. Patients should have had at least one relapse in the previous year while on therapy, and have at least nine T2‐hyperintense lesions in cranial MRI or at least one gadolinium‐enhancing lesion. A “non‐responder” could also be defined as a patient with an unchanged or increased relapse rate or ongoing severe relapses, as compared to the previous year.
-
Patients with rapidly evolving severe RRMS defined by two or more disabling relapses in one year, and with one or more gadolinium‐enhancing lesions on brain MRI or a significant increase in T2 lesion load as compared to a previous recent MRI.
Why it is important to do this review
Oral therapies have aroused lively interest amongst stakeholders, suggesting a new era of MS therapies with improved efficacy and more acceptable routes of administration. After approval of the use of fingolimod for the treatment of RRMS, different descriptive reviews have been published confirming the effectiveness of fingolimod in people with MS (Del Santo 2011; Freedman 2013; Hillert 2012; Hutchinson 2014; Oh J 2013), but also raising concerns about serious adverse events (Lu 2013; Parfenov 2013). A number of safety concerns emerged with post‐marketing surveillance, including serious infections and adverse cardiac effects (AIFA 2015; EMA 2015; Oh J 2013). The advantage of this therapy (as compared to other DMDs) has been questioned, suggesting need to reserve the use of fingolimod to patients who can be closely monitored.
No systematic review of trials evaluating the benefit and safety of fingolimod has until now, been provided. By assessing and updating its benefit‐risk profile, the results of this review might clarify the use of fingolimod in clinical practice.
Objectives
To assess the safety and benefits of fingolimod versus placebo, or other disease‐modifying drugs (DMDs), in reducing disease activity in people with relapsing‐remitting multiple sclerosis (RRMS).
Methods
Criteria for considering studies for this review
Types of studies
We considered randomised controlled trials (RCTs) that studied fingolimod versus placebo or other approved disease‐modifying drugs (DMDs) in relapsing‐remitting multiple sclerosis (RRMS), irrespective of publication status and language. We excluded cross‐over studies.
Types of participants
We included participants of any age, gender and race affected by RRMS according to McDonald's diagnostic criteria (Mc Donald 2001; Polman 2005; Polman 2011).
Types of interventions
-
Fingolimod, any dose and route of administration, versus placebo without restriction of treatment duration.
-
Fingolimod, any dose and route of administration, versus any other approved DMDs without restriction of treatment duration.
Types of outcome measures
Primary outcomes
1. Number of participants relapse‐free at six,12 and 24 months after randomisation and at the end of follow‐up.
2. Number of participants free from disability worsening at 12, 24 and 36 months after randomisation and at the end of follow‐up. Disability worsening is defined as at least one point Expanded Disability Status Scale (EDSS) (Kurtzke 1983) increase, or a 0.5 point increase if the baseline EDSS was > 5.5, confirmed during two subsequent neurological examinations separated by at least 6 months' interval free of relapses. We considered separately studies that reported disability worsening defined using different criteria.
3. Number of participants who withdrew from the study due to
a) adverse events;
b) serious adverse events, i.e. death, life‐threatening, hospitalisation, disability or permanent damage, congenital anomaly/birth defect (FDA 2013).
Secondary outcomes
4. Annualised relapse rate at six, 12 and 24 months after randomisation and at the end of follow‐up.
5. Number of participants free from MRI gadolinium‐enhancing lesions at six, 12 and 24 months after randomisation and at the end of follow‐up.
6. Mean change of total MRI T2 weighted lesion load at 12 and 24 months after randomisation and at the end of follow‐up.
7. Quality of life measured by validated questionnaires such as MSQOL‐54 (Vickrey 1995).
Search methods for identification of studies
We did not apply any language restrictions.
Electronic searches
The Trials Search Co‐ordinator searched the Cochrane Multiple Sclerosis and Rare Diseases of the CNS Group Specialised Trials Register, which contained trials identified from:
-
Cochrane Central Register of Controlled Trials (CENTRAL; 2016, Issue 2).
-
MEDLINE (PubMed) (1966 to 15 February 2016).
-
EMBASE (Embase.com) (1974 to 15 February 2016).
-
Cumulative Index to Nursing and Allied Health Literature (CINAHL) (EBSCOhost) (1981 to 15 February 2016).
-
Latin American and Caribbean Health Science Information Database (LILACS) (Bireme) (1982 to 15 February 2016).
-
Clinical trial registries: clinicaltrials.gov.
-
World Health Organization (WHO) International Clinical Trials Registry Portal (apps.who.int/trialsearch/).
The keywords for this review are listed in (Appendix 1).
Information on the Trial Register of the Review Group and details of search strategies used to identify trials can be found in the 'Specialised Register' section within the Cochrane Multiple Sclerosis and Rare Diseases of the CNS group module.
Searching other resources
-
Reference list of included studies and related reviews.
-
Abstract books of the main MS meetings (European Committee for Treatment and Research in Multiple Sclerosis (ECTRIMS), European Neurological Society (ENS), American Academy of Neurology (AAN)) for the last eight years.
-
Contact with authors of primary studies, or drug manufacturers, or both.
-
FDA reports on fingolimod (www.fda.gov).
-
European Medicines Agency Committee for Medicinal Products for Human Use reports on fingolimod (EMA).
Data collection and analysis
We performed the review and meta‐analyses following the recommendations of Cochrane (Higgins 2011a). We used Review Manager 5 to perform the analyses (RevMan 2015).
Selection of studies
Three review authors (LLM, IP, RP) independently identified trials and assessed titles and abstracts of the records retrieved by the search. We excluded irrelevant studies. We obtained the full text of the remaining studies to confirm inclusion. We resolved disagreements by discussion.
Data extraction and management
Two review authors (LLM, IP) developed a data extraction form. Three review authors (LLM, IT, IP) extracted data on trial design, participants, interventions, and outcomes independently from each other. We resolved disagreements by discussion.
Assessment of risk of bias in included studies
Three review authors (LLM, IT, IP) independently assessed risk of bias for each study using the criteria outlined in the Cochrane Handbook for Systematic Reviews of Interventions (Higgins 2011a). We resolved any disagreement by discussion .
We followed Cochrane's recommendations for assessing risk of bias for each included study (Higgins 2011a). We graded each potential source of bias as high, low or unclear (either lack of information or uncertainty over the potential for bias) and provided a quote for the study report together with a justification for our judgment in the "Risk of Bias" table. We assessed the risk of bias according the following domains:
-
Random sequence generation.
-
Allocation concealment.
-
Blinding of participants and personnel.
-
Blinding of outcome assessment.
-
Incomplete outcome data.
-
Selective outcome reporting.
-
Other bias.
Outcome data were judged as low risk of bias when numbers and causes of losses to follow up were balanced between arms and when the percentage of participants lost to follow‐up was low (arbitrarily set at values lower than 15%).
In addition, we defined the following two specific criteria to assess adverse events.
-
Did the study provide a definition for severe adverse events?
-
Did the researchers actively monitor for adverse events (low risk of bias) or did they simply provide spontaneous reporting of adverse events that arose (high risk of bias)?
Measures of treatment effect
The preset outcomes involved dichotomous, continuous and count data. We used the risk ratio (RR) with 95% confidence intervals (CIs) for dichotomous data, the weighted mean difference with 95% CIs for continuous data, and the rate ratio with 95% CI for count data. The rate ratio compares the rate of events in two groups by dividing one by the other. In order to avoid the assumption that the variability between the studies was exclusively because of a random sampling variation around a fixed‐effect, we used the random‐effects model.
Unit of analysis issues
We performed a comparison with the parallel group maintaining the original randomisation of the study. In case of repeated observations, we tried to analyse each predefined outcome to reflect short‐term (six months), medium‐term (one year) and long‐term (> 2 years) follow‐up.
Dealing with missing data
In order to assess the effect of missing outcome data, we analysed data according to a likely scenario, i.e. we assumed that the treatment and control group participants who contributed to the missing data, both had experienced the outcome (relapse or disability).
Assessment of heterogeneity
We assessed between‐study heterogeneity both by inspection of graphical presentations using forest plots (Egger 1997), and by calculating the I2 statistic (significant if more than 50%) and the Chi2 test (Higgins 2011a).
Assessment of reporting biases
We did not perform a funnel plot because less than ten trials were included (Egger 1997).
Data synthesis
We performed meta‐analyses of primary and secondary outcomes using RevMan 5 (RevMan 2015).
Subgroup analysis and investigation of heterogeneity
Subgroup analyses were planned to answer specific questions, such as the effects about types of interventions (different dosages) or to investigate heterogeneous results (Deeks 2011).
Sensitivity analysis
In the case where there was evidence of trials results heterogeneity, we planned to perform a sensitivity analysis to determine the effect of excluding trials with a high risk of bias.
'Summary of findings' table
We created two 'Summary of findings' tables comparing fingolimod at the approved dose of 0.5 mg daily; one versus placebo at 24 months after randomisation (summary of findings Table for the main comparison), and one versus intramuscular interferon‐beta 1a at 12 months (summary of findings Table 2). In both 'Summary of findings' tables, we included five outcomes: number of participants relapse‐free; number of participants free from disability worsening ; number of withdrawals due to adverse events; annualised relapse rate; and number of participants free from MRI gadolinium‐enhancing lesions. We used the five GRADE considerations (study limitations, consistency of effect, imprecision, indirectness and publication bias) to assess the quality of the body of evidence. We followed methods and recommendations described in Section 11.5 and Chapter 12 of the Cochrane Handbook for Systematic Reviews of Interventions (Higgins 2011a).
Results
Description of studies
Results of the search
Results of the search are described in a PRISMA flow chart (Figure 1; Moher 2009). We assessed for eligibility 81 out of 481 records; 19 studies did not satisfy the inclusion criteria (Characteristics of excluded studies). We included a total of six RCTs (Calabresi 2014; Cohen 2010; Fox 2014; Kappos 2006, Kappos 2010; Saida 2012). Fifty‐six reports were ancillary to these primary studies. We found 10 ongoing trials; six are still ongoing (Characteristics of ongoing studies) and four have been completed and are awaiting classification (NCT01317004; NCT01333501; NCT01534182; NCT01623596) (Characteristics of studies awaiting classification).

Study flow diagram.
Included studies
The six trials were as follows.
-
Calabresi 2014 (FREEDOMS II study) (phase III).
-
Cohen 2010 (TRANSFORMS study) (phase III).
-
Fox 2014 (EPOC study) (phase IV).
-
Kappos 2006 (phase II).
-
Kappos 2010 (FREEDOMS study) (phase III).
-
Saida 2012 (phase II).
These trials were published between 2006 and 2014. Four studies compared fingolimod to placebo (Calabresi 2014; Kappos 2006; Kappos 2010; Saida 2012), one to intramuscular interferon beta‐1a (Cohen 2010), and one to other DMDs (interferon beta‐1a, interferon beta‐1b, glatiramer acetate) (Fox 2014). Four studies used fingolimod at doses of 0.5 mg and 1.25 mg (Calabresi 2014; Cohen 2010; Kappos 2010; Saida 2012). One study used doses of 1.25 mg and 5.0 mg (Kappos 2006). One study evaluated only the dose of 0.5 mg (Fox 2014). Fingolimod was administered orally in all studies.
The primary outcome was annualised relapse rate in three studies (Calabresi 2014; Cohen 2010; Kappos 2010); MRI measures of activity in two studies: number of gadolinium‐enhancing lesions (Kappos 2006) and percentage of participants free from gadolinium‐enhancing lesions (Saida 2012); and treatment satisfaction in the other study (Fox 2014). Outcome measures and time points of assessment considered by each of the included trials are listed in Table 1.
| Study name | Clinical outcomes | Time point assessment | MRI outcomes | Time point assessment |
| 1.Annualised relapse rate 2. Time to disability progression confirmed at 3 months 3. Time to disability progression confirmed at 6 months 4. Safety 5. Time to first relapse 6. Proportion of relapse‐free participants 7. Change from baseline to the end of study on the MSFC score 8. Quality of life using the Euro quality of life scale (EQ‐5D) 9. Patient Reported Indices in Multiple Sclerosis 10. Fatigue using the Modified Fatigue Impact Scale | 24 months | 1.Percent brain‐volume change from baseline at 24 months 2.Number and volume of gadolinium‐enhancing T1 lesions 3. Number of new or newly enlarged T2 lesions 4. Proportion of participants free of gadolinium‐enhancing T1 lesions 5. Proportion of participants free of new or newly enlarged T2 lesions 6. Proportion of participants free of new inflammatory activity (no gadolinium‐enhancing T1 lesions and no new or newly enlarged T2 lesions) 7. Percentage change from baseline in volume of gadolinium‐enhanced T1 lesions 8. Percentage change from baseline in volume of new or newly enlarged T2 lesions 9. Brain volume | 24 months | |
| 1. Annualised relapse rate 2. Progression of disability (confirmed at 3 months) | 12 months | Number of new or enlarged lesions on T2‐weighted scans | 12 months | |
| 1. Treatment satisfaction 2. Fatigue 3. Depression 4. Activities of daily living 5. Health‐related Quality Of Life 6, Side effects | 6 months | Not included | ||
| 1. Number of participants remaining free of relapse 2. Annualised relapse rate 3, Time to the first relapse | 6 months | 1.Number of gadolinium‐enhanced lesions per participant recorded on T1‐weighted MRI at monthly intervals for 6 months 2.Total volume of gadolinium‐enhanced lesions per participants 3. Proportion of participants with gadolinium‐enhanced lesions 4. Total number of new lesion per participant on T‐weighted images 5. Changes in lesion volume on T2‐weighted images 6. Brain volume from baseline to month 6 | 6 months | |
| 1. Annualised relapse rate 2. Time to confirmed disability progression (confirmed after 3 months ) 3. Time to a first relapse 4. Time to disability progression (confirmed after 6 months) 5. Changes in the EDSS score 6. Changes in the MSFC z score between baseline and 24 months | 24 months | 1. Number of gadolinium‐enhancing lesions 2. Proportion of participants free from gadolinium‐enhancing lesions 3. Number of new or enlarged lesions on T2‐weighted MRI scans 4. Proportion of participants free from new or enlarged lesions on T2‐weighted scan 5. Volumes of hyperintense lesions on T2‐weighted scan 6. Volumes of hypointense lesions on T1‐weighted scans 7. Change in brain volume between baseline and 24 months 8. Safety and tolerability measures | 24 months | |
| Percentage of participants free from relapse | 6 months | Participants free from gadolinium‐enhancing lesions | 6 months |
EDSS: Expanded Disability Status Scale; MSFC: Multiple Sclerosis Functional Composite
The primary outcome of each study is underlined
Confirmed relapse was defined as the occurrence of new symptoms, or worsening of previously stable or improving symptoms, and signs not associated with fever, lasting more than 24 hours. Symptoms had to appear at least 30 days after the onset of a preceding relapse (Cohen 2010; Saida 2012), and had to be accompanied by an increase of at least half a point in the EDSS score (Calabresi 2014; Cohen 2010; Kappos 2006; Kappos 2010) or one point in at least one of the functions in the Kurtzke Functional System score (excluding bowel‐bladder and mental systems) (Kappos 2006) or one point in each of two functions in the Kurtzke Functional Systems score, or two points in one of the functions in the Kurtzke Functional System score (excluding bowel–bladder or cerebral systems) (Calabresi 2014; Cohen 2010; Kappos 2010; Saida 2012).
Confirmed disability progression was defined as an increase of one point in the EDSS score (or 0.50 points if the baseline EDSS score was > 5·0), that was
confirmed three months later in the absence of relapse (Calabresi 2014; Cohen 2010; Kappos 2010). Disability progression confirmed at six months was available in two studies at 24 months (Calabresi 2014; Kappos 2010). Assessment of disability was performed using the Multiple Sclerosis Functional Composite (MSFC) score change in one study (Kappos 2006). Disability progression was not considered by Fox 2014 and Saida 2012.
The treatment duration was six months in three trials (Fox 2014; Kappos 2006; Saida 2012), 12 months in one trial (Cohen 2010), and 24 months in two trials (Calabresi 2014; Kappos 2010).
The Characteristics of included studies tables provide further details.
All studies were sponsored by Novartis Pharma.
Description of participants
The overall population included in the six trials was 5152 participants with 3531 treated with fingolimod; 2061 with 0.5 mg daily, 1376 with 1.25 mg daily, and 94 with 5.0 mg daily. The comparison population included 1621 participants; 923 treated with placebo and 698 with intramuscular interferon beta‐1a or other DMDs. Enrolled participants were Caucasian, except in Saida 2012, which included Japanese participants. Participants were affected by relapsing‐remitting multiple sclerosis (RRMS) in all studies, and secondary progressive multiple sclerosis (SPMS) in a small percentage in two studies; 11% in Kappos 2006 and 2.3% in Saida 2012 (Table 2).
| Study name | Drugs | No. participants | Female (%) | Course of disease of RR‐SP (%) | Age, years, mean (SD) | Mean EDSS score (SD) | Disease duration, mean (SD) | Pre‐1 year number of relapses, mean (SD) | Percentage of pre‐study treatment‐naive participants | Percentage of participants with MRI enhancing lesions | Mean lesion volume on T2‐weighted images (mm3 ) (SD) |
| Placebo | 355 | 81 | 100 ‐ 0 | 40·1 (8·4) | 2·2 (1·5) | 10·6 (7·9) | 1·5 (0·9) | 27 | 36 | 5553 (7841) | |
| Fingolimod 0.5 mg | 358 | 77 | 100 ‐ 0 | 40·6 (8·4) | 2·2 (1·4) | 10·4 (8·0) | 1·4 (0·9) | 26 | 39 | 5484 (8000) | |
| Fingolimod 1.25 mg | 370 | 76 | 100 ‐ 0 | 40·9 (8·9) | 2·3 (2·0) | 10·8 (8·2) | 1·5 (1·0) | 22 | 31 | 4936 (7286) | |
| Interferon beta‐1a (Avonex) | 435 | 67.8 | 100 ‐ 0 | 36.0 (8.3) | 2.19 (1.26) | 7.4 (6.3) | 1.5 (0.8) | 43.7 | 36.9 | 4924 (5711) | |
| Fingolimod 0.5 mg | 431 | 65.4 | 100 ‐ 0 | 36.7 (8.8) | 2.24 (1.33) | 7.5 (6.2) | 1.5 (1.2) | 44.8 | 32.6 | 5170 (6642) | |
| Fingolimod 1.25 mg | 426 | 68.8 | 100 ‐ 0 | 35.8 (8.4) | 2.21 (1.31) | 7.3 (6.0) | 1.5 (0.9) | 41.5 | 34.5 | 5085 (5962) | |
| DMD§ | 263 | 79.1 | 100 ‐ 0 | 45.1 (9.82) | 2.4 (1.32) | 11.7 (8.44) | 0.8 (1.32) | 0 | NR | NR | |
| Fingolimod 0.5 mg | 790 | 76.1 | 100 ‐ 0 | 46.0 (9.82) | 2.4 (1.32) | 12.1 (8.38) | 0.8 (1.20) | 0 | NR | NR | |
| Placebo | 93 | 66 | 90 ‐ 10 | 37.1 (19‐56)* | 2.6 (0.0‐6.5)* | 8.4 (0.2‐28.2)* | 1.2 (0‐5)* | NR | 51 | 8805 (123‐62,218)* | |
| Fingolimod 1.25 mg | 94 | 75 | 89 ‐ 11 | 38.0 (19‐60)* | 2.7 (0.0‐6.0)* | 8.6 (0.3‐50.2)* | 1.3 (0‐5)* | NR | 47 | 10,219 (293‐104,504)* | |
| Fingolimod 5.0 mg | 94 | 71 | 87 ‐ 13 | 38.3 (18‐59)* | 2.5 (0.0‐6.0)* | 9.5 (0.5‐42.2)* | 1.3 (0‐4)* | NR | 57 | 8722 (349‐70,218)* | |
| Placebo | 418 | 71.3 | 100 ‐ 0 | 37.2 (8.6) | 2.5 (1.3) | 8.1 (6.4) | 1.4 (0.7) | 59.6 | 37 | 6162 (7085) | |
| Fingolimod 0.5 mg | 425 | 69.6 | 100 ‐ 0 | 36.6 (8.8) | 2.3 (1.3) | 8.0 (6.6) | 1.5 (0.8) | 57.4 | 38 | 6128 (7623) | |
| Fingolimod 1.25 mg | 429 | 68.8 | 100 ‐ 0 | 37.4 (8.9) | 2.4 (1.4) | 8.4 (6.9) | 1.5 (0.8) | 60.4 | 39.4 | 6829 (8491) | |
| Placebo | 57 | 68.4 | 100 ‐ 0 | 35.0 (8.9) | 2.1 (1.7) | 8.2 (7.3) | 1.7 (1.6) | NR | 42.1 | 31.6 (22.6)** | |
| Fingolimod 0.5 mg | 57 | 70.2 | 94.7 ‐ 5.3 | 35.0 (9.0) | 2.3 (1.9) | 8.2 (6.8) | 1.4 (1.0) | NR | 42.1 | 30.4 (22.7)** | |
| Fingolimod 1.25 mg | 57 | 68.4 | 98.2 ‐ 1.8 | 36.0 (9.3) | 1.8 (1.7) | 7.1 (5.3) | 1.5 (0.9) | NR | 49.1 | 31.7 (23.3)** |
DMD: disease‐modifying drug;EDSS: Expanded Disability Status Scale; MRI: magnetic resonance imaging; NR: not reported; RR: relapsing‐remitting; SD: standard deviation; SP: secondary progressive
* Range (SD was not provided)
** Number of T2 lesions (volume was not provided)
§ interferon beta‐1b (Extavia® or Betaseron®) 0.25 mg injected subcutaneously every other day (46 participants); interferon beta‐1a (Avonex®) 30 μg intramuscular injected once a week (60 participants); interferon beta‐1a (Rebif®) 22 μg or 44 μg injected subcutaneously three times a week (65 participants); or glatiramer acetate (Copaxone®) 20 mg injected subcutaneously once‐daily (92 participants)
The inclusion criteria were similar among studies. Previous treatment with immunomodulating agents for at least six months were required in Fox 2014, and accepted in all other studies if the suspension occurred more than three months before trial onset (Calabresi 2014; Kappos 2006; Kappos 2010; Saida 2012), not specified in Cohen 2010.
Exclusion criteria were similar and included clinically significant systemic diseases, macular oedema (not specified for Kappos 2006), and diabetes (not specified for Kappos 2006 and Cohen 2010). Participants treated with immunosuppressants were excluded (Kappos 2010; Fox 2014), they had to interrupt treatment in the six months prior to randomisation (Saida 2012), interrupt azathioprine or methotrexate within six months, cyclophosphamide within 12 months, mitoxantrone or cladribine within 24 months (Kappos 2006), and natalizumab at least six months before randomisation (Calabresi 2014). Two studies specified as exclusion criteria the presence of cardiac abnormalities or leukopenia or lymphopenia (Kappos 2006; Saida 2012). Participants with varicella zoster immunoglobulin G (IgG) antibody negative at screening were excluded in three studies (Calabresi 2014; Fox 2014; Saida 2012).
The baseline clinical characteristics were homogeneous in term of age (ranging from 35.0 to 38.3 years), disability score (EDSS 1.8 to 2.7), disease duration (7.1 to 9.5 years), and mean relapse number in the year before randomisation (1.2 to 1.7). Percentage of prestudy treatment‐naive participants were different among studies, ranging from 0% to 60.4%. MRI enhancing lesions were detected in 31% to 49% of the participants, while the volume of MRI T2‐weighted lesions at baseline ranged from 4924 mm3 to 10,219 mm3 (Table 2).
Excluded studies
We excluded 18 studies because type of participants (three studies), design (seven studies) or intervention (one study) did not meet our inclusion criteria, five studies were not original articles (reporting pooled data of trials), and two studies were overviews (Characteristics of excluded studies).
Risk of bias in included studies
We evaluated risk of bias separately for benefit estimate (Characteristics of included studies), and adverse events monitoring (Table 3).
| Study name | Risk of bias | Did the researchers actively monitor for adverse events (AEs) (low risk of bias) or did they simply provide spontaneous reporting of AEs that arose (high risk of bias)? | Risk of bias | Did the authors define serious AEs (SAEs) according to an accepted international classification and report the number of SAEs? |
| Low | "We did extensive safety and tolerability assessments, in part as a response to preclinical safety concerns raised by the FDA and additional safety areas of interest identified in previous phase 2 and earlier clinical studies. We also recorded adverse events, serious adverse events, serious adverse events of special interest, 24 h Holter electrocardiography (ECG) post first‐dose and at 3 months, first‐dose bradycardia events, infections, laboratory tests, vital signs, ECG, echocardiography, pulmonary function. tests, chest high‐resolution CT,chest radiographs, ophthalmic examinations, including serial optical coherence tomography, and dermatological assessments." Clinical assessments were performed at screening and at randomisation (baseline), and study visits, including safety assessments, were scheduled at 2 weeks and 1, 2, 3, 6, 9, 12, 15, 18, 21, and 24 months after randomisation" | Unclear | "We also recorded adverse events, serious adverse events, serious adverse events of special interest, 24 h Holter electrocardiography (ECG) post fist‐dose and at 3 months, first‐dose bradycardia events, infections, laboratory tests, vital signs, ECG, echocardiography, pulmonary function tests, chest high‐resolution CT,chest radiographs, ophthalmic examinations, including serial optical coherence tomography, and dermatological assessments" | |
| Low | "An independent data and safety monitoring board evaluated overall safety in the fingolimod phase 3 program" and "Safety assessments were conducted during screening, at baseline, and at months 1, 2, 3, 6, 9, and 12" (pg 404) | Low | SAEs were predefined per standard criteria (death, life‐threatening event, persistent disability, congenital defect, unplanned hospitalisation, or otherwise medically significant) (FDA 2010 Clinical review of safety pg 151) | |
| Low | "Safety and tolerability (secondary study objectives) were assessed via reporting of | Unclear | Not specified | |
| Low | "An independent external data and safety monitoring board evaluated adverse events and other safety data" and "Adverse events were assessed and reported at each visit (scheduled and unscheduled) by the treating physicians. Laboratory evaluations were undertaken at a central laboratory". "Vital signs were obtained at each visit, and laboratory and hematologic measures were obtained at baseline, day 1, and months 1,3,6,9, and 12. Electrocardiograms were obtained at baseline, on days 1 and 7, and at months 1,3,6,12, and 24 hour Holter electrocardiographic monitoring was performed at selected sites at baseline, day 1, and month 3. Pulmonary function tests... were performed at screening and months 6 and 12" (pg 1126) | Low | Categorisation of SAEs conformed to ICH guidelines (International Conference on Harmonisation of Technical Requirements for Registration of Pharmaceuticals for Human Use) | |
| Low | "An independent data and safety monitoring board evaluated the safety" and "Study visits, including safety assessments, were scheduled at 2 weeks and 1, 2, 3, 6, 9, 12, 15, 18, 21, and 24 months after randomization" (pg 389) | Low | SAEs were predefined per standard criteria (death, life‐threatening event, persistent disability, congenital defect, unplanned hospitalisation, or otherwise medically significant) (FDA 2010 Clinical review of safety pg 151) | |
| Low | "Adverse events, serious adverse events assessments were conducted at screening, baseline, days 1 and 15, and months 1,2,3,4,5 and 6" (pg 2) and "Safety assessment included recording of AEs, SAEs, hematology values, vital signs, results of dermatological and ophthalmological examinations and results of pulmonary and liver function tests" (Supplementary data online appendix) | Low | Categorisation of SAEs conformed to ICH guidelines (International Conference on Harmonisation of Technical Requirements for Registration of Pharmaceuticals for Human Use) |
AE: adverse event; CT: chest tomography; ECG: electrocardiography; FDA: Food and Drug Administration; SAE: serious adverse event
Allocation
We considered the method used to generate a random sequence and conceal allocation to be at low risk of bias in all trials except one; we judged Calabresi 2014 to be at unclear risk of bias.
Blinding
All included trials, except one open‐label trial were described as double‐blinded (Fox 2014). The drug in the treatment group was reported as identical in appearance to the drug in the control group. Assessors of clinical and radiological outcomes were reported as unaware of participants' assignment. We judged Fox 2014 to be at high risk of bias and the other trials to be at low risk of bias for blinding.
Incomplete outcome data
All trials provided a sufficient description of follow‐up and withdrawals. We judged three trials to be at high risk of attrition bias because significant differences in reasons of dropouts between treated and control groups were found ( Calabresi 2014 ; Fox 2014 ; Kappos 2010).
Selective reporting
We judged all trials to be at low risk of bias apart from Calabresi 2014, which we judged to be at unclear risk of bias as it did not report on clinically relevant results.
Other potential sources of bias
All trials were sponsored by Novartis Pharma. We judged four trials to be at high risk of bias because the study sponsor participated in conducting the study, or data analysis and some study co‐authors were affiliated to the pharmaceutical company (Calabresi 2014; Cohen 2010; Fox 2014; Kappos 2010) .
Further details are provided in relevant sections of the Characteristics of included studies tables and are presented as the 'Risk of bias' summary and 'Risk of bias' graph (Figure 2; Figure 3).

Risk of bias summary: review authors' judgements about each risk of bias item for each included study.

Risk of bias graph: review authors' judgements about each risk of bias item presented as percentages across all included studies.
Methods of adverse events monitoring
We judged the risk of bias regarding methods of adverse events monitoring to be low for all studies. We judged the risk of bias regarding methods of serious adverse events monitoring to be unclear for the Calabresi 2014 and for the Fox 2014 studies and low for four others (Table 3).
Effects of interventions
See: Summary of findings for the main comparison Fingolimod 0.5 mg versus placebo for relapsing‐remitting multiple sclerosis; Summary of findings 2 Fingolimod 0.5 mg versus interferon beta‐1a for relapsing‐remitting multiple sclerosis
We defined two main comparisons, one evaluating the effect of fingolimod versus placebo and one evaluating the effect of fingolimod versus intramuscular IFN‐beta 1a or other DMDs. For each comparison, we considered the effect of fingolimod separately for the approved dose (0.5 mg) and the other treatment schedules (1.25 mg and 5.0 mg).
We reported the main results concerning benefit and withdrawals due to adverse events of fingolimod at the approved dose of 0.5 mg compared to placebo at 24 months in summary of findings Table for the main comparison and compared to intramuscular interferon beta‐1a at 12 months in summary of findings Table 2.
Fingolimod compared to placebo
Primary Outcomes
The number of participants who were free from relapses during treatment with fingolimod 0.5 mg compared to placebo were retrieved from one trial (114 participants = 2.2%) at six months (Saida 2012), and two trials (1556 participants =30%) at 24 months (Calabresi 2014; Kappos 2010). At six months, there was a slight non‐significant benefit (risk ratio (RR) 1.22, 95% confidence interval (CI) 0.96 to 1.54) (Analysis 1.1). At 24 months the overall results indicated a benefit of fingolimod (RR 1.44, 95% CI 1.28 to 1.63; moderate quality evidence) (summary of findings Table for the main comparison; Analysis 1.3). The higher doses were effective at six months at 1.25 mg (RR 1.27, 95% CI 1.11 to 1.45) and 5 mg (RR 1.30, 95% CI 1.10 to 1.53) (Analysis 1.1), and at 24 months at 1.25 mg (RR 1.51, 95% CI 1.29 to 1.76) (Analysis 1.3).
Data from two trials were available to calculate the number of participants without disability worsening during the first 24 months of treatment with fingolimod compared to placebo (Calabresi 2014; Kappos 2010). The results indicated little or no difference of fingolimod at 0.5 mg (RR 1.07, 95% CI 1.02 to 1.11; low quality evidence) (summary of findings Table for the main comparison). Similar results were found when fingolimod was used at 1.25 mg (RR 1.08, 95% CI 1.03 to 1.12) (Analysis 2.2).
The number of participants who withdrew from the study because of adverse events with 0.5 mg of fingolimod compared to placebo was retrieved from two trials during the first six months (RR 2.00, 95% CI 0.53 to 7.61) (Kappos 2006; Saida 2012: Analysis 3.1); and two trials during the first 24 months of treatment (RR 1.42, 95% CI 0.89 to 2.25; very low quality evidence) (Calabresi 2014; Kappos 2010; summary of findings Table for the main comparison; Analysis 3.3). The risk of discontinuing 1.25 mg of fingolimod due to adverse events compared to placebo significantly increased at 24 months (RR 1.93, 95% CI 1.48 to 2,52) (Analysis 3.3).
Detailed descriptive data on the type of adverse events, as reported in the primary studies, are provided in Figure 4. It should be noted that infections, hypertension, and abnormal liver tests were more frequent in the fingolimod group than in the placebo group.
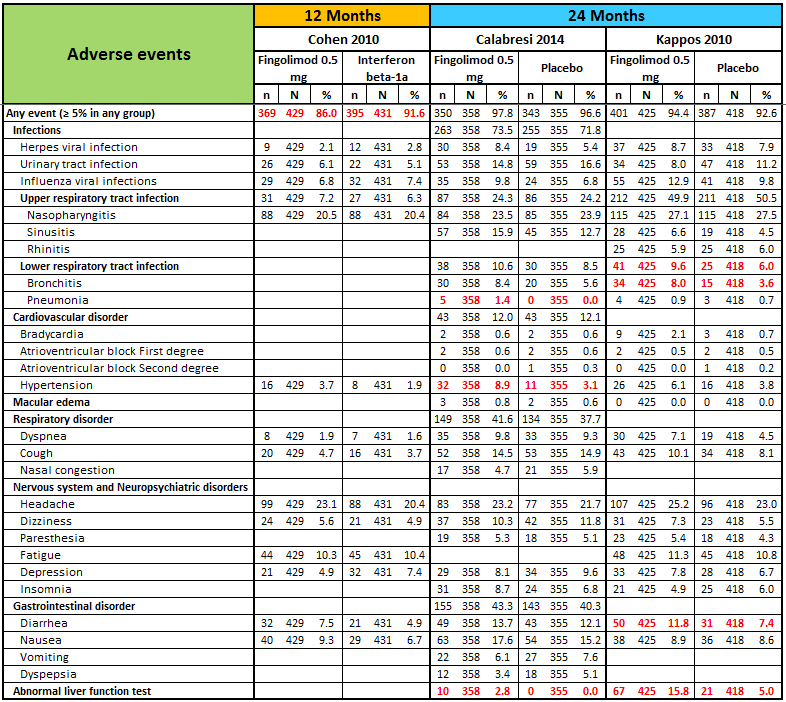
N, number of patients; n, number of events.
Significant differences (based on Fisher exact test) are reported in red.
The number of participants who withdrew because of serious adverse events were available from two trials at six months (Kappos 2006; Saida 2012), and two trials at 24 months (Calabresi 2014; Kappos 2010). No difference was found between placebo and fingolimod administered at 0.5 mg and 1.25 mg (Analysis 3.4; Analysis 3.6). A significant increased risk of discontinuation was found for fingolimod 5.0 mg versus placebo at six months (RR 2.77, 95% CI 1.04 to 7.38) (Analysis 3.4).
Detailed descriptive data on the type of serious adverse events, as reported in the primary studies, are provided in Figure 5. It should be noted that infections, basal‐cell carcinoma, and atrioventricular blocks were more frequent in the fingolimod group than in the placebo group.
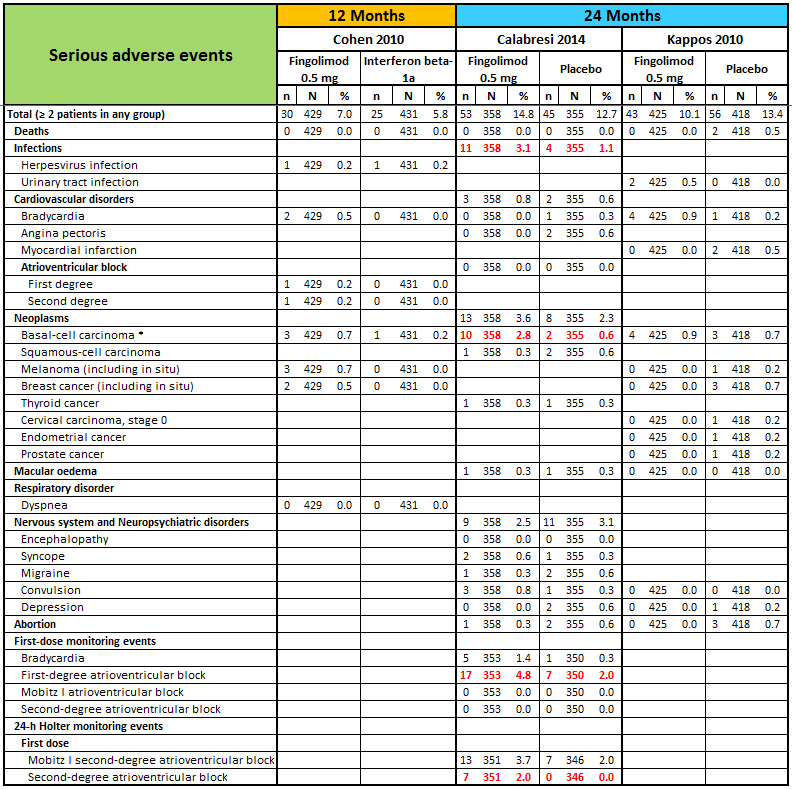
N, number of patients; n, number of events.
* One case of basal‐cell carcinoma was not reported as a serious adverse event by the site investigator (Calabresi 2014).
Significant differences (based on Fisher exact test) are reported in red.
The results regarding data analysed according to a likely scenario did not add any additional information (data not reported).
Secondary outcomes
The annualised relapse rate was evaluated by two trials at six months (Kappos 2006; Saida 2012), and two trials at 24 months (Calabresi 2014; Kappos 2010): at these time points the results favoured fingolimod 0.5 mg compared to placebo at six months (rate ratio 0.51, 95% CI 0.26 to 0.99; Analysis 4.1) and 24 months (rate ratio 0.50, 95% CI 0.40 to 0.62; moderate quality evidence) (summary of findings Table for the main comparison; Analysis 4.3). Similar data were found for higher doses (Analysis 4.1, Analysis 4.3).
The number of participants free from MRI gadolinium‐enhancing lesions was evaluated by four trials at six months (Calabresi 2014; Kappos 2006; Kappos 2010; Saida 2012; Analysis 5.1), two trials at 12 months (Calabresi 2014; Kappos 2010; Analysis 5.2), and two trials at 24 months (Calabresi 2014; Kappos 2010; Analysis 5.3). We found better results for fingolimod doses compared to placebo at each time point: fingolimod 0.5 mg at six months (RR 1.42, 95% CI 1.33 to 1.51); 0.5 mg at 12 months (RR 1.39, 95% CI 1.30 to 1.48); and 0.5 mg at 24 months (RR 1.36, 95% CI 1.27 to 1.45; low quality evidence) (summary of findings Table for the main comparison).
The mean change of MRI T2‐weighted lesion load was evaluated by one trial at 12 months (Kappos 2010): the results favoured fingolimod 0.5 mg compared to placebo (mean difference (MD) ‐15.30, 95% CI ‐24.34 to ‐6.26); similar data were found when fingolimod was used at 1.25 mg for 12 months (Analysis 6.1). At 24 months the results also favoured fingolimod 0.5 mg compared to placebo (MD ‐20.43, 95% CI ‐34.03 to ‐6.83); similar data were found for fingolimod 1.25 mg (Analysis 6.2).
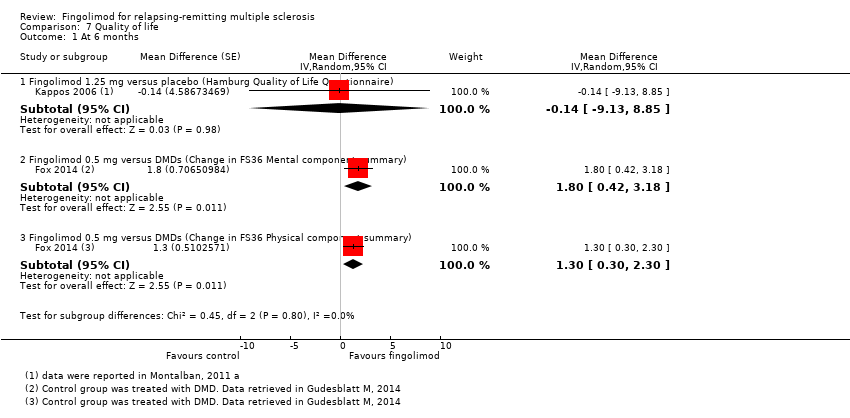
Quality of life was measured by the Hamburg Quality of Life Questionnarie in one trial at six months (Kappos 2006), and by the Euro quality of life scale (EQ‐5D) in one trial at 24 months (Calabresi 2014). No differences were found between fingolimod and placebo in either study (Analysis 7.1; Analysis 7.2).
Fingolimod compared to intramuscular interferon beta‐1a or other DMDs
Primary Outcomes
Data from one trial were available to evaluate the primary outcomes during the first 12 months of treatment with fingolimod 0.5 mg compared to intramuscular interferon beta‐1a (Cohen 2010).
The overall results (RR 1.18, 95% CI 1.09 to 1.27; moderate quality evidence) indicated a slight advantage for fingolimod 0.5 mg in favouring freedom from relapse (summary of findings Table 2). Similar results were found when fingolimod was used at 1.25 mg (RR 1.15, 95% CI 1.06 to 1.24) (Analysis 1.2).
The results indicated no difference in favouring freedom from disability worsening at 12 months between fingolimod 0.5 mg and intramuscular interferon beta‐1a (RR 1.02, 95% CI 0.99 to 1.06; low quality evidence) (summary of findings Table 2). Similar results were found when fingolimod was used at 1.25 mg (RR 1.01, 95% CI 0.98 to 1.05) (Analysis 2.1).
Compared to intramuscular interferon beta‐1a, the number of participants who withdrew due to adverse events was higher, but not significant for fingolimod 0.5 mg (RR 1.51, 95% CI 0.81 to 2.80; moderate quality evidence) (summary of findings Table 2). Significant risk was found when used at 1.25 mg (RR 2.69, 95% CI 1.54 to 4.72) (Analysis 3.2).
Compared to intramuscular interferon beta‐1a, the number of participants who withdrew due to serious adverse events was higher, but not significant for fingolimod 0.5 mg (RR 1.21, 95% CI 0.72 to 2.02), and significantly higher for fingolimod 1.25 mg (RR 1.85, 95% CI 1.15 to 2.96) (Analysis 3.5).
Data from one trial were available to calculate the number of participants who withdrew due to adverse events during the first six months (Fox 2014): the RR was significantly higher for fingolimod 0.5 mg compared to other DMDs (RR 3.21, 95% CI 1.16 to 8.86) (Analysis 3.1).
Data from the same trial showed that the number of participants who withdrew due to serious adverse events were higher with fingolimod 0.5 mg compared to other DMDs (Fox 2014), but the result was not significant (RR 2.71, 95% CI 0.83 to 8.88) (Analysis 3.4).
Detailed descriptive data on the type of adverse and serious adverse events are provided in Figure 4 and Figure 5, respectively. The higher incidence of adverse events in fingolimod versus interferon beta‐1a, suggests lower tolerability for fingolimod. It should be noted that hypertension was more frequent in participants taking fingolimod, and depression was more frequent in the interferon beta‐1a group.
Secondary outcomes
The annualised relapse rate was evaluated by one trial at 12 months (Cohen 2010). A significant benefit for fingolimod 0.5 mg (RR 0.48, 95% CI 0.34 to 0.70) and fingolimod 1.25 mg (RR 0.61, 95% CI 0.47 to 0.78) doses compared to intramuscular interferon beta‐1a was observed (Analysis 4.2).
The number of participants free from MRI gadolinium‐enhancing lesions at 12 months was evaluated by the same trial (Cohen 2010); a slight advantage for fingolimod 0.5 mg (RR 1.12, 95% CI 1.05 to 1.19) and fingolimod 1.25 mg (RR 1.13, 95% CI 1.06 to 1.20) compared to intramuscular interferon beta‐1a was observed (Analysis 5.2).
The mean change of MRI T2‐weighted lesion load at 12 months was evaluated by the same trial (Cohen 2010); we found no significant reduction for fingolimod 0.5 mg (MD ‐0.50, 95% CI ‐6.32 to 5.32) and fingolimod 1.25 mg (MD ‐3.70, 95% CI ‐9.18 to 1.78) doses compared to intramuscular interferon beta‐1a (Analysis 6.1).
Quality of life was measured at six months by the FS36 questionnaire in participants treated with fingolimod 0.5 mg compared to DMDs (Fox 2014). The results favoured fingolimod (Analysis 7.1).
Discussion
Summary of main results
Six RCTscontributed to this review. The overall population included 5152 participants; 3531 were randomly assigned to fingolimod (2061 of them treated with the approved dose of 0.5 mg daily) and 1621 controls, 923 treated with placebo and 698 with intramuscular interferon beta‐1a or other DMDs. The treatment duration was six months in three trials (Fox 2014; Kappos 2006; Saida 2012),12 months in one trial (Cohen 2010a), and 24 months in two trials (Calabresi 2014; Kappos 2010). All studies were sponsored by Novartis Pharma.
Fingolimod administered at the approved dose of 0.5 mg orally once‐daily is effective in increasing the number of people free from relapse (moderate quality of evidence) and from MRI gadolinium‐enhancing lesions (low quality of evidence), and in reducing the annualised relapse rate (moderate quality of evidence) at 24 months compared to placebo. A benefit on prevention of disability worsening was not observed (low quality of evidence). The risk of withdrawal due to adverse events was not significant (very low quality of evidence) (summary of findings Table for the main comparison). Furthermore, MRI T2‐weighted lesion load changes at 12 and 24 months favour fingolimod versus placebo.
A slight advantage of fingolimod at a dose of 0.5 mg compared to intramuscular interferon beta‐1a in increasing freedom from relapse and from gadolinium‐enhancing lesions at 12 months was observed (moderate quality of evidence). A benefit was found for other measures of clinical activity (relapse rate: moderate quality of evidence). No difference between the two active treatments was found regarding prevention of disability worsening at 12 months (low quality of evidence). The risk of withdrawal due to adverse events was not significant (moderate quality of evidence) (summary of findings Table 2) despite a worst tolerability due to the higher incidence of adverse events. Furthermore, no difference was observed regarding the mean change of MRI T2‐weighted lesion load at 12 months.
Overall completeness and applicability of evidence
All studies assessed the clinical and MRI outcomes selected for this review, except Fox 2014 who included only patient‐oriented outcomes. Participants were adults with relapsing‐remitting multiple sclerosis (RRMS), a high prestudy relapse frequency, low disability and disease duration over five years (Table 2).
The following four points, relevant for clinical practice, should be highlighted:
-
Measures of treatment response.
-
Worsening of disability.
-
Comparison with other active treatments.
-
Impact on quality of life.
-
The assessment of disease activity has been recently incorporated to redefine MS disease phenotypes (Lublin 2014). On the other hand, treatment expectations have evolved to include potential remission from MS symptoms to freedom from disease activity. We have chosen the number of participants without clinical (relapse and worsening of disability) and MRI (gadolinium‐enhancing lesions) events, as separate outcome measures. This is to underline the possible benefit from treatment. We have included a further MRI endpoint (total volume of abnormal T2‐hyperintensity) as a marker of disease severity (Lavery 2014). We have not included composite measures, such as, 'no evidence of disease activity' (NEDA), as they are not yet accepted as a primary outcome, and are of uncertain prognostic value (Giovannoni 2015; Rotstein 2015). Only post–hoc analysis concerning NEDA on pooled fingolimod trial populations has been published (Kappos 2015b; Nixon 2014), and useful data in the primary studies were lacking.
-
We did not find substantial evidence that fingolimod modified the risk of disability worsening, in spite of efficacy for inflammatory disease activity. We considered disability worsening as confirmed at six months follow‐up. Using less stringent criteria (three months), Calabresi 2014 and Kappos 2010 found that fingolimod was effective over the 24‐month period; however, this result may be related to reversible relapse‐related disability accrual. Dissociation between relapse and disability worsening is well documented during the natural course of the disease (Scalfari 2010; Scalfari 2013). On the other hand, meaningful changes might be difficult to detect using the outcomes currently approved to measure clinical disability, mainly in the early stages of the disease, and after a short treatment period (Cohen 2012; Lavery 2014). A divergent effect might also occur when different pathogenetic mechanisms occur (degenerative and inflammatory). In fact, no effect on progressive MS has been reported (Lublin 2016; Novartis 2016).
-
We only included one comparison concerning clinical and MRI outcomes in this review, i.e. fingolimod versus intramuscular interferon beta‐1a. We will evaluate ongoing trials of fingolimod compared to other approved DMDs in future updates of the review.
-
We did not find any benefit for fingolimod for quality of life in people with RRMS over two years of therapy, in comparison to placebo (Analysis 7.2). This result is relevant considering the expectation of oral therapy after the era of injectable drugs; following the introduction of fingolimod, patients with RRMS have switched to this drug rather than any other therapies, and they did so for convenience (Warrender‐Sparkes 2015). Type of scales and assessment methods used to measure quality of life in the included studies might have influenced the estimated effect of fingolimod for this outcome (Table 1).
The following limitations of the review need to be highlighted: .
-
The duration of the included trials was equal to or less than 24 months. Extension studies have been reported, but in most of them placebo‐treated participants switched to the fingolimod group. We excluded open‐label extension studies in this review.
-
The influence of patients' baseline characteristics on the effect of fingolimod was not explored due to lack of useful data in the included trials. Contradictory data are available in the literature. For example, one article reported that response to fingolimod was associated with patients' baseline high relapse frequency (Oh J 2013). A post‐hoc subgroup analysis of the FREEDOM study (Kappos 2010), reported lack of benefit of fingolimod on the relapse rate for people with MS older than 40 years and on disability worsening for those with baseline expanded disability status scale (EDSS) less than 3.5 score (Devonshire 2012). Fingolimod was found to be superior to intramuscular interferon beta‐1a in all subgroups defined by demographic factors or baseline disease characteristics (Cohen 2013). Another study reported that fingolimod demonstrated similar efficacy in patients with RRMS regardless of prior treatment history (Kremenchutzky 2014).
-
People with systemic disorders were excluded in all included trials, while in the real world comorbidity is frequent. Precautions and new recommendations need to be followed before and after starting treatment, or when restarting treatment with fingolimod (EMA 2011; EMA 2015).
-
We did not plan to explore safety outcomes beyond the duration of primary RCTs. The Food and Drug Administration (FDA) required planning of two studies (FDA 2010):
-
A post‐marketing observational prospective, parallel cohort study in relapsing multiple sclerosis patients to assess the potentially serious risk of: eye toxicity, cardiac and vascular toxicity, pulmonary toxicity, seizures, serious and opportunistic infections, malignancies, liver toxicity and atypical multiple sclerosis relapse. Specific outcomes examined should include, but not be limited to, macular oedema, symptomatic bradycardia, second and third degree atrioventricular block, and lymphoma. Final Report Submission: 15 December, 2020.
-
Develop and maintain a prospective, observational pregnancy exposure registry study conducted in the United States. Final Report Submission: 31 October, 2017.
-
At 31 October, 2011, 89 pregnancies were reported in completed or ongoing clinical studies, with 74 pregnancies in fingolimod treatment arms. Of 66 pregnancies with in utero exposure to fingolimod, there were 28 live births, nine spontaneous abortions, 24 elective abortions (one case each of tetralogy of Fallot, spontaneous intrauterine death, and failure of fetal development), two infants were born with malformations (one with congenital unilateral posteromedial bowing of the tibia and one with acrania). There were five cases (7.6%) of abnormal fetal development in the 66 pregnancies. Considering also the known risk of teratogenicity in animals, women of childbearing potential should use effective contraception during fingolimod therapy and for two months after treatment discontinuation (Karlsson 2014).
Quality of the evidence
We downgraded the quality of the evidence for all included outcomes at 24 months due to significant differences in reasons of incomplete outcome data between fingolimod 0.5 mg and placebo groups. We further downgraded the quality of evidence for disability worsening, withdrawals due to adverse events, and MRI gadolinium‐enhancing lesions due to insufficient information size and wide confidence intervals. We further downgraded the quality of evidence for withdrawals due to inconsistency. Overall we gave a GRADE rating of moderate for relapses, low for disability progression, very low for withdrawals due to adverse events, and low for MRI gadolinium‐enhancing lesions .
We downgraded the quality of the evidence for all included outcomes at 12 months due to insufficient information size between the fingolimod 0.5 mg and intramuscular interferon beta‐1a groups in Cohen 2010, resulting in moderate quality evidence. We further downgraded the quality of evidence for disability worsening because this study required only three months’ follow‐up to confirm sustained disability worsening. Although we had to accept the definition given in the original paper, we assessed this definition as unreliable in capturing unremitting disability worsening.
Potential biases in the review process
The search strategy for the trials, and contacts initiated with the main investigators, suggest the likelihood that we identified all relevant studies and obtained all relevant data.
Agreements and disagreements with other studies or reviews
Previous reviews on fingolimod as compared with placebo or other approved DMDs in RRMS have been published, but only descriptive data have been reported (Ali 2013; Doggrell 2010; Fox 2012; Gajofatto 2015; Gold 2011; Oh J 2013).
Other reviews have used a structured methodology, including network meta‐analysis, but they have considered a low number of RCTs, with different and limited endpoints. A systematic non‐Cochrane review assessed the efficacy and safety of fingolimod at different doses (Bao 2012); it was based on three RCTs published up to 2010. The results showed that fingolimod was safe and effective in treating RRMS, considering clinical and MRI (incidence rate of so‐called "intense lesion" on T2‐weighted) endpoints.
One review evaluated the comparative effects of fingolimod versus other DMDs using network meta‐analysis. It included ten studies, two of them assessing the effects of fingolimod (Del Santo 2011). The endpoint was limited to the relapse‐free rate at 12 months. The results suggested that fingolimod was superior to interferon beta‐1a (direct comparison) and glatiramer (indirect comparison) in terms of prevention of relapse at 12 months follow‐up.
The results of a Cochrane review evaluating the effect of immunomodulators and immunosuppressants in people with RRMS using network meta‐analysis, demonstrated that alemtuzumab, natalizumab, and fingolimod are the best choices against the recurrence of relapses, but the evidence was limited to the first 24 months of follow‐up (Tramacere 2015).

Study flow diagram.

Risk of bias summary: review authors' judgements about each risk of bias item for each included study.
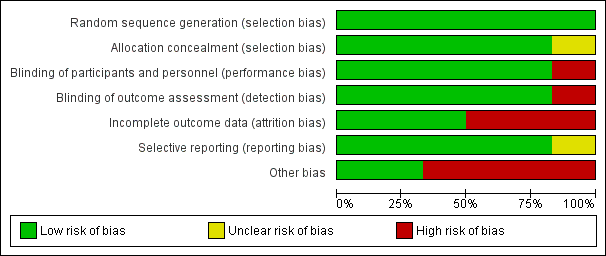
Risk of bias graph: review authors' judgements about each risk of bias item presented as percentages across all included studies.

N, number of patients; n, number of events.
Significant differences (based on Fisher exact test) are reported in red.

N, number of patients; n, number of events.
* One case of basal‐cell carcinoma was not reported as a serious adverse event by the site investigator (Calabresi 2014).
Significant differences (based on Fisher exact test) are reported in red.

Comparison 1 Participants free from relapse, Outcome 1 At 6 months.
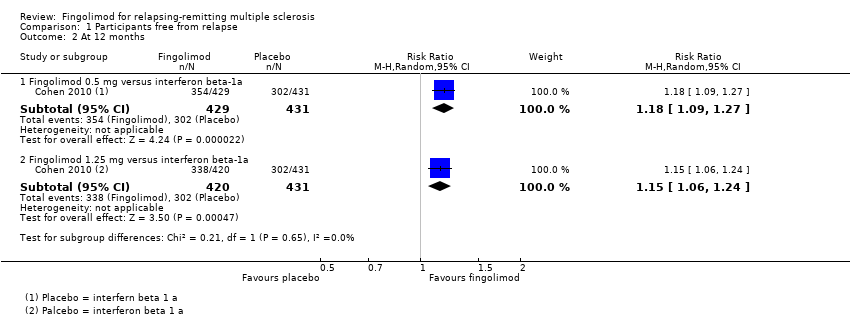
Comparison 1 Participants free from relapse, Outcome 2 At 12 months.

Comparison 1 Participants free from relapse, Outcome 3 At 24 months.

Comparison 2 Participants free from disability worsening, Outcome 1 At 12 months.

Comparison 2 Participants free from disability worsening, Outcome 2 At 24 months.
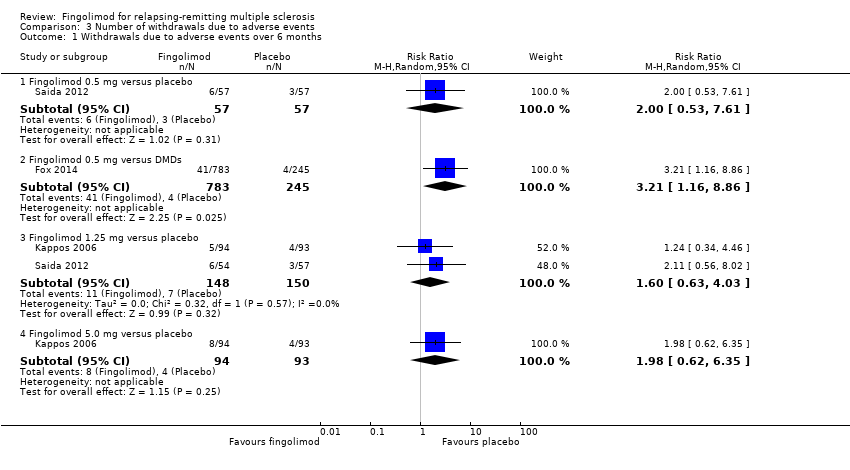
Comparison 3 Number of withdrawals due to adverse events, Outcome 1 Withdrawals due to adverse events over 6 months.

Comparison 3 Number of withdrawals due to adverse events, Outcome 2 Withdrawals due to adverse events over 12 months.

Comparison 3 Number of withdrawals due to adverse events, Outcome 3 Withdrawals due to adverse events over 24 months.

Comparison 3 Number of withdrawals due to adverse events, Outcome 4 Withdrawals due to serious adverse events over 6 months.

Comparison 3 Number of withdrawals due to adverse events, Outcome 5 Withdrawals due to serious adverse events over 12 months.

Comparison 3 Number of withdrawals due to adverse events, Outcome 6 Withdrawals due to serious adverse events over 24 months.
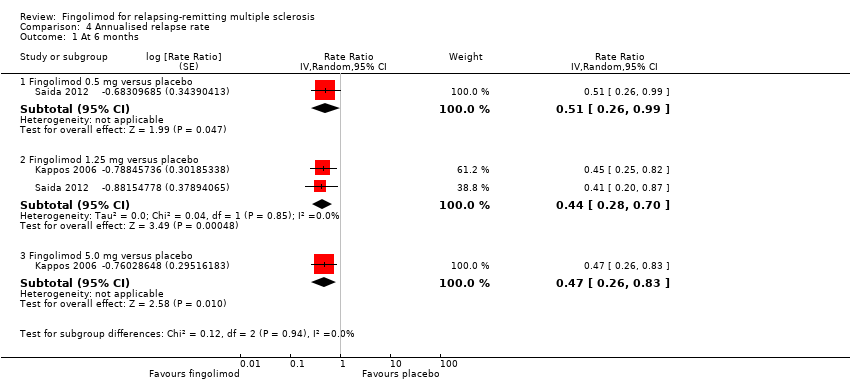
Comparison 4 Annualised relapse rate, Outcome 1 At 6 months.

Comparison 4 Annualised relapse rate, Outcome 2 At 12 months.

Comparison 4 Annualised relapse rate, Outcome 3 At 24 months.

Comparison 5 Participants free from gadolinium‐enhancing lesions, Outcome 1 At 6 months.
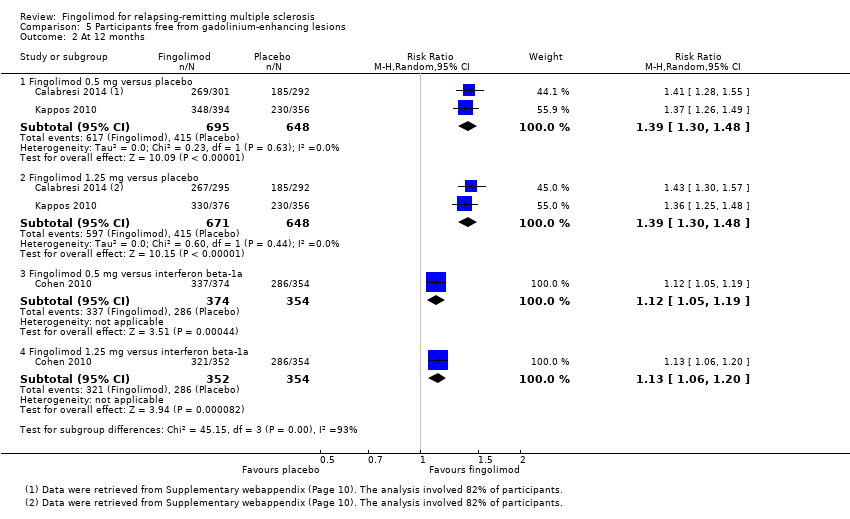
Comparison 5 Participants free from gadolinium‐enhancing lesions, Outcome 2 At 12 months.
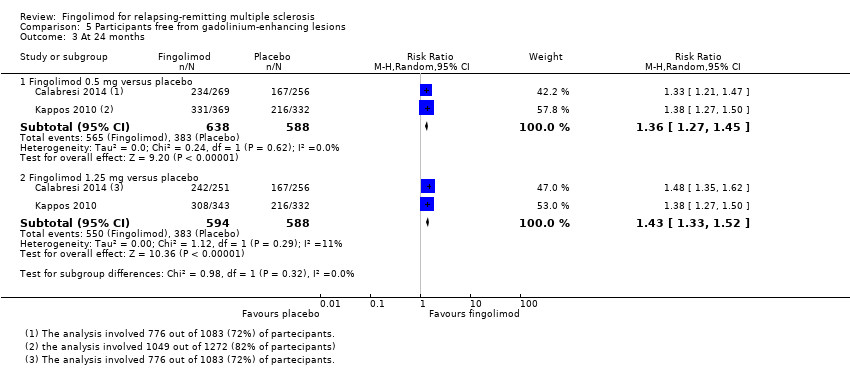
Comparison 5 Participants free from gadolinium‐enhancing lesions, Outcome 3 At 24 months.

Comparison 6 Mean change of MRI T2‐weighted lesion load, Outcome 1 At 12 months.

Comparison 6 Mean change of MRI T2‐weighted lesion load, Outcome 2 At 24 months.
Comparison 7 Quality of life, Outcome 1 At 6 months.

Comparison 7 Quality of life, Outcome 2 At 24 months.
| Fingolimod 0.5 mg versus placebo for relapsing‐remitting multiple sclerosis | |||||
| Participants or population: people with relapsing‐remitting multiple sclerosis | |||||
| Outcomes at 24 months | Illustrative comparative risks* (95% CI) | Relative effect | No. of Participants | Quality of the evidence | |
| Assumed risk | Corresponding risk | ||||
| Control (placebo) | Fingolimod 0.5 mg | ||||
| Participants free from relapse | 49 per 100 | 70 per 100 | RR 1.44 | 1556 | ⊕⊕⊕⊝ |
| Participants free from disability worsening | 82 per 100 | 87 per 100 | RR 1.07 | 1556 | ⊕⊕⊝⊝ |
| Withdrawals due to adverse events | 9 per 100 | 13 per 100 | RR 1.42 | 1556 | ⊕⊝⊝⊝ |
| Annualised relapse rate | ‐ | ‐ | Rate ratio 0.50 | 1556 | ⊕⊕⊕⊝ |
| Participants free from MRI gadolinium‐enhancing lesions | 65 per 100 | 89 per 100 | RR 1.36 | 1226 | ⊕⊕⊝⊝ |
| *For dichotomous outcomes, the corresponding risk with fingolimod 0.5 mg (and its 95% CI) is based on the assumed risk with the control group (i.e. the mean proportion of events in the control group across the two studies) and the relative effect of fingolimod (and its 95% CI). For the annualised relapse rate, only the relative effect (i.e., the rate ratio) is given, because the assumed risk with the control group is not estimable. | |||||
| GRADE Working Group grades of evidence | |||||
| a Study limitations: significant differences in reasons for incomplete outcome data between treatment and control groups. | |||||
| Fingolimod 0.5 mg versus intramuscular interferon beta‐1a for relapsing‐remitting multiple sclerosis | |||||
| Participants or population: people with relapsing‐remitting multiple sclerosis | |||||
| Outcomes at 12 months | Illustrative comparative risks* (95% CI) | Relative effect | No. of Participants | Quality of the evidence | |
| Assumed risk | Corresponding risk | ||||
| Control (interferon beta‐1a) | Fingolimod 0.5 mg | ||||
| Participants free from relapse | 70 per 100 | 83 per 100 | RR 1.18 | 860 | ⊕⊕⊕⊝ |
| Participants free from disability worsening | 92 per 100 | 94 per 100 | RR 1.02 | 860 | ⊕⊕⊝⊝ |
| Withdrawals due to adverse events | 4 per 100 | 6 per 100 | RR 1.51 | 860 | ⊕⊕⊕⊝ |
| Annualised relapse rate | ‐ | ‐ | Rate ratio 0.48 | 860 | ⊕⊕⊕⊝ |
| Participants free from MRI gadolinium‐enhancing lesions | 81 per 100 | 90 per 100 | RR 1.12 | 728 | ⊕⊕⊕⊝ |
| *For dichotomous outcomes, the corresponding risk with the intervention (and its 95% CI) is based on the assumed risk with the control (i.e. the mean proportion of events in the control group across studies) and the relative effect of the intervention (and its 95% CI). For the annualised relapse rate, only the relative effect (i.e., the rate ratio) is given. | |||||
| GRADE Working Group grades of evidence | |||||
| a Imprecision: total number of events (i.e. the number of participants with disability worsening/gadolinium‐enhancing lesions) was less than 300 (the threshold rule‐of‐thumb value), and thus the available evidence did not meet the optimal information size criteria. b Indirectness: surrogate outcome (progression confirmed at three months of follow‐up). | |||||
| Study name | Clinical outcomes | Time point assessment | MRI outcomes | Time point assessment |
| 1.Annualised relapse rate 2. Time to disability progression confirmed at 3 months 3. Time to disability progression confirmed at 6 months 4. Safety 5. Time to first relapse 6. Proportion of relapse‐free participants 7. Change from baseline to the end of study on the MSFC score 8. Quality of life using the Euro quality of life scale (EQ‐5D) 9. Patient Reported Indices in Multiple Sclerosis 10. Fatigue using the Modified Fatigue Impact Scale | 24 months | 1.Percent brain‐volume change from baseline at 24 months 2.Number and volume of gadolinium‐enhancing T1 lesions 3. Number of new or newly enlarged T2 lesions 4. Proportion of participants free of gadolinium‐enhancing T1 lesions 5. Proportion of participants free of new or newly enlarged T2 lesions 6. Proportion of participants free of new inflammatory activity (no gadolinium‐enhancing T1 lesions and no new or newly enlarged T2 lesions) 7. Percentage change from baseline in volume of gadolinium‐enhanced T1 lesions 8. Percentage change from baseline in volume of new or newly enlarged T2 lesions 9. Brain volume | 24 months | |
| 1. Annualised relapse rate 2. Progression of disability (confirmed at 3 months) | 12 months | Number of new or enlarged lesions on T2‐weighted scans | 12 months | |
| 1. Treatment satisfaction 2. Fatigue 3. Depression 4. Activities of daily living 5. Health‐related Quality Of Life 6, Side effects | 6 months | Not included | ||
| 1. Number of participants remaining free of relapse 2. Annualised relapse rate 3, Time to the first relapse | 6 months | 1.Number of gadolinium‐enhanced lesions per participant recorded on T1‐weighted MRI at monthly intervals for 6 months 2.Total volume of gadolinium‐enhanced lesions per participants 3. Proportion of participants with gadolinium‐enhanced lesions 4. Total number of new lesion per participant on T‐weighted images 5. Changes in lesion volume on T2‐weighted images 6. Brain volume from baseline to month 6 | 6 months | |
| 1. Annualised relapse rate 2. Time to confirmed disability progression (confirmed after 3 months ) 3. Time to a first relapse 4. Time to disability progression (confirmed after 6 months) 5. Changes in the EDSS score 6. Changes in the MSFC z score between baseline and 24 months | 24 months | 1. Number of gadolinium‐enhancing lesions 2. Proportion of participants free from gadolinium‐enhancing lesions 3. Number of new or enlarged lesions on T2‐weighted MRI scans 4. Proportion of participants free from new or enlarged lesions on T2‐weighted scan 5. Volumes of hyperintense lesions on T2‐weighted scan 6. Volumes of hypointense lesions on T1‐weighted scans 7. Change in brain volume between baseline and 24 months 8. Safety and tolerability measures | 24 months | |
| Percentage of participants free from relapse | 6 months | Participants free from gadolinium‐enhancing lesions | 6 months | |
| EDSS: Expanded Disability Status Scale; MSFC: Multiple Sclerosis Functional Composite The primary outcome of each study is underlined | ||||
| Study name | Drugs | No. participants | Female (%) | Course of disease of RR‐SP (%) | Age, years, mean (SD) | Mean EDSS score (SD) | Disease duration, mean (SD) | Pre‐1 year number of relapses, mean (SD) | Percentage of pre‐study treatment‐naive participants | Percentage of participants with MRI enhancing lesions | Mean lesion volume on T2‐weighted images (mm3 ) (SD) |
| Placebo | 355 | 81 | 100 ‐ 0 | 40·1 (8·4) | 2·2 (1·5) | 10·6 (7·9) | 1·5 (0·9) | 27 | 36 | 5553 (7841) | |
| Fingolimod 0.5 mg | 358 | 77 | 100 ‐ 0 | 40·6 (8·4) | 2·2 (1·4) | 10·4 (8·0) | 1·4 (0·9) | 26 | 39 | 5484 (8000) | |
| Fingolimod 1.25 mg | 370 | 76 | 100 ‐ 0 | 40·9 (8·9) | 2·3 (2·0) | 10·8 (8·2) | 1·5 (1·0) | 22 | 31 | 4936 (7286) | |
| Interferon beta‐1a (Avonex) | 435 | 67.8 | 100 ‐ 0 | 36.0 (8.3) | 2.19 (1.26) | 7.4 (6.3) | 1.5 (0.8) | 43.7 | 36.9 | 4924 (5711) | |
| Fingolimod 0.5 mg | 431 | 65.4 | 100 ‐ 0 | 36.7 (8.8) | 2.24 (1.33) | 7.5 (6.2) | 1.5 (1.2) | 44.8 | 32.6 | 5170 (6642) | |
| Fingolimod 1.25 mg | 426 | 68.8 | 100 ‐ 0 | 35.8 (8.4) | 2.21 (1.31) | 7.3 (6.0) | 1.5 (0.9) | 41.5 | 34.5 | 5085 (5962) | |
| DMD§ | 263 | 79.1 | 100 ‐ 0 | 45.1 (9.82) | 2.4 (1.32) | 11.7 (8.44) | 0.8 (1.32) | 0 | NR | NR | |
| Fingolimod 0.5 mg | 790 | 76.1 | 100 ‐ 0 | 46.0 (9.82) | 2.4 (1.32) | 12.1 (8.38) | 0.8 (1.20) | 0 | NR | NR | |
| Placebo | 93 | 66 | 90 ‐ 10 | 37.1 (19‐56)* | 2.6 (0.0‐6.5)* | 8.4 (0.2‐28.2)* | 1.2 (0‐5)* | NR | 51 | 8805 (123‐62,218)* | |
| Fingolimod 1.25 mg | 94 | 75 | 89 ‐ 11 | 38.0 (19‐60)* | 2.7 (0.0‐6.0)* | 8.6 (0.3‐50.2)* | 1.3 (0‐5)* | NR | 47 | 10,219 (293‐104,504)* | |
| Fingolimod 5.0 mg | 94 | 71 | 87 ‐ 13 | 38.3 (18‐59)* | 2.5 (0.0‐6.0)* | 9.5 (0.5‐42.2)* | 1.3 (0‐4)* | NR | 57 | 8722 (349‐70,218)* | |
| Placebo | 418 | 71.3 | 100 ‐ 0 | 37.2 (8.6) | 2.5 (1.3) | 8.1 (6.4) | 1.4 (0.7) | 59.6 | 37 | 6162 (7085) | |
| Fingolimod 0.5 mg | 425 | 69.6 | 100 ‐ 0 | 36.6 (8.8) | 2.3 (1.3) | 8.0 (6.6) | 1.5 (0.8) | 57.4 | 38 | 6128 (7623) | |
| Fingolimod 1.25 mg | 429 | 68.8 | 100 ‐ 0 | 37.4 (8.9) | 2.4 (1.4) | 8.4 (6.9) | 1.5 (0.8) | 60.4 | 39.4 | 6829 (8491) | |
| Placebo | 57 | 68.4 | 100 ‐ 0 | 35.0 (8.9) | 2.1 (1.7) | 8.2 (7.3) | 1.7 (1.6) | NR | 42.1 | 31.6 (22.6)** | |
| Fingolimod 0.5 mg | 57 | 70.2 | 94.7 ‐ 5.3 | 35.0 (9.0) | 2.3 (1.9) | 8.2 (6.8) | 1.4 (1.0) | NR | 42.1 | 30.4 (22.7)** | |
| Fingolimod 1.25 mg | 57 | 68.4 | 98.2 ‐ 1.8 | 36.0 (9.3) | 1.8 (1.7) | 7.1 (5.3) | 1.5 (0.9) | NR | 49.1 | 31.7 (23.3)** | |
| DMD: disease‐modifying drug;EDSS: Expanded Disability Status Scale; MRI: magnetic resonance imaging; NR: not reported; RR: relapsing‐remitting; SD: standard deviation; SP: secondary progressive * Range (SD was not provided) | |||||||||||
| Study name | Risk of bias | Did the researchers actively monitor for adverse events (AEs) (low risk of bias) or did they simply provide spontaneous reporting of AEs that arose (high risk of bias)? | Risk of bias | Did the authors define serious AEs (SAEs) according to an accepted international classification and report the number of SAEs? |
| Low | "We did extensive safety and tolerability assessments, in part as a response to preclinical safety concerns raised by the FDA and additional safety areas of interest identified in previous phase 2 and earlier clinical studies. We also recorded adverse events, serious adverse events, serious adverse events of special interest, 24 h Holter electrocardiography (ECG) post first‐dose and at 3 months, first‐dose bradycardia events, infections, laboratory tests, vital signs, ECG, echocardiography, pulmonary function. tests, chest high‐resolution CT,chest radiographs, ophthalmic examinations, including serial optical coherence tomography, and dermatological assessments." Clinical assessments were performed at screening and at randomisation (baseline), and study visits, including safety assessments, were scheduled at 2 weeks and 1, 2, 3, 6, 9, 12, 15, 18, 21, and 24 months after randomisation" | Unclear | "We also recorded adverse events, serious adverse events, serious adverse events of special interest, 24 h Holter electrocardiography (ECG) post fist‐dose and at 3 months, first‐dose bradycardia events, infections, laboratory tests, vital signs, ECG, echocardiography, pulmonary function tests, chest high‐resolution CT,chest radiographs, ophthalmic examinations, including serial optical coherence tomography, and dermatological assessments" | |
| Low | "An independent data and safety monitoring board evaluated overall safety in the fingolimod phase 3 program" and "Safety assessments were conducted during screening, at baseline, and at months 1, 2, 3, 6, 9, and 12" (pg 404) | Low | SAEs were predefined per standard criteria (death, life‐threatening event, persistent disability, congenital defect, unplanned hospitalisation, or otherwise medically significant) (FDA 2010 Clinical review of safety pg 151) | |
| Low | "Safety and tolerability (secondary study objectives) were assessed via reporting of | Unclear | Not specified | |
| Low | "An independent external data and safety monitoring board evaluated adverse events and other safety data" and "Adverse events were assessed and reported at each visit (scheduled and unscheduled) by the treating physicians. Laboratory evaluations were undertaken at a central laboratory". "Vital signs were obtained at each visit, and laboratory and hematologic measures were obtained at baseline, day 1, and months 1,3,6,9, and 12. Electrocardiograms were obtained at baseline, on days 1 and 7, and at months 1,3,6,12, and 24 hour Holter electrocardiographic monitoring was performed at selected sites at baseline, day 1, and month 3. Pulmonary function tests... were performed at screening and months 6 and 12" (pg 1126) | Low | Categorisation of SAEs conformed to ICH guidelines (International Conference on Harmonisation of Technical Requirements for Registration of Pharmaceuticals for Human Use) | |
| Low | "An independent data and safety monitoring board evaluated the safety" and "Study visits, including safety assessments, were scheduled at 2 weeks and 1, 2, 3, 6, 9, 12, 15, 18, 21, and 24 months after randomization" (pg 389) | Low | SAEs were predefined per standard criteria (death, life‐threatening event, persistent disability, congenital defect, unplanned hospitalisation, or otherwise medically significant) (FDA 2010 Clinical review of safety pg 151) | |
| Low | "Adverse events, serious adverse events assessments were conducted at screening, baseline, days 1 and 15, and months 1,2,3,4,5 and 6" (pg 2) and "Safety assessment included recording of AEs, SAEs, hematology values, vital signs, results of dermatological and ophthalmological examinations and results of pulmonary and liver function tests" (Supplementary data online appendix) | Low | Categorisation of SAEs conformed to ICH guidelines (International Conference on Harmonisation of Technical Requirements for Registration of Pharmaceuticals for Human Use) | |
| AE: adverse event; CT: chest tomography; ECG: electrocardiography; FDA: Food and Drug Administration; SAE: serious adverse event | ||||
| Outcome or subgroup title | No. of studies | No. of participants | Statistical method | Effect size |
| 1 At 6 months Show forest plot | 2 | Risk Ratio (M‐H, Random, 95% CI) | Subtotals only | |
| 1.1 Fingolimod 0.5 mg versus placebo | 1 | 114 | Risk Ratio (M‐H, Random, 95% CI) | 1.22 [0.96, 1.54] |
| 1.2 Fingolimod 1.25 mg versus placebo | 2 | 299 | Risk Ratio (M‐H, Random, 95% CI) | 1.27 [1.11, 1.45] |
| 1.3 Fingolimod 5.0 mg versus placebo | 1 | 184 | Risk Ratio (M‐H, Random, 95% CI) | 1.30 [1.10, 1.53] |
| 2 At 12 months Show forest plot | 1 | Risk Ratio (M‐H, Random, 95% CI) | Subtotals only | |
| 2.1 Fingolimod 0.5 mg versus interferon beta‐1a | 1 | 860 | Risk Ratio (M‐H, Random, 95% CI) | 1.18 [1.09, 1.27] |
| 2.2 Fingolimod 1.25 mg versus interferon beta‐1a | 1 | 851 | Risk Ratio (M‐H, Random, 95% CI) | 1.15 [1.06, 1.24] |
| 3 At 24 months Show forest plot | 2 | Risk Ratio (M‐H, Random, 95% CI) | Subtotals only | |
| 3.1 Fingolimod 0.5 mg versus placebo | 2 | 1556 | Risk Ratio (M‐H, Random, 95% CI) | 1.44 [1.28, 1.63] |
| 3.2 Fingolimod 1.25 mg versus placebo | 2 | 1572 | Risk Ratio (M‐H, Random, 95% CI) | 1.51 [1.29, 1.76] |
| Outcome or subgroup title | No. of studies | No. of participants | Statistical method | Effect size |
| 1 At 12 months Show forest plot | 1 | Risk Ratio (M‐H, Random, 95% CI) | Subtotals only | |
| 1.1 Fingolimod 0.5 mg versus interferon beta‐1a | 1 | 860 | Risk Ratio (M‐H, Random, 95% CI) | 1.02 [0.99, 1.06] |
| 1.2 Fingolimod 1.25 mg versus interferon beta‐1a | 1 | 851 | Risk Ratio (M‐H, Random, 95% CI) | 1.01 [0.98, 1.05] |
| 2 At 24 months Show forest plot | 2 | Risk Ratio (M‐H, Random, 95% CI) | Subtotals only | |
| 2.1 Fingolimod 0.5 mg versus placebo | 2 | 1556 | Risk Ratio (M‐H, Random, 95% CI) | 1.07 [1.02, 1.11] |
| 2.2 Fingolimod 1.25 mg versus placebo | 2 | 1572 | Risk Ratio (M‐H, Random, 95% CI) | 1.08 [1.03, 1.12] |
| Outcome or subgroup title | No. of studies | No. of participants | Statistical method | Effect size |
| 1 Withdrawals due to adverse events over 6 months Show forest plot | 3 | Risk Ratio (M‐H, Random, 95% CI) | Subtotals only | |
| 1.1 Fingolimod 0.5 mg versus placebo | 1 | 114 | Risk Ratio (M‐H, Random, 95% CI) | 2.0 [0.53, 7.61] |
| 1.2 Fingolimod 0.5 mg versus DMDs | 1 | 1028 | Risk Ratio (M‐H, Random, 95% CI) | 3.21 [1.16, 8.86] |
| 1.3 Fingolimod 1.25 mg versus placebo | 2 | 298 | Risk Ratio (M‐H, Random, 95% CI) | 1.60 [0.63, 4.03] |
| 1.4 Fingolimod 5.0 mg versus placebo | 1 | 187 | Risk Ratio (M‐H, Random, 95% CI) | 1.98 [0.62, 6.35] |
| 2 Withdrawals due to adverse events over 12 months Show forest plot | 1 | Risk Ratio (M‐H, Random, 95% CI) | Subtotals only | |
| 2.1 Fingolimod 0.5 mg versus interferon beta‐1a | 1 | 860 | Risk Ratio (M‐H, Random, 95% CI) | 1.51 [0.81, 2.80] |
| 2.2 Fingolimod 1.25 mg versus interferon beta‐1a | 1 | 851 | Risk Ratio (M‐H, Random, 95% CI) | 2.69 [1.54, 4.72] |
| 3 Withdrawals due to adverse events over 24 months Show forest plot | 2 | Risk Ratio (M‐H, Random, 95% CI) | Subtotals only | |
| 3.1 Fingolimod 0.5 mg versus placebo | 2 | 1556 | Risk Ratio (M‐H, Random, 95% CI) | 1.42 [0.89, 2.25] |
| 3.2 Fingolimod 1.25 mg versus placebo | 2 | 1572 | Risk Ratio (M‐H, Random, 95% CI) | 1.93 [1.48, 2.52] |
| 4 Withdrawals due to serious adverse events over 6 months Show forest plot | 3 | Risk Ratio (M‐H, Random, 95% CI) | Subtotals only | |
| 4.1 Fingolimod 0.5 mg versus placebo | 1 | 114 | Risk Ratio (M‐H, Random, 95% CI) | 1.67 [0.42, 6.65] |
| 4.2 Fingolimod 0.5 mg versus DMDs | 1 | 1028 | Risk Ratio (M‐H, Random, 95% CI) | 2.71 [0.83, 8.88] |
| 4.3 Fingolimod 1.25 mg versus placebo | 2 | 298 | Risk Ratio (M‐H, Random, 95% CI) | 2.36 [0.99, 5.66] |
| 4.4 Fingolimod 5.0 mg versus placebo | 1 | 187 | Risk Ratio (M‐H, Random, 95% CI) | 2.77 [1.04, 7.38] |
| 5 Withdrawals due to serious adverse events over 12 months Show forest plot | 1 | Risk Ratio (M‐H, Random, 95% CI) | Subtotals only | |
| 5.1 Fingolimod 0.5 mg versus interferon beta‐1a | 1 | 860 | Risk Ratio (M‐H, Random, 95% CI) | 1.21 [0.72, 2.02] |
| 5.2 Fingolimod 1.25 mg versus interferon beta‐1a | 1 | 851 | Risk Ratio (M‐H, Random, 95% CI) | 1.85 [1.15, 2.96] |
| 6 Withdrawals due to serious adverse events over 24 months Show forest plot | 2 | Risk Ratio (M‐H, Random, 95% CI) | Subtotals only | |
| 6.1 Fingolimod 0.5 mg versus placebo | 2 | 1556 | Risk Ratio (M‐H, Random, 95% CI) | 0.91 [0.55, 1.50] |
| 6.2 Fingolimod 1.25 mg versus placebo | 2 | 1572 | Risk Ratio (M‐H, Random, 95% CI) | 0.98 [0.74, 1.29] |
| Outcome or subgroup title | No. of studies | No. of participants | Statistical method | Effect size |
| 1 At 6 months Show forest plot | 2 | Rate Ratio (Random, 95% CI) | Subtotals only | |
| 1.1 Fingolimod 0.5 mg versus placebo | 1 | Rate Ratio (Random, 95% CI) | 0.51 [0.26, 0.99] | |
| 1.2 Fingolimod 1.25 mg versus placebo | 2 | Rate Ratio (Random, 95% CI) | 0.44 [0.28, 0.70] | |
| 1.3 Fingolimod 5.0 mg versus placebo | 1 | Rate Ratio (Random, 95% CI) | 0.47 [0.26, 0.83] | |
| 2 At 12 months Show forest plot | 1 | Rate Ratio (Random, 95% CI) | 0.56 [0.46, 0.69] | |
| 2.1 Fingolimod 0.5 mg versus interferon beta‐1a | 1 | Rate Ratio (Random, 95% CI) | 0.48 [0.34, 0.70] | |
| 2.2 Fingolimod 1.25 versus interferon beta‐1a | 1 | Rate Ratio (Random, 95% CI) | 0.61 [0.47, 0.78] | |
| 3 At 24 months Show forest plot | 2 | Rate Ratio (Random, 95% CI) | Subtotals only | |
| 3.1 Fingolimod 0.5 mg versus placebo | 2 | Rate Ratio (Random, 95% CI) | 0.50 [0.40, 0.62] | |
| 3.2 Fingolimod 1.25 mg versus placebo | 2 | Rate Ratio (Random, 95% CI) | 0.47 [0.38, 0.59] | |
| Outcome or subgroup title | No. of studies | No. of participants | Statistical method | Effect size |
| 1 At 6 months Show forest plot | 4 | Risk Ratio (M‐H, Random, 95% CI) | Subtotals only | |
| 1.1 Fingolimod 0.5 mg versus placebo | 3 | 1519 | Risk Ratio (M‐H, Random, 95% CI) | 1.42 [1.33, 1.51] |
| 1.2 Fingolimod 1.25 mg versus placebo | 4 | 1674 | Risk Ratio (M‐H, Random, 95% CI) | 1.43 [1.34, 1.53] |
| 1.3 Fingolimod 5 mg versus placebo | 1 | 158 | Risk Ratio (M‐H, Random, 95% CI) | 1.74 [1.35, 2.25] |
| 2 At 12 months Show forest plot | 3 | Risk Ratio (M‐H, Random, 95% CI) | Subtotals only | |
| 2.1 Fingolimod 0.5 mg versus placebo | 2 | 1343 | Risk Ratio (M‐H, Random, 95% CI) | 1.39 [1.30, 1.48] |
| 2.2 Fingolimod 1.25 mg versus placebo | 2 | 1319 | Risk Ratio (M‐H, Random, 95% CI) | 1.39 [1.30, 1.48] |
| 2.3 Fingolimod 0.5 mg versus interferon beta‐1a | 1 | 728 | Risk Ratio (M‐H, Random, 95% CI) | 1.12 [1.05, 1.19] |
| 2.4 Fingolimod 1.25 mg versus interferon beta‐1a | 1 | 706 | Risk Ratio (M‐H, Random, 95% CI) | 1.13 [1.06, 1.20] |
| 3 At 24 months Show forest plot | 2 | Risk Ratio (M‐H, Random, 95% CI) | Subtotals only | |
| 3.1 Fingolimod 0.5 mg versus placebo | 2 | 1226 | Risk Ratio (M‐H, Random, 95% CI) | 1.36 [1.27, 1.45] |
| 3.2 Fingolimod 1.25 mg versus placebo | 2 | 1182 | Risk Ratio (M‐H, Random, 95% CI) | 1.43 [1.33, 1.52] |
| Outcome or subgroup title | No. of studies | No. of participants | Statistical method | Effect size |
| 1 At 12 months Show forest plot | 2 | Mean Difference (IV, Random, 95% CI) | Subtotals only | |
| 1.1 Fingolimod 0.5 mg versus placebo | 1 | 733 | Mean Difference (IV, Random, 95% CI) | ‐15.30 [‐24.34, ‐6.26] |
| 1.2 Fingolimod 1.25 mg versus placebo | 1 | 706 | Mean Difference (IV, Random, 95% CI) | ‐16.0 [‐25.23, ‐6.77] |
| 1.3 Fingolimod 0.5 mg versus interferon beta‐1a | 1 | 733 | Mean Difference (IV, Random, 95% CI) | ‐0.5 [‐6.32, 5.32] |
| 1.4 Fingolimod 1.25 mg versus interferon beta‐1a | 1 | 711 | Mean Difference (IV, Random, 95% CI) | ‐3.7 [‐9.18, 1.78] |
| 2 At 24 months Show forest plot | 2 | Mean Difference (IV, Random, 95% CI) | Subtotals only | |
| 2.1 Fingolimod 0.5 mg versus placebo | 2 | 1216 | Mean Difference (IV, Random, 95% CI) | ‐20.43 [‐34.03, ‐6.83] |
| 2.2 Fingolimod 1.25 mg versus placebo | 2 | 1171 | Mean Difference (IV, Random, 95% CI) | ‐32.51 [‐40.39, ‐24.62] |
| Outcome or subgroup title | No. of studies | No. of participants | Statistical method | Effect size |
| 1 At 6 months Show forest plot | 2 | Mean Difference (Random, 95% CI) | Subtotals only | |
| 1.1 Fingolimod 1.25 mg versus placebo (Hamburg Quality of Life Questionnaire) | 1 | Mean Difference (Random, 95% CI) | ‐0.14 [‐9.13, 8.85] | |
| 1.2 Fingolimod 0.5 mg versus DMDs (Change in FS36 Mental component summary) | 1 | Mean Difference (Random, 95% CI) | 1.8 [0.42, 3.18] | |
| 1.3 Fingolimod 0.5 mg versus DMDs (Change in FS36 Physical component summary) | 1 | Mean Difference (Random, 95% CI) | 1.30 [0.30, 2.30] | |
| 2 At 24 months Show forest plot | 1 | Mean Difference (IV, Random, 95% CI) | Subtotals only | |
| 2.1 Fingolimod 0.5 mg versus placebo (Euro quality of life scale) | 1 | 713 | Mean Difference (IV, Random, 95% CI) | ‐0.01 [‐0.04, 0.02] |