Beta‐Interferone im Vergleich zu Glatirameracetat bei schubförmig remittierender Multipler Sklerose
Referencias
References to studies included in this review
References to studies excluded from this review
References to ongoing studies
Additional references
References to other published versions of this review
Characteristics of studies
Characteristics of included studies [ordered by study ID]
| Methods | Multi‐centre (2 centres) performed in 1 country (USA); randomised 2‐parallel group open‐label trial Duration: 2 years Study start date: January 2003 Primary completion date: January 2007 (final data collection date for primary outcome measure) Estimated study completion date: January 2016 Acronym: BECOME | |
| Participants | 75 participants affected by RRMS or clinically isolated syndrome CIS Inclusion criteria:
Exclusion criteria:
| |
| Interventions |
| |
| Outcomes | The primary efficacy outcome was combined active lesions (CALs) per scan in the first year Secondary end points included the following.
Relapses defined as all new or worsening neurological symptoms lasting 24 hours and not explained by fever or infection were considered subjective relapses. Subjective relapses confirmed by a blinded examining neurologist who used worsening scores on the Scripps Neurological Rating Scale (SNRS) or the Expanded Disability Status Scale (EDSS; Kurtzke 1983) were considered objective relapses. One or more of the following changes compared with baseline were required for objective relapse confirmation.
Progression of disability was confirmed at 6 months according to EDSS change, or Multiple Sclerosis Functional Composite Measure was evaluated in a post hoc analysis (Cadavid 2009a; Cadavid 2011) | |
| Notes | Participants with CIS (21%) were considered participants with MS because the criteria of diagnosis were consistent with the new criteria for MS (Polman 2011) BECOME study was supported by Bayer Schering Pharma, distributors of IFN‐beta 1b This study provided the first published results from the RCT registered in ClinicalTrials.gov Identifier NCT00176592 (last access 24 November 2013) (Characteristics of ongoing studies) Study author was contacted for missing data on 13 July 2012 (concerning progression and relapse outcome), but the request for additional data was rejected Study authors' conclusions: participants with RRMS randomly assigned to IFN‐beta 1b or to GA showed similar MRI and clinical activity | |
| Risk of bias | ||
| Bias | Authors' judgement | Support for judgement |
| Random sequence generation (selection bias) | Unclear risk | Not mentioned |
| Allocation concealment (selection bias) | Unclear risk | Not mentioned |
| Blinding of participants and personnel (performance bias) | High risk | Participants could not be blinded because of characteristic injection reactions to IFN‐beta 1b or GA |
| Blinding of outcome assessment (detection bias) | Unclear risk | Low risk for MRI: MRI readers were blinded to treatment High risk for clinical assessment: unblinded assessment of clinical outcomes |
| Incomplete outcome data (attrition bias) | High risk | Even if causes of loss to follow‐up were explicit, the dropout rate was very high and was not balanced between the 2 groups: 30% with IFN versus 20.5% with GA |
| Selective reporting (reporting bias) | Low risk | All outcomes were reported (Cadavid 2009a; Cadavid 2011; Cheriyan 2012) |
| Other bias | Unclear risk | The study was sponsored by Bayer |
| Methods | Single‐centre (Italy), randomised, 3‐parallel group, open‐label trial Duration: 2 years Enrolment: from 1 January 2007 to 30 June 2008 Acronym: none | |
| Participants | 165 participants with RRMS Inclusion criteria:
Exclusion criteria: previous treatment with immunosuppressive drugs | |
| Interventions |
| |
| Outcomes | MRI (not defined as primary or secondary)
Clinical measures (ARR, EDSS change) were also provided at 12 months and 24 months of follow‐up | |
| Notes | The study included as a reference population 50 participants with DMTs‐untreated RRMS; this group was not randomly assigned and was not analysed This study was funded by an independent medical grant from Merck Serono S.A., Geneva, Switzerland, an affiliate of Merck KGaA, Darmstadt, Germany The study author was contacted for missing data on 14 May 2012, and on 13 July 2012 (concerning progression and relapse outcome) without reply Study authors' conclusion: DMTs significantly decreased new CL development and cortical atrophy progression compared with those seen in untreated participants, with faster and more pronounced effects with SC IFN‐beta 1a than with IM IFN‐beta 1a or GA | |
| Risk of bias | ||
| Bias | Authors' judgement | Support for judgement |
| Random sequence generation (selection bias) | Low risk | Random allocation sequence was computer generated |
| Allocation concealment (selection bias) | Unclear risk | Not mentioned |
| Blinding of participants and personnel (performance bias) | Unclear risk | Not mentioned |
| Blinding of outcome assessment (detection bias) | Unclear risk | Low for MRI outcome: all images were assessed by 2 experienced observers, who were blinded to participants' identity and to treatment. Not mentioned whether clinical outcome was blinded |
| Incomplete outcome data (attrition bias) | High risk |
|
| Selective reporting (reporting bias) | High risk | Outcome of T2‐hyperintense lesion volume planned but not reported |
| Other bias | Unclear risk | No definitions of primary or secondary outcomes were reported, nor definitions of relapse.The study was sponsored by Merck Serono |
| Methods | Multi‐centre (68), performed in 2 countries (USA and Canada), randomised, double‐blind, 3‐parallel group trial Duration: 3 years Enrolment: from January 2005 to April 2009 Acronym: CombiRx | |
| Participants | 1008 participants with RRMS Inclusion criteria:
Exclusion criteria:
| |
| Interventions | Combination therapy with IFN‐beta 1a 30 μg intramuscularly weekly and glatiramer acetate (GA) 20 mg daily versus each single agent with matching placebo, that is, as follows.
No placebo IFN + placebo GA treatment arm was included | |
| Outcomes | Primary end point was reduction in annualised relapse rate Secondary outcomes included the following.
Relapse was defined as the appearance of a new symptom or worsening of an old symptom, attributable to MS, accompanied by a change in the neurological examination (demonstrated by a 0.5 or greater increase in EDSS score or a 2‐point change in 1 functional system or a 1‐point change in 2 functional systems, excluding bladder and cognitive changes); lasting at least 24 hours in the absence of fever; preceded by stability or improvement for at least 30 days, confirmed by the examining physician within 7 days of onset | |
| Notes | Combined actively treated arms were not analysed This study was funded by the National Institutes of Health and the National Institute of Neurological Disorders and Stroke (Phase III study: UO1NS045719, Planning Grant R21NS41986) and was listed on www.clinicaltrials.gov (NCT00211887) Study agents and matched placebo were provided by their manufacturers, Biogen Idec and Teva Pharmaceuticals Study author was contacted for missing data (concerning progression and relapse outcome) on 13 July 2012 without reply Study authors' conclusion: combining the 2 most commonly prescribed therapies for RRMS did not produce a significant clinical benefit over 3 years | |
| Risk of bias | ||
| Bias | Authors' judgement | Support for judgement |
| Random sequence generation (selection bias) | Low risk | Randomly assigned 2:1:1 via a computerised data entry system. Participants were randomly assigned using a permuted block design within sites with block sizes of 6 and 12 |
| Allocation concealment (selection bias) | Low risk | The computerised data entry system masked treatment arm allocation and drug dispensing to participants and all site personnel for the entire duration of the trial period |
| Blinding of participants and personnel (performance bias) | Low risk | The computerised data entry system masked drug dispensing to all site personnel for the entire duration of the trial period |
| Blinding of outcome assessment (detection bias) | Low risk | Treating clinicians and examining clinicians were blinded to treatment assignment |
| Incomplete outcome data (attrition bias) | High risk |
|
| Selective reporting (reporting bias) | Low risk | All outcomes reported |
| Other bias | Unclear risk | Primary, secondary and tertiary outcomes and protocol order were modified in the results paper draft |
| Methods | Multi‐centre (81) (14 countries: Argentina, Austria, Brazil, Canada, France, Germany, Ireland, Italy, Netherlands, Russia, Spain, Switzerland, UK and USA), randomised, 2‐parallel group, open‐label study Duration: 24 months Enrolment: from January to December 2004 Acronym: REGARD | |
| Participants | 764 participants with RRMS Subpopulation of 460 participants (230 from each group) also had serial MRI scans to assess T2‐weighted and gadolinium‐enhancing lesion number and volume Inclusion criteria:
Exclusion criteria:
| |
| Interventions |
| |
| Outcomes | Primary outcome of the study was time to first relapse Secondary end points were:
Tertiary end points were as follows.
Relapse was defined as new or worsening neurological symptoms, without fever, that lasted for 48 hours or longer and were accompanied by a change in Kurtzke Functional Scale (KFS) score. Non‐qualifying relapses met the same criteria but were not accompanied by a change in KFS score. For relapse outcomes, all relapses (qualifying and non‐qualifying) were counted | |
| Notes | The study was sponsored by EMD Serono and Pfizer Study author was contacted for missing data (concerning progression and relapse outcome) on 14 May 2012, and on 13 July 2012, without reply Additional missing data request (concerning clinical and MRI outcomes) was rejected by the drug company on 24 September 2012 Study authors' conclusion: no significant difference in the primary outcome between IFN‐1a and GA | |
| Risk of bias | ||
| Bias | Authors' judgement | Support for judgement |
| Random sequence generation (selection bias) | Low risk | Treatments were assigned by a computer‐generated randomisation list that was stratified by centre |
| Allocation concealment (selection bias) | Unclear risk | Not mentioned |
| Blinding of participants and personnel (performance bias) | High risk | Treating physicians and participants were not blinded |
| Blinding of outcome assessment (detection bias) | Low risk | Physicians who assessed participants at regular intervals or at the time of a potential relapse were blinded to treatment and communicated with participants only as needed to complete the EDSS, the Kurtzke Functional Scale (KFS) and relapse assessments. Participants were asked not to discuss their treatment with the assessing physician and covered their injection sites so the physician could not guess which treatment they had received. MRI evaluations were performed blinded at the image analysis centre, the VU Medical Centre, Amsterdam, Netherlands |
| Incomplete outcome data (attrition bias) | High risk |
|
| Selective reporting (reporting bias) | Low risk | All outcomes reported |
| Other bias | High risk | For relapse outcomes, all relapses (qualifying and non‐qualifying) were counted This study was sponsored by Merck Serono |
| Methods | Multicentre (42 study locations), randomised, open‐label study 3‐parallel groups, active‐controlled study Duration: 27 months Enrolment: from March 2010 to April 2012 Acronym: SURPASS | |
| Participants | 84 participants with RRMS (Polman 2005) | |
| Interventions | 1. Natalizumab, 300 mg intravenous injection every 4 weeks (38 participants) 2. IFN‐beta 1a 44 mcg subcutaneously 3 times weekly (25 participants) 3. Glatiramer acetate 20 mg subcutaneously every day (21 participants) | |
| Outcomes | Incidence of Treatment‐emergent Serious Adverse Events | |
| Notes | The study was terminated on April 2012 before completion, due to significantly slower than expected enrolment. Due to early termination of the study and the small size of the study population, there was insufficient power for efficacy and safety analyses. Only serious adverse events were to be captured and reported. These study results were provided at www.clinicaltrials.gov, National Institutes of Health, last updated August 18, 2014 (accessed 19 August 2016), in terms of partial safety. No published data have been retrieved | |
| Risk of bias | ||
| Bias | Authors' judgement | Support for judgement |
| Random sequence generation (selection bias) | Unclear risk | No data |
| Allocation concealment (selection bias) | Unclear risk | No data |
| Blinding of participants and personnel (performance bias) | High risk | Open label |
| Blinding of outcome assessment (detection bias) | High risk | Open label |
| Incomplete outcome data (attrition bias) | High risk | No data on clinical and radiological outcome have been provided since the early termination because enrolment had been significantly slower than expected. Thus, the decision was made by the Sponsor to terminate the study since current and projected future enrolment rates would not have provided valuable information in a reasonable timeframe. All clinical efficacy and magnetic resonance imaging (MRI) procedures were removed from the protocol and safety assessments were to be managed through standard of care activities. Forty‐seven out of 84 participants withdrawn due to study termination |
| Selective reporting (reporting bias) | High risk | Only partial data have been reported by ClinicalTrials.gov (access 19 August 2016), regarding safety assessments that were to be managed through standard of care activities |
| Other bias | High risk | No published data have been retrieved |
| Methods | Multi‐centre (198 centres in 26 countries: North and Latin America, Western and Eastern Europe and Australia), randomised, parallel‐group, double‐blind (RCDB) trial Enrolment: from November 2003 to June 2005 Duration: 24 months Acronym: BEYOND | |
| Participants | 2244 with RRMS Inclusion criteria:
Exclusion criteria:
| |
| Interventions |
| |
| Outcomes | Primary end point was relapse risk Secondary outcomes were as follows.
Relapse was defined as new or recurrent neurological abnormalities that were separated by at least 30 days from onset of the preceding event, lasted at least 24 hours and occurred without fever or infection. Neurological event was deemed as a relapse only when it was associated with an increase in EDSS or functional system scores | |
| Notes | Study arms treated with IFN 500 mcg (899 participants) were not analysed Study was sponsored by Bayer HealthCare Pharmaceuticals Additional missing data (concerning clinical and MRI outcomes) were provided by Dirk Pleimes, Global Medical Lead Neurology, Bayer Healthcare Pharmaceuticals (Pleimes 2013) Study authors' conclusion: no difference in clinical outcomes was found | |
| Risk of bias | ||
| Bias | Authors' judgement | Support for judgement |
| Random sequence generation (selection bias) | Low risk | Participants were randomly assigned in a 2:2:1 ratio by the central randomisation group with use of permuted blocks randomisation with regional stratification |
| Allocation concealment (selection bias) | Unclear risk | Not mentioned |
| Blinding of participants and personnel (performance bias) | High risk | Treating physicians were aware of treatment assignments. Participants were blind only for the 2 doses of IFN, not for GA. Participants were double‐blind to comparisons between the 2 doses. Autoinjector use was mandatory for all participants. To ensure masking between the 2 doses of interferon‐beta 1b, medication was identical in appearance, packaging and labelling |
| Blinding of outcome assessment (detection bias) | Low risk | Evaluating physicians were masked to all random assignments. Participants covered their injection sites during neurological examinations and did not discuss adverse events with the evaluating physician |
| Incomplete outcome data (attrition bias) | High risk | Dropout rate was 12.6% in IFN group versus 16.5% in GA group Reasons for discontinuation were not reported in 78/104 (75%) IFN‐treated and 24/71 (33%) GA‐treated Types of AEs justifying study discontinuation were not described Analysis was per protocol (not ITT) Causes of dropouts were not reported (113/161 (70%); 75/104 (72%); 47/74 (63%)) for most participants Numbers of participants with “confirmed EDSS progression (year 2)” and “proportion relapse free (year 2)” and “at least one major relapse (year 2)” were deleted (only proportions were given) because data in all 3 rows were derived from log‐rank tests and Kaplan–Meier estimates (see Erratum 2012; O'Connor 2009a) |
| Selective reporting (reporting bias) | High risk | 5 tertiary clinical outcomes not planned in methods section but reported in results section (Table 3) |
| Other bias | Unclear risk | Online publication has been corrected, taking into account Erratum data. Corrected versions first appeared at Lancet.com/Neurology on 19 January 2011, and on 9 December 2011. Study was sponsored by Bayer. Sponsor had no role in data collection, data analysis, data interpretation or writing of the report. All study authors who were members of the publication committee had full access to all data in the study, and the corresponding author had final responsibility for the decision to submit for publication |
Abbreviations:
ARR: annual relapse rate.
CAL: combined active lesion.
CIS: clinically isolated syndrome.
CL: cortical lesion.
CUA: combined unique active.
DMT: disease‐modifying therapy.
EDSS: Expanded Disability Status Scale.
GA: glatiramer acetate.
IFN: interferon.
ITT: intention‐to‐treat.
IV: intravenous.
IVIg: intravenous immunoglobulin.
KFS: Kurtzke Functional Scale.
MRI: magnetic resonance scale.
MS: multiple sclerosis.
MSFC: Multiple Sclerosis Functional Composite.
NL: new lesion.
RCDB: randomised, controlled, double‐blind.
RRMS: relapsing‐remitting multiple sclerosis.
SC: subcutaneous.
SNRS: Scripps Neurological Rating Scale.
Characteristics of excluded studies [ordered by study ID]
| Study | Reason for exclusion |
| Intervention group not matching our criteria. This was an RCT; open‐label design, evaluating the efficacy of fingolimod after prior treatment with DMTs for MS (EPOC study) versus continued therapy with DMTs (IFN‐beta 1a, IFN‐beta 1b or GA) Preliminary results available only in abstract meeting book. No published data have been retrieved | |
| Not an RCT. Observational study on the prevalence of injection site reactions with DMTs | |
| Not an RCT. Observational study evaluating the effects of switching immuno‐modulator treatments in participants who responded inadequately to first treatment | |
| Not an RCT. Review of use of glatiramer acetate in RRMS and in CIS | |
| Intervention group not matching our criteria. RCT evaluating the efficacy of glatiramer acetate versus placebo in participants with CIS | |
| Intervention group not matching our criteria. RCT evaluating the effects of 2 doses of GA (20 mg and 40 mg) | |
| Not an RCT. Review article investigating the effectiveness of drugs, Including interferon, glatiramer, natalizumab or fingolimod, for RRMS | |
| Not an RCT. Multi‐centre collaborative study evaluating the effects of immunomodulatory treatment in participants younger than 16 years of age | |
| Not an RCT. Pairwise analysis of the international MSBase registry data was conducted using propensity score matching. Treatment with injectable immunomodulators | |
| Not an RCT. Prospective, open‐label treatment trial of immunomodulatory therapy IFN‐b 1a (Avonex 1), IFN‐b 1b (Betaseron 1) and GA (Copaxone 1) in participants with RRMS | |
| Not an RCT. Retrospective study in which participants with RRMS were treated with DMTs to examine the effects of DMTs (IFN‐beta and GA) on brain volume over a 5‐year period | |
| Intervention group not matching our criteria. RCT comparing GA 40 mg administered 3 times weekly with placebo in participants with RRMS | |
| Intervention group not matching our criteria. RCT evaluating the effects of albuterol as add‐on treatment to glatiramer acetate therapy | |
| Not an RCT. Review article comparing the efficacy and safety of immunomodulatory treatments for MS | |
| Not an RCT. Review assessing the benefit‐risk (BR) profile of GA in RRMS and CIS | |
| No answer from the authors about more details (last request on 15 July 2016) | |
| Not an RCT. Participants included were registered in MSBase or the TYSABRI Observational Program (TOP). The aim was to compare treatment efficacy and persistence in participants who switched to natalizumab versus those who switched between glatiramer acetate |
Abbreviations:
BR: benefit‐risk.
CIS: clinically isolated syndrome.
DMT: disease‐modifying therapy.
GA: glatiramer acetate.
IFN: interferon.
MS: multiple sclerosis.
RCT: randomised controlled trial.
RRMS: relapsing‐remitting multiple sclerosis
Characteristics of ongoing studies [ordered by study ID]
| Trial name or title | A 96‐weeks, prospective, multicentre, randomised, open label, active‐controlled, parallel groups, phase 2b/3 study to compare efficacy and safety of masitinib to first line treatment, in patients with relapsing remitting multiple sclerosis with unsatisfactory response to first line treatment |
| Methods | Indirect comparison of masitinib to interferon beta‐1a, interferon beta‐1b, peginterferon beta‐1a or glatiramer acetate in people with relapsing remitting multiple sclerosis with unsatisfactory response to these first line treatments Allocation: randomised Acronym: none |
| Participants | 450: 400 Adults (18 to 64 years) and 50 Elderly (≥ 65 years) |
| Interventions | Comparison of masitinib to interferon‐beta 1a, interferon‐beta 1b, peginterferon‐beta 1a or glatiramer acetate |
| Outcomes | Primary outcome: annualised relapse rate defined as the number of confirmed relapses per year at 96 weeks Secondary outcomes: ‐ EDSS Cumulative probability of sustained disability progression at week 12, 24, 48, 72 and 96 in EDSS EDSS score at week 12, 24, 48, 72 and 96 ‐ Relapse Relapse rate per participant at week 12, 24, 48, 72 and 96 Use of corticosteroids for multiple sclerosis Severity of relapse and number of hospitalisation for potential relapse • MRI endpoints: T1 gadolinium‐enhancing lesions at week 48 and 96, T2 hyperintense lesions at week 48 and 96, T1 hypointense lesions at week 48 and 96; Atrophy: measure of brain parenchymal fraction (BPF) at week 48 and 96, MRI criteria from ASL (Arterial Spi Labelling): cerebral blood flow (CBF) in ml/100 g/min, cerebral blood volume (CBV) in ml/100 g and mean transit time (MTT) in seconds, at baseline, week 48 and 96 (optional) • Multiple Sclerosis Functional Composite (MSFC) at week 12, 24, 48, 72 and 96 • Quality of life assessment: MSQOL‐54 at week 12, 24, 48, 72 and 96; EQ‐Visual Analogue Scale for Quality of life at week 12, 24, 48, 72 and 96; Beck Depression Inventory at week 12, 24, 48, 72 and 96; Modified Fatigue Impact Scale at week 12, 24, 48, 72 and 96 • Safety profile Clinical and biological safety profile: occurrence of Adverse Events, potential changes in vital signs, ECG, chest X‐ray and biological parameters |
| Starting date | 19 November 2015 (accessed 29 July 2016) |
| Contact information | Name of contact point: Vincent Arnold |
| Notes | Trial protocol ongoing. No results available (access 29 July 2016) |
| Trial name or title | Phase IV, rater‐blinded, randomised study comparing the effects of 250 mg of Betaseron with 20 mg of Copaxone in participants with relapsing‐remitting or clinically isolated forms of multiple sclerosis using 3 tesla MRI with triple‐dose gadolinium |
| Methods | Head‐to‐head comparison of interferon‐beta and Copaxone for treatment of participants with clinically isolated syndrome (CIS) and relapsing‐remitting (RR) forms of multiple sclerosis (MS) using acute changes on magnetic resonance imaging (MRI) as the primary outcome Randomised controlled trial Allocation: randomised Acronym: BECOME |
| Participants | Estimated enrolment: 75 (CIS and RRMS) |
| Interventions | Head‐to‐head comparison of interferon‐beta and Copaxone |
| Outcomes | Primary outcome measure: number of "combined active" lesions by monthly MRI at conclusion of the study Secondary outcome measures: number of enhancing lesions, number of new lesions, number of "combined active" disease‐free participants |
| Starting date | January 2003 |
| Contact information | New Jersey Medical School, Newark, NJ 07103, USA Sponsors and collaborators: University of Medicine and Dentistry of New Jersey Principal investigator: Diego Cadavid, MD |
| Notes | Estimated study completion date: January 2016 Study is ongoing but is not recruiting participants (ClinicalTrials.gov, US National Institutes of Health); no study results posted (access 29 July 2016) |
| Trial name or title | A 12‐month, Prospective, Randomized, Active‐controlled, Open‐label multicenter Study to Evaluate the Patient Retention of Fingolimod vs. Approved First‐line Disease Modifying Therapies in Adults With Relapsing Remitting Multiple Sclerosis (PREFERMS) |
| Methods | Randomized Parallel Assignment Open Label Phase 4 study. Participants will be treatment naive or have only been treated with one class of DMT (Interferon beta preparation or glatiramer acetate). Participants will be able to switch to different treatment for safety, efficacy, tolerability or convenience during the study. |
| Participants | Estimated enrolment: 881 RRMS |
| Interventions | Drug: Fingolimod Drug: disease‐modifying therapy‐Interferon Beta preparation (Exctavia, Betaseron, Rebif, Avonex) or glatiramer acetate (Copaxone) |
| Outcomes | Primary outcome measures: retention on treatment (time frame: 12 months) Secondary objectives are to compare reasons for discontinuation, adverse events, cognitive impairment, medication satisfaction and change in brain volume measured by MRI. |
| Starting date | June 2012 |
| Contact information | Novartis Pharmaceuticals |
| Notes | This study has been completed. July 2015 (final data collection date for primary outcome measure). No study results posted (accessed 29 July 2016) |
Data and analyses
| Outcome or subgroup title | No. of studies | No. of participants | Statistical method | Effect size |
| 1 At the end of follow‐up (24 ‐ 36 months) Show forest plot | 4 | Risk Ratio (M‐H, Random, 95% CI) | Subtotals only | |
| Analysis 1.1 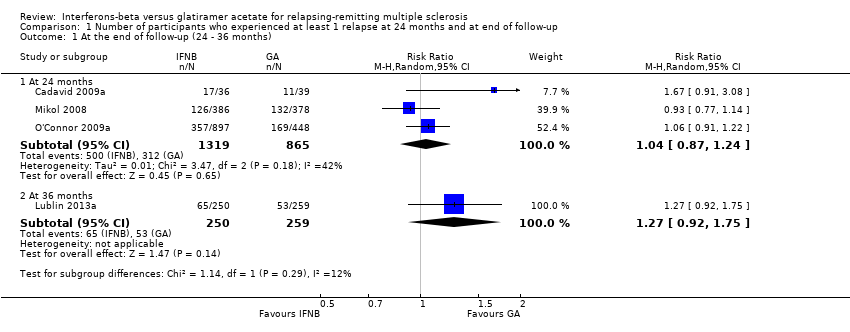 Comparison 1 Number of participants who experienced at least 1 relapse at 24 months and at end of follow‐up, Outcome 1 At the end of follow‐up (24 ‐ 36 months). | ||||
| 1.1 At 24 months | 3 | 2184 | Risk Ratio (M‐H, Random, 95% CI) | 1.04 [0.87, 1.24] |
| 1.2 At 36 months | 1 | 509 | Risk Ratio (M‐H, Random, 95% CI) | 1.27 [0.92, 1.75] |
| 2 During follow‐up likely scenario Show forest plot | 4 | Risk Ratio (M‐H, Random, 95% CI) | Subtotals only | |
| Analysis 1.2  Comparison 1 Number of participants who experienced at least 1 relapse at 24 months and at end of follow‐up, Outcome 2 During follow‐up likely scenario. | ||||
| 2.1 At 24 months | 3 | 2184 | Risk Ratio (M‐H, Random, 95% CI) | 1.10 [0.91, 1.34] |
| 2.2 At 36 months | 1 | 509 | Risk Ratio (M‐H, Random, 95% CI) | 1.30 [0.98, 1.73] |
| Outcome or subgroup title | No. of studies | No. of participants | Statistical method | Effect size |
| 1 At the end of follow‐up (24‐36 months) Show forest plot | 4 | Risk Ratio (M‐H, Random, 95% CI) | Subtotals only | |
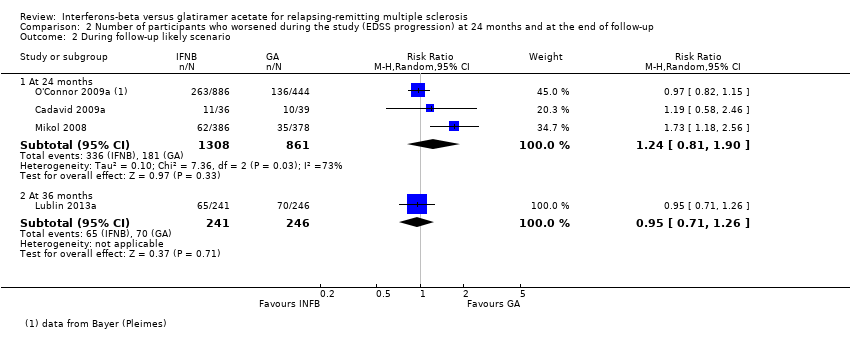
| Analysis 2.1  Comparison 2 Number of participants who worsened during the study (EDSS progression) at 24 months and at the end of follow‐up, Outcome 1 At the end of follow‐up (24‐36 months). | ||||
| 1.1 At 24 months | 3 | 2169 | Risk Ratio (M‐H, Random, 95% CI) | 1.11 [0.91, 1.35] |
| 1.2 At 36 months | 1 | 487 | Risk Ratio (M‐H, Random, 95% CI) | 0.87 [0.63, 1.20] |
| 2 During follow‐up likely scenario Show forest plot | 4 | Risk Ratio (M‐H, Random, 95% CI) | Subtotals only | |
| Analysis 2.2  Comparison 2 Number of participants who worsened during the study (EDSS progression) at 24 months and at the end of follow‐up, Outcome 2 During follow‐up likely scenario. | ||||
| 2.1 At 24 months | 3 | 2169 | Risk Ratio (M‐H, Random, 95% CI) | 1.24 [0.81, 1.90] |
| 2.2 At 36 months | 1 | 487 | Risk Ratio (M‐H, Random, 95% CI) | 0.95 [0.71, 1.26] |
| Outcome or subgroup title | No. of studies | No. of participants | Statistical method | Effect size |
| 1 Number of participants who dropped out for AE Show forest plot | 4 | 2685 | Risk Ratio (M‐H, Random, 95% CI) | 0.95 [0.64, 1.40] |
| Analysis 3.1  Comparison 3 Number of participants who withdrew or dropped out of the study because of adverse events, Outcome 1 Number of participants who dropped out for AE. | ||||
| 2 Number of participants who dropped out for SAE Show forest plot | 3 | 2610 | Risk Ratio (M‐H, Random, 95% CI) | 0.99 [0.63, 1.56] |
| Analysis 3.2  Comparison 3 Number of participants who withdrew or dropped out of the study because of adverse events, Outcome 2 Number of participants who dropped out for SAE. | ||||
| Outcome or subgroup title | No. of studies | No. of participants | Statistical method | Effect size |
| 1 Relapse frequency Show forest plot | 5 | Rate Ratio (Random, 95% CI) | Subtotals only | |
| Analysis 4.1 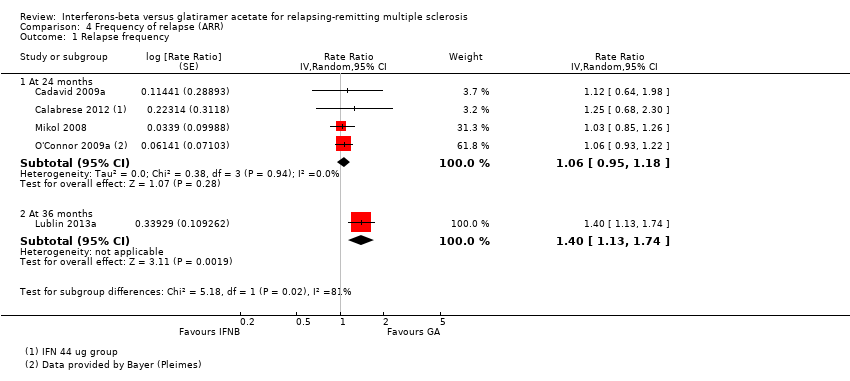 Comparison 4 Frequency of relapse (ARR), Outcome 1 Relapse frequency. | ||||
| 1.1 At 24 months | 4 | Rate Ratio (Random, 95% CI) | 1.06 [0.95, 1.18] | |
| 1.2 At 36 months | 1 | Rate Ratio (Random, 95% CI) | 1.40 [1.13, 1.74] | |
| Outcome or subgroup title | No. of studies | No. of participants | Statistical method | Effect size |
| 1 Time to first relapse (HR) Show forest plot | 3 | Hazard Ratio (Random, 95% CI) | 1.01 [0.87, 1.16] | |
| Analysis 5.1 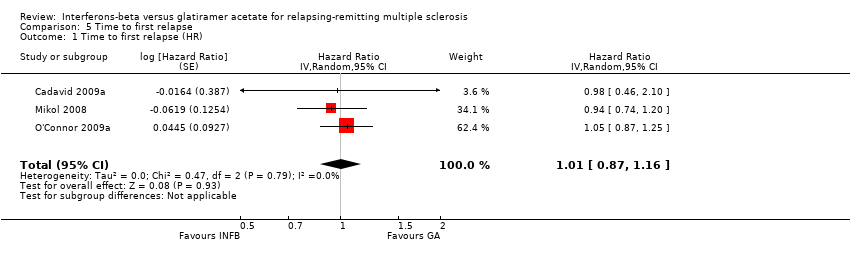 Comparison 5 Time to first relapse, Outcome 1 Time to first relapse (HR). | ||||
| Outcome or subgroup title | No. of studies | No. of participants | Statistical method | Effect size |
| 1 Patients Treated with Steroids Show forest plot | 2 | 1420 | Risk Ratio (M‐H, Random, 95% CI) | 1.30 [0.76, 2.24] |
| Analysis 7.1  Comparison 7 Number of participants treated with steroids for MS relapse, Outcome 1 Patients Treated with Steroids. | ||||
| Outcome or subgroup title | No. of studies | No. of participants | Statistical method | Effect size |
| 1 During follow‐up Show forest plot | 3 | Mean Difference (IV, Random, 95% CI) | Subtotals only | |
| Analysis 9.1  Comparison 9 Mean number of active (new or enlarged) T2‐hyperintense lesions per participant at 6 ‐ 12 ‐ 24 months and at end of follow‐up period, Outcome 1 During follow‐up. | ||||
| 1.1 At 6 months | 1 | 396 | Mean Difference (IV, Random, 95% CI) | ‐0.86 [‐1.32, ‐0.40] |
| 1.2 At 12 months | 2 | 1722 | Mean Difference (IV, Random, 95% CI) | ‐0.52 [‐1.12, 0.09] |
| 1.3 At 24 months | 3 | 1790 | Mean Difference (IV, Random, 95% CI) | ‐0.15 [‐0.68, 0.39] |
| Outcome or subgroup title | No. of studies | No. of participants | Statistical method | Effect size |
| 1 Mean number Show forest plot | 3 | Mean Difference (IV, Random, 95% CI) | Subtotals only | |
| Analysis 10.1 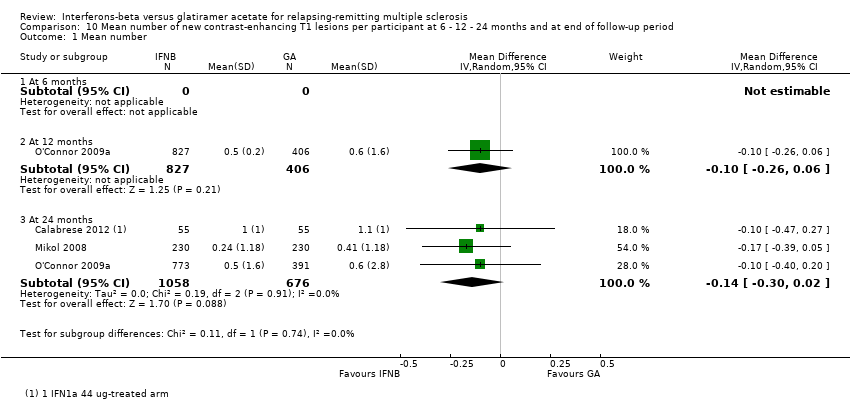 Comparison 10 Mean number of new contrast‐enhancing T1 lesions per participant at 6 ‐ 12 ‐ 24 months and at end of follow‐up period, Outcome 1 Mean number. | ||||
| 1.1 At 6 months | 0 | 0 | Mean Difference (IV, Random, 95% CI) | 0.0 [0.0, 0.0] |
| 1.2 At 12 months | 1 | 1233 | Mean Difference (IV, Random, 95% CI) | ‐0.10 [‐0.26, 0.06] |
| 1.3 At 24 months | 3 | 1734 | Mean Difference (IV, Random, 95% CI) | ‐0.14 [‐0.30, 0.02] |
| Outcome or subgroup title | No. of studies | No. of participants | Statistical method | Effect size |
| 1 Mean absolute change Show forest plot | 3 | Mean Difference (IV, Random, 95% CI) | Subtotals only | |
| Analysis 11.1  Comparison 11 Mean change in total T2‐hyperintense lesion load at 12‐24 months and at end of follow‐up period, Outcome 1 Mean absolute change. | ||||
| 1.1 At 12 months | 1 | 1221 | Mean Difference (IV, Random, 95% CI) | ‐0.4 [‐0.59, ‐0.21] |
| 1.2 At 24 months | 2 | 1608 | Mean Difference (IV, Random, 95% CI) | ‐0.58 [‐0.99, ‐0.18] |
| 1.3 At 36 months | 1 | 509 | Mean Difference (IV, Random, 95% CI) | ‐0.26 [‐1.04, 0.52] |
| Outcome or subgroup title | No. of studies | No. of participants | Statistical method | Effect size |
| 1 Mean absolute change Show forest plot | 2 | Mean Difference (IV, Random, 95% CI) | Subtotals only | |
| Analysis 12.1 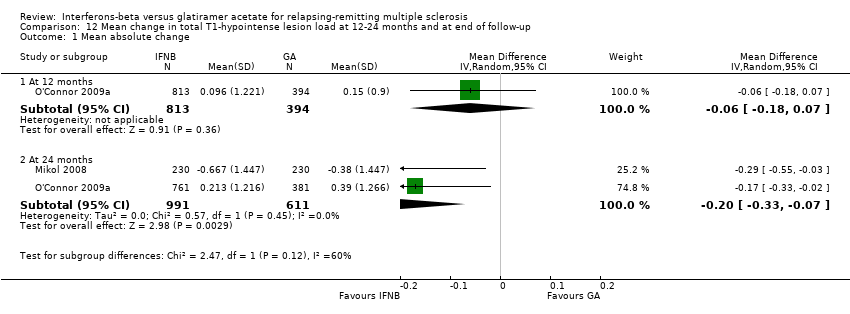 Comparison 12 Mean change in total T1‐hypointense lesion load at 12‐24 months and at end of follow‐up, Outcome 1 Mean absolute change. | ||||
| 1.1 At 12 months | 1 | 1207 | Mean Difference (IV, Random, 95% CI) | ‐0.06 [‐0.18, 0.07] |
| 1.2 At 24 months | 2 | 1602 | Mean Difference (IV, Random, 95% CI) | ‐0.20 [‐0.33, ‐0.07] |
| Outcome or subgroup title | No. of studies | No. of participants | Statistical method | Effect size |
| 1 Mean absolute change Show forest plot | 2 | Mean Difference (IV, Random, 95% CI) | Subtotals only | |
| Analysis 13.1 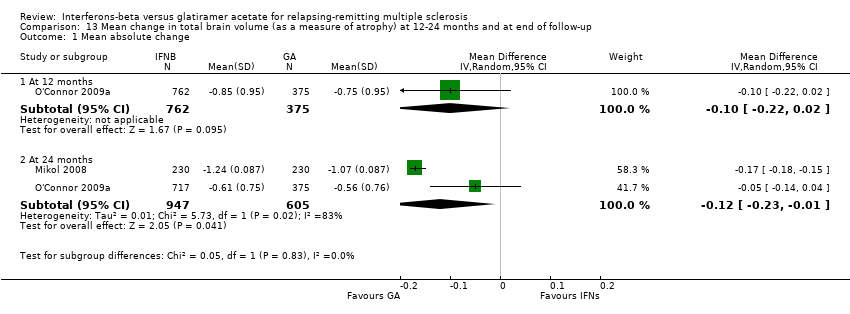 Comparison 13 Mean change in total brain volume (as a measure of atrophy) at 12‐24 months and at end of follow‐up, Outcome 1 Mean absolute change. | ||||
| 1.1 At 12 months | 1 | 1137 | Mean Difference (IV, Random, 95% CI) | ‐0.10 [‐0.22, 0.02] |
| 1.2 At 24 months | 2 | 1552 | Mean Difference (IV, Random, 95% CI) | ‐0.12 [‐0.23, ‐0.01] |

Study flow diagram.
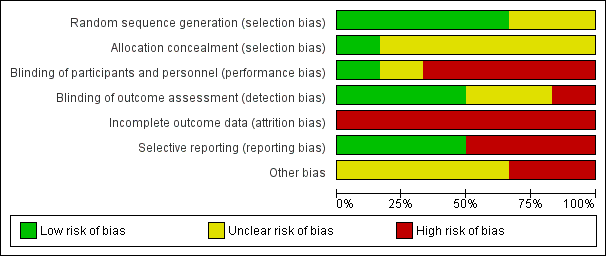
Risk of bias graph: review authors' judgements about each risk of bias item presented as percentages across all included studies.

Risk of bias summary: review authors' judgements about each risk of bias item for each included study.

Comparison 1 Number of participants who experienced at least 1 relapse at 24 months and at end of follow‐up, Outcome 1 At the end of follow‐up (24 ‐ 36 months).
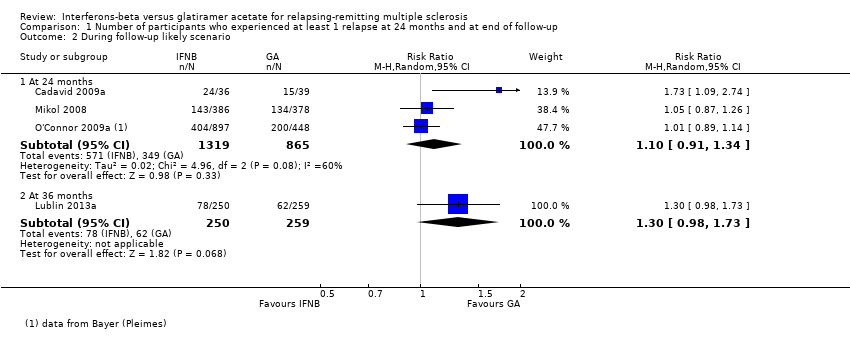
Comparison 1 Number of participants who experienced at least 1 relapse at 24 months and at end of follow‐up, Outcome 2 During follow‐up likely scenario.

Comparison 2 Number of participants who worsened during the study (EDSS progression) at 24 months and at the end of follow‐up, Outcome 1 At the end of follow‐up (24‐36 months).
Comparison 2 Number of participants who worsened during the study (EDSS progression) at 24 months and at the end of follow‐up, Outcome 2 During follow‐up likely scenario.

Comparison 3 Number of participants who withdrew or dropped out of the study because of adverse events, Outcome 1 Number of participants who dropped out for AE.

Comparison 3 Number of participants who withdrew or dropped out of the study because of adverse events, Outcome 2 Number of participants who dropped out for SAE.

Comparison 4 Frequency of relapse (ARR), Outcome 1 Relapse frequency.

Comparison 5 Time to first relapse, Outcome 1 Time to first relapse (HR).

Comparison 7 Number of participants treated with steroids for MS relapse, Outcome 1 Patients Treated with Steroids.

Comparison 9 Mean number of active (new or enlarged) T2‐hyperintense lesions per participant at 6 ‐ 12 ‐ 24 months and at end of follow‐up period, Outcome 1 During follow‐up.

Comparison 10 Mean number of new contrast‐enhancing T1 lesions per participant at 6 ‐ 12 ‐ 24 months and at end of follow‐up period, Outcome 1 Mean number.

Comparison 11 Mean change in total T2‐hyperintense lesion load at 12‐24 months and at end of follow‐up period, Outcome 1 Mean absolute change.

Comparison 12 Mean change in total T1‐hypointense lesion load at 12‐24 months and at end of follow‐up, Outcome 1 Mean absolute change.

Comparison 13 Mean change in total brain volume (as a measure of atrophy) at 12‐24 months and at end of follow‐up, Outcome 1 Mean absolute change.
| interferons compared with glatiramer acetate for participants with relapsing‐remitting multiple sclerosis | ||||||
| Patient or population: people with relapsing‐remitting multiple sclerosis | ||||||
| Outcomes | Illustrative comparative risks* (95% CI) | Relative effect | No. of participants | Quality of the evidence | Comments | |
| Assumed risk (control) | Corresponding risk (intervention) | |||||
| Glatiramer acetate | Interferons | |||||
| Number of participants with relapse (M‐H, random, 95% CI) | Study population | RR 1.04 | 2184 | ⊕⊕⊕⊝ | Detection bias risk for clinical outcomes was judged as high for 1 study and low for the other 2 RCTs | |
| 36 per 100 | 38 per 100 | |||||
| Moderate | ||||||
| 35 per 100 | 36 per 100 | |||||
| Number of participants with confirmed progression (M‐H, random, 95% CI) | Study population | RR 1.11 | 2169 | ⊕⊕⊕⊝ | Detection bias risk for clinical outcomes was judged as high for 1 study and low for the other 2 RCTs | |
| 15 per 100 | 16 per 100 | |||||
| Moderate | ||||||
| 15 per 100 | 17 per 100 | |||||
| Number of participants who dropped out for AEs (M‐H, random, 95% CI) | Study population | RR 0.95 | 2685 | ⊕⊕⊝⊝ | ||
| 4 per 100 | 4 per 100 | |||||
| Moderate | ||||||
| 5 per 100 | 5 per 100 | |||||
| Mean number of active T2 lesions | 0.15 lower in IFN versus GA groups | 1790 | ⊕⊕⊝⊝ | Detection bias risk for MRI outcomes was judged as low for all studies | ||
| Mean number of new enhancing lesions | 0.14 lower in IFN versus GA groups | 1734 | ⊕⊕⊕⊝ | Detection bias risk for MRI outcomes was judged as low for all studies | ||
| Mean change in total T2‐hyperintense lesion load | 0.58 lower in IFN versus GA groups | 1608 | ⊕⊕⊕⊝ | Detection bias risk for MRI outcomes was judged as low for both studies | ||
| Mean change in total T1‐hypointense lesion load | −0.20 lower in IFN versus GA groups (−0.33 to −0.07) | 1602 | ⊕⊕⊕⊝ | Detection bias risk for MRI outcomes was judged as low for both studies | ||
| *The basis for the assumed risk (e.g. median control group risk (GA) across studies) is provided in footnotes. The corresponding risk (and its 95% confidence interval) is based on the assumed risk in the comparison group (IFNs) and the relative effect of the intervention (and its 95% CI). | ||||||
| GRADE Working Group grades of evidence. | ||||||
| aHigh risk of attrition bias. | ||||||
| Study name | Drugs | Number of participants | % female | Age, years, mean (SD) | Mean EDSS score (SD) | Disease duration, years,mean (SD) | Previous number of relapses, mean (SD) | Number of participants with MRI Gad+ lesions (%) |
| IFN‐beta 1b | 36 | 75 | 36 (7.75) | 2.0* (0 to 5) | 0.9* (0.1 to 24) | 1.8* (0 to 7.5) | 26 (72) | |
| GA | 39 | 64 | 36 (8.25) | 2.0* (0 to 5.5) | 1.2* (0.2 to 34) | 1,9* (0.13 to 7.0) | 27 (69) | |
| IFN‐beta 1a 44 | 55 | 69.5 | 35.9 (9.1) | 1.9 (1.0) | 5.7 (4.9) | 1,2 (0.6) | ND | |
| IFN‐beta 1a 30 μg | 55 | 68.0 | 34.8 (9.6) | 1.9 (0.8) | 5.3 (5.1) | 1,2 (0.7) | ND | |
| GA | 55 | 72.9 | 38.9 (10.2) | 2.1 (1.1) | 5.5 (6.1) | 1,3 (0.7) | ND | |
| IFN‐beta 1a 30 μg | 250 | 69.2 | 37.6 (10.2) | 2.0 (1.2) | 1.4 (4.0) | 1.7° (0.9) | 187 (74.8) | |
| GA | 259 | 71.4 | 39.0 (9.5) | 1.9 (1.2) | 1.0 (2.9) | 1.6° (0.7) | 215 (83.01) | |
| IFN‐beta 1a 44 μg | 386 | 69 | 36.7 (9.8) | 2.35 (1.28) | 5.93 (6.25) | 0.97** (0.42) | 150 (39) | |
| GA | 378 | 72 | 36.8 (9.5) | 2.33 (1.31) | 6.55 (7.10) | 1.01** (0.35) | 156 (41) | |
| IFN‐beta 1b | 897 | 70 | 35.8** (11.13) | 2.35 (2) | 5.3** (4.45) | 1.6° (0.74) | ND | |
| GA | 448 | 68 | 35.2** (11.87) | 2.28 (2) | 5.1** (4.45) | 1.6° (0.74) | ND | |
| ND (no data available). *Median (range); mean not reported. **SD or weighted mean was calculated. °Pre‐1‐year. | ||||||||
| Study | Arm | N° participants | N° dropout | Reasons for missing | |||||||||||
| At randomisation | 24 months | 36 months | n° | % | Lost to follow‐up | Did not receive drug | Switched treatment | Withdrew | Deviated from protocol | Had adverse events | Died | Became pregnant | Other reasons | ||
| IFN‐beta 1a 44 μg | 36 | 25 | ND | 116 | 30.6 | 7 | 0 | 0 | 0 | 0 | 1 | 0 | 0 | 38 | |
| GA | 39 | 31 | ND | 87 | 20.5 | 4 | 0 | 0 | 0 | 0 | 0 | 0 | 0 | 48 | |
| IFN‐beta 1a 44 μg | 55 | 46 | ND | 9 | 16.4 | 9 | ND | ||||||||
| IFN‐beta 1a 30 μg | 55 | 47 | ND | 8 | 14.5 | 8 | |||||||||
| GA | 55 | 48 | ND | 7 | 12.7 | 7 | |||||||||
| IFN‐beta 1a 30 μg | 250 | ND | 194 | 56 | 22.4 | 13 | 0 | 0 | 0 | 0 | 1711 | 1 | 0 | 2513 | |
| GA | 259 | ND | 223 | 36 | 13.9 | 9 | 0 | 0 | 0 | 0 | 1112 | 1 | 0 | 1514 | |
| IFN‐beta 1a 44 μg | 386 | 301 | ND | 85 | 22.0 | 17 | 3 | 0 | 0 | 2 | 23 | 0 | 8 | 329 | |
| GA | 378 | 324 | ND | 54 | 14.3 | 2 | 3 | 0 | 0 | 2 | 19 | 0 | 5 | 2310 | |
| IFN‐beta 1b 250 | 897 | 784 | ND | 113 | 12.6 | 12 | 9 | 10 | 38 | 3 | 13 | 1 | 27 | ||
| GA | 448 | 374 | ND | 74 | 16.5 | 12 | 3 | 5 | 18 | 2 | 8 | 1 | 1 | 24 | |
| ND (no data available) Source of data are described as follow. 1] pg 1977; 2] pg 3; 3] pg 33; 4] pg 904; 5] pg 890; 6] 7 lost to follow‐up + 4 discontinued intervention (see pg 1977); 7] 4 lost to follow‐up + 4 discontinued intervention (see pg 1977); 8] treatment failure; 9] 4 had disease progression + 28 for other reasons; 10] 7 had disease progression + 16 for other reasons; 11] 4 AE/SAE + 13 side effects; 12] 6 AE/SAE + 5 side effects; 13] 14 non‐medical reason + 11 other medical reason; 14] 8 non‐medical reason + 7 other medical reason | |||||||||||||||
| Study | Arm | N° participants | N° dropout | Lost to follow‐up | |||
| Randomised available for the outcome | 24 months | 36 months | n° | % | |||
| IFN‐beta 1a 44 | 36 | 25 | 11 | 30.6 | 7 | ||
| GA | 39 | 31 | 8 | 20.5 | 4 | ||
| IFN‐beta 1a 44 | 55 | 46 | 9 | 16.4 | 9 | ||
| IFN‐beta 1a 30 | 55 | 47 | 8 | 14.5 | 8 | ||
| GA | 55 | 48 | 7 | 12.7 | 7 | ||
| IFN‐beta 1a 30 | 250 | 194 | 56 | 22.4 | 13 | ||
| GA | 259 | 223 | 36 | 13.9 | 9 | ||
| IFN‐beta 1a 44 | 386 | 301 | 85 | 22.0 | 17 | ||
| GA | 378 | 324 | 54 | 14.3 | 2 | ||
| IFN‐beta 1b | 897 | 784 | 113 | 12.6 | 57* | ||
| GA | 448 | 374 | 74 | 16.5 | 31* | ||
| *Data provided by Bayer (Pleimes 2013). | |||||||
| Study | Arm | N° participants at | N° dropout | Lost to follow‐up | |||
| Randomised available for the outcome | 24 months | 36 months | n° | % | |||
| IFN‐beta 1a 44 | 36 | 25 | 11 | 30.6 | 7 | ||
| GA | 39 | 31 | 8 | 20.5 | 4 | ||
| IFN‐beta 1a 44 | 55 | 46 | 9 | 16.4 | 9 | ||
| IFN‐beta 1a 30 | 55 | 47 | 8 | 14.5 | 8 | ||
| GA | 55 | 48 | 7 | 12.7 | 7 | ||
| IFN‐beta 1a 30 | 241 | 194 | 47 | 19.5 | 13 | ||
| GA | 246 | 223 | 23 | 9.3 | 9 | ||
| IFN‐beta 1a 44 | 386 | 301 | 85 | 22.0 | 17 | ||
| GA | 378 | 324 | 54 | 14.3 | 2 | ||
| IFN‐beta 1b | 886 | 784 | 102 | 11.5 | 80* | ||
| GA | 444 | 374 | 70 | 15.8 | 58* | ||
| *Data provided by Bayer (Pleimes 2013). | |||||||
| Outcome or subgroup title | No. of studies | No. of participants | Statistical method | Effect size |
| 1 At the end of follow‐up (24 ‐ 36 months) Show forest plot | 4 | Risk Ratio (M‐H, Random, 95% CI) | Subtotals only | |
| 1.1 At 24 months | 3 | 2184 | Risk Ratio (M‐H, Random, 95% CI) | 1.04 [0.87, 1.24] |
| 1.2 At 36 months | 1 | 509 | Risk Ratio (M‐H, Random, 95% CI) | 1.27 [0.92, 1.75] |
| 2 During follow‐up likely scenario Show forest plot | 4 | Risk Ratio (M‐H, Random, 95% CI) | Subtotals only | |
| 2.1 At 24 months | 3 | 2184 | Risk Ratio (M‐H, Random, 95% CI) | 1.10 [0.91, 1.34] |
| 2.2 At 36 months | 1 | 509 | Risk Ratio (M‐H, Random, 95% CI) | 1.30 [0.98, 1.73] |
| Outcome or subgroup title | No. of studies | No. of participants | Statistical method | Effect size |
| 1 At the end of follow‐up (24‐36 months) Show forest plot | 4 | Risk Ratio (M‐H, Random, 95% CI) | Subtotals only | |
| 1.1 At 24 months | 3 | 2169 | Risk Ratio (M‐H, Random, 95% CI) | 1.11 [0.91, 1.35] |
| 1.2 At 36 months | 1 | 487 | Risk Ratio (M‐H, Random, 95% CI) | 0.87 [0.63, 1.20] |
| 2 During follow‐up likely scenario Show forest plot | 4 | Risk Ratio (M‐H, Random, 95% CI) | Subtotals only | |
| 2.1 At 24 months | 3 | 2169 | Risk Ratio (M‐H, Random, 95% CI) | 1.24 [0.81, 1.90] |
| 2.2 At 36 months | 1 | 487 | Risk Ratio (M‐H, Random, 95% CI) | 0.95 [0.71, 1.26] |
| Outcome or subgroup title | No. of studies | No. of participants | Statistical method | Effect size |
| 1 Number of participants who dropped out for AE Show forest plot | 4 | 2685 | Risk Ratio (M‐H, Random, 95% CI) | 0.95 [0.64, 1.40] |
| 2 Number of participants who dropped out for SAE Show forest plot | 3 | 2610 | Risk Ratio (M‐H, Random, 95% CI) | 0.99 [0.63, 1.56] |
| Outcome or subgroup title | No. of studies | No. of participants | Statistical method | Effect size |
| 1 Relapse frequency Show forest plot | 5 | Rate Ratio (Random, 95% CI) | Subtotals only | |
| 1.1 At 24 months | 4 | Rate Ratio (Random, 95% CI) | 1.06 [0.95, 1.18] | |
| 1.2 At 36 months | 1 | Rate Ratio (Random, 95% CI) | 1.40 [1.13, 1.74] | |
| Outcome or subgroup title | No. of studies | No. of participants | Statistical method | Effect size |
| 1 Time to first relapse (HR) Show forest plot | 3 | Hazard Ratio (Random, 95% CI) | 1.01 [0.87, 1.16] | |
| Outcome or subgroup title | No. of studies | No. of participants | Statistical method | Effect size |
| 1 Patients Treated with Steroids Show forest plot | 2 | 1420 | Risk Ratio (M‐H, Random, 95% CI) | 1.30 [0.76, 2.24] |
| Outcome or subgroup title | No. of studies | No. of participants | Statistical method | Effect size |
| 1 During follow‐up Show forest plot | 3 | Mean Difference (IV, Random, 95% CI) | Subtotals only | |
| 1.1 At 6 months | 1 | 396 | Mean Difference (IV, Random, 95% CI) | ‐0.86 [‐1.32, ‐0.40] |
| 1.2 At 12 months | 2 | 1722 | Mean Difference (IV, Random, 95% CI) | ‐0.52 [‐1.12, 0.09] |
| 1.3 At 24 months | 3 | 1790 | Mean Difference (IV, Random, 95% CI) | ‐0.15 [‐0.68, 0.39] |
| Outcome or subgroup title | No. of studies | No. of participants | Statistical method | Effect size |
| 1 Mean number Show forest plot | 3 | Mean Difference (IV, Random, 95% CI) | Subtotals only | |
| 1.1 At 6 months | 0 | 0 | Mean Difference (IV, Random, 95% CI) | 0.0 [0.0, 0.0] |
| 1.2 At 12 months | 1 | 1233 | Mean Difference (IV, Random, 95% CI) | ‐0.10 [‐0.26, 0.06] |
| 1.3 At 24 months | 3 | 1734 | Mean Difference (IV, Random, 95% CI) | ‐0.14 [‐0.30, 0.02] |
| Outcome or subgroup title | No. of studies | No. of participants | Statistical method | Effect size |
| 1 Mean absolute change Show forest plot | 3 | Mean Difference (IV, Random, 95% CI) | Subtotals only | |
| 1.1 At 12 months | 1 | 1221 | Mean Difference (IV, Random, 95% CI) | ‐0.4 [‐0.59, ‐0.21] |
| 1.2 At 24 months | 2 | 1608 | Mean Difference (IV, Random, 95% CI) | ‐0.58 [‐0.99, ‐0.18] |
| 1.3 At 36 months | 1 | 509 | Mean Difference (IV, Random, 95% CI) | ‐0.26 [‐1.04, 0.52] |
| Outcome or subgroup title | No. of studies | No. of participants | Statistical method | Effect size |
| 1 Mean absolute change Show forest plot | 2 | Mean Difference (IV, Random, 95% CI) | Subtotals only | |
| 1.1 At 12 months | 1 | 1207 | Mean Difference (IV, Random, 95% CI) | ‐0.06 [‐0.18, 0.07] |
| 1.2 At 24 months | 2 | 1602 | Mean Difference (IV, Random, 95% CI) | ‐0.20 [‐0.33, ‐0.07] |
| Outcome or subgroup title | No. of studies | No. of participants | Statistical method | Effect size |
| 1 Mean absolute change Show forest plot | 2 | Mean Difference (IV, Random, 95% CI) | Subtotals only | |
| 1.1 At 12 months | 1 | 1137 | Mean Difference (IV, Random, 95% CI) | ‐0.10 [‐0.22, 0.02] |
| 1.2 At 24 months | 2 | 1552 | Mean Difference (IV, Random, 95% CI) | ‐0.12 [‐0.23, ‐0.01] |