قطرههای چشمی حاوی سرم اتولوگ در مدیریت درمانی خشکی چشم
چکیده
پیشینه
از لحاظ تئوری، قطرههای چشمی حاوی سرم اتولوگ (autologous serum; AS) مزیت بالقوهای نسبت به درمانهای مرسوم و رایج دارند که نشان میدهد AS نه تنها جایگزین اشک برای خیس نگه داشتن چشم است بلکه حاوی اجزای بیوشیمیایی دیگری است که اجازه میدهد ترکیبی بسیار نزدیک اشک طبیعی داشته باشد. استفاده از AS بهعنوان درمان خط دوم برای بیماران مبتلا به خشکی چشم محبوبیت زیادی به دست آورده است. مطالعات منتشر شده در این زمینه نشان میدهند که سرم اتولوگ میتواند درمان موثری برای خشکی چشم باشد.
اهداف
این مرور را برای ارزیابی اثربخشی و ایمنی AS بهتنهایی یا در ترکیب با اشکهای مصنوعی در مقایسه با اشک مصنوعی بهتنهایی، محلول سالین، دارونما (placebo)، یا عدم‐درمان برای بزرگسالان مبتلا به خشکی چشم انجام دادیم.
روشهای جستوجو
ما CENTRAL (شامل پایگاه ثبت کارآزماییهای گروه چشم و بینایی کاکرین) (2016، شماره 5)؛ Ovid MEDLINE؛ Ovid MEDLINE In‐Process and Other Non‐Indexed Citations؛ Ovid MEDLINE Daily؛ Ovid OLDMEDLINE (ژانویه 1946 تا جولای 2016)؛ Embase (ژانویه 1980 تا جولای 2016)؛ ISRCTN registry (LILACS) (ژانویه 1982 تا جولای 2016)؛ ISRCTN registry (www.isrctn.com/editAdvancedSearch)؛ ClinicalTrials.gov (www.clinicaltrials.gov) و World Health Organization (WHO) International Clinical Trials Registry Platform (ICTRP) (www.who.int/ictrp/search/en) را جستوجو کردیم. همچنین بانک اطلاعاتی Science Citation Index Expanded (دسامبر 2016) و فهرست منابع مطالعات وارد شده را جستوجو کردیم. هیچ محدودیتی را در تاریخ انتشار یا زبان نگارش مقاله در جستوجوهای الکترونیکی کارآزماییها اعمال نکردیم. اخیرا بانکهای اطلاعاتی الکترونیکی را در 5 جولای 2016 جستوجو کردیم.
معیارهای انتخاب
کارآزماییهای تصادفیسازی و کنترل شدهای (randomised controlled trials; RCTs) را وارد کردیم که AS را در مقابل اشک مصنوعی برای درمان بزرگسالان مبتلا به خشکی چشم مقایسه کردند.
گردآوری و تجزیهوتحلیل دادهها
دو نویسنده مرور بهطور مستقل از هم تمام عناوین و چکیدهها را غربالگری کرده و گزارشهای متن کامل کارآزماییهای بالقوه واجد شرایط را ارزیابی کردند. دو نویسنده مرور دادهها را استخراج و خطر سوگیری (bias) و ویژگیهای کارآزماییهای وارد شده را ارزیابی کردند. برای به دست آوردن اطلاعات از دست رفته با محققان تماس گرفتیم. برای پیامدهای اولیه و ثانویه، تفاوتهای میانگین (MD) را با 95% فاصله اطمینان (CI) متناظر آنها برای پیامدهای پیوسته ارائه دادیم. با توجه به وجود تفاوتها در ارزیابیهای پیامد در طول کارآزماییها، متاآنالیز را انجام ندادیم.
نتایج اصلی
پنج RCT واجد شرایط (92 شرکتکننده) را شناسایی کردیم که AS را در مقابل اشک مصنوعی یا محلول سالین در افراد مبتلا به خشکی چشم با علل مختلف (خشکی چشم مرتبط با سندرم شوگرن (Sjögren's syndrome)، خشکی چشم سندرم غیر‐شوگرن، و خشکی چشم پس از جراحی ناشی از کراتومیلئوزیس in situ با کمک لیزر (keratomileusis) (laser‐assisted in situ keratomileusis; LASIK)) مقایسه کردند. به دلیل فقدان گزارش از دادههای کمّی برای اغلب پیامدها و وجود خطر نامشخص یا بالای سوگیری، کیفیت شواهد را پائین یا بسیار پائین ارزیابی کردیم. با توجه به ارائه گزارش ناکافی از ویژگیهای کارآزمایی، بیشتر حوزههای خطر سوگیری را در دو کارآزمایی نامشخص ارزیابی کرده، و یک کارآزمایی را در اکثر زمینهها در معرض خطر بالای سوگیری در نظر گرفتیم. دو کارآزمایی باقیمانده در معرض خطر پائین سوگیری قرار داشتند؛ با این حال، این کارآزماییها از طراحی متقاطع استفاده کرده و دادهها را به گونهای گزارش نکردند که برای مقایسه پیامدها بین گروههای درمانی استفاده شوند. گزارشدهی ناقص از پیامد و ناهمگونی بین پیامدها و دورههای پیگیری، از ورود این کارآزماییها در خلاصه متاآنالیز پیشگیری کرد.
سه کارآزمایی AS را با اشک مصنوعی مقایسه کردند؛ با این حال، فقط یک مطالعه، دادههای کمّی را برای آنالیز ارائه داد. شواهدی با قطعیت پائین از یک کارآزمایی نشان داد که AS در مقایسه با اشک مصنوعی ممکن است نشانههای گزارش شده را توسط خود شرکتکنندگان پس از دو هفته درمان بهبود بخشند؛ تفاوت میانگین (MD) در میانگین تغییر نمرات نشانهها، اندازهگیری شده بر اساس مقیاس آنالوگ بصری (محدوده 0 تا 100، نمرات بالاتر نشاندهنده نشانههای بدتر شدن است)، 0.12‐ (95% فاصله اطمینان (CI): 20.16‐ تا 3.84‐؛ 20 شرکتکننده) گزارش شد. همان کارآزمایی نتایج مختلفی را با توجه به پیامدهای سطح چشم یافت؛ تفاوت میانگین در میانگین تغییر نمرات بین AS و اشک مصنوعی برای رنگآمیزی فلوروسئین (fluorescein staining) معادل 0.9‐ (95% CI؛ 1.47‐ تا 0.33‐؛ 20 شرکتکننده، شواهد با قطعیت پائین) و برای رنگآمیزی رز بنگال (Rose Bengal staining)، 2.2‐ (95% CI؛ 2.73‐ تا 1.67‐؛ 20 شرکتکننده؛ شواهد با قطعیت پائین) بود. هر دو مقیاس رنگآمیزی در محدوده 0 تا 9 قرار داشتند، نمرات بالاتر نشان دهنده نتایج بدتر بود. میانگین تغییر در زمان شکسته شدن غشای اشک در گروه AS در مقایسه با گروه اشک مصنوعی، 2.00 ثانیه طولانیتر (95% CI؛ 0.99 تا 3.01؛ 20 شرکتکننده؛ شواهد با قطعیت پائین) بود. محققان هیچ تفاوتی بالینی معنیداری را در نمرات آزمون شیرمر (Schirmer’s test scores) بین گروهها گزارش نکردند (تفاوت میانگین (MD): 0.40‐ میلیمتر؛ 95% CI؛ 2.91‐ تا 2.11‐؛ 20 شرکتکننده؛ شواهد با قطعیت پائین). هیچ یک از این سه کارآزمایی هیپراسمولاریته اشک (tear hyperosmolarity) و عوارض جانبی را گزارش نکردند.
دو کارآزمایی، AS را در مقابل محلول سالین مقایسه کردند؛ با این حال، فقط یک مطالعه، دادههای کّمی را برای آنالیز فقط یک پیامد (رنگآمیزی Rose Bengal) گزارش کرد. محققان کارآزمایی دو مطالعه، هیچ تفاوتی را در نمرات نشانه، نمرات رنگآمیزی فلوروسئین، زمان شکسته شدن غشای اشک، یا نمرات تست شیرمر بین گروهها در دو تا چهار هفته پیگیری گزارش نکردند. شواهد به دست آمده از یک کارآزمایی با قطعیت بسیار پائین نشان داد که AS ممکن است بهبودی را در نمرات رنگآمیزی رز بنگال در مقایسه با محلول سالین پس از چهار هفته درمان فراهم کند؛ تفاوت میانگین در نمره رنگآمیزی رز بنگال 0.60‐ (محدوده بین 0 و 9، نمرات بالاتر نشان دهنده نتایج بدتر) (95% CI؛ 1.11‐ تا 0.09‐؛ 35 شرکتکننده) بود. هیچ یک از کارآزماییها، پیامدهای هیپراسمولاریته اشک را گزارش نکردند. یک کارآزمایی عوارض جانبی را گزارش کرد؛ دو بیمار از 12 شرکتکننده، علائم کنژکتیویت را با کشت منفی نشان دادند که برطرف شد.
نتیجهگیریهای نویسندگان
بهطور کلی، محققان درباره فواید احتمالی AS در بهبود نشانههای گزارش شده توسط شرکتکنندگان و دیگر معیارهای بالینی مورد نظر ناهمگونی یافتند. ممکن است مزایایی در نشانهها با AS در مقایسه با اشک مصنوعی در کوتاه‐مدت وجود داشته باشد، اما هیچ شواهدی را از تاثیر آن پس از دو هفته درمان نیافتیم. برای ارزیابی مزایای AS درمانی در مدیریت خشکی چشم، انجام RCTهایی با برنامهریزی خوب، بزرگ، و با کیفیت بالا به منظور بررسی شرکتکنندگان مبتلا به خشکی چشم با شدتهای مختلف با استفاده از پرسشنامههای استاندارد سنجش پیامدهای گزارش شده توسط شرکتکنندگان، همچنین تستهای بالینی عینی (objective) و بیومارکرهای عینی، ضروری است.
PICO
خلاصه به زبان ساده
قطرههای چشمی ساخته شده از سرم اتولوگ در درمان خشکی چشم
هدف از این مرور چیست؟
این مرور کاکرین را برای یافتن پاسخ این سوال انجام دادیم که قطرههای چشمی حاوی سرم اتولوگ به عنوان درمان برای خشکی چشم چگونه عمل میکنند. محققان کاکرین همه مطالعات مرتبط را برای پاسخ به این سوال جستوجو کرده و پنج مطالعه را یافتند.
پیامهای کلیدی این مرور چه هستند؟
قطرههای چشمی حاوی سرم اتولوگ ممکن است در بهبود نشانههای خشکی چشم در کوتاه‐مدت (دو هفته) بهتر از قطرههای اشک مصنوعی باشند. اطلاعات بسیار کمی را در مورد اینکه قطرههای چشمی حاوی سرم اتولوگ در طولانی‐مدت یا برای معیارهای بالینی خشکی چشم چگونه عمل میکنند، یافتیم.
در این مرور چه موضوعی مورد مطالعه قرار گرفت؟
خشکی چشم یک اختلال شایع است در غشای اشک، یعنی لایه اشکی پوشش دهنده سطح چشم. خشکی چشم بسیاری از بزرگسالان بالای 40 سال را تحت تاثیر قرار میدهد. افراد مبتلا به این وضعیت ممکن است در یک یا هر دو چشم احساس ناراحتی کرده و به نور حساسیت داشته باشند. تستهای بالینی وجود دارند که توسط متخصصان مراقبت سلامت برای اندازهگیری مقدار اشکی که چشم تولید میکند و اینکه اشک چقدر سریع از چشم پائین میآید، استفاده میشوند. گاهی اوقات این معیارهای بالینی با نشانهها مطابقت ندارند؛ ممکن است فردی خشکی چشم شدید و نتایج طبیعی تست بالینی، یا خشکی خفیف چشم و نتایج غیر‐طبیعی تست بالینی داشته باشد.
درمان معمول برای خشکی چشم، استفاده از اشک مصنوعی است که سطح چشم را خیس میکند. با این حال، اشک مصنوعی فاقد مواد مغذی بیولوژیکی موجود در اشک طبیعی است که برای حفظ غشای اشک بسیار ضروری هستند. قطرههای چشمی که با جداسازی اجزای مایع و سلولی خون بیمار ساخته شده و به نام قطرههای چشمی حاوی سرم اتولوگ شناخته میشوند، نشان دادند که مشابه بسیاری از مواد مغذی بیولوژیکی موجود در اشک طبیعی هستند. به همین دلیل، تصور میشود که قطرههای چشمی سرم اتولوگ، جایگزین بهتری بوده و برای درمان خشکی چشم پیشنهاد شدهاند.
نتایج اصلی این مرور چه هستند؟
پنج مطالعه را با حضور افراد مبتلا به خشکی چشم در استرالیا، شیلی، ژاپن، و ترکیه یافتیم. این مطالعات، قطرههای چشمی حاوی سرم اتولوگ را در مقابل اشک مصنوعی مرسوم یا محلول سالین برای درمان خشکی چشم مقایسه کردند. با توجه به وجود تفاوت در آنچه که هر مطالعه مورد بررسی قرار داد، نتوانستیم نتایج بهدست آمده را از پنج مطالعه در تحلیلها ترکیب کنیم. در یک مطالعه، افرادی که قطرههای چشمی حاوی سرم اتولوگ دریافت کردند، نسبت به کسانی که با اشک مصنوعی درمان شدند، پس از دو هفته بهبودی بهتری را در نشانهها نشان دادند. با این حال، نتایج پس از درمان طولانیتر (چهار هفته یا بیشتر) و برای دیگر پیامدها، مشکلاتی را در پی داشتند که نتوانستند به ما بگویند سرم اتولوگ واقعا بهتر از قطرههای اشک مصنوعی یا سالین هستند یا خیر. نویسندگان این مرور نتیجه گرفتند که سرم اتولوگ در مقابل اشک مصنوعی ممکن است در کوتاه‐مدت، مزایایی را برای درمان خشکی چشم ایجاد کند. با این حال، بهنظر میرسد که فعلا مزایای کلی مشخص نبوده، و انجام تحقیقات بیشتری در این زمینه مورد نیاز است.
این مرور تا چه زمانی بهروز است؟
نویسندگان مرور کاکرین، به دنبال یافتن مطالعاتی بودند که تا 5 جولای 2016 منتشر شدند.
Authors' conclusions
Summary of findings
| Autologous serum compared with artificial tears for dry eye | ||||||
| Patient or population: participants with dry eye Settings: eye clinics Intervention: autologous serum 20% Comparison: artificial tears | ||||||
| Outcomes | Illustrative comparative risks* (95% CI) | Relative effect | Number of participants | Certainty of the evidence | Comments | |
| Assumed risk | Corresponding risk | |||||
| Artificial tears | Autologous serum | |||||
| Participant‐reported symptoms Range of scale: 0‐100, where a higher score is worse Follow‐up: 2‐4 weeks | Mean change in symptom score in the control group was 7.2 point improvement | Mean change in symptom score in the autologous serum group was 12.0 points more improved (20.16 to 3.84 more improved) | 20 | ⊕⊕⊝⊝ | Trial investigators of 2 other studies reported more symptomatic improvement in the autologous serum group than in the artificial tears group; however, studies used a cross‐over design and did not provide sufficient data for comparison of treatments between groups | |
| Tear hyperosmolarity Follow‐up: 2‐4 weeks | Not reported | |||||
| Fluorescein staining Range of scale: 0‐9, where a higher score is worse Follow‐up: 2‐4 weeks | Mean change in fluorescein score in the control group was 0.2 point improvement | Mean change in fluorescein score in the autologous serum group was 0.9 points more improved (1.47 to 0.33 more improved) | 20 | ⊕⊕⊝⊝ | Trial investigators of 2 other studies reported a non‐significant difference in Oxford Scale scores; however, studies used a cross‐over design and did not provide sufficient data for comparison of treatments between groups | |
| Rose Bengal staining Range of scale: 0‐9, where a higher score is worse Follow‐up: 2‐4 weeks | Mean change in Rose Bengal score in the control group was 0.1 point improvement | Mean change in Rose Bengal score in the autologous serum group was 2.2 points more improved (2.73 to 1.67 more improved) | 20 | ⊕⊕⊝⊝ | Trial investigators of 2 other studies did not report data for this outcome | |
| Tear film break‐up time Follow‐up: 2‐4 weeks | Mean change in tear film break‐up time in the control group was 0.1 seconds | Mean change in tear film break‐up time in the autologous serum group was 2.00 seconds longer (0.99 to 3.01 longer) | 20 | ⊕⊕⊝⊝ | Trial investigators of 2 other studies reported the difference in TBUT between groups as 1 and 2 seconds; however, studies used a cross‐over study design and did not provide sufficient data for comparison of treatments between groups | |
| Schirmer’s test Score < 4 mm indicates severe dry eye Follow‐up: 2‐4 weeks | Mean Schirmer’s test score in the control group was 3.7 mm | Mean Schirmer’s test score in the autologous serum group was | 20 | ⊕⊕⊝⊝ | Trial investigators of 1 other study reported no difference in Schirmer’s test scores between groups; however, the study used a cross‐over design and did not provide sufficient data for comparison of treatments between groups | |
| Adverse events | Not reported | |||||
| *The basis for the assumed risk is the control group risk across studies. The corresponding risk (and its 95% confidence interval) is based on the assumed risk in the comparison group and the relative effect of the intervention (and its 95% CI) | ||||||
| GRADE Working Group grades of evidence | ||||||
| aDowngraded (‐1) for imprecision (wide confidence intervals) | ||||||
| Autologous serum compared with saline for dry eye | ||||||
| Patient or population: participants with dry eye Settings: eye clinics Intervention: autologous serum 20% Comparison: saline | ||||||
| Outcomes | Illustrative comparative risks* (95% CI) | Relative effect | Number of participants | Certainty of the evidence | Comments | |
| Assumed risk | Corresponding risk | |||||
| Saline | Autologous serum | |||||
| Participant‐reported symptoms Follow‐up: 2‐4 weeks | See comment | Trial investigators of 2 studies reported no difference in symptom scores between groups; however, studies did not provide sufficient data for comparison of treatments between groups | ||||
| Tear hyperosmolarity Follow‐up: 2‐4 weeks | Not reported | |||||
| Fluorescein staining Range of scale: 0‐9, where a higher score is worse Follow‐up: 2‐4 weeks | See comment | Trial investigators of 2 studies reported no difference in fluorescein staining scores between groups; however, studies did not provide sufficient data for comparison of treatments between groups | ||||
| Rose Bengal staining Range of scale: 0‐9, where a higher score is worse Follow‐up: 2‐4 weeks | Mean Rose Bengal score in the control group was 0.9 points | Mean Rose Bengal score in the autologous serum group was 0.60 points lower (1.11 to 0.09 lower) | 35 | ⊕⊝⊝⊝ | Trial investigators of 1 other study reported no difference in Rose Bengal staining scores between groups; however, the study did not provide sufficient data for comparison of treatments between groups | |
| Tear film break‐up time Follow‐up: 2‐4 weeks | See comments | Trial investigators of 1 study reported no difference in tear film break‐up time between groups; however, the study did not provide sufficient data for comparison of treatments between groups | ||||
| Schirmer’s test Score < 4 mm indicates severe dry eye Follow‐up: 2‐4 weeks | See comments | Trial investigators of 1 study reported no difference in Schirmer's test scores between groups; however, the study did not provide sufficient data for comparison of treatments between groups | ||||
| Adverse events | See comments | One study reported that 2 of 12 participants had signs of conjunctivitis with negative culture; in both cases, symptoms resolved later with proper treatment. It was not stated whether affected eyes were assigned to the AS group or the control group | ||||
| *The basis for the assumed risk is the control group risk across studies. The corresponding risk (and its 95% confidence interval) is based on the assumed risk in the comparison group and the relative effect of the intervention (and its 95% CI) | ||||||
| GRADE Working Group grades of evidence | ||||||
| aDowngraded (‐3) for high or unclear risk of selection, performance, detection, and reporting bias | ||||||
Background
Description of the condition
Dry eye is a common disorder, with an estimated 25% of patients in general ophthalmology or optometry clinics reporting dry eye symptoms (Doughty 1997). It is known that the incidence of dry eye increases with age, and that it is more prevalent in women than in men (McCarty 1998; Schaumberg 2003; Stern 2004). Recently, the Definition and Classification Subcommittee of the International Dry Eye Work Shop (DEWS) redefined dry eye as “a multifactorial disease of the tears and ocular surface that results in symptoms of discomfort (including foreign body sensation, dryness or irritation, burning, light sensitivity, redness), visual disturbance, secretion with crusting on the eyelashes, and tear film instability with potential damage to the ocular surface. It is accompanied by increased osmolarity of the tear film and inflammation of the ocular surface" (DEWS 2007). Increased tear osmolarity, which causes ocular surface inflammation, is thought to be the central pathogenic mechanism of dry eye (DEWS 2007).
The mechanistic classification of dry eye suggested by DEWS defines two main subtypes: aqueous deficiency and evaporative dry eye, which respectively correspond to disorders of the lacrimal and meibomian glands (DEWS 2007). Disorders of the lacrimal and meibomian glands are usually secondary to systemic disease or local causes. One of the most common systemic diseases causing dry eye is Sjögren’s syndrome, which presents as “sicca complex,” a combination of dry eye and dry mouth (xerostomia) due to T lymphocyte‐mediated destruction of the exocrine glands (Fox 2006; Kumar 2005; Yamada 1990). Other systemic diseases, such as rheumatoid arthritis, diabetes, and systemic lupus erythematosus; and dermatological conditions, such as acne rosacea and Graves' disease have been reported as causing clinically significant dry eye (Patel 2002). On the other hand, leading causes of non–systemic disease‐related dry eye include age‐related lacrimal dysfunction (Demato 1984), hormonal changes, drug side effects (e.g., systemic antihistamines, diuretics, topical beta blockers for glaucoma therapies) (Baudouin 2001; Blomquist 2010), and surgical intervention (e.g., photorefractive keratectomy (PRK), laser in situ keratomileusis (LASIK); Campos 1992; Noda‐Tsuruya 2006; Toda 2004), as well as long‐term contact lens use (Lemp 1995).
Dry eye is diagnosed with validated patient symptom questionnaires and a wide array of clinical assessments of the tears and ocular surface. Symptoms of dry eye have been standardized by the use of questionnaires. Patients' most common complaints include dryness or irritation, light sensitivity, foreign body sensation, red eyes, poor vision, daily life limitations, and symptom fluctuation in different environmental conditions. However, researchers have noted no strong correlation between signs and symptoms, particularly in cases of mild dry eye (Begley 2003; Viso 2012). Therefore, the clinical diagnosis of dry eye needs to incorporate objective tests, such as tear osmolarity, tear production assessed by Schirmer's testing, fluorescein clearance, tear film break‐up time (TBUT), and demonstration of ocular surface damage through dye staining (fluorescein and lissamine green) (Lemp 1995; Lemp 2011; Perry 2004). Although no gold standard diagnostic test is presently available to identify dry eye, a growing number of studies have suggested that tear osmolarity might be the best single metric for diagnosis and assessment of severity of dry eye (Lemp 2011; Tomlinson 2006). According to Perry 2004, other study authors have suggested that tear film stability determined by TBUT and delayed tear fluorescein clearance (Chodosh 1994; Marci 2000) are reliable ways to assess dry eye.
Description of the intervention
Currently, no cure for dry eye is known. Common treatments are targeted to management of symptoms. The mainstay of conventional therapy consists of application of artificial tears that increase moisture on the ocular surface and provide additional lubrication. Various artificial tear formulations are available; they differ in terms of electrolyte composition, osmolarity, viscosity, the presence of preservatives, and compatible solutes (Lemp 2008). Nelson 1988 found that an unpreserved artificial tear containing 0.1% sodium hyaluronate was effective in improving dry eye symptoms and led to significant improvement in mean tear film osmolarity, break‐up times, and conjunctival and corneal staining scores. However, the use of artificial tears has some limitations (Pucker 2016). The composition of natural tears is complex; they consist of water, salts, hydrocarbons, proteins, and lipids for which artificial tears cannot exactly serve as a substitute (Dogru 2011; Quinto 2008). Additionally, frequent application of artificial tears solutions containing chemical preservatives to prevent contamination has been found to induce toxic and allergic reactions, especially among those with sensitive eyes (Baudouin 2010; Dogru 2011; Quinto 2008).
Studies have shown that topical corticosteroids that target the inflammatory pathways associated with ocular inflammation improve symptoms in people with dry eye (de Paiva 2008; Pflugfelder 2004), but their use is limited owing to long‐term side effects, including cataracts and increased intraocular pressure (Blomquist 2010). In December 2002, the US Food and Drug Administration (FDA) approved 0.05% solution of cyclosporine A (CsA) as an ocular treatment for people with dry eye (Meadows 2005). Several studies have shown an increase in tear production and in conjunctival goblet cell density with few reported adverse effects following topical application of CsA (Sall 2000; Stevenson 2000; Toker 2010; Wilson 2007).
Additional nutritional supplements, such as essential fatty acids including omega‐3, linoleic acid, and gamma‐linoleic acid, have been proposed as adjuvants in the treatment of dry eye owing to their anti‐inflammatory properties (de Paiva 2008). Increased water intake and reduced alcohol consumption are also recommended to improve dry eye symptoms (Dogru 2011). Environmental interventions designed to increase air moisture and reduce particles in the air, including indoor humidifiers and air filters or cleaners, have been shown to reduce dry eye symptoms as well (Dogru 2011). People for whom artificial tears are not sufficient can achieve preservation of the tear film by inserting punctal plugs into the lacrimal ducts; these are designed to reduce drainage of tears through the lacrimal ducts while increasing lubrication on the ocular surface (Ervin 2010; Foulks 2003).
Use of autologous serum eye drops
The composition of serum resembles that of tears; most concentrations are equivalent, with the exception that serum has more vitamin A, lysozyme, transforming growth factor‐β (TGF‐β), and fibronectin, and less immunoglobulin A (IgA), epithelial growth factor (EGF), and vitamin C than are found in tears (Bradley 2008; Joh 1986; Matsumoto 2004; Nelson 1992; Tsubota 1999). Given that many of the essential components in tears are present in serum, use of serum as a tear substitute for maintenance of the ocular surface seems feasible (Imanishi 2000; Kojima 2005b). In 1975, Ralph 1975 initially applied autologous serum eye drops (AS) for dry eye and reported this event. Since that time, AS have become increasingly popular for treating patients with ocular surface diseases, mainly dry eye.
Production of autologous serum eye drops
Currently, no forms of AS are commercially available; AS must be compounded with the use of autologous serum. Technological factors affect product quality and properties of AS (Geerling 2004; Liu 2005). Even though methods used for AS preparation, storage, and administration are highly variable, standards have been established to optimize therapeutic effectiveness and product safety (Geerling 2004; Liu 2005). In brief, blood is first drawn from the recipient and is then allowed to clot in the absence of an anticoagulant. Once a clot has formed, the supernatant is centrifuged to separate serum from solid components without inducing hemolysis. After centrifugation, the serum is decanted into a sterile container and may then be diluted to the desired concentration. Autologous serum typically is administered in a 20% concentration, which is based on the concentration of biological factors in actual tears, although higher concentrations (between 50% and 100%) have been used (Dogru 2011; Geerling 2004; Kojima 2008; Quinto 2008). It is known that serum may contain components that are detrimental to the ocular surface. TGF‐β, for example, is known to have antiproliferative effects, and high concentrations of TGF‐β may suppress wound healing of the ocular surface epithelium (Tsubota 2000). This observation contributed to use of a diluted solution of serum to maintain TGF‐β levels that are comparable with those of tears. Preservatives usually are not added to AS, thus reducing the risk of preservative‐induced toxicity associated with other dry eye treatments. However, lack of preservatives theoretically increases the risk of ocular infection. Autolgous serum can be stored for less than one month at 4°C while in use, and for up to three months at ‐20°C (Tsubota 1999). It is important that vials containing autologous serum be kept away from light to avoid degradation of vitamin A.
Indications
Autologous serum eye drops have been recommended for treatment of patients with several ocular surface disturbances, such as Sjögren’s syndrome‐related tear deficiency, non‐Sjögren’s tear deficiency associated with graft‐versus‐host disease, neurotrophic keratitis, persistent epithelial defects, superior limbic keratoconjunctivitis, and postoperative dry eye induced by LASIK. People treated with 20% to 50% AS four to eight times a day have reported subjective improvement in dry eye symptoms; investigators have also noted objective improvement based on fluorescein staining and results of break‐up time tests (Chiang 2007; Hyon 2007; Kojima 2005b; Matsumoto 2004; Ogawa 2003; Poon 2001; Tananuvat 2001).
Complications
AS usually are well tolerated, and most recipients report less discomfort. Occasionally, patients may experience increased discomfort, slight epitheliopathy (dropout of corneal epithelial cells, akin to fluorescein staining of the surface of the eye), bacterial conjunctivitis, or eyelid eczema (Ogawa 2003; Rocha 2000; Tananuvat 2001). Fox 1984 reported no serious complications but mentioned that other investigators had encountered scleral vasculitis and melting in people with rheumatoid arthritis. McDonnell 1988 described complications such as the deposit of immunoglobulins within the cornea and the presence of corneal peripheral infiltrates with 100% autologous serum treatment in one person.
Risk of infection
Some components of serum may have bacteriostatic effects, for example, lysozyme, complement, and IgG; therefore, the addition of another bacteriostatic agent may not be necessary. It has been reported that AS can be used safely in both outpatient and inpatient settings, under a strict protocol of preparation and storage (Langnado 2004; Partal 2011). However, even though AS are prepared under sterile conditions on an individual patient basis, researchers have noted risks for contamination and consequent infection during preparation, storage, and use of the drops (Geerling 2004; Lee 2008).
Selection of people suitable for autologous serum
In the United States, the FDA and the American Association of Blood Banks (AABB) have specified criteria for autologous blood donors, which include a minimum hemoglobin concentration of 11 g/dL (hematocrit of 33%) and deferral for conditions presenting risk of bacteremia. Individual blood collection facilities and medical providers may apply additional criteria; these often specify that the patient must be well enough to undergo venipuncture several times a year and to withstand loss of blood (Noble 2004; Roback 2008). Blood collection facilities sometimes specifically defer people considered to be at greatest risk from blood donation, such as those with unstable angina, recent myocardial infarction or cerebrovascular accident, and significant cardiac or pulmonary disease with chronic symptoms who have not been evaluated by the treating physician, and those with untreated aortic stenosis. Children and pregnant women often are excluded (Roback 2008).
To prevent risk of viral transmission to others (e.g., production or nursing staff, children at home who may unintentionally use serum eye drops), it is strongly recommended that the donor be tested for blood‐transmitted diseases (e.g., human immunodeficiency virus (HIV), hepatitis B virus (HBV), hepatitis C virus (HCV), syphilis), that hospital staff be cautious of serum production, and that the identity of the recipient be confirmed (Geerling 2004; Yoon 2007). Although significant legal ramifications are associated with potential transmission of blood‐based diseases to medical staff as well as serum recipients, no consensus indicates whether people who have blood‐transmissible diseases should be disqualified from donating serum for their personal use when medically indicated.
Legal regulations
Autologous serum eye drops are unique among ophthalmic therapies in that they are manufactured specifically for each individual and are made from each person’s own blood. Regulations on autologous blood donation vary from country to country. In the United States, the Center for Biologics Evaluation and Research (CBER) of the FDA is responsible for the regulation of blood intended for transfusion, as well as blood components and derivatives. In the European Union (EU), the European Parliament and Council has issued several directives on AS (1965/65, 1975/139, 1975/318). However, these directives had to be taken into account by those passing laws for each member state of the EU (Geerling 2004). For example, the National Blood Service in England and Wales has supplied AS under a drug exemption certificate for the purposes of a clinical trial conducted by the regulatory body in the United Kingdom ‐ the Medicines and Healthcare Regulatory Agency (Noble 2004). When considering integration of AS therapy into treatment regimens, clinicians must take into account special regulations provided by the FDA and other regulatory agencies regarding use of blood products (Geerling 2008; Noble 2004; Roback 2008).
How the intervention might work
Studies have shown that AS contain biochemical factors, such as EGF, vitamin A, TGF‐β, fibronectin, substance P, insulin‐like growth factor‐1 (IGF‐1), nerve growth factor (NGF), and other cytokines essential for proliferation, differentiation, and maturation of the normal ocular surface epithelium (Gordon 1995; Matsumoto 2004; McCluskey 1987; Nishida 1983; Nishida 1987; Phan 1987; Poon 2001). Therefore, a potential advantage of AS over traditional therapies is that AS serves as a lacrimal substitute that provides lubrication and other biochemical components of tears to assist in corneal and conjunctival epithelium maintenance with limited toxicity (Dogru 2011; Geerling 2004; Liu 2005; Poon 2001; Quinto 2008).
Why it is important to do this review
Autologous serum eye drops for severe dry eye treatment have gained widespread acceptance over the past decade. However, this continues to be a restricted topic because preparation of serum eye drops requires a well‐equipped laboratory and trained personnel. Studies conducted recently are controversial with regard to effectiveness of AS for dry eye symptoms (Noble 2004; Tananuvat 2001). Therefore, we conducted a systematic review to determine the efficacy and safety of AS for treatment of patients with dry eye. This review, first published in 2013, found inconsistency in the possible benefits of AS for improving participant‐reported symptoms and TBUT and lack of effect based on other objective clinical measures (Pan 2013). We updated this review to determine whether additional evidence is now available.
Objectives
We conducted this review to evaluate the efficacy and safety of AS given alone or in combination with artificial tears as compared with artificial tears alone, saline, placebo, or no treatment for adults with dry eye.
Methods
Criteria for considering studies for this review
Types of studies
We included only randomized controlled trials (RCTs) for the purposes of this review. Given the stability of the condition of interest, we also considered cross‐over studies in which the sequence of treatments was determined to have been assigned randomly.
Types of participants
We included in the review studies conducted in adults (over 18 years of age) with dry eye defined by study investigators with no restrictions based on race or sex.
Types of interventions
We included studies that compared application of AS alone or in combination with artificial tears versus artificial tears alone, saline, placebo, or no treatment.
Types of outcome measures
Dry eye clinical tests generally do not correlate with patient‐reported symptoms. A wide variety of participant‐reported outcome scales have led to discrepancies between subjective symptoms and objective clinical tests (Chambers 1999; Fuentes‐Paez 2011; Nichols 2004; Patrick 2011). Therefore, we considered both subjective data from participant‐reported symptoms regardless of the measurement scale used and objective data obtained from clinical diagnostic tests to analyze fully their effect on the condition.
Primary outcomes
We defined symptom improvement as the change from baseline in participant‐reported severity and/or frequency of dry eye‐related symptoms based on validated patient symptom questionnaires at four weeks after initiation of treatment. Given that trial design, frequency of AS administration, and timing of outcome assessment may vary, we considered all variations in frequency of AS use and other time points as reported by included studies.
Secondary outcomes
Investigators reported objective data obtained from ophthalmic examinations and diagnostic tests (Behrens 2006; Tomlinson 2009) two to four weeks after treatment for the following tests.
-
Tear hyperosmolarity: mean change in tear osmolarity.
-
Ocular staining with fluorescein: mean change in total score from baseline to follow‐up.
-
Ocular staining with Rose Bengal: mean change in total score from baseline to follow‐up.
-
Tear film break‐up time: mean change in tear film break‐up time in seconds. A value less than or equal to five seconds indicates level 3 dry eye severity.
-
Schirmer’s test: mean change in millimeters with or without anesthesia. A value less than or equal to 5.5 mm/5 min is indicative of dry eye.
-
Corneal topography: mean change in tear film break‐up time and height of the tear meniscus determined by non‐invasive assessment of the tear film.
-
Impression cytology: mean change in grades of epithelial metaplasia and goblet cell density.
-
Tear fluorescein clearance: mean change in speed of disappearance from the ocular surface of exogenously added fluorescein.
-
Conjunctival biopsy: mean change in grades of squamous metaplasia of the conjunctiva.
Adverse effects
We tabulated adverse effects (e.g., bacterial and viral infection, eye irritation) reported in the included studies for both AS and control groups.
Quality of life measures
We planned to record health‐related quality of life data obtained by any validated measure (e.g., activities of daily vision scale) in the included studies.
Economic data
We planned to document cost analyses and other data on economic outcomes reported by the included studies.
Search methods for identification of studies
Electronic searches
We searched CENTRAL (which contains the Cochrane Eyes and Vision Trials Register) (2016, Issue 5), Ovid MEDLINE, Ovid MEDLINE In‐Process and Other Non‐Indexed Citations, Ovid MEDLINE Daily, Ovid OLDMEDLINE (January 1946 to July 2016), Embase (January 1980 to July 2016), Latin American and Caribbean Literature on Health Sciences (LILACS) (January 1982 to July 2016), the ISRCTN registry (www.isrctn.com/editAdvancedSearch), ClinicalTrials.gov (www.clinicaltrials.gov), and the World Health Organization (WHO) International Clinical Trials Registry Platform (ICTRP) (www.who.int/ictrp/search/en). We did not use any date or language restrictions in the electronic searches for trials. We last searched the electronic databases on 5 July 2016.
See: Appendices for details of search strategies for CENTRAL (Appendix 1), MEDLINE (Appendix 2), EMBASE (Appendix 3), LILACS (Appendix 4), the ISRCTN (Appendix 5), ClinicalTrials.gov (Appendix 6), and the ICTRP (Appendix 7).
Searching other resources
We also searched the Science Citation Index‐Expanded database (December 2016) and reference lists of included studies. We did not handsearch conference proceedings or journals.
Data collection and analysis
Selection of studies
Two review authors independently reviewed the titles and abstracts of all records identified via electronic and manual searches. We classified each record as relevant, potentially relevant, or definitely not relevant. We resolved discrepancies through consensus and obtained full‐text reports of all relevant or potentially relevant records. Two review authors assessed full‐text reports for final inclusion of studies in this review. We resolved discrepancies through consensus. For studies that we excluded after review of the full text, we documented reasons for exclusion (see Characteristics of excluded studies).
Data extraction and management
Two review authors extracted data independently using the data extraction form developed by Cochrane Eyes and Vision for this review. We resolved discrepancies by discussion and contacted study authors for additional data when necessary. One review author entered all data into Review Manager 5 (RevMan 2014), and a second review author confirmed all entered data.
Assessment of risk of bias in included studies
Two review authors assessed risk of bias independently according to methods set out in Chapter 8 of the Cochrane Handbook for Systematic Reviews of Interventions (Higgins 2011a). Review authors were not masked to any trial details during this assessment. We considered the following risk of bias parameters for each of the included studies: sequence generation and allocation concealment (selection bias); masking (blinding) of participants and researchers during and after treatment (performance bias), as well as during outcome assessment (detection bias); completeness of follow‐up for primary and secondary outcomes (attrition bias); and selective outcome reporting (reporting bias). We applied a judgement of "low risk," "unclear risk," or "high risk" to each of the above parameters for each included study.
For cross‐over trials, we considered additional methodological assessments of risk of bias, including whether investigators provided a washout period, the number lost to follow‐up after each phase, and whether study authors reported data for each phase or by treatment, as described in Chapter 16 of the Cochrane Handbook for Systematic Reviews of Interventions (Higgins 2011b).
Measures of treatment effect
We did not conduct summary meta‐analyses of treatment effects in this review. If sufficient data are available for future updates, we will calculate summary risk ratios (RRs) for dichotomous outcomes of interest (proportion of participants reporting improvement in dry eye‐related symptoms). We will dichotomize ordinal data to reflect varying degrees of symptom improvement ("some improvement") and will perform sensitivity analyses while using different cut points (Patrick 2011). For continuous scales of participant‐reported outcomes, we will calculate standardized mean differences (SMDs) to account for variation in measurement scales. We will summarize continuous data from objective ocular tests by calculating mean differences from baseline to follow‐up between treatment and control arms (ocular surface staining, Schirmer's test, and tear break‐up time).
We will use the generic inverse variance method to summarize treatment effects in studies that reported between‐group measures of effect and variance estimates. We will not include quantitative data from cross‐over trials, which report only first phase data, given the risk of bias for incomplete outcome reporting (Higgins 2011b).
Unit of analysis issues
The unit of analysis was the individual participant, who was randomized to each treatment arm in two cross‐over trials (Celebi 2014; Urzua 2012) and in one of the two parallel‐group trials (Kojima 2005a). The other parallel‐group trial randomized participants to each intervention and included in the analyses both eyes of each participant independently (Noda‐Tsuruya 2006). We reported results using the unit of analysis reported by individual studies. One trial used a paired‐eye design, in which researchers evaluated each eye of each participant and considered the eye the unit of analysis (Tananuvat 2001).
Dealing with missing data
We contacted study authors of included trials for clarification or retrieval of missing primary and secondary outcome data. We did not conduct any imputations when study authors did not provide missing data and instead relied on data provided in published reports. For future summary meta‐analyses, when trial authors are unable to provide information on missing data, we plan to conduct sensitivity analyses by assuming that all participants with missing data in the treated group had the worse outcome (if dichotomous); and that all participants with missing data in the treated group did not have the worse outcome.
Assessment of heterogeneity
We assessed clinical and methodological heterogeneity by examining characteristics of study participants, treatment and control comparisons, and assessments of primary and secondary outcomes. Owing to differences in outcome assessments and time points across trials, we did not consider meta‐analysis to be appropriate for this review.
If future updates of this review include meta‐analyses, we will examine consistency across studies by using the I² test (Higgins 2003), and we will regard a value greater than 50% as indicating substantial statistical heterogeneity. We also will inspect forest plots to determine the degree of overlap of confidence intervals among included studies. Little overlap is another indication of the presence of heterogeneity.
Assessment of reporting biases
We were not able to conduct meta‐analysis and could not assess reporting bias through inspection of funnel plots. We assessed studies for selective outcome reporting at the trial level as part of the "Risk of bias" assessment.
Data synthesis
Data were insufficient to allow review authors to conduct a meta‐analysis, as planned in the protocol of this review (Pan 2011). We provided a narrative summary of results in place of statistical summary analyses.
For future updates, we will conduct a random‐effects meta‐analysis when we find clinical, methodological, and statistical homogeneity among included studies. When fewer than three studies are included in a meta‐analysis, we will use a fixed‐effect model. We will not combine studies in a meta‐analysis when we detect substantial heterogeneity among included studies.
Subgroup analysis and investigation of heterogeneity
Data were insufficient to allow review authors to conduct a subgroup analysis for this review. If adequate data are obtained in future updates, we will stratify by underlying cause of dry eye symptoms, including tear deficiencies (Sjögren's syndrome), non–Sjögren’s syndrome–related dry eye, evaporative dry eye (blepharitis or meibomian gland dysfunction (MGD)), and complications of LASIK.
Sensitivity analysis
We did not conduct a sensitivity analysis for this review. For future updates, we will investigate the impact of studies with lower methodological quality (i.e., high risk of bias for random sequence generation or incomplete outcome data for primary or secondary outcomes) and of unpublished studies by performing sensitivity analyses.
Summary of findings
We assessed the certainty of evidence for each outcome in this review by using the GRADE classification method (GRADEpro 2014). The GRADE approach considers five criteria when used to assess the certainty of evidence, including risk of bias, indirectness, heterogeneity, imprecision, and publication bias. Two review authors independently graded each outcome as very low, low, moderate, or high, and resolved disagreements by discussion. We summarized the main findings of GRADE assessments for each outcome in a "Summary of findings" table. In the absence of a core outcome set for dry eye, we selected the seven outcomes presented in the "Summary of findings" table as the primary outcomes (symptom improvement), as well as adverse events and the first five listed secondary outcomes (tear hyperosmolarity, ocular staining with fluorescein, ocular staining with Rose Bengal, tear film break‐up time, and Schirmer’s test score).
Results
Description of studies
Results of the search
We identified a total of 402 titles and abstracts through electronic searches performed as of April 2013 (Pan 2013). After removing duplicates, we screened 360 titles and abstracts. We identified 30 reports of 29 studies as potentially relevant for this review. After full‐text review of the 30 reports, we included three full‐text reports from three trials (Noda‐Tsuruya 2006; Tananuvat 2001; Urzua 2012) and one full‐text report and conference abstract report of findings from another trial (Kojima 2005a) (see Characteristics of included studies).
Updated electronic searches yielded 296 additional records as of July 5, 2016 (Figure 1). We identified one potentially relevant record by searching the Science Citation Index for trials that cited included studies. Of 297 unique records identified, we excluded 291 records by screening titles and abstracts, and five upon review of full‐text reports (Fea 2016; Hwang 2014; Li 2015; Mukhopadhyay 2015; NCT02752763). We included one new trial (Celebi 2014) in the update of this review.
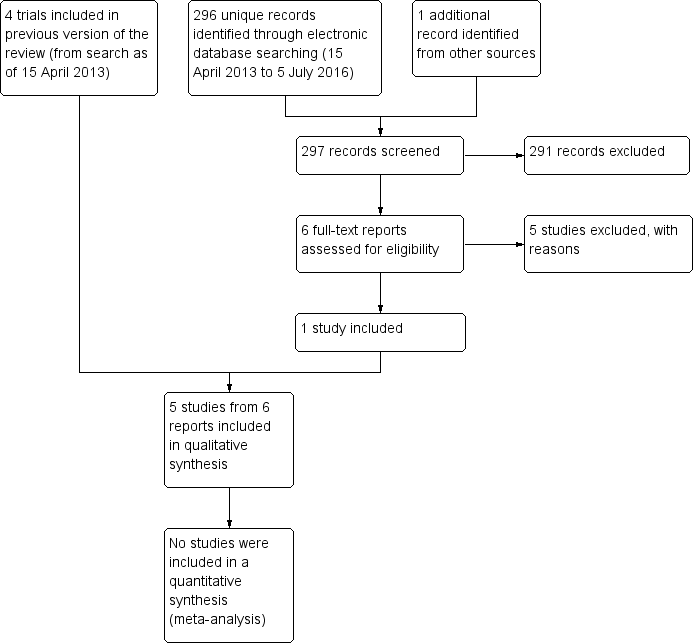
Results obtained by searching for studies for inclusion in the review.
Included studies
Participants
All study participants in the five trials included in this review had dry eye (149 eyes of 92 participants). Causes of dry eye included post LASIK (Noda‐Tsuruya 2006), non‐Sjögren's syndrome (Urzua 2012), and a mix of Sjögren's and non‐Sjögren's conditions (Celebi 2014; Kojima 2005a; Tananuvat 2001). Three trials specifically included participants with dry eye refractory to conventional therapy (e.g., artificial tears, topical cyclosporine) (Celebi 2014; Tananuvat 2001; Urzua 2012). The number of participants in these studies ranged from 12 to 27, and average age ranged between 30 and 65 years. Two trials were conducted in Japan (Kojima 2005a; Noda‐Tsuruya 2006), and one each in Australia (Tananuvat 2001), Chile (Urzua 2012), and Turkey (Celebi 2014). Most trials enrolled both men and women and enrolled more women than men, except for Noda‐Tsuruya 2006, which included only men with post‐LASIK dry eye.
Interventions
All five trials evaluated 20% AS and gave instructions to participants to apply drops four, five, or six times daily, as well as similar instructions for storage of AS study vials across trials. Investigators instructed participants to refrigerate the eye drop bottle in use while freezing the rest. Duration of AS use ranged from two weeks to six months across trials. Three trials compared AS versus artificial tears using a parallel‐group (Kojima 2005a) or cross‐over (Celebi 2014; Urzua 2012) study design; two trials used a parallel‐group (Noda‐Tsuruya 2006) or paired‐eye (Tananuvat 2001) study design to compare 20% AS with saline. Both cross‐over trials included a washout between treatment periods to minimize carry‐over effects. In two trials, participants in both treatment groups received additional topical treatments: preservative‐free artificial tears as needed (Tananuvat 2001) and low‐dose steroids, antibiotics, and hyaluronic acid after the LASIK procedure (Noda‐Tsuruya 2006).
Outcomes
The five included trials used different methods to evaluate participant‐reported symptom improvement at different follow‐up times. For each method used, higher values represented more severe symptoms/discomfort, and a decrease in values from baseline would suggest improvement in symptoms. Two studies described participant‐reported symptoms at one‐month follow‐up ‐ the primary outcome for this review (Celebi 2014; Tananuvat 2001); however, Celebi 2014 used a cross‐over design and reported only between‐group P values. The other three trials presented participant‐reported symptoms noted at additional follow‐up periods between two weeks' (Kojima 2005a; Urzua 2012) and six months' follow‐up (Noda‐Tsuruya 2006). Tananuvat 2001 additionally assessed study participants during follow‐up visits at one week and two months and graded symptoms of dry eye (discomfort, foreign body sensation, dryness, and photophobia) as grade 0, no symptoms; 1, mild; 2, moderate; and 3, severe. Kojima 2005a used a visual analogue scale to assess pain symptom scores ranging from 0 to 100 points, where 0 represents absence of any pain and 100 represents intense and unbearable pain. The visual analogue scale is 10 cm long, and participants mark their responses on the scale. Noda‐Tsuruya 2006 used a written questionnaire to assess dry eye symptoms; participants graded “typical dry eye symptoms” as 0, none; 1, mild; 2, moderate; 3, strong; and 4, very strong. Celebi 2014 and Urzua 2012 used the Ocular Surface Disease Index (OSDI), recommended by the International Dry Eye Workshop (Ozcura 2007), to evaluate participant‐reported improvement in dry eye symptoms.
Although all studies provided measures of TBUT, tear secretion (Schirmer's test), and fluorescein staining, investigators did not follow the same procedures and reported additional differences in the time points at which they collected data. We believe that variation in procedures used to evaluate objective clinical tests would not influence the ability of investigators to compare treatment effects across studies; however, variation in the time points at which outcomes were assessed precluded pooling of data across trials. Kojima 2005a and Noda‐Tsuruya 2006 observed TBUT after instilling 2 μL of 1% Rose Bengal mixed with 1% fluorescein and saline into the cul‐de‐sac; Celebi 2014 used 5 μL of fluorescein sodium; and Tananuvat 2001 placed a fluorescein strip moistened with saline into the lower cul‐de‐sac. Urzua 2012 provided no additional description of how investigators evaluated TBUT.
Celebi 2014, Tananuvat 2001, and Noda‐Tsuruya 2006 specified that they performed Schirmer's test with anesthesia, and Kojima 2005a performed Schirmer's test without anesthesia.
Kojima 2005a and Noda‐Tsuruya 2006 carried out scoring of fluorescein staining of the ocular surface by dividing the cornea into upper, middle, and inferior compartments, and by grading each compartment on a scale of 0 to 3 points (maximum: 9 points). Tananuvat 2001 did not divide the cornea into thirds and graded fluorescein staining of the cornea from 0 to 3. Celebi 2014 and Urzua 2012 used the Oxford Scale (six categories; 0 to 5, where 0 = absent, 1 = minimal, 2 = mild, 3 = moderate, 4 = marked, and 5 = severe) to evaluate fluorescein staining (Bron 2003). The three trials measuring this outcome (Kojima 2005a; Noda‐Tsuruya 2006; Tananuvat 2001) did not report details of the procedures used to evaluate Rose Bengal staining. Only one trial (Tananuvat 2001) evaluated conjunctival impression cytology and frequency of other topical lubricants.
Tananuvat 2001 was the only study that reported results from impression cytology and adverse events. No trial reported outcomes related to tear osmolarity, corneal topography, tear fluorescein clearance, conjunctival biopsy, quality of life, or costs.
Excluded studies
We excluded 30 studies after full‐text review (see Characteristics of excluded studies). Conference abstracts reported two studies (Harritshoj 2011; Jaksche 2005); we found one study in a clinical trial registry record (NCT02752763); and we identified the remainder from full‐text publications. Most excluded studies were non‐randomized studies or reviews. We excluded five RCTs because investigators did not compare AS versus artificial tears or placebo (Fea 2016; Jaksche 2005; Li 2015; Noble 2004; Yoon 2007).
Risk of bias in included studies
Figure 2 presents a summary of the risk of bias for included studies. For two studies (Kojima 2005a; Noda‐Tsuruya 2006), most risk of bias domains were unclear owing to insufficient description in trial reports.

Methodological quality summary: risk of bias review authors' judgements about each risk of bias item for each included study.
Allocation
Sequence generation and allocation concealment
We judged risk of bias domains for sequence generation and allocation concealment to have low risk in two studies (Celebi 2014; Urzua 2012) and unclear risk in two studies (Kojima 2005a; Noda‐Tsuruya 2006). Although the trials assessed to have unclear risk of bias specified randomization of participants, neither of the published reports described in sufficient detail methods used to generate the allocation sequence or ways investigators implemented allocation concealment. One study used block randomization, with block sizes of two resulting in alternating treatment assignment; we judged this study to have high risks of bias for sequence generation and allocation concealment as investigators were unmasked and assignments provided in a block size of two could be known (Tananuvat 2001).
Masking (performance bias and detection bias)
Masking of participants and study personnel
We judged masking of participants and study personnel to the allocated intervention to introduce low risk of bias in two studies (Celebi 2014; Urzua 2012) and unclear risk in two studies (Kojima 2005a; Noda‐Tsuruya 2006). Published reports for Kojima 2005a and Noda‐Tsuruya 2006 provided a full description of measures used to achieve masking; investigators specified a prospective randomized design without clearly reporting masking of participants or study personnel. Researchers conducted the third trial as a single masked study, with participants masked to treatment assignments and investigators unmasked (Tananuvat 2001). We judged this trial to be at low risk of bias for masking participants and at high risk of bias for not masking study personnel.
Participants allocated to the AS group had to undergo blood extraction as part of the serum production process. All five trials (Celebi 2014; Kojima 2005a; Noda‐Tsuruya 2006; Tananuvat 2001; Urzua 2012) reported specific instructions provided for preservation and storage of AS. It is not clear at what point in the randomization process participants were subjected to serum collection procedures, or whether investigators provided the same storage instructions to all participants regardless of treatment assignment. Two studies (Celebi 2014; Urzua 2012) implemented a cross‐over study design, which maintained participant masking, whereby all participants underwent venous blood draw for preparation of their AS. Additional measures taken in these trials included use of opaque flasks and instructions to keep all study medications frozen to ensure participant masking.
Masking of outcome assessors
Investigators considered outcome assessments in two main categories: assessment of participant‐reported symptoms; and assessment of objective clinical examinations. We assessed Celebi 2014 and Urzua 2012 as having low risk of bias for both participant‐reported outcomes and objective clinical tests because participants and outcome assessors were masked. We judged masking of outcome assessors for participant‐reported symptoms to introduce unclear risk for two studies (Kojima 2005a; Noda‐Tsuruya 2006). Neither study provided a full description of how study authors recorded participant‐reported outcomes and whether study personnel collecting this information were aware of each participant’s treatment assignment. Two studies asked participants to complete a written questionnaire or an analogue pain scale (Kojima 2005a; Noda‐Tsuruya 2006). We judged masking of outcome assessors for the objective clinical examination to introduce unclear risk of bias for one study (Noda‐Tsuruya 2006) but low risk for the other (Kojima 2005a). One study kept investigators unmasked; we determined that this study was at high risk of bias for all outcome assessments (Tananuvat 2001).
Incomplete outcome data
We judged the domain for incomplete outcome data to be at low risk of bias for three studies (Celebi 2014; Tananuvat 2001; Urzua 2012) because these studies reported no losses to follow‐up and no missing data. One study (Noda‐Tsuruya 2006) reported the number of eyes for each outcome at all time points across both treatment arms, but investigators did not provide reasons for missing outcome data; the number of analyzed eyes was variable throughout the intervention, and this resulted in a judgement of unclear risk of bias. One trial (Kojima 2005a) excluded two eyes from analyses in the full‐text report but not in the conference abstract for the same trial, with no explanation for the discrepancy.
Selective reporting
We found all studies to be at unclear risk of reporting bias. For one study, we were able to confirm prespecified outcomes described in the ClinicalTrials.gov record against the corresponding publication (Urzua 2012), but we did not have access to study protocols or other related materials for the other studies. Although Urzua 2012 reported data for all outcomes as described in trial registry record, the study used a cross‐over design and outcome data were not reported in a way that we could compare outcomes between treatment groups appropriately. Celebi 2014 also used a cross‐over design and did not report outcome data in a way that we could analyzed the data appropriately. For Noda‐Tsuruya 2006 and Tananuvat 2001, reported information was insufficient for review authors to extract usable data for quantitative summary analyses.
Other potential sources of bias
We were unable to fully assess other potential sources of bias for two studies that we judged to have unclear risk of bias. In one study (Tananuvat 2001), participants in both groups were able to use artificial tears lubricants. The estimated treatment effect of AS may have been influenced if additional lubricants had a perceived therapeutic effect on the outcomes of interest and were used in different frequencies by each group. Another study (Noda‐Tsuruya 2006) reported a discrepancy between the unit of randomization (individual) and the unit of analysis (eyes); this may have led to biased treatment effects with no consideration of within‐participant correlation. On review of predefined inclusion criteria, we identified a discrepancy with inclusion criteria listed in the published report for one study; this led us to judge this study as having unclear risk of bias (Urzua 2012). Furthermore, Celebi 2014 and Urzua 2012 used a cross‐over design but did not provide sufficient information to account for the design, so review authors could analyze the data. For one study, we found sufficient information (appropriate study design, proper ethical conduct, no involvement from industry) to establish low risk of other potential bias (Kojima 2005a).
Effects of interventions
See: Summary of findings for the main comparison Summary of findings: autologous serum compared with artificial tears; Summary of findings 2 Summary of findings: autologous serum compared with saline
We could not combine included studies in meta‐analyses owing to heterogeneity in the time points at which primary and secondary outcomes were reported and insufficient reporting of descriptive statistics (means and standard deviations) necessary for computing treatment effect estimates. Two studies implemented a cross‐over design but did not report the necessary summary statistics from a paired analysis (i.e., mean difference from paired t‐test and corresponding confidence interval or P value) to account for participant‐level differences in AS and artificial tears (Celebi 2014; Urzua 2012). We therefore provide only a narrative description of reported findings from each trial.
We analyzed improvement in symptoms at any follow‐up time point and adverse events at the end of the study. For all secondary outcomes, we present data reported between two weeks and four weeks.
20% autologous serum versus artificial tears
Three of the five included trials measured effects of 20% autologous serum (AS) using preservative‐free artificial tears as a control. Two trials used a cross‐over design and used two different brands of artificial tears (Celebi 2014; Urzua 2012); one trial used a parallel‐group design and did not state which brand of artificial tears was used (Kojima 2005a).
Improvement in symptoms
Celebi 2014 was the only included trial to report results for the specified primary outcome ‐ change from baseline in participant‐reported symptoms ‐ at the specified primary outcome time point for this review of one month's follow‐up. However, all included trials presented participant‐reported symptoms at various follow‐up times.
Both cross‐over trials ‐ Celebi 2014 and Urzua 2012 ‐ used the Ocular Surface Disease Index (OSDI) to measure improvement in symptoms. The OSDI questionnaire consists of 12 questions, which respondents rank from 0 to 4. A score of 0 indicates "none of the time," 1 indicates "some of the time," 2 "half the time," 3 "most of the time," and 4 "all of the time" (Ozcura 2007). The total score is calculated using the following formula: OSDI = ((sum of scores for all answered questions) × 100]/[(total number of questions) × 4) (Ozcura 2007). Total scores can range from 0 to 100; any score above 46 is considered high (Ozcura 2007). Kojima 2005a used a visual analogue scale to assess improvement in symptoms.
Two weeks' follow‐up
Two trials assessed participant‐reported symptoms after two weeks of treatment. Urzua 2012, which used a cross‐over design, reported data only as pooled OSDI values after treatment with AS versus artificial tears, regardless of the phase in which the participant received treatment. Trial investigators reported a 51% decrease in OSDI score in the AS group and a 22% decrease in the artificial tears group, but these data do not account for the cross‐over design and do not provide a between‐group comparison.
In Kojima 2005a, mean change (and standard deviation (SD)) from baseline at two weeks' follow‐up measured on the visual analogue scale was ‐19.2 ± 8.8 for the 20% AS group and ‐7.2 ± 9.8 for the artificial tears group, resulting in a difference in mean change from baseline of ‐12.00 (95% confidence interval (CI) ‐20.16 to ‐3.84; 20 participants; Analysis 1.1). This difference suggests a greater decrease in pain/dry eye symptoms in the 20% AS group compared with the artificial tears group after two weeks; however, the upper limit of the 95% confidence interval translates to a difference of less than 0.5 cm on the visual analogue scale.
We graded the certainty of evidence for symptom improvement at two weeks' follow‐up as low, after downgrading for imprecision (‐1) and unclear risk of bias (‐1).
Four weeks' follow‐up
One trial assessed participant‐reported symptoms after two weeks of treatment. Using a cross‐over design, Celebi 2014 assigned participants to a sequence of 20% AS then artificial tears, or a sequence of artificial tears then 20% AS. Each phase in each sequence lasted one month and was preceded by a washout period. Investigators reported mean OSDI scores for each group at the end of each phase, but these data do not account for the cross‐over design, nor do they allow assessment of the change in OSDI scores between groups. At the end of the first phase, Celebi 2014 reported that the mean OSDI score in the AS 20% group was lower than in the artificial tears group, although scores for both groups fell within the moderate OSDI category.
Three months' follow‐up
After completion of a two‐week washout phase, Celebi 2014 recorded OSDI scores again to serve as a baseline for both groups, but these data do not account for the cross‐over design nor allow assessment of the change in OSDI scores between groups. Similar to one‐month follow‐up, Celebi 2014 reported that the mean OSDI score in the AS 20% group was lower than in the artificial tears group, although scores for both groups fell within the moderate OSDI category.
Six months' follow‐up
Celebi 2014,Kojima 2005a, and Urzua 2012 did not report improvement in symptoms at six months' follow‐up.
Tear hyperosmolarity
None of the included trials reported this outcome.
Ocular surface staining
Fluorescein staining
Three studies reported results of fluorescein staining. In Kojima 2005a, mean change and SD for fluorescein staining from baseline to two weeks was ‐1.1 ± 0.7 for the 20% AS group and ‐0.2 ± 0.6 for the artificial tears group, resulting in a difference in the mean change from baseline of ‐0.90 (95% CI ‐1.47 to ‐0.33; 20 participants; Analysis 1.2). Researchers did not consider this difference to be clinically important and classified fluorescein staining scores for both groups as abnormal (defined as a fluorescein staining score > 1) at baseline and at follow‐up. Urzua 2012 and Celebi 2014 reported a non‐significant difference between groups in mean Oxford Scale scores for fluorescein staining; however, data from these trials do not account for the cross‐over design, nor do they provide sufficient information for comparison of scores between treatment groups.
We graded the certainty of evidence for fluorescein staining as low, after downgrading for imprecision (‐1) and unclear risk of bias (‐1).
Rose Bengal staining
One study reported results for Rose Bengal staining. In Kojima 2005a, the mean change and SD in Rose Bengal staining from baseline to two weeks was ‐2.3 ± 0.8 for the 20% AS group and ‐0.1 ± 0.3 for the artificial tears group, resulting in a difference in the mean change from baseline of ‐2.20 (95% CI ‐2.73 to ‐1.67; 20 eyes; Analysis 1.3). This difference may be considered clinically important; however, study investigators classified Rose Bengal staining scores in both groups as abnormal (defined as a Rose Bengal staining score > 1) at baseline and at follow‐up.
We graded the certainty of evidence for fluorescein staining as low, after downgrading for imprecision (‐1) and unclear risk of bias (‐1).
Tear film break‐up time (TBUT)
Three studies reported results for TBUT. Kojima 2005a reported mean change and SD from baseline to two weeks' follow‐up of 2.1 ± 1.1 seconds for the 20% AS group and 0.1 ± 1.2 seconds for the artificial tears group, resulting in a mean difference of 2.00 seconds (95% CI 0.99 to 3.01) between 10 participants in each treatment group (Analysis 1.4). Trial investigators did not consider this difference to be clinically important, and TBUT at baseline and follow‐up in both groups indicated dry eye (TBUT ≤ 5 seconds; Behrens 2006). Celebi 2014 and Urzua 2012 reported differences in TBUT between groups as 1 and 2 seconds, respectively; however, data from these trials do not account for the cross‐over design, nor do they provide sufficient information for comparison of scores between treatment groups.
We graded the certainty of evidence for fluorescein staining as low, after downgrading for imprecision (‐1) and unclear risk of bias (‐1).
Schirmer’s test
Kojima 2005a performed Schirmer’s test without anesthesia. At two weeks' follow‐up, the mean and SD for the 20% AS group was 3.3 ± 2.6 mm compared with 3.7 ± 3.1 mm for the artificial tears group, resulting in a mean difference of ‐0.40 (95% CI ‐2.91 to 2.11 mm; 20 participants; Analysis 1.5). Investigators did not consider this difference to be clinically important, and Schirmer’s test values in both groups indicated severe dry eye (< 4 mm). Celebi 2014 reported no difference in Schirmer’s test scores between groups; however, data from this trial do not account for the cross‐over design, nor do they provide sufficient information for comparison of scores between treatment groups.
We graded the certainty of evidence for fluorescein staining as low, after downgrading for imprecision (‐1) and unclear risk of bias (‐1).
Corneal topography
None of the included trials reported this outcome.
Impression cytology
Celebi 2014,Kojima 2005a, and Urzua 2012 did not report this outcome.
Tear fluorescein clearance
None of the included trials reported this outcome.
Conjunctival biopsy
None of the included trials reported this outcome.
Adverse events
Celebi 2014,Kojima 2005a, and Urzua 2012 did not report adverse events at any time point.
20% autologous serum versus saline
Two of the five included trials measured effects of 20% AS versus saline eye drops (Noda‐Tsuruya 2006; Tananuvat 2001). We did not perform meta‐analysis owing to insufficient data; Tananuvat 2001 did not report the number of participants per group nor SDs for outcomes.
Improvement in symptoms
Two weeks' follow‐up
Noda‐Tsuruya 2006 and Tananuvat 2001 did not report improvement in symptoms at two weeks.
Four weeks' follow‐up
At four weeks' follow‐up, Tananuvat 2001 reported that the mean composite symptom score was 5.36 for the 20% AS group and 6.45 for the saline group. We could not analyze the difference between 20% AS and saline groups owing to insufficient data; however, trial investigators reported that mean symptom scores were not statistically significantly different (P > 0.05) between groups over a two‐month treatment period.
Six months' follow‐up
Noda‐Tsuruya 2006 did not report descriptive statistics (mean and SD) for 27 post‐LASIK participants (54 eyes) as measured by a five‐point questionnaire. However, in a narrative description, trial investigators reported that they found no statistically significant differences (P > 0.05) in participant‐reported symptoms between the 12 participants (24 eyes) in the 20% AS group and the 15 participants (30 eyes) in the artificial tears group before and after LASIK surgery through six months' follow‐up.
Tear hyperosmolarity
None of the included trials reported this outcome.
Ocular surface staining
Fluorescein staining
Both studies assessed fluorescein staining. Noda‐Tsuruya 2006 reported mean and SD among 20 eyes at one month's follow‐up for the 20% AS group (0.5 ± 0.7) but did not provide data for the 23 eyes in the control group. Tananuvat 2001 reported a mean score of 1.55 for the 20% AS group and 1.55 for the saline group (12 participants in total).
Rose Bengal staining
Both studies assessed Rose Bengal staining. Noda‐Tsuruya 2006 reported that means and SDs were 0.3 ± 0.7 for the 20% AS group and 0.9 ± 0.8 for the saline group, resulting in a mean difference in Rose Bengal staining score of ‐0.60 (95% CI ‐1.11 to ‐0.09; 35 eyes) one month after LASIK (Analysis 2.1). Investigators did not consider this difference clinically important. Tananuvat 2001 reported that the mean for Rose Bengal staining was the same for both 20% AS and control groups at one month's follow‐up (mean 4.22 points for both groups).
We graded the certainty of the evidence for fluorescein staining as very low, after downgrading for high or unclear risk of selection, performance, detection and reporting bias (‐3).
Tear film break‐up time (TBUT)
One study reported TBUT at two to four weeks' follow‐up. Tananuvat 2001 reported means (in seconds) of 0.55 for the 20% AS group and 0.64 for the control group.
Schirmer’s test
Noda‐Tsuruya 2006 performed Schirmer's test with anesthesia; however, trial investigators reported only that they detected no differences between treatment groups and provided no descriptive statistics (mean and SD).
Corneal topography
None of the included trials reported this outcome.
Impression cytology
Only one study reported results from impression cytology according to conjunctival differentiation separated into six stages scored from 0 to 6 (Tananuvat 2001). At two months' follow‐up, the mean score was 1.57 for the 20% AS group and 2.17 for the saline group after two months' follow‐up. Trial investigators reported that the mean difference between groups at two months' follow‐up was non‐significant (P > 0.05).
Tear fluorescein clearance
None of the included trials reported this outcome.
Conjunctival biopsy
None of the included trials reported this outcome.
Adverse events
Tananuvat 2001 reported that two of 12 participants had signs of conjunctivitis with negative culture; in both cases, symptoms resolved later with proper treatment. It was not stated whether investigators assigned affected eyes to the AS group or to the control group. Microbiological culture of serum stored at ‐20°C for up to two months showed no growth. All returned serum bottles underwent culture, and only one sample exhibited mixed organisms, including yeast. Investigators detected no cases of infectious conjunctivitis and no other adverse reactions.
Discussion
Several studies (Fox 1984; Kojima 2005a; Noda‐Tsuruya 2006; Tananuvat 2001; Tsubota 1996; Tsubota 1999; Tsubota 2000) have described the use of autologous serum eye drops (AS) to treat people with dry eye. Our aim in performing this systematic review was to analyze evidence of the highest quality from randomized controlled trials (RCTs) to determine the efficacy and safety of AS in treating people with dry eye. However, most of the published literature is limited to retrospective case reports and non‐randomized case series.
Summary of main results
We identified five RCTs that investigated effects of AS compared with artificial tears or saline in participants with a variety of causes of dry eye (Celebi 2014; Kojima 2005a; Noda‐Tsuruya 2006; Tananuvat 2001; Urzua 2012). Celebi 2014 used a cross‐over design to compare 20% AS (four times daily) versus artificial tears in participants with severe dry eye. Kojima 2005a evaluated the effectiveness of 20% AS after a two‐week treatment interval (six times a day) in participants with severe Sjögren's and non‐Sjögren's syndrome dry eye. Urzua 2012 used a cross‐over design to compare two‐week treatment intervals with 20% AS and artificial tears in 12 adult participants with severe non‐Sjögren's syndrome dry eye. Tananuvat 2001 investigated the efficacy of 20% AS in 12 participants with bilateral severe dry eye over a two‐month treatment interval (six times daily). Noda‐Tsuruya 2006 assessed the efficacy of 20% AS (five times daily) for post‐laser‐assisted in situ keratomileusis (LASIK) dry eye from one week to six months.
Although precise measurement of symptoms is an important part of the dry eye diagnosis, no universally accepted standardized method is known for recording patient‐reported symptoms; it has been commonly observed that participant‐reported symptoms do not correlate with objective clinical test results (Alfonso 1999; Lin 2003; Schein 1997; Viso 2012). Although Celebi 2014 and Urzua 2012 both used the Ocular Surface Disease Index (OSDI), other studies in this review applied different methods to measure participant‐reported symptoms. With consideration of the wide array of subjective questionnaires and scales used to measure participant symptoms and differences in length of follow‐up, the five trials comparing AS versus artificial tears or saline did not consistently observe improvement in participant‐reported symptoms. This might be due to variety in the type and severity of dry eye among participants in these studies.
Reported data from the included studies show that 20% AS were not associated with significant improvement in tear film stability as measured by tear break‐up time (TBUT), aqueous tear production as measured by Schirmer’s test, or improvement in the condition of the ocular surface as measured by fluorescein or Rose Bengal staining compared with preservative‐free artificial tears or saline. Tananuvat 2001 further found that 20% AS did not significantly change impression cytology among participants with severe bilateral dry eye.
Four of the five included studies did not report outcomes for adverse events or complications. One study (Tananuvat 2001) reported conjunctivitis in two participants, with cultures showing no growth followed by resolution of symptoms. All used AS containers returned by study participants for culture; one sample showed mixed organisms, including yeast, but investigators detected no infectious conjunctivitis nor adverse reactions among study participants.
Overall completeness and applicability of evidence
A major difficulty that review authors encountered in summarizing the results of included studies was heterogeneity among participant populations, interventions, and comparisons, as well as variation in procedures performed to prepare AS. We could not conduct summary meta‐analyses because of additional differences in follow‐up intervals and incomplete descriptive statistics for reported treatment outcomes. Also, each study included a sample size with too few participants to detect meaningful differences between groups for many outcomes. Thus, we were able to draw conclusions on the basis of qualitative assessment of trial reports.
Participant characteristics
The causes of dry eye described for included participants may not be representative of all people with dry eye who potentially may benefit from AS. One study (Kojima 2005a) reported previous punctal occlusion as an exclusion criterion, and people with previous punctal occlusion were eligible for inclusion in another (Tananuvat 2001). One trial included participants with post‐LASIK dry eye (Noda‐Tsuruya 2006). Three trials enrolled participants with both severe Sjögren's and non‐Sjögren's syndrome dry eye (Celebi 2014; Kojima 2005a; Tananuvat 2001), and another (Urzua 2012) enrolled participants with severe non‐Sjögren's syndrome dry eye only.
Interventions and comparisons
It is worth noting that investigators in Tananuvat 2001 instructed participants in the intraindividual study, in which participants used AS in one eye and placebo in the fellow eye, to use non‐hyaluronan and unpreserved saline‐based artificial tears as needed. These researchers also reported prior punctal occlusion in 75% of participants at the beginning of the study, adding further to the heterogeneity among included studies.
Preparation and storage of AS
Currently, neither regulatory guidelines nor standard protocols have been provided for the manufacture of AS for dry eye. Critical steps in the production of AS, such as clotting time, centrifugation, and dilution, can influence the biochemical properties of AS and may lead to variable efficacy and treatment outcomes. In this review, only one study reported clotting time of two hours following venipuncture (Urzua 2012), and the other studies did not report clotting time. Geerling 2004 in Germany proposed two hours of clotting time at room temperature followed by optimal centrifugation of whole blood at 3000 × g for 15 minutes. Included studies reported variation in centrifugation speed and time, including 1500 revolutions per minute (rpm) for five minutes (Kojima 2005a), 2200 rpm for 20 minutes (Noda‐Tsuruya 2006), 4200 rpm for 15 minutes (Tananuvat 2001), and 3500 rpm for five minutes (Urzua 2012). It has been demonstrated that higher concentrations of epithelial growth factor (EGF) and lower concentrations of transforming growth factor‐beta (TGF‐β) are obtained at higher centrifugation speed (Liu 2005; Pancholi 1998; Phasukkijwatana 2011). Although none of the included trials measured the concentrations of biologically active components within AS, concentrations of EGF, TGF‐β, or other biological factors might be different across the included studies owing to variation in the rpm used for centrifugation. It is interesting to note that the trials included in this review compared 20% AS versus non‐hyaluronan and unpreserved saline‐based artificial tears or saline. Although results from in vitro studies show the greatest cell proliferation, with serum concentrations ranging from 12.5% to 25% (Geerling 2004; Liu 2005), 20% AS was the only concentration evaluated in the five trials included in this review.
Instructions given to study participants for storing AS were similar across included studies. Specifically, investigators instructed participants to keep vials containing AS in the freezer (‐20°C) for up to three months and in a refrigerator at 4°C for two weeks after thawing. The AS storage instructions given to study participants have been shown to be effective in preventing contamination and deterioration of biological growth factors (Geerling 2004). Kojima 2005a reported an additional precaution to protect serum vials from ultraviolet light because vitamin A is easily degraded by light. A study from Thailand (Phasukkijwatana 2011) demonstrated that the stability of biologically active components within AS could be maintained for up to six months when stored at ‐20°C. However, the US Food and Drug Administration has not approved a standard procedure for preparing AS.
Quality of the evidence
Review authors identified only five small RCTs conducted in single‐center settings; they included 92 total participants with severe Sjögren's‐related dry eye, non‐Sjögren's dry eye, and post‐LASIK dry eye. The small number of participants is insufficient for review authors to detect or rule out meaningful beneficial or harmful effects of AS, or to provide precise estimates of individual outcomes. For many outcomes, data were insufficient for quantitative analysis. For the few outcomes for which analysis was possible, we assessed the certainty of evidence as low or very low.
We found that two studies had unclear risk of bias for masking participants. Given the primary outcome (i.e., change in participant‐reported symptoms), the results of individual trials could have been influenced if participants were aware of their treatment assignment. However, complete masking may not have been feasible, given the necessary venipuncture involved in AS production. Also, variation in instructions reported for proper storage of AS compared with artificial tears might have led to participant knowledge of treatment assignments.
Potential biases in the review process
We employed a comprehensive search strategy to identify potentially eligible trials to minimize selection bias. Throughout the review process, two review authors assessed all potentially eligible studies and completed data extraction independently to minimize errors. Although we sought unpublished data from investigators of all included trials to supplement data provided in the published reports, we were unable to conduct quantitative synthesis for any of the outcomes specified for this review. The limited number of included trials precluded evaluation of potential publication bias through examination of funnel plots.
Agreements and disagreements with other studies or reviews
In the 2011 Prefered Practice Patterns, the American Academy of Ophthalmology (AAO) suggested that autologous serum drops improve ocular symptoms and conjunctival and corneal staining in severe dry eye (AAO 2011). Conclusions of the AAO were described as level "A III," and the AAO did not incorporate findings or conclusions from any of the five RCTs included in our review. Another evidence‐based review (Akpek 2011) found level II B evidence for serum eye drops in Sjögren's syndrome dry eye that reflects the absence of reliable evidence to support treatment decisions. The Akpek 2011 review discussed none of the five trials included in our review; this review focused on individuals with Sjögren's syndrome dry eye only, and review authors evaluated two studies that we excluded from our review (Noble 2004; Yoon 2007).

Results obtained by searching for studies for inclusion in the review.
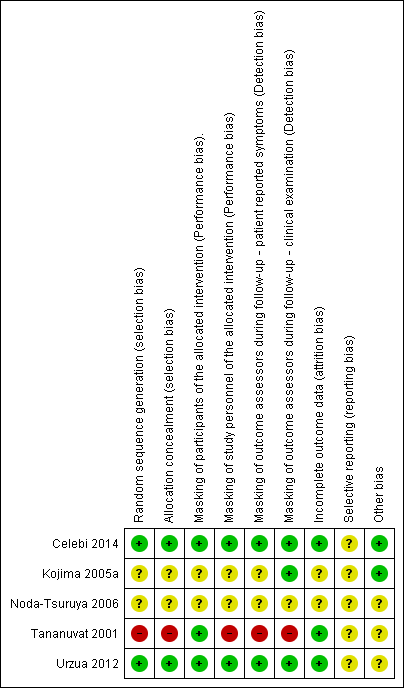
Methodological quality summary: risk of bias review authors' judgements about each risk of bias item for each included study.
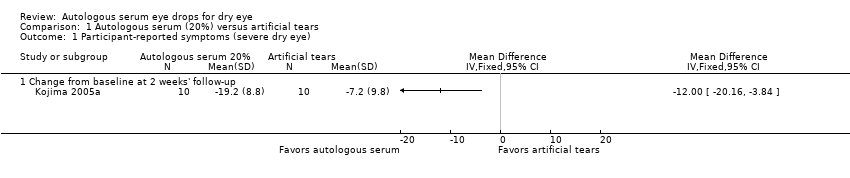
Comparison 1 Autologous serum (20%) versus artificial tears, Outcome 1 Participant‐reported symptoms (severe dry eye).
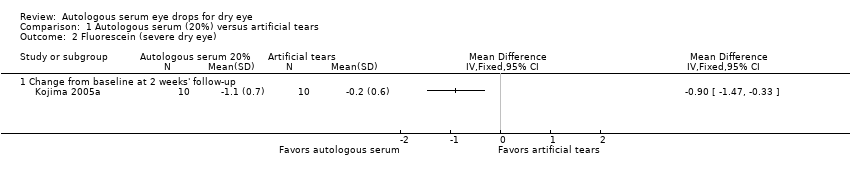
Comparison 1 Autologous serum (20%) versus artificial tears, Outcome 2 Fluorescein (severe dry eye).

Comparison 1 Autologous serum (20%) versus artificial tears, Outcome 3 Rose Bengal (severe dry eye).

Comparison 1 Autologous serum (20%) versus artificial tears, Outcome 4 TBUT (severe dry eye).

Comparison 1 Autologous serum (20%) versus artificial tears, Outcome 5 Schirmer's 1 test (severe dry eye).

Comparison 2 Autologous serum (20%) versus saline solution, Outcome 1 Rose Bengal (post‐LASIK dry eye).
| Autologous serum compared with artificial tears for dry eye | ||||||
| Patient or population: participants with dry eye Settings: eye clinics Intervention: autologous serum 20% Comparison: artificial tears | ||||||
| Outcomes | Illustrative comparative risks* (95% CI) | Relative effect | Number of participants | Certainty of the evidence | Comments | |
| Assumed risk | Corresponding risk | |||||
| Artificial tears | Autologous serum | |||||
| Participant‐reported symptoms Range of scale: 0‐100, where a higher score is worse Follow‐up: 2‐4 weeks | Mean change in symptom score in the control group was 7.2 point improvement | Mean change in symptom score in the autologous serum group was 12.0 points more improved (20.16 to 3.84 more improved) | 20 | ⊕⊕⊝⊝ | Trial investigators of 2 other studies reported more symptomatic improvement in the autologous serum group than in the artificial tears group; however, studies used a cross‐over design and did not provide sufficient data for comparison of treatments between groups | |
| Tear hyperosmolarity Follow‐up: 2‐4 weeks | Not reported | |||||
| Fluorescein staining Range of scale: 0‐9, where a higher score is worse Follow‐up: 2‐4 weeks | Mean change in fluorescein score in the control group was 0.2 point improvement | Mean change in fluorescein score in the autologous serum group was 0.9 points more improved (1.47 to 0.33 more improved) | 20 | ⊕⊕⊝⊝ | Trial investigators of 2 other studies reported a non‐significant difference in Oxford Scale scores; however, studies used a cross‐over design and did not provide sufficient data for comparison of treatments between groups | |
| Rose Bengal staining Range of scale: 0‐9, where a higher score is worse Follow‐up: 2‐4 weeks | Mean change in Rose Bengal score in the control group was 0.1 point improvement | Mean change in Rose Bengal score in the autologous serum group was 2.2 points more improved (2.73 to 1.67 more improved) | 20 | ⊕⊕⊝⊝ | Trial investigators of 2 other studies did not report data for this outcome | |
| Tear film break‐up time Follow‐up: 2‐4 weeks | Mean change in tear film break‐up time in the control group was 0.1 seconds | Mean change in tear film break‐up time in the autologous serum group was 2.00 seconds longer (0.99 to 3.01 longer) | 20 | ⊕⊕⊝⊝ | Trial investigators of 2 other studies reported the difference in TBUT between groups as 1 and 2 seconds; however, studies used a cross‐over study design and did not provide sufficient data for comparison of treatments between groups | |
| Schirmer’s test Score < 4 mm indicates severe dry eye Follow‐up: 2‐4 weeks | Mean Schirmer’s test score in the control group was 3.7 mm | Mean Schirmer’s test score in the autologous serum group was | 20 | ⊕⊕⊝⊝ | Trial investigators of 1 other study reported no difference in Schirmer’s test scores between groups; however, the study used a cross‐over design and did not provide sufficient data for comparison of treatments between groups | |
| Adverse events | Not reported | |||||
| *The basis for the assumed risk is the control group risk across studies. The corresponding risk (and its 95% confidence interval) is based on the assumed risk in the comparison group and the relative effect of the intervention (and its 95% CI) | ||||||
| GRADE Working Group grades of evidence | ||||||
| aDowngraded (‐1) for imprecision (wide confidence intervals) | ||||||
| Autologous serum compared with saline for dry eye | ||||||
| Patient or population: participants with dry eye Settings: eye clinics Intervention: autologous serum 20% Comparison: saline | ||||||
| Outcomes | Illustrative comparative risks* (95% CI) | Relative effect | Number of participants | Certainty of the evidence | Comments | |
| Assumed risk | Corresponding risk | |||||
| Saline | Autologous serum | |||||
| Participant‐reported symptoms Follow‐up: 2‐4 weeks | See comment | Trial investigators of 2 studies reported no difference in symptom scores between groups; however, studies did not provide sufficient data for comparison of treatments between groups | ||||
| Tear hyperosmolarity Follow‐up: 2‐4 weeks | Not reported | |||||
| Fluorescein staining Range of scale: 0‐9, where a higher score is worse Follow‐up: 2‐4 weeks | See comment | Trial investigators of 2 studies reported no difference in fluorescein staining scores between groups; however, studies did not provide sufficient data for comparison of treatments between groups | ||||
| Rose Bengal staining Range of scale: 0‐9, where a higher score is worse Follow‐up: 2‐4 weeks | Mean Rose Bengal score in the control group was 0.9 points | Mean Rose Bengal score in the autologous serum group was 0.60 points lower (1.11 to 0.09 lower) | 35 | ⊕⊝⊝⊝ | Trial investigators of 1 other study reported no difference in Rose Bengal staining scores between groups; however, the study did not provide sufficient data for comparison of treatments between groups | |
| Tear film break‐up time Follow‐up: 2‐4 weeks | See comments | Trial investigators of 1 study reported no difference in tear film break‐up time between groups; however, the study did not provide sufficient data for comparison of treatments between groups | ||||
| Schirmer’s test Score < 4 mm indicates severe dry eye Follow‐up: 2‐4 weeks | See comments | Trial investigators of 1 study reported no difference in Schirmer's test scores between groups; however, the study did not provide sufficient data for comparison of treatments between groups | ||||
| Adverse events | See comments | One study reported that 2 of 12 participants had signs of conjunctivitis with negative culture; in both cases, symptoms resolved later with proper treatment. It was not stated whether affected eyes were assigned to the AS group or the control group | ||||
| *The basis for the assumed risk is the control group risk across studies. The corresponding risk (and its 95% confidence interval) is based on the assumed risk in the comparison group and the relative effect of the intervention (and its 95% CI) | ||||||
| GRADE Working Group grades of evidence | ||||||
| aDowngraded (‐3) for high or unclear risk of selection, performance, detection, and reporting bias | ||||||
| Outcome or subgroup title | No. of studies | No. of participants | Statistical method | Effect size |
| 1 Participant‐reported symptoms (severe dry eye) Show forest plot | 1 | Mean Difference (IV, Fixed, 95% CI) | Totals not selected | |
| 1.1 Change from baseline at 2 weeks' follow‐up | 1 | Mean Difference (IV, Fixed, 95% CI) | 0.0 [0.0, 0.0] | |
| 2 Fluorescein (severe dry eye) Show forest plot | 1 | Mean Difference (IV, Fixed, 95% CI) | Totals not selected | |
| 2.1 Change from baseline at 2 weeks' follow‐up | 1 | Mean Difference (IV, Fixed, 95% CI) | 0.0 [0.0, 0.0] | |
| 3 Rose Bengal (severe dry eye) Show forest plot | 1 | Mean Difference (IV, Fixed, 95% CI) | Totals not selected | |
| 3.1 Change from baseline at 2 weeks' follow‐up | 1 | Mean Difference (IV, Fixed, 95% CI) | 0.0 [0.0, 0.0] | |
| 4 TBUT (severe dry eye) Show forest plot | 1 | Mean Difference (IV, Fixed, 95% CI) | Totals not selected | |
| 4.1 Change from baseline at 2 weeks' follow‐up | 1 | Mean Difference (IV, Fixed, 95% CI) | 0.0 [0.0, 0.0] | |
| 5 Schirmer's 1 test (severe dry eye) Show forest plot | 1 | Mean Difference (IV, Fixed, 95% CI) | Totals not selected | |
| 5.1 Two weeks' follow‐up | 1 | Mean Difference (IV, Fixed, 95% CI) | 0.0 [0.0, 0.0] | |
| Outcome or subgroup title | No. of studies | No. of participants | Statistical method | Effect size |
| 1 Rose Bengal (post‐LASIK dry eye) Show forest plot | 1 | Mean Difference (IV, Fixed, 95% CI) | Totals not selected | |