Etiquetas con información nutricional para la compra y el consumo de bebidas no alcohólicas y alimentos más saludables
Editorial note
This review question is now being addressed according to a new protocol, published 11 June 2021: https://www.cochranelibrary.com/cdsr/doi/10.1002/14651858.CD014845
For this review, the authors are narrowing the focus to energy labelling, as well as broadening the range of target products to include alcoholic drinks, reflecting recent policy interest in energy labelling on alcohol products.
Resumen
Antecedentes
El etiquetado con información nutricional se recomienda como una medida para promover la adquisición y el consumo de alimentos más saludables, incluido un menor aporte calórico. En el ámbito internacional, se han introducido muchos esquemas diferentes de etiquetado con información nutricional. No hay consenso en si el etiquetado es efectivo para promover una conducta más saludable.
Objetivos
Evaluar la repercusión del etiquetado con información nutricional de alimentos y bebidas no alcohólicas sobre la adquisición y el consumo de productos más saludables. El objetivo secundario fue explorar los posibles moderadores del efecto del etiquetado con información nutricional en la compra y el consumo.
Métodos de búsqueda
Se realizaron búsquedas en 13 bases de datos electrónicas que incluyen CENTRAL, MEDLINE y Embase hasta el 26 de abril de 2017. También se hicieron búsquedas manuales en referencias y citas y se buscaron estudios no publicados en sitios web y registros de ensayos.
Criterios de selección
Los estudios elegibles: eran ensayos controlados aleatorizados o cuasi aleatorizados (ECA/ cuasi‐ECA), estudios controlados de tipo antes y después, o estudios de series de tiempo interrumpidas (STI); comparaban un producto etiquetado (con información sobre nutrientes o energía) con el mismo producto sin etiqueta nutricional; evaluaban la compra o el consumo de alimentos o bebidas no alcohólicas medidos de forma objetiva en entornos reales o de laboratorio.
Obtención y análisis de los datos
Dos autores de la revisión, de forma independiente, seleccionaron los estudios para la inclusión y extrajeron los datos de los estudios. Se aplicó la herramienta Cochrane "Risk of bias" y GRADE para evaluar la calidad de la evidencia. Se agruparon los estudios que evaluaron intervenciones y desenlaces similares mediante un metanálisis de efectos aleatorios y se sintetizaron los datos de otros estudios en un resumen narrativo.
Resultados principales
Se incluyeron 28 estudios, con 17 ECA, cinco ensayos controlados cuasialeatorizados y seis estudios de STI. La mayoría (21/28) se realizó en los EE.UU., y 19 en ámbitos universitarios, 14 de los cuales incluyeron sobre todo estudiantes o personal universitario. La mayoría de los estudios (20/28) evaluaron la repercusión del etiquetado de menús o cartas de restauración, o el etiquetado nutricional en, o junto a, una variedad de alimentos o bebidas para que los participantes puedan elegir. Ocho estudios les administraron a los participantes solo una opción de alimento o bebida etiquetada (con la etiqueta colocada en el envase, junto a los alimentos o en un tablero) y midieron la cantidad consumida. El tipo de etiqueta evaluado con mayor frecuencia fue la información sobre calorías (12/28).
Once estudios evaluaron la repercusión del etiquetado con información nutricional en la compra de alimentos o bebida en un contexto real, incluidas las compras de máquinas expendedoras (un ECA por conglomerados), tiendas de comestibles (un STI) o restaurantes, cafeterías o bares (tres ECA, un ensayo controlado cuasialeatorizado y cinco STI). Los resultados sobre las máquinas expendedoras y las tiendas de comestibles no fueron interpretables y se consideraron de muy calidad baja. Un metanálisis de los tres ECA, que evaluaron las etiquetas con información calórica en los menús de los restaurantes, demostró una reducción estadísticamente significativa de 47 kcal de calorías adquiridas (DM ‐46,72 kcal, IC del 95%: ‐78,35; ‐15,10; N = 1877). Suponiendo una comida media de 600 kcal, la información sobre calorías en los menús reduciría las calorías adquiridas por comida en un 7,8% (IC del 95%: 2,5% a 13,1%). La calidad de la evidencia de estos tres estudios se calificó de baja, de manera que la confianza en el cálculo del efecto es limitada y podría cambiar con más estudios. De los seis estudios restantes, solo dos (estudios de STI con etiquetas con información calórica en menús o cartas de un bar o cafetería) presentaron un bajo riesgo de sesgo, y los resultados apoyan el metanálisis. Los resultados de los otros cuatro estudios que se realizaron en un restaurante, cafeterías (dos estudios) o un bar, no se informaron claramente y presentaron un alto riesgo de sesgo.
Diecisiete estudios evaluaron el efecto de las etiquetas con información nutricional sobre el consumo en contextos o escenarios artificiales (en adelante, contextos o estudios de laboratorio). De estos, ocho (todos ECA) evaluaron el efecto de las etiquetas en los menús o colocadas en una variedad de opciones de alimentos. Un metanálisis de estos estudios no demostró de manera concluyente una reducción de las calorías consumidas durante una comida (DM ‐50 kcal; IC del 95%: ‐104,41; 3,88; N = 1705). Se calificó la calidad de la evidencia como baja, de manera que la confianza en el cálculo del efecto es limitada y podría cambiar con estudios adicionales.
Seis estudios de laboratorio (cuatro ECA y dos ensayos controlados cuasialeatorizados) evaluaron el efecto del etiquetado de una única opción de alimento o bebida (como chocolate, pasta o refrescos) sobre las calorías consumidas durante un aperitivo o comida. Un metanálisis de estos estudios no mostró una diferencia estadísticamente significativa de las calorías (kcal) consumidas (DME 0,05; IC del 95%: ‐0,17 a 0,27; N = 732). Sin embargo, los intervalos de confianza fueron amplios, lo que sugiere falta de certeza en el tamaño real del efecto. Se calificó la calidad de la evidencia como baja, de manera que la confianza en el cálculo del efecto es limitada y podría cambiar con estudios adicionales.
No hubo evidencia de que el etiquetado con información nutricional produjera el efecto perjudicial involuntario de aumentar las calorías adquiridas o consumidas. La evidencia indirecta proviene de cinco estudios de laboratorio con etiquetado erróneo de un solo nutriente (es decir, etiquetas sobre bajas calorías o bajo contenido graso en alimentos con alto contenido calórico) durante un aperitivo o comida. Un metanálisis de estos estudios no mostró un aumento estadísticamente significativo de las calorías (kcal) consumidas (DME 0,19; IC del 95%: ‐0,14 a 0,51; N = 718). El efecto fue pequeño y los intervalos de confianza amplios, lo que sugiere falta de certeza del tamaño real del efecto. La calidad de la evidencia de estos estudios se calificó de muy baja, lo que resulta en una confianza muy baja en el cálculo del efecto.
Conclusiones de los autores
Los resultados de un conjunto pequeño de evidencia de baja calidad indican que el etiquetado nutricional con información calórica en los menús podría reducir las calorías adquiridas en los restaurantes. La evidencia que evalúa la repercusión sobre el consumo de la información calórica de los menús o en una variedad de opciones alimentarias en contextos de laboratorio indica un efecto similar al observado en la compra, aunque la evidencia es menos definitiva y también de baja calidad.
En consecuencia, y ante la falta de efectos perjudiciales observados, se sugiere tentativamente que el etiquetado con información nutricional en los menús de los restaurantes podría usarse como parte de una serie más amplia de medidas para tratar la obesidad. Se necesita investigación de alta calidad adicional en contextos reales para permitir conclusiones más acertadas.
También se necesita investigación de alta calidad adicional que trate la falta de evidencia de tiendas de comestibles y máquinas expendedoras y que evalúe los moderadores potenciales del efecto de intervención, incluido el nivel socioeconómico.
PICO
Resumen en términos sencillos
Etiquetado nutricional para promover la compra y el consumo de alimentos y bebidas más saludables
Una dieta deficiente, con un exceso de aporte calórico, es una causa importante de mala salud. Las etiquetas con información nutricional podrían ayudar a las personas a optar por alimentos más saludables.
¿Cuál es el objetivo de esta revisión?
Esta revisión investigó si las etiquetas nutricionales (es decir, etiquetas que proporcionan información acerca del contenido de nutrientes) persuaden a los pacientes a comprar o consumir diferentes clases (saludables) de alimentos. Se buscó toda la evidencia disponible para responder esta pregunta y se encontraron 28 estudios.
Mensajes clave
Hay evidencia para sugerir que el etiquetado con información nutricional, con información energética (p.ej. recuento de calorías) en menús, podría reducir las calorías adquiridas en los restaurantes, aunque se necesitan más estudios de alta calidad para aumentar la seguridad de este resultado.
¿Qué se estudió en la revisión?
Algunos estudios evaluaron la compra de alimentos o bebidas de las máquinas expendedoras, las tiendas de comestibles, los restaurantes, las cafeterías o los bares. Otros evaluaron la cantidad de alimentos o bebida consumida durante un aperitivo o comida en un contexto o escenario artificial (denominados contextos o estudios de laboratorio).
¿Cuáles son los principales resultados de la revisión?
El etiquetado con información nutricional en las cartas de restaurantes redujo la cantidad de calorías adquiridas, pero la calidad de los tres estudios que aportaron este resultado fue baja, de manera que la confianza en el cálculo de efecto es limitada y podría cambiar con futuros estudios. Ocho estudios evaluaron este mismo tipo de intervención en contextos de laboratorio, aunque en lugar de considerar la cantidad de calorías adquiridas por los participantes, evaluaron la cantidad de calorías consumidas. Estos estudios no demostraron de una manera concluyente una reducción de calorías consumidas cuando se etiquetaron los menús o los alimentos, y fueron también de baja calidad.
Además, seis estudios de laboratorio evaluaron la cantidad de calorías consumidas por los participantes cuando se les dio a elegir entre alimentos o bebidas con o sin etiquetas, y cinco estudios de laboratorio evaluaron la cantidad de calorías consumidas cuando los alimentos fueron etiquetados experimentalmente como de bajos en calorías o grasas, aunque en realidad eran alimentos de alto contenido calórico (es decir, etiquetado incorrecto). Los resultados de estos dos grupos de estudios no fueron concluyentes y fueron de calidad baja, o en el caso de los estudios de etiquetado incorrecto, muy baja. Se hallaron algunos estudios que evaluaron el etiquetado en las máquinas expendedoras y las tiendas de comestibles, pero los resultados no fueron fáciles de interpretar, de manera que no se pudieron usar para informar esta revisión.
¿Cuál es el grado de actualización de esta revisión?
La evidencia está actualizada hasta el 26 de abril de 2017.
Authors' conclusions
Summary of findings
| Nutritional labelling compared to no labelling for healthier food purchasing and consumption | ||||||
| Patient or population: university students/staff and general consumers | ||||||
| Outcomes | Anticipated absolute effects* (95% CI) | Relative effect | № of participants | Quality of the evidence | Comments | |
|---|---|---|---|---|---|---|
| Risk with no labelling | Risk with nutritional labelling | |||||
| Food purchased from vending machines | Although more beverages were purchased in the labelling group, large baseline imbalances arising from a small number of randomised units meant that an accurate effect size could not be calculated. | — | (1 RCT) | ⊕⊝⊝⊝ | Sample size unknown (population purchasing from 3 intervention and 2 control public vending machines) | |
| Food purchased from a grocery store | Sales performance decreased after labelling was introduced in this interrupted time series study, although this was difficult to interpret because results were measured as health foods as a proportion of overall foods, rather than directly measuring the number of products purchased. | — | (1 ITS study) | ⊕⊝⊝⊝ | Sample size unknown (population purchasing from a large chain of grocery stores) | |
| Food purchased in restaurants (labels on menus) assessed with: kcal | The median food purchased in restaurants was 746 kcald | MD 46.72 kcal fewer (78.35 fewer to 15.10 fewer)e | — | 1877 | ⊕⊕⊝⊝ | Six additional studies (one Q‐RCT and 5 ITS studies which took place in a restaurant, cafeterias or coffee shops) also measured purchasing, 2 of which were ITS studies at low risk of bias (which assessed energy labels on menus/menu boards in a coffee shop or cafeteria) and found results consistent with this meta‐analysis. |
| Food consumed in laboratory settings (labels on menus or labels placed on a range of food options) | The median food consumed in laboratory settings was 796.4 kcald | MD 50.27 kcal fewer (104.41 fewer to 3.88 more) | — | 1705 | ⊕⊕⊝⊝ | — |
| Food consumed in laboratory settings (single snack food or drink option) | The median food consumed in laboratory settings was 316.975 kcald | SMD 0.05 (95% CI −0.17 to 0.27), P = 0.67 | — | 732 | ⊕⊕⊝⊝ | An SMD of 0.05 represents a small effect (Cohen 1988). |
| Potential harms (high‐energy snack foods consumed with misleading low fat/energy labels in laboratory settings) | The median food consumed with misleading low fat/energy labels in laboratory settings was 190 kcald | SMD of 0.19 (95% CI −0.14to 0.51), P = 0.25 | — | 831 | ⊕⊝⊝⊝ | An SMD of 0.19 represents a small effect (Cohen 1988). |
| *The risk in the intervention group (and its 95% confidence interval) is based on the assumed risk in the comparison group and the relative effect of the intervention (and its 95% CI). | ||||||
| GRADE Working Group grades of evidence | ||||||
| aAll outcomes measuring immediate purchasing or consumption decisions at the point of exposure to the label, although returning customers in non‐laboratory settings may have experienced repeat exposure during the study period. | ||||||
Background
Description of the condition
Poor diets contribute to the global prevalence and burden of obesity and preventable diseases including cardiovascular disease, diabetes and many forms of cancer. Worldwide, excess weight is now a problem in countries of all income brackets, with 2.8 million people estimated to die annually as a result of obesity (WHO Obesity Fact Sheet). In the UK, suboptimal diet is one of the leading causes of years of life lost (Newton 2015). Diet‐related disease is a substantial threat to the health of populations and a challenge to the effective and economic provision of health services (Foresight 2007; WHO 2013). However, changing behaviour to halt and reverse rises in these potentially preventable diseases is difficult. While many people want to engage in behaviours that promote good health, including healthy eating, most people find it difficult to implement and maintain them (Ogden 2007). Recognition is growing that these difficulties are in part due to the physical environments that surround us, which can exert considerable influences on our health‐related behaviours, with relatively little conscious engagement (Hollands 2016; Marteau 2012). Altering these environments may provide a catalyst for behaviour change (Das 2012; Marteau 2012). In recent work, stemming from a systematic scoping review (Hollands 2013a; Hollands 2013b), we described a set of interventions to change health‐related behaviours that involve altering the small‐scale physical environment in which that behaviour is performed (Hollands 2017b). This includes interventions that use text and symbols to convey specific information about products and their use – nutritional labelling being one example.
Description of the intervention
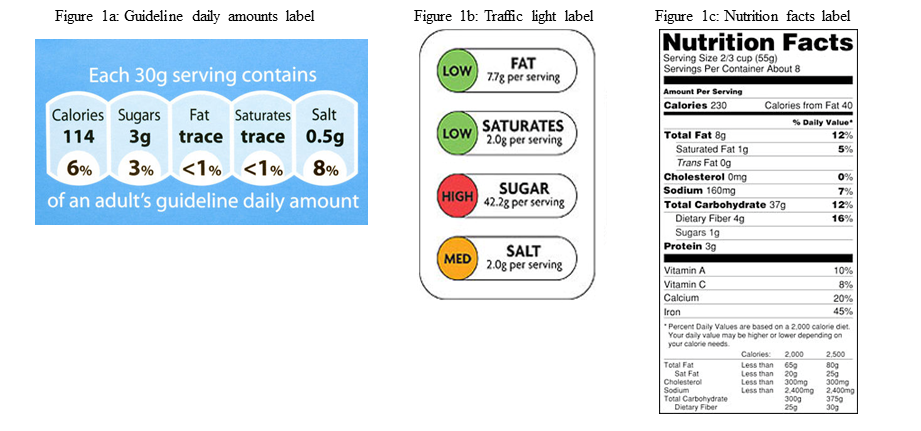
Nutritional labels provide information about the nutritional content of a food or drink. The type of information provided varies, for example, with regard to the nutrients such as fat, sugar, salt or energy content. The form of providing information also varies, for example, as a single number, as a proportion of a guideline for daily consumption, or with colours indicative of relative healthiness.
Until recently, most food that was eaten was homemade from raw ingredients, making the content apparent to those planning and preparing a household's meals. Progressively, however, people have been preparing fewer of their meals from scratch; pre‐prepared, often pre‐packaged, meals now form a substantial part of dietary intake in many parts of the world. These meals or snacks are often complex items, consisting of a mix of ingredients that make it difficult for consumers to know their nutritional content.
For several decades, pre‐packaged foods have provided ingredient and nutrient declarations in order to provide consumers with information about the product. In 1967, the US Federal Trade Commission enacted the Fair Packaging and Labelling Act, requiring that food should be "honestly and informatively" labelled (FTC 2016). In 1990, further legislation in the USA (the Nutrition Labelling and Education Act) made nutritional labelling compulsory on all pre‐packaged foods, and nutrient content claims, such as 'low fat', had to meet Food and Drug Administration (FDA) regulations (FDA 1994). In the same year, the European Union passed a directive to guide 'clearly visible' nutritional labelling (EEC 1990). This labelling was not compulsory unless associated with a nutritional claim, although it was widely adopted. In December 2014 the Food Information Regulations superseded the previous directive, making ingredient and nutrition declarations mandatory for most pre‐packaged foods from December 2016 (European Union 2011). These regulations stipulate that manufacturers must provide nutritional information in a consistent format for most pre‐packed foods including information on fat, saturated fat, carbohydrate, total sugars, protein and salt (expressed per 100 g or per 100 ml of the food product).
Additionally, manufacturers are able to repeat information in 'the principal field of vision' i.e. front of pack. This is purely voluntary but, where provided, only information on energy or energy plus fat, saturated fats, sugars and salt can be given, either per 100g or 100 ml and/or per portion. These front‐of‐pack nutritional labelling schemes have usually been designed to guide consumer choice and sometimes include an interpretative component, such as reference to daily intake guidelines or colour coding to indicate relative healthiness. These can supplement, but not replace, the mandatory, back‐of‐pack nutrition declarations. In the UK, for example, a voluntary front‐of‐pack scheme using red, amber and green colour coding according to nutrient content, is widely used. In Sweden, a voluntary front‐of‐pack keyhole label, which aims to help consumers choose healthier foods, has been used for the last 20 years. Norway and Denmark also adopted this approach in 2016 (Nordic Council of Ministers 2016). In Australia and New Zealand, a healthy heart tick symbol has been in use for over 25 years, but in June 2014 a new voluntary front‐of‐pack Health Star Rating System began to gradually take its place (Commonwealth of Australia 2016). This label provides information on energy, saturated fat, sugars, sodium and fibre, together with a rating of the overall nutritional profile, ranging from half a star to five stars.
Other countries, including Canada, Australia and New Zealand, have adopted mandatory nutritional labelling. In Australia and New Zealand, mandatory labelling of all manufactured foods took effect in December 2002 (Food Standards 2002). This requires a nutrition information panel that presents details on energy, fat, saturated fat, protein, carbohydrate, sugar and sodium per serving and per 100 g of food. In Canada, labelling has been mandatory on almost all pre‐packaged foods since December 2007 (Health Canada 2016). This labelling includes a 'Nutrition facts' table, which provides information on the amount of 13 core nutrients and energy in a defined amount of food. In these countries, there are no specific requirements regarding whether the label is placed on the front or back of the pack. Other countries with mandatory nutritional labelling include Mexico, Argentina, Brazil, Chile, Colombia, Ecuador, Paraguay, Uruguay, Israel, Gulf Cooperation Council members, Japan, India, China, Hong Kong, South Korea, Malaysia, Taiwan and Thailand (EUFIC 2013).
In addition to labelling pre‐packaged foods, some countries have introduced labelling on menus. Mandatory energy labelling in restaurants was first introduced in the state of New York (USA) in 2008 (Dumanovsky 2011). In December 2016, the FDA 'final rule' for all states became effective, requiring that energy information be listed on menus and menu boards in chain restaurants with 20 or more locations as well as in all vending machines by May 2017 (FDA 2016). Similarly, the Healthy Menu Choices Act 2015 came into force in January 2017 in Ontario, Canada. Since February 2011, some states of Australia have also implemented a labelling policy, requiring mandatory energy labelling on menus in fast food chains and on vending machines (Obesity Policy Coalition 2014).
In the absence of international agreements, there is considerable variation in both the information provided and the presentation format for nutritional labelling (see Figure 1 a,b,c for some examples of current nutritional labels). In a taxonomy to classify health‐related food labelling, Rayner 2013 divides point‐of‐purchase food labels into two broad classes: 'information' and 'claims'. While useful for organising the broad range of labels on foods, the taxonomy is insufficiently detailed for studying their behavioural impact. For example, it does not discriminate between labels that are numeric, verbal or pictorial in form. Consequently, it is difficult to use this typology to compare interventions across the range of dimensions likely to influence the effectiveness of labels for changing product purchasing and consumption.
Examples of nutritional labels used in practice
Front‐of‐pack nutritional labelling approaches fall into three broad categories.
-
Numerical information on nutrient content.
-
Interpretative labelling, for example the use of colour coding to indicate how healthy products are.
-
Logos that indicate whether a product meets a pre‐determined guideline regarding healthiness.
In summary, nutritional labelling has been recommended as a means to enable consumers to make healthier choices about what they buy and how much they eat (WHO 2004). However, the evidence for the impact of nutritional labelling on food purchasing and consumption is unclear. Developing a more comprehensive understanding of this impact would inform future policy decisions about the implementation of nutritional labelling. It would also inform our understanding of the relationships between different types of information on food packages and thus inform both future implementation and evaluation of the effects of nutritional labelling.
How the intervention might work
Effects of nutritional labelling
Nutritional labelling may impact on population health by leading to healthier food purchasing and ultimately, healthier consumption. Healthier food purchasing and consumption are defined as:
-
increased purchasing or consumption of products considered healthy in relation to recognised nutritional guidelines; and/or
-
decreased purchasing or consumption of products considered less healthy in relation to these standards.
Processes by which nutritional labelling may have an impact on food choices and health
Nutritional labelling has been proposed as an intervention that enables individuals to make healthier choices about the foods they purchase and consume (Cowburn 2005; Dobbs 2014; WHO 2004). Figure 2 shows the logic model explaining the processes by which nutritional labelling might be expected to lead to food purchasing and consumption, resulting in improved health. These include increasing understanding of the healthiness of food and drink, as well as increasing the availability of healthy foods. The setting in which people purchase food (e.g. a grocery store, fast food or other restaurant) (Bollinger 2011; Harnack 2008a), expectations of the taste of the food (Wansink 2004), and food prices (Horgen 2002) may all modify the impact of labels. The cultural context in which the food is purchased or consumed may also have an impact because diets and attitudes to nutrition vary between countries (Brownell 2006), and such differences may have an impact on the behavioural effects of labels. Finally, individual differences in body weight (Wansink 2006 ‐ study 3), socioeconomic status (Malam 2009), gender (Aron 1995), and dietary restraint (i.e. the extent to which an individual is actively trying to restrict their energy intake) may further modify the impact of nutritional labelling.
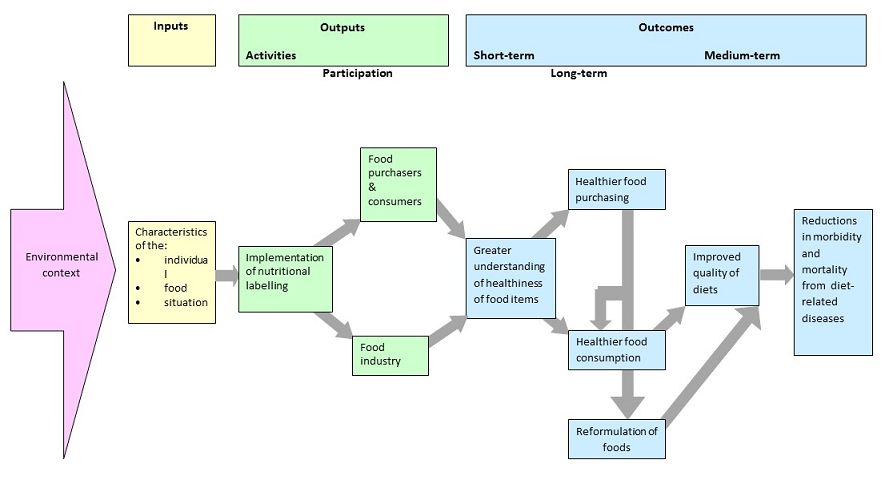
Logic model of the process by which nutritional labelling may have an impact on diets and health
Direct and indirect impact of labels on the individual
The use of nutritional labels may have an impact not only on individuals who purchase or consume the food but also on the restaurant or retailer by altering the range of products available or, on the food industry as a whole, by encouraging the reformulation of products to achieve a healthier nutritional profile on a visible label. Figure 2 indicates the possible impact of nutritional labelling on the behaviour of the food industry directly, through stimulating reformulation of products and indirectly, from changes in consumer purchasing and consumption.
Why it is important to do this review
The large and increasing prevalence of diet‐related disease worldwide requires population‐level interventions to promote healthier diets. Although nutritional labelling has been implemented in North America, Europe and Australasia, there is no consensus on whether it is effective for achieving healthier purchasing and consumption or on which domain, if any, labels are most effective. The variety of schemes implemented may contribute to confusion. The absence of consensus on nutritional labelling policy is reflected in different recommendations and changes to recommendations about implementation that have been made internationally. For example, while the European Union recommended the use of guideline daily amounts with optional "additional forms of expression" (European Commission 2011), the UK Department of Health has recommended subsequent adoption of a labelling system combining elements of guideline daily amounts and traffic light labelling (UK Dept Health 2013). Similarly, while the implementation of a traffic‐light labelling scheme in Australia was recommended (Blewett 2011), subsequently a new interpretative 'Health Stars' scheme has been developed (Australian Dept Health and Aging 2013).
There is a need for robust evidence to support decisions regarding the implementation of nutritional labelling and the development of food policy and programmes globally. Although previous systematic reviews have evaluated the impact of nutritional labelling, they have not restricted primary outcomes to objectively measured food or drink purchasing and consumption behaviours. Some reviews, for example, include studies with both objective and self‐reported behavioural outcomes as well as non‐behavioural outcomes (Campos 2011; Cecchini 2016; Grunert 2007; Mhurchu 2007).
The current review identified and collated existing research evidence concerning the impact of nutritional labels on food purchasing and consumption to assess the beneficial and adverse impacts of nutritional labelling on diets and the factors that moderate these effects.
Objectives
To assess the impact of nutritional labelling for food and non‐alcoholic drinks on purchasing and consumption of healthier items. Our secondary objective was to explore possible effect moderators of nutritional labelling on purchasing and consumption.
Methods
Criteria for considering studies for this review
Types of studies
We included randomised controlled trials (RCTs) or quasi‐randomised controlled trials (Q‐RCTs) that compared a labelling intervention with a no‐label (or incomplete label) control. We included quasi‐randomised studies, in which the randomisation sequence was not truly random (Reeves 2011), because of the difficulty of implementing true randomisation at an aggregate, population level. We also considered cluster‐randomised studies, when randomisation is by site (e.g. grocery store).
Other eligible study designs included interrupted time series studies (ITS) that compared purchasing or consumption before and after the implementation of nutritional labelling. In line with the Cochrane Effective Practice and Organisation of Care (EPOC) group recommendations, we only included ITS studies if they had a clearly defined time point at which the intervention occurred and at least three observation periods both before and after the intervention (EPOC 2015). Authors had to present these data within a graph and/or at the very least analyse them using regression analysis, preferably using segmented regression. Based on Cochrane recommendations, we excluded studies that reported only a simple pre‐ and postintervention comparison unless we could make a valid justification for their inclusion or if a re‐analysis could enable the inclusion of data from multiple observations before and after the intervention using repeated measures methods (Cochrane Public Health Review Group 2010; EPOC 2015).
Finally, we also considered controlled before‐and‐after studies (CBA) that measured purchasing or consumption before and after implementation of an intervention in non‐randomised intervention and control groups. To be included in the review, studies needed to have at least two intervention sites and two control sites, and the characteristics of the different groups had to be similar (EPOC 2015).
Types of participants
Adults or children purchasing or consuming food or drink were eligible for inclusion. Purchases included those bought by an individual for their personal consumption, or for consumption by a small group that the individual belonged to, such as their family. Food or drink purchases included those from any retail outlet including grocery stores and other food stores, vending machines, cafeterias and both fast food and non‐fast food restaurants.
Types of interventions
Eligible interventions included the nutritional labelling of a food or a non‐alcoholic drink product. We identified three characteristics of nutritional labelling with a potential impact on behaviour.
Type of nutrient. The label provides information about one or more nutrient or energy contained in the product. These nutrients typically include those for which reductions in intake are recommended, including fat, saturated fat, salt and sugar, and they may also include those for which increases in intake are recommended, such as vitamins or minerals. We did not consider warning labels about product content that pose an immediate health threat to some people, for example 'contains peanuts', to be nutritional labels in the current context. Figure 1c shows the US nutrition facts label indicating a range of nutrients that labels may describe. Although technically not a nutrient, we included energy (e.g. calories) in this category.
Amount of nutrient. Information is given indicating the amount of different types of nutrients or energy contained in the product or in a serving size. This information may be absolute or relative. If absolute, the label would use numeric information about content, for example, 'total fat ‐ 12 grams'. If relative, the label would use a verbal descriptor of the amount of the nutrient or energy contained in the product such as 'lower fat'. However, 'a good source of vitamin C' or 'contains whole grain' would not be considered a nutritional label as 'good' and 'contains' are not descriptors of amount.
Visibility. The labels needed to be visible upon purchase or consumption. In some cases, the label might be placed on the front of product packages or containers. In other cases, the label might not appear on but rather alongside the product. Examples include labels on a shelf where the food or drink is being displayed in a grocery store, on the exterior of a vending machine selling snacks, on the counter from which the food is being served in a cafeteria, or on a restaurant menu from which food is being selected.
We classified nutritional labels that did not have the characteristics specified above as incomplete and considered them ineligible. We only included interventions that combined nutritional labelling with other interventions if we could isolate the impact of the nutritional label. We did not consider logos providing a summary assessment of the healthiness of a product or general health claims to provide nutritional information and so excluded them from this review.
As noted above, the intervention labelling group had to be compared with a no‐labelling (or incomplete) control group. Thus, we excluded studies that only compared two or more different types of labelling schemes without a control group.
Types of outcome measures
Eligible studies had to report an objectively measured behavioural outcome of food or drinks purchased or consumed. Given that alcohol consumption involves different processes from non‐alcoholic drinks, we investigated the impact of nutritional labelling on purchasing and consumption of non‐alcoholic drinks only.
Primary outcomes
The primary outcomes were healthier choices of:
-
food or drink purchased (i.e. payment with money) from vending machines, supermarkets or grocery stores, restaurants, cafeterias or other contexts in which food and drink for immediate consumption are sold;
-
food or drinks consumed in real‐world or laboratory settings; and
-
harm or unintended consequences of nutritional labels, such as increased energy consumption from single nutrient labelling implying a healthier product.
Purchasing
We considered healthier food and drink purchasing to be:
-
fewer purchases of less healthy items or overall reductions in purchases of less healthy target nutrients or energy;
-
more purchases of healthier items or overall increases in purchases of healthier target nutrients or energy.
Food and drink purchases could be assessed either at the individual or population group level. In the context of this review, an individual level purchasing outcome measure required direct observation of what was purchased:
-
from a vending machine; this comprised a record of everything purchased by the individual on that visit, or a record of items, such as chocolate bars, targeted in the intervention;
-
in a restaurant; this comprised a record of everything purchased by the individual for consumption on that visit, or a record of items, such as soft drinks, targeted in the intervention and purchased for consumption on that visit;
-
in a grocery store; this comprised a record of everything purchased by the individual on that visit, or a record of items, such as ready meals, targeted by the intervention and purchased on that visit.
At a population level, purchasing data had to be derived from sales data supplied by the retailer from till receipts. Such data could be presented as sales of specific items or as total nutrients or energy purchased, calculated from the sales data presented. When studies assessed purchasing in terms of the overall healthiness of the specific product labelled, analyses presented in the research reports needed to indicate which products were considered more or less healthy in line with the labelling given. We excluded studies that evaluated intention to purchase or intention to consume without an objectively assessed measure of the behaviour.
Consumption
We considered healthier food or drink consumption to be:
-
lower consumption of less healthy foods or an overall reduction in consumption of less healthy target nutrients or energy;
-
greater consumption of healthier foods or an overall increase in consumption of healthier target nutrients.
Studies had to assess consumption by an objective measure, calculating the amount of a snack or a meal consumed by subtracting the amount of food remaining after consumption from the amount of food served. This was specified as either:
-
amount of a food or drink consumed; or
-
total target nutrients or energy consumed as part of a meal.
To assess the absolute healthiness of products forming part of interventions included in this review would require knowledge of the full nutritional content of each product offered to study participants and how it was consumed relative to other components of the diet. Therefore, the definition of a more or less healthy product is based on the relative composition of the items tested, with reference to international dietary guidelines.
Secondary outcomes
There were no secondary outcomes.
Other measures
We also assessed possible moderating effects on the primary outcomes above, presented in the section below on Subgroup analysis and investigation of heterogeneity.
Search methods for identification of studies
Electronic searches
We conducted electronic searches of the following databases.
-
Cochrane Central Register of Controlled Trials (CENTRAL; 2017, Issue 3) in the Cochrane Library (last searched 12 March 2017).
-
Cochrane Database of Systematic Reviews (CDSR; 2017, Issue 4) in the Cochrane Library (last searched 12 April 2017).
-
MEDLINE OvidSP (1946 to 25 April 2017).
-
Embase OvidSP (1974 to 25 April 2017).
-
CINAHL EBSCO Host (1981 to 26 April 2017).
-
Trophi (Evidence for Policy and Practice Information (EPPI) Centre Database; 2004 to 11 August 2017).
-
PsycINFO OvidSP (1967 to April Week 3 2017 [searched 26 April 2017]).
-
Applied Social Sciences Index and Abstracts (ASSIA) from Cambridge Scientific Abstracts (CSA) Proquest (1987 to 26 April 2017).
-
Sociological abstracts (Proquest; 1952 to 26 April 2017).
-
ABI/INFORM Global (Proquest; 1970s [precise date not available] to 26 April 2017).
-
SCOPUS Reed Elsevier (1966 to 26 April 2017).
-
Science Citation Index & Social Science Citation Index (Web of Science Core Collection, Thomson Reuters) (1945 to 26 April 2017).
-
HMIC (Health Management Information Consortium; OvidSP; 1979 to January 2017 [searched 26 April 2017]).
We also searched trial registries for potentially relevant studies that were completed or in progress (July 2017), using the WHO International Clinical Trials Registry Platform (ICTRP) and ClinicalTrials.gov. We obtained potentially relevant studies from the following clinical trial databases: NCT (ClinicalTrials.gov); Australian New Zealand Clinical Trials Registry (ACTRN) (www.anzctr.org.au); European Union Clinical Trials Register (EUCTR) (www.clinicaltrialsregister.eu/ctr-search/search); Deutsches Register Klinischer Studien (DRKS) German Clinical Trials Register (www.drks.de/drks_web); Nederlands Trial Register (NTR) (www.trialregister.nl/trialreg/index.asp); the International Standard Randomised Controlled Trial Number (ISRCTN) Register (www.isrctn.com); Registro Brasileiro de Ensaios Clínicos (RBR) (www.ensaiosclinicos.gov.br); Sri Lanka Clinical Trials Registry (SLCTR) (www.slctr.lk); the Clinical Trials Registry – India (CTRI) (ctri.nic.in/Clinicaltrials/login.php); Chinese Clinical Trial Register (ChiCTR) (www.chictr.org.cn/abouten.aspx); Iranian Registry of Clinical Trials (IRCT) (www.irct.ir); Japan Primary Registries Network (JPRN) (rctportal.niph.go.jp); Korean Clinical Trial Registry (KCT) (cris.nih.go.kr/cris/index.jsp); and the Thai Clinical Trials Registry (TCTR) (www.clinicaltrials.in.th).
Appendix 1 shows the search strategies for each database. We applied no date or language restrictions.
We screened the reference lists of included studies to identify potential studies. We also conducted forward citation searches on the Web of Science for papers that cited included studies. Furthermore, we screened the reference lists of the systematic reviews found through a search of the Cochrane Database of Systematic Reviews to identify further potentially relevant studies.
Searching other resources
We contacted authors of all included studies and key researchers in the topic area and asked them to identify unpublished or ongoing research in the field. Additionally, we searched the websites of key organisations in the area of health and nutrition, including the following.
-
Departments of Health for England (www.gov.uk/government/organisations/department-of-health), Scotland (www.gov.scot/Topics/Health), Wales (gov.wales/topics/health/?lang=en), and Northern Ireland (www.health-ni.gov.uk).
-
Australian Federal and State Departments of Health (www.health.gov.au).
-
Department of Health for South Africa (www.gov.za/issues/health).
-
Ministry of Health and Family Welfare for India (mohfw.nic.in).
-
Health Canada (www.hc-sc.gc.ca/index-eng.php?).
-
Food Standards Agency, UK (www.food.gov.uk).
-
European Commission (ec.europa.eu/commission/index_en).
-
Rudd Centre for Food Policy and Obesity (www.uconnruddcenter.org).
-
Centers for Disease Control and Prevention (www.cdc.gov).
-
World Health Organization (who.int/en).
-
National Institutes for Health Office of Disease Prevention (prevention.nih.gov).
-
International Obesity Task Force (www.worldobesity.org).
We entered the results generated by the above searches into Endnote X6 bibliographic software and de‐duplicated them.
Data collection and analysis
Selection of studies
Two reviewers independently assessed titles and abstracts of papers for inclusion, resolving any disagreements through discussion. Failure to reach consensus led to discussion with a third reviewer. We obtained full‐text papers of potentially eligible studies identified during the first screening phase, and we assessed them for inclusion using the same procedures as for titles and abstracts.
Data extraction and management
We developed a draft data extraction form based on the Cochrane Public Health template and modified it to allow extraction of data specific to this review. Two reviewers independently piloted the draft to ensure that it enabled reliable and accurate extraction of appropriate data and then independently extracted all data on study and participant characteristics along with results. When a reviewer was an author of an included study, a third reviewer was involved in the data extraction process. If reported, we also extracted data on measures relating to the process of implementing the intervention, including any data on its cost. Once the first phase of data extraction was complete, the first author reconciled the two sets of data extraction forms. Where there were inconsistencies, the two data extractors met to discuss and reach a consensus. Where data were missing or unclear, we contacted study authors. Finally, one author entered the data into RevMan, and a second author checked the data entry.
When multiple papers reported data from the same study, we considered the papers together as one study.
Assessment of risk of bias in included studies
We assessed risk of bias for RCTs using the Cochrane 'Risk of bias' assessment tool (Higgins 2011).
-
Was allocation sequence randomly generated using an appropriate method (selection bias)?
-
Was allocation adequately concealed (selection bias)?
-
Were incomplete outcome data adequately addressed (attrition bias)?
-
Were reports of the study free of suggestion of selective outcome reporting (reporting bias)?
-
Were participants and personnel blinded to knowledge of allocated interventions adequately (performance bias)?
-
Were outcome assessors blinded to allocated intervention (detection bias)?
-
Was the study apparently free of other problems that could put it at risk of bias?
We considered the RCTs to be at an overall low risk of bias when they met all of the above criteria or when there was not more than one unclear criterion (with no criterion assessed as high risk). We judged studies to be at unclear risk of bias if more than one domain was at unclear risk of bias (with no criterion assessed as high risk) and at high risk of bias if one or more criteria were not adequately met.
For ITS studies, we implemented the Cochrane Public Health Review Group Guidelines for assessing risk of bias (Cochrane Public Health Review Group 2010).
-
Was the intervention independent of other changes?
-
Was the shape of the intervention effect pre‐specified (specifically, the purpose of the intervention should be the purpose of the analysis)?
-
Was the intervention unlikely to affect data collection?
-
Was knowledge of the allocated interventions adequately prevented during the study?
-
Were incomplete outcome data adequately addressed?
-
Was the study free of selective outcome reporting?
-
Was the study apparently free of other problems that could put it at risk of bias?
We considered ITS studies to be at an overall low risk of bias when they adequately addressed all of the above criteria and at high risk if one or more of the above criteria were not met.
We planned to assess the risk of bias of controlled before‐and‐after studies using the Quality Assessment Tool for Quantitative Studies (EPHPP 2010). As we failed to identify any relevant controlled before‐and‐after studies for inclusion in this review, we do not provide any further details of this tool (for more information see EPHPP 2010).
Measures of treatment effect
Purchase data could be either dichotomous (e.g. a more versus less healthy choice) or continuous (e.g. mean amount of nutrient or energy purchased). Consumption was generally assessed using continuous data (e.g. total nutrients or mean energy consumed). As the included studies reported no dichotomous data, we calculated a mean difference (MD) with 95% confidence intervals (CIs) for each study when possible. In two studies, however, it was only possible to calculate a standardised mean difference (SMD) with 95% CIs because the authors reported only mean kcal and F statistics (Wansink 2006 ‐ study 1; Wansink 2006 ‐ study 3). We calculated combined effect sizes using an MD with 95% CIs when studies used similar interventions and outcomes, or using an SMD when the outcomes differed (e.g. when trials measured outcomes as energy consumed at one meal or over several meals). In both cases, we used a random‐effects model to pool the data.
In order to re‐express effect sizes using a more familiar metric, we calculated the percentage reduction in energy consumed over a typical meal, using an average of 600 kcal as a baseline. This amount was based on mean daily energy intake across the UK population of 1727 kcal or 7226 kJ (standard deviation (SD) 537 kcal or 2247 kJ, using data from the UK National Diet and Nutrition Survey (National Centre for Social Research 2012). Our approach to re‐expressing effect sizes was based on Hollands 2015.
For ITS studies, we aimed to present statistical comparisons of time trends before and after the intervention (EPOC 2015). In all of the ITS studies, we present the results as described by the study authors, typically as regression analyses. When studies also presented data graphically, we did not attempt any re‐analysis using segmented time series regression techniques if the data were already appropriately analysed by the study authors or if we did not consider the study to be of sufficient quality to warrant re‐analysis. We considered one ITS study to be at low risk of bias (Bollinger 2011), but we could not re‐analyse the data presented graphically due to a lack of information. The figures presented weekly calories per transaction, but there were no data on the number of transactions per week; this means that the absolute and relative variability of each point was unknown and could not be modelled with time series to provide unbiased estimates.
Unit of analysis issues
For eligible cluster‐randomised trials, we planned to adjust the data to account for clustering if the study authors had not already done so. However, we only included one cluster‐RCT in the review, and the appropriate data needed to report and adjust the results were not available.
Dealing with missing data
We included all data in the review using an intention‐to‐treat approach where possible. Where studies reported dropouts or withdrawals, we extracted data on the number and reasons for missing data.
Assessment of heterogeneity
In order to deal with inevitable methodological variability among studies that evaluate food or drinks consumed in real‐world or laboratory settings, we took a broader perspective and considered that studies that evaluated labelling as an intervention and energy purchasing or consumption as an outcome were potentially similar enough to be combined in meta‐analyses of purchasing and consumption. We assessed statistical heterogeneity by visually examining the extent to which confidence intervals overlapped. Additionally, we reported the I² statistic, a point estimate of inconsistency, and interpreted the levels of heterogeneity made based on the recommendations of Deeks 2011.
Assessment of reporting biases
We planned to use funnel plots to identify small study effects, which in turn, could indicate publication bias. None of the included meta‐analyses, however, included more than 10 studies, so based on the recommendations of Sterne 2011, we did not carry out this action.
Data synthesis
Where one study reported a number of different types of interventions or outcome measures, we made the following decisions as to which data we would include in the analyses.
-
For included studies with more than one eligible intervention arm, we combined data when studies contained information about the same product characteristic (e.g. energy), albeit in multiple ways (e.g. varying in whether presented as numbers, colour‐coded, activity‐equivalents, and whether presented with recommended daily energy intake).
-
Where studies assessed the impact of nutritional labelling adjacent to a range of food products and it was not possible to extract an effect summary for the range of food products, we included the data for the product representing the most complete meal, for example, sales of entrées (as opposed to sales of a side dish) (e.g. Dubbert 1984). If no products represented more or less complete meals, we extracted data for products containing the greatest amount of energy.
-
Where studies reported a number of outcomes, such as consumption of a range of different nutrients, we used the most frequently reported outcome among the included studies (e.g. Harnack 2008a). Had outcomes been reported in the same study that related to both increased consumption of healthier foods and decreased consumption of less healthy foods, we would have prioritised the latter.
Most included studies reported on energy (described by the study authors as 'calories') as the outcome unit. Some reported on grams or millilitres (e.g. Cavanagh 2014; Roberto 2012; Vermeer 2011), and we converted these to calories using the formula presented in DeGroot 2012. We analysed purchasing and consumption studies separately, as we considered them, a priori, to be different outcomes. In the process of conducting the review, it became apparent that the studies also differed in terms of how many labelled options participants had to choose from and what kind(s) of nutritional content the labels described. Participants had to make absolute judgments when given only one labelled option and relative judgments when provided with a myriad of options labelled differently. Thus, we analysed these studies separately. We employed Review Manager 5 (RevMan 5) to perform meta‐analyses, using the inverse variance approach for continuous data (RevMan 2014). We synthesised data from non‐randomised studies in a narrative summary.
Subgroup analysis and investigation of heterogeneity
We planned subgroup analyses to assess effect modifiers and explore them as sources of heterogeneity. We chose the potential modifiers based on previous research or as considered in the section How the intervention might work. Due to a lack of information reported in the included studies, we were unable to conduct many of the planned subgroup analyses (see Differences between protocol and review). There were, however, sufficient data to explore two possible moderators of the main effects of nutritional labelling: dietary restraint and study country. We used the generic inverse variance approach to pool the MDs or SMDs, both across studies and within subgroups.
Sensitivity analysis
We repeated meta‐analyses, omitting all studies at high or unclear risk of bias.
Summary of findings and assessment of the certainty of the evidence
We prepared the Summary of findings table using the main outcomes evaluated in the included studies and as specified in Primary outcomes: food purchased from vending machines, food purchased from a grocery store, food purchased from a restaurant, cafeteria or coffee shop, food consumed in a laboratory setting (where participants were given a range of options), food consumed in a laboratory setting (where participants were given a single option), and harms (food consumed with misleading labels). All of the participants in these studies were from general populations groups, so may be considered medium risk populations. All comparisons presented in the Summary of findings table evaluate nutritional labelling (broadly) versus no labelling (i.e. it was not the remit of this systematic review to compare the effectiveness of different types of nutritional labels). Some of the summary results were presented as MD while others had to be presented using SMD for reasons described above (Measures of treatment effect).
We used the GRADE system to assess the quality of evidence for each outcome (Schünemann 2011). Using the four standard GRADE levels of quality (high, moderate, low and very low) we assigned evidence from RCTs an initial quality rating of high and evidence from non‐RCTS an initial rating of low. We upgraded (for observational studies only) or downgraded these levels based on our judgments regarding risk of bias, precision, consistency, directness and publication bias. We interpreted the overall quality level for each outcome following definitions provided by Balshem 2011.
We report the quality level assigned for each outcome, along with justification for the decisions, in the Results.
Results
Description of studies
Results of the search
Our search strategy yielded 50,270 unique records. Screening of titles and abstracts resulted in 263 records plus 15 trial registries (i.e. 278 records) that were potentially eligible and whose full text we reviewed. Overall, 28 studies (27 published and 1 unpublished study), presented in 32 papers, met the inclusion criteria (see Figure 3), while we excluded 246 records (Characteristics of excluded studies). We also identified one relevant ongoing study (see Ongoing studies), but no data were available at the time of completing the current review.
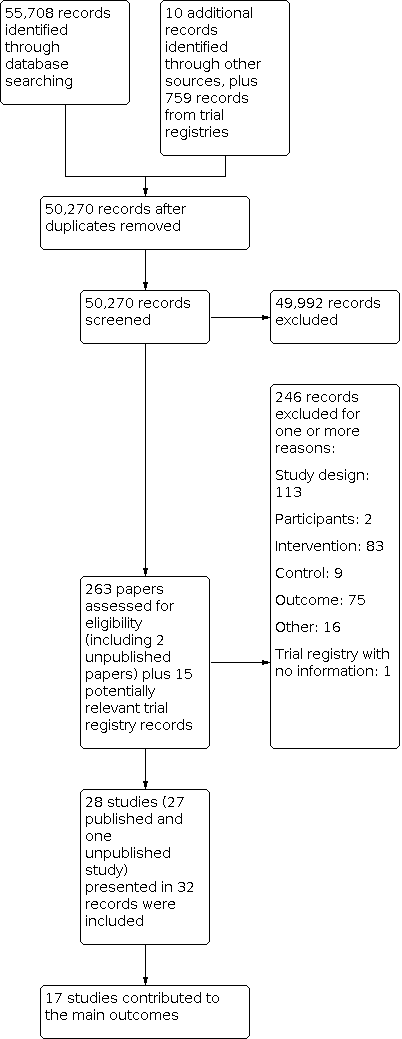
Study flow diagram
Included studies
Study design
Of the 28 studies included in the review, 17 were RCTs: 16 of these were randomised by individual (Cavanagh 2014; Crockett 2014; Ebneter 2013; Ellison 2013; Ellison 2014a; Girz 2012 ‐ study 1; Girz 2012 ‐ study 2; Girz ongoing; Hammond 2013; Harnack 2008a; James 2015Platkin 2014; Roberto 2010; Roberto 2012; Temple 2010; VanEpps 2016), while one was randomised by cluster, with vending machines being the unit of randomisation (Bergen 2006. In addition, there were five Q‐RCTs (Allan 2015; Kral 2002; Vermeer 2011; Wansink 2006 ‐ study 1; Wansink 2006 ‐ study 3), plus six ITS studies (Balasubramanian 2002; Bollinger 2011; Chu 2009; Cioffi 2015; Dubbert 1984; Holmes 2013). Bollinger 2011 was designed as a controlled before‐and‐after study, but it was only possible to extract data at different time periods for the intervention group and not the comparison group, so we treated it as an ITS.
All studies were in high‐income countries, with most (21 studies) taking place in the USA. Four studies took place in Canada, and three in Europe (two in the UK and one in the Netherlands).
Participants
Fourteen studies recruited university students or staff (Bergen 2006; Cavanagh 2014; Chu 2009; Cioffi 2015; Ebneter 2013; Girz 2012 ‐ study 1; Girz 2012 ‐ study 2; Girz ongoing; James 2015; Kral 2002; Platkin 2014; Temple 2010; Wansink 2006 ‐ study 1; Wansink 2006 ‐ study 3), six recruited university students or staff as well as members of the general population (Allan 2015; Ellison 2013; Ellison 2014a; Hammond 2013; Roberto 2010; Roberto 2012), and six recruited from general population groups (Balasubramanian 2002; Bollinger 2011; Dubbert 1984; Harnack 2008a; VanEpps 2016; Vermeer 2011). Of the remaining two studies, Holmes 2013 recruited participants from a high‐income population, while Crockett 2014 actively sought to include lower income groups by recruiting in more socially deprived areas.
Twenty‐six studies included adult participants, one included adolescents and adults (Harnack 2008a), and one study targeted families of young children by labelling a children's menu (Holmes 2013). Four studies explicitly reported recruiting women only (Cavanagh 2014; Ebneter 2013; Kral 2002; Platkin 2014), but the included studies did not consistently describe full details of study participants (including mean age, sex and ethnicity).
Interventions and comparisons
All of the included studies compared at least one form of labelling with no labelling, with most (20/28) evaluating labelling on menus or menu boards, or nutritional labelling placed on, or adjacent to, a range of foods from which participants could choose (Allan 2015; Balasubramanian 2002; Bergen 2006; Bollinger 2011; Chu 2009; Cioffi 2015; Dubbert 1984; Ellison 2013; Ellison 2014a; Girz 2012 ‐ study 1; Girz 2012 ‐ study 2; Girz ongoing, Hammond 2013; Harnack 2008a; Holmes 2013; James 2015; Platkin 2014; Roberto 2010; Temple 2010; VanEpps 2016). The remaining eight studies provided participants with only one food or drink option to choose from (Cavanagh 2014; Crockett 2014; Ebneter 2013; Kral 2002; Roberto 2012; Wansink 2006 ‐ study 1; Wansink 2006 ‐ study 3; Vermeer 2011). In these eight studies, the nutritional label was on the container or packaging, adjacent to the food, or on a display board.
Twelve studies included an intervention arm that assessed absolute energy labels on food or drinks without any other information or formatting, such as the use of colour coding (e.g. traffic light format) (Allan 2015; Bollinger 2011; Cavanagh 2014; Ebneter 2013; Ellison 2013; Ellison 2014a; Girz 2012 ‐ study 1; Girz ongoing, Hammond 2013; Platkin 2014; Roberto 2010; VanEpps 2016). Four of these studies also included an intervention arm that assessed energy information with traffic light format interventions (Ellison 2013; Ellison 2014a; Hammond 2013; VanEpps 2016). Six studies evaluated energy labelling plus other information (e.g. recommendation of daily energy intake or energy density) (Girz 2012 ‐ study 2; Harnack 2008a; James 2015; Kral 2002; Roberto 2010; Vermeer 2011), one of which was also colour coded to the level of energy density (Kral 2002). Five studies evaluated labels that provided information on energy or fat content using terms such as 'high' or 'low' (Balasubramanian 2002; Crockett 2014; Dubbert 1984; Wansink 2006 ‐ study 1; Wansink 2006 ‐ study 3), one of which also used colour coding in the same treatment arm (Crockett 2014).Three studies compared 'nutrition facts' labelling (e.g. total energy, serving size (grams), fat (grams), protein (grams), and carbohydrates (grams)) (Chu 2009; Cioffi 2015; Temple 2010). One study evaluated a 'Smart Choices' label (with information on energy per serving and servings per package) (Roberto 2012), one study evaluated labels with energy information and exercise equivalents (Platkin 2014), one evaluated energy and fat content labelling (Holmes 2013), and one study evaluated a '0 calories 0 carbs' label (Bergen 2006).
Nine of the included studies evaluated a second or third treatment arm that was also eligible for inclusion in this review (Crockett 2014; Ebneter 2013; Ellison 2013; Ellison 2014a; Hammond 2013; Platkin 2014; Roberto 2010; Roberto 2012; VanEpps 2016). Of these, seven had treatment arms that contained information about the same product characteristic in multiple ways (e.g. calories only and calories plus a traffic light format), so we combined these arms as a single labelling intervention (Ellison 2013; Ellison 2014a; Hammond 2013; Platkin 2014; Roberto 2010; Roberto 2012; VanEpps 2016). The other two studies evaluated a second treatment arm, considered separately in this review (low fat or energy labels on high‐fat foods) (Crockett 2014; Ebneter 2013).
Twenty‐five studies used a no‐label control (Allan 2015; Cavanagh 2014; Crockett 2014; Balasubramanian 2002; Bergen 2006; Bollinger 2011; Chu 2009; Cioffi 2015; Dubbert 1984; Ellison 2013; Ellison 2014a; Girz 2012 ‐ study 1; Girz 2012 ‐ study 2; Girz ongoing; Hammond 2013; Harnack 2008a; Holmes 2013; James 2015; Kral 2002; Platkin 2014; Roberto 2010; Roberto 2012; Temple 2010; VanEpps 2016; Vermeer 2011), and three studies included a regular label control (Ebneter 2013; Wansink 2006 ‐ study 1; Wansink 2006 ‐ study 3). Of these three studies, Ebneter 2013 compared 'regular fat M&M's' with additional energy information on the label versus 'regular fat M&M's' without energy information on the label. Wansink 2006 ‐ study 1 compared 'new low fat M&M's label versus a 'new colours on regular M&M'sn label, and Wansink 2006 ‐ study 3 compared a 'Low‐fat Rocky Mountain Granola' label with a 'Regular Rocky Mountain Granola' label.
The included studies aimed to either decrease consumption or purchasing of less healthy foods or increase consumption or purchasing of relatively healthier foods, with the exception of five studies (as reported above) that also assessed the impact of low fat or low energy labels on high‐fat foods (Crockett 2014; Ebneter 2013; Girz 2012 ‐ study 1; Wansink 2006 ‐ study 1; Wansink 2006 ‐ study 3).
Settings
Eleven studies were in real‐world settings (i.e. grocery stores, restaurants, cafeterias, coffee shops or other contexts in which food and drink for immediate consumption are sold) and where participants ordered and paid for their food or drinks as they would normally do in that setting (Allan 2015; Balasubramanian 2002; Bergen 2006; Bollinger 2011; Chu 2009; Cioffi 2015; Dubbert 1984; Ellison 2013; Ellison 2014a; Holmes 2013; VanEpps 2016). Seventeen studies took place in artificial settings or scenarios (i.e. in contexts where participants would not normally order or consume food or drinks, or they did not pay for food or drinks because these were provided by the researchers), broadly considered laboratory settings (Cavanagh 2014; Crockett 2014; Ebneter 2013; Girz 2012 ‐ study 1; Girz 2012 ‐ study 2; Girz ongoing, Hammond 2013; Harnack 2008a; James 2015; Kral 2002; Platkin 2014; Roberto 2010; Roberto 2012; Temple 2010; Vermeer 2011; Wansink 2006 ‐ study 1; Wansink 2006 ‐ study 3).
Twelve studies took place in university laboratories or classrooms (Cavanagh 2014; Ebneter 2013; Girz 2012 ‐ study 1; Girz 2012 ‐ study 2; Girz ongoing, Hammond 2013; James 2015; Kral 2002; Platkin 2014; Roberto 2010; Roberto 2012; Temple 2010), three took place in other university facilities, including an open‐house area (Wansink 2006 ‐ study 1, campus grounds (Bergen 2006), a theatre (Wansink 2006 ‐ study 3), and university‐based restaurants or dining centres (Chu 2009; Cioffi 2015; Ellison 2013; Ellison 2014a). One study took place in community‐based facilities (church halls and hotel conference rooms) for reasons of convenience (Harnack 2008a). Other studies took place in a chain of coffee shops (Bollinger 2011), a hospital coffee shop (Allan 2015), a community restaurant (Holmes 2013) and a community‐based cafeteria (Dubbert 1984). Balasubramanian 2002 was in a major grocery store chain, and VanEpps 2016 in the workplace of a large healthcare company. Although two studies took place in cinemas, we considered these laboratory studies as the participants did not pay for the food or drinks which were provided by the researchers (Crockett 2014; Vermeer 2011).
Outcomes
Within each of the primary outcomes of interest, studies reported the following measures.
Purchasing
There were 11 purchasing studies in real‐world settings.
Bergen 2006 assessed the impact of labelling on drinks purchased from vending machines by measuring the mean number of low‐energy soft drinks sold weekly over a nine‐week period (two‐week baseline period, five‐week intervention period, and two‐week postintervention period).
Balasubramanian 2002 assessed the impact of labelling on 'light' entrées and juices purchased from a grocery store by measuring sales transactions (i.e. the percentage of labelled products bought relative to other products bought) each week over a seven‐year period.
Nine studies assessed the impact of labelling on food or drinks purchased in restaurants, cafeterias or coffee shops. Studies measured the outcome using the mean energy content of items purchased at each meal over a period of time (2 weeks: Ellison 2013; 4 weeks: VanEpps 2016; 41 days: Chu 2009; 2 months: Holmes 2013; 19 weeks: Ellison 2014a), mean weekly energy sales of 45 labelled food items for 12 weeks (Cioffi 2015), the proportion of high‐calorie purchases over a six‐week period (as a percentage of total drinks or snacks sold) (Allan 2015); mean energy of food and drinks bought per sales transaction over 14 months (Bollinger 2011), or the probability of purchasing low‐energy items from three different food categories (vegetables, salads, entrées) during an 18‐week period (Dubbert 1984).
Consumption
Seventeen studies assessed the impact of labelling on food or drink consumed in artificial or laboratory settings. In 14 of these studies, the outcome was mean energy consumed during a snack, a single meal, or across multiple meals (Crockett 2014; Ebneter 2013; Girz 2012 ‐ study 1; Girz 2012 ‐ study 2; Girz ongoing; Hammond 2013; Harnack 2008a; James 2015; Kral 2002; Platkin 2014; Roberto 2010; Temple 2010; Wansink 2006 ‐ study 1; Wansink 2006 ‐ study 3). Of the three remaining studies, two measured mean grams of food consumed (Cavanagh 2014; Roberto 2012), and one measured mean volume of a drink consumed (Vermeer 2011).
Further details of each study are reported in the table of Characteristics of included studies.
Excluded studies
Of 50,270 records screened, we excluded 49,992 records in the initial screening, and we assessed the full text of 263 papers plus 15 potentially relevant trial registry records (i.e. 278 records) for inclusion (Figure 3). We excluded 246 for not meeting one or more of our inclusion criteria:
-
113 studies had an ineligible design (i.e. they were not an RCT, Q‐RCT, controlled before‐and‐after study or an ITS study meeting the EPOC criteria for inclusion (EPOC 2015));
-
83 studies used an intervention that did not include a nutritional label meeting the inclusion criteria or used a multi‐component intervention from which the impact of the label could not be isolated;
-
76 studies did not assess food purchasing or consumption or used subjective (self‐reported) measures. In all of these cases, we were confident that the excluded studies had not measured relevant outcomes.
In addition:
-
9 studies didn't include a no label or incomplete label control group, that is, they only compared different labelling schemes;
-
2 studies were in participants who were not purchasing or consuming food or drink for their personal consumption or for a small group they belonged to; and
-
1 trial registration did not present enough information to assess eligibility;
-
16 of the records were registries, conference abstracts or full papers related to already excluded studies.
We report further details in the Characteristics of excluded studies. As over two‐hundred papers were assessed at the full paper stage, we did not include all of these studies in the Characteristics of excluded studies table if they had obvious reasons for exclusion, such as if the study designs were clearly not eligible (e.g. cross‐sectional survey), if the intervention did not assess a nutritional label (e.g. posters on benefits of eating fruit and vegetables), if the studies did not have a no‐label control group, or if studies did not evaluate purchasing or consumption, or only evaluated intention to purchase or consume a food or drink.
Risk of bias in included studies
We present an overview of risk of bias for each study in Figure 4.

Risk of bias summary
Allocation
Of the 17 RCTs, only Crockett 2014 reported an adequate method of both sequence generation and allocation concealment. Seven other RCTs reported an adequate method of sequence generation (e.g. random number generator) but provided no information on the method of allocation concealment (Girz 2012 ‐ study 1; Girz 2012 ‐ study 2; Girz ongoing; James 2015; Platkin 2014; Roberto 2010; Roberto 2012). Seven RCTs reported no information for either criterion (Bergen 2006; Cavanagh 2014; Ebneter 2013; Hammond 2013; Harnack 2008a; Temple 2010; VanEpps 2016). Ellison 2013 and Ellison 2014a reported only that diners were randomly assigned to a table in one of three sections in a restaurant with different intervention or control menus, but authors reported neither the method used to generate the random sequence nor the method of allocation concealment. Ellison 2014a noted that one section of the restaurant with a designated intervention had booth seating, which some parties requested to have, so not all participants were likely randomised. We thus considered this study to be at high risk of bias on this criterion.
In four Q‐RCTs, participants were allocated to intervention or control groups on different days (Kral 2002; Vermeer 2011; Wansink 2006 ‐ study 1; Wansink 2006 ‐ study 3), and in one Q‐RCT, participants were allocated to intervention or control groups on different weeks (Allan 2015).
Blinding
Of the 17 RCTs and 5 Q‐RCTs, 14 studies appropriately blinded the study participants by concealing the purpose of the study and their treatment group, thus mitigating one source of performance bias (Cavanagh 2014; Crockett 2014; Ebneter 2013; Ellison 2013; Ellison 2014a; Hammond 2013; Harnack 2008a; James 2015; Platkin 2014; Roberto 2010; Roberto 2012; Temple 2010; Vermeer 2011; Wansink 2006 ‐ study 3). We assessed blinding to be inadequate in four studies, as some study participants guessed the study purpose or may have been aware of the other treatment group (Allan 2015; Bergen 2006; Kral 2002; Wansink 2006 ‐ study 1). Blinding was unclear in another four RCTs (Girz 2012 ‐ study 1; Girz 2012 ‐ study 2; Girz ongoing; VanEpps 2016).
Most studies did not explicitly state whether study personnel were blinded to the participants' treatment group, but given the nature of the interventions, blinding is unlikely. In addition, the included studies often did not report blinding the outcome assessor; however, when the outcome variable was objectively assessed (e.g. derived from electronic data, or by weighing food), the lack of blinding may not have resulted in detection bias (Allan 2015; Bergen 2006; Cavanagh 2014; Crockett 2014; Ebneter 2013; Ellison 2013; Ellison 2014a; Hammond 2013; Harnack 2008a; James 2015; Kral 2002; Platkin 2014; Roberto 2010; Roberto 2012;Temple 2010; Vermeer 2011; Wansink 2006 ‐ study 1; Wansink 2006 ‐ study 3; VanEpps 2016). The three remaining studies reported no information on blinding or the method of outcome assessment (Girz 2012 ‐ study 1; Girz 2012 ‐ study 2; Girz ongoing).
All six ITS studies objectively measured the outcomes (e.g. electronic data or till receipts), so a lack of blinding of the outcome assessment may not have resulted in detection bias.
Incomplete outcome data
Most of the RCTs, Q‐RCTs and ITS studies evaluated groups of participants within defined observation periods (sometimes with very short time periods, particularly in laboratory experiments). This may explain why there was little evidence of attrition bias. The exceptions to this were three RCTs and two ITS studies. Two of the RCTs did not report the number of participants randomised at the beginning of the study, only the number of observations made (Ellison 2013; Ellison 2014a). In Ebneter 2013, the overall attrition rate was 22%, with no information on attrition by group. Thus, we considered Ellison 2013 and Ellison 2014a to be at unclear risk of bias and Ebneter 2013 to be at high risk of bias. One ITS study was also at unclear risk bias due to a lack of reporting (Balasubramanian 2002), and another ITS study was at high risk of bias due to a high attrition rate (Cioffi 2015).
Selective reporting
We judged most studies to be at low risk of bias with regard to selective reporting given that they fully reported all of the outcomes specified in the Methods section of the papers. Although the availability of a study protocol would have allowed for a more reliable estimate of this, our searches identified only two protocols from the 17 RCTs (Crockett 2014; Hammond 2013). In addition, most of the RCTs and Q‐RCTs reported complete data that could be used to calculate effect sizes. Selective reporting was not clear in one RCT, Girz ongoing, or in one ITS study, Balasubramanian 2002. The ITS study by Cioffi 2015 was at high risk of bias because authors excluded outcome data for some target food items from the analysis.
Other potential sources of bias
Biases specific to interrupted time series studies
Two of the ITS studies reported that the intervention was independent of confounding variables during the study period (Bollinger 2011; Chu 2009), and another two provided no information (Dubbert 1984; Holmes 2013). In Cioffi 2015, the authors noted that "with data observed over many weeks and at various locations, it was impossible to control for all external factors or events that might have occurred over the entire length of the study", and in Balasubramanian 2002, the authors noted that "our models do not incorporate explanatory variables such as price or other type of deals", suggesting that other changes could have occurred during the study period. We considered that the lack of control for potential confounders introduced a high risk of bias.
Other potential threats to validity
In the cluster‐RCT, there were significant baseline differences between the randomised clusters, so we considered this study to be at high risk of bias (Bergen 2006). In one ITS study, it was unclear how investigators selected the participating grocery stores, raising the possibility of selection bias (Balasubramanian 2002). In three studies, data collection occurred during short time periods or during restricted hours of the day (Dubbert 1984; Ellison 2013; Vermeer 2011), so the outcomes may not have been representative of purchasing or consumption. Moreover, in Balasubramanian 2002, the introduction of the Nutrition Labeling and Education Act may have drawn additional attention to signposting throughout the city where the study took place, not just in the stores in question, thus possibly introducing a co‐intervention. We considered these studies to be at high risk of bias for this additional criterion.
Effects of interventions
See: Summary of findings 1 Summary of findings table
Purchasing studies
Purchasing from vending machines
One cluster‐RCT compared sales of drinks in vending machines with and without labels in a university setting (Bergen 2006). The results showed that participants purchased more diet soda from the labelled vending machines (mean 54.4 beverages, SD 16.7) compared to the non‐labelled machines (mean 48.9 beverages, SD 1.8) (Table 1). However, given the small number of vending machines randomised (N = 3), and the large baseline differences in sales between the vending machines, we cannot clearly interpret the study results or calculate an accurate effect size.
| Reference and study design | Participants and Setting | Intervention/Comparison (sample sizes) | Outcome | Results | Summary effect |
|---|---|---|---|---|---|
| Cluster‐RCT | Students and employees at a university Real‐world setting | Brightly coloured '0 calories, 0 carbs' labels (n = 3 vending machines) vs no labels (n = 2 vending machines)a | Mean number of diet soda beverages (with '0 calories, 0 carbs') purchased from vending machines (weekly) | Mean 54.40 beverages (SD 16.69) vs 48.90 beverages (SD 1.84) | The methods used to analyse the data were not clearly reported and an accurate effect size and confidence intervals could not be calculated.b |
aThe authors also evaluated another intervention ('0 calorie, 0 carbs' plus a motivational poster encouraging the purchase of water and non‐energy‐containing soft drinks) that was not eligible for inclusion in this review.
bThere were baseline differences between the groups. In addition, we could not provide a standardised effect due to the impact of small randomised units (vending machines) on estimates of standard deviation.
Using GRADE criteria, we downgraded the evidence by two levels for very serious risk of bias and by one level for a high degree of imprecision. Thus, we considered the quality of the evidence for labelling on drinks purchased from vending machines to be very low, meaning that we have very little confidence in it.
Purchasing from a grocery store
One ITS study with unclear sample sizes assessed the impact of verbal descriptor labels for single nutrients, such as 'low calorie' or 'light' on food purchasing from a grocery store (Balasubramanian 2002). Regression analysis demonstrated that the sales performance of calorie‐healthy foods (e.g. low‐calorie bottled juices and 'light' frozen entrées and dinners) decreased after the implementation of mandatory labelling (Table 2). The results of this longitudinal time series analysis were, however, difficult to interpret because the authors evaluated a percentage of labelled products bought relative to other products, rather than evaluating time trends of the number of products purchased before and after the introduction of labelling.
| Reference and study design | Participants and setting | Intervention/comparison (sample sizes) | Outcome | Results | Summary effect |
|---|---|---|---|---|---|
| Interrupted time series | Customers at a major grocery store chain Real‐world setting | 'Low calorie', 'diet' 'light' label on front of package vs no label (sample sizes not clear)a | Share (%) of sales of different food categories | "Regression models featuring calorie‐healthy foods consistently show [that] the relative sales performance of such items decreased after the onset of [mandatory labelling]": 'low calorie/diet/light' bottled juices = −1.538 (SE 0.191); 'light' frozen entrées = −2.601 (SE 0.373); 'light' frozen dinners = −4.507 (SE 0.963)b | Regression P values of < 0.001 indicated fewer foods with 'calorie healthy' descriptors were purchased. |
aThe authors also evaluated 'vitamin C fortified' bottled juices, 'plus calcium/calcium added' juices, and 'low fat/reduced fat/fat free' cheese and cookies. These data were not eligible for inclusion in this review.
bGraphs were not presented for the foods or beverages of interest, so that re‐analysis of the data was not possible from the published paper.
Using GRADE criteria, we downgraded the evidence for this observational study by one level for serious risk of bias and one level for indirectness, because the study measured the outcome indirectly, as a proportion of overall purchasing rather than as a direct quantity. Thus, we considered the quality of the evidence for labelling on drinks purchased from grocery stores to be very low, meaning that we have very little confidence in it.
Purchasing from a restaurant, cafeteria or coffee shop
Nine studies assessed the impact of nutritional labels on menus or menu boards, or nutritional labels placed on, or adjacent to, a range of food or drink options in restaurants, cafeterias or coffee shops (Allan 2015; Bollinger 2011; Chu 2009; Cioffi 2015; Dubbert 1984; Ellison 2013; Ellison 2014a; Holmes 2013; VanEpps 2016). Three of these studies were RCTs (Ellison 2013; Ellison 2014a; VanEpps 2016), one was a Q‐RCT (Allan 2015), and five used ITS analyses (Bollinger 2011; Chu 2009; Cioffi 2015; Dubbert 1984; Holmes 2013). Only three RCTs presented data suitable for calculating effect sizes (Ellison 2013; Ellison 2014a; VanEpps 2016). We present brief descriptions of all nine studies below and in Table 3.
| Reference and study design | Participants and setting | Intervention/comparison (sample sizes) | Outcome | Results | Summary effect |
|---|---|---|---|---|---|
| Q‐RCT | Coffee shop customers at academic hospital Real‐world setting | Energy content of all food and drinks available on point of purchase signs vs. no information (N = 20,516 items purchased) | Proportion of high energy food and drinks purchased (as a percentage of total drinks and snacks sold) | The proportion of high energy snacks purchased was 41% in the intervention and 45% the control group (P = 0.04); the proportion of high energy drinks purchased was 46% in the intervention group and 50% in the control group (P = 0.15). | Effect size and confidence intervals could not be calculated. |
| Interrupted time series | Coffee shop customers Real‐world setting | Energy content on menu and menu boards vs no information (N = 118,480 transactions reported) | Mean kcal of food and drinks purchased per transaction | "Estimates of the effect of calorie posting (calories per transaction): log (beverages and food) = −0.060 (0.001)a–representing a ... decrease in average calories per transaction, equivalent to 14.4 calories" | Regression P value < 0.01 |
| Interrupted time series | Customers at a university dining centre Real‐world setting | Nutrition facts information on menu board (N = 14,199 entrées sold) vs no label (pre‐intervention: N = 13,951 entrées sold; post‐intervention N = 14,020 entrées sold) | Mean kcal content of entrées purchased per day | Mean energy content of entrées sold at start of the pre‐intervention period: 646.5 kcal with a slope of 0.094 kcal per day. The difference in energy content of entrées sold between the pre‐treatment last day and treatment first day was −12.4 kcal (P = 0.007). Following this reduction, the difference in slope pre‐intervention to intervention was −0.298 kcal per day, and the difference in slope intervention to post‐intervention was 1.512 kcal per day. This means that the average energy content of entrées purchased reduced immediately after the intervention, and gradually increased when the intervention was removed. | Regression P values were 0.56 (pre‐intervention to intervention slope), and 0.013 (intervention to post‐intervention slope). |
| Interrupted time series | Customers at a university dining centre Real‐world setting | Nutrition facts label on pre‐packaged meals and snacks vs no label (sample sizes not reported) | Mean kcal purchased per week from meals and snacks | "Mean [energy] purchased decreased significantly across the 3 [time points] of the pre‐labelling period. However, no such trend was observed in the post‐labelling period." (data compared over 3 time points)."After labelling, the mean energy content of the items purchased per week decreased significantly from 476.2 (SD 8.7) kcals to 445.3 (SD 8.1) kcals per week (p<0.001)." | A statistical comparison of time trends (i.e. slope) before and after the intervention was not reported, so that the overall effectiveness of the intervention is not clear. |
| Interrupted time series | Customers at a public cafeteria Real‐world setting | 'Lower calorie' label on green paper with a red dot on right‐hand corner beside food item vs no label (sample sizes of foods purchased is not clear) | Probability of choosing low energy entrées, vegetables, or salads | "The probability of choosing a low [energy] entrée did not differ from baseline." The probability of purchasing lower‐energy vegetables and salads significantly increased compared to the no label baseline conditions (P < 0.001). | A statistical comparison of time trends before and after the intervention was not clearly reported, so that the overall effectiveness of the intervention is not clear. |
| RCT | Customers at a restaurant Real‐world setting | 1. Energy content on menu (n = 54) 2. Menu with energy content using traffic light format (n = 54) 3. No label (n = 30) | Mean kcal purchased per meal (including entrées, desserts and drinks) | 756.5 kcal (SD 338.5)b vs 765 kcal (SD 368.0) | MD −8.50 kcal (95% CI −154.85 to 137.85) |
| RCT | Customers at a restaurant Real‐world setting | 1. Energy content on menu (n = 469) 2. Menu with energy content using traffic light format (n = 591) 3. No label (n = 472) | Mean kcal purchased per meal (entrées only) | 705.6 kcal (SD 334.7)c vs. 746 kcal (SD 368.0) | MD −40.38 kcal (95% CI −79.21 to −1.55) |
| Interrupted time series | Families at a restaurant Real‐world setting | Children's menu with energy and fat content label vs no label (N = 1275 meals)d | Mean kcal purchased per meal | "The calorie and fat menu had the biggest change in calories compared to the control menu (−9.54), but it was not significant." | A statistical comparison of time trends before and after the intervention was not reported, so that the overall effectiveness of the intervention is not clear. |
| RCT | Employees at large company buying lunch online Real‐world setting | 1. Energy content on menu (n = 38) 2. Menu with energy content using traffic light format (n = 46) 3. No label (n = 123)e | Mean kcal purchased per meal | 537.9 kcal (SD 203.9)f vs. 605.3 kcal (SD 222.5) | MD −67.38 kcal (95% CI −126.09 to −8.66) |
aAccounting for effects of week, day of week and weather.
bSDs were calculated from P values reported in the text; means and SDs for both intervention groups were combined (intervention 1: 817 kcal (SD 334.6); intervention 2: 696 kcal (SD 334.6)).
cSDs were based on Ellison 2013; means and SDs for both intervention groups were combined (intervention 1: 719 kcal (SD 334.6); intervention 2: 695 kcal (SD 334.6)).
dThe authors also evaluated two other labelling interventions (a healthy (apple) symbol, and a 'Nutrition Bargain Price') that were not eligible for inclusion in this review.
eThe authors also evaluated one other labelling interventions (traffic light labels without energy information) that was not eligible for inclusion in this review.
fMeans and SDs (obtained from the study authors) for both intervention groups were combined (intervention 1: 543.8 (SD 180); intervention 2: 533.1 (SD 223.6)).
Of the three RCTs, two took place in the same restaurant under the supervision of the same research team (Ellison 2013; Ellison 2014a). In both studies, groups of customers were randomised to three different menus: a menu labelled with energy information, a menu with energy information in a traffic light format, or a menu with no energy information. In the first study, investigators collected data for two weeks, and in the second study, for 19 weeks. In the third RCT, conducted over a four‐week period, company employees chose lunch items from an online menu from a corporate restaurant with or without energy information, and alone or with a traffic light format (VanEpps 2016). For each of these three RCTs, we combined two of the treatment arms: energy labelling alone, and energy labelling plus a traffic light format. We could then calculate effect sizes for menu labelling versus no‐label comparisons. A meta‐analysis of these three RCTs from restaurants demonstrated a statistically significant reduction of 47 kcal in energy purchased when menus were labelled (MD −46.72 kcal, 95% CI −78.35 to −15.10, P = 0.004, N = 1877; Analysis 1.1; Figure 5) with little evidence of heterogeneity (Chi² = 0.84, P = 0.66, I² = 0%). Assuming an average meal intake of 600 kcal, the size of this effect suggests that energy labelling on menus would reduce energy purchased per meal by 7.8% (95% CI 2.5% to 13.1%).

Forest plot of comparison: Labelling on menus vs no labelling in restaurants, and energy (kcal) of food purchased
We considered two RCTs to be at unclear risk of bias because there was insufficient information available on study methods to make an assessment (Ellison 2013; VanEpps 2016), and we assessed one RCT as being at very high risk of bias (Ellison 2014a). We thus downgraded the evidence two levels for very serious risk of bias. We rated the quality of the evidence for these three studies to be low, so our confidence in the effect estimate is limited, and the estimate may change with further studies.
Of the remaining six studies, one Q‐RCT assessed point‐of‐purchase signs that provided energy information on all snacks and drinks available at a hospital coffee shop (Allan 2015).The signs were randomly presented or not presented for six weeks each. The authors reported that the proportion of high‐calorie snacks purchased (of the total purchases) was significantly lower in the intervention group compared to the control group (41% versus 45%, P = 0.04), but there was no significant difference in the proportion of high‐energy drinks purchased between the intervention and control (46% versus 50%, P = 0.15). While the total number of items purchased over the 12 weeks was 20,516, the study did not provide sample sizes for intervention and control snacks or drinks.
Of the five ITS studies, one evaluated changes before and after mandatory energy food labelling on menus and menu boards in New York City (Bollinger 2011). Using regression analysis, the authors reported an average decrease after labelling in energy purchased from food of 14.4 calories per transaction (P = 0.001) at a coffee shop chain, with a negligible impact on energy from drinks per transaction.
Three ITS studies took place in cafeterias (Chu 2009; Cioffi 2015; Dubbert 1984), but only one statistically compared time trends before and after the implementation of labelling (Chu 2009). This study found that introducing a menu board that adhered to the same format as the FDA nutritional facts label reduced the average energy content of entrées selected by participants immediately after the intervention, and that the energy content of the entrées selected gradually increased after removing the nutrition information (total entrées sold/evaluated = 42,170) (Chu 2009). Cioffi 2015 also reported the effects of a nutrition facts label placed directly on pre‐packaged meals and snacks. The mean energy purchased was higher pre‐intervention than during the intervention, but authors did not report a statistical comparison of time trends before and after the intervention. Dubbert 1984 found that a 'lower calorie selection' label placed near appropriate food items significantly increased the probability of purchasing lower energy vegetables and salads compared to higher energy vegetables and salads (P < 0.001 for both) over baseline conditions. The probability of purchasing a low‐energy entrée did not differ from baseline. A further ITS study assessed the impact of energy and fat information presented on children's menus and reported that, compared with no nutritional labelling, total energy purchased after two months was unchanged (Holmes 2013). However, authors did not report a statistical comparison of time trends before and after the intervention.
We considered two ITS studies to be at low risk of bias (Bollinger 2011; Chu 2009), while one was at unclear risk (Holmes 2013), and two were at high risk (Cioffi 2015; Dubbert 1984). One Q‐RCT was also at high risk of bias (Allan 2015) Both ITS studies considered to be at low risk of bias supported the findings of the meta‐analysis reported above.
Consumption studies
Consumption in laboratory settings
Seventeen studies assessed the impact on consumption of nutritional labels on one or more food items in artificial or laboratory settings (Cavanagh 2014; Crockett 2014; Ebneter 2013; Girz 2012 ‐ study 1; Girz 2012 ‐ study 2; Girz ongoing, Hammond 2013; Harnack 2008a; James 2015; Kral 2002; Platkin 2014; Roberto 2010; Roberto 2012; Temple 2010; Vermeer 2011; Wansink 2006 ‐ study 1; Wansink 2006 ‐ study 3. Eight assessed labelling on menus or on a range of food options, such as at a buffet meal (Girz 2012 ‐ study 2; Girz ongoing, Hammond 2013; Harnack 2008a; James 2015; Platkin 2014; Roberto 2010; Temple 2010) (see Table 4). Six studies assessed the impact of a nutritional label on a snack, drink or meal without providing participants with other options to choose from (Cavanagh 2014; Crockett 2014; Ebneter 2013; Kral 2002; Roberto 2012; Vermeer 2011) (see Table 4). An additional three studies intentionally mislabelled products to detect effects on behaviour, by measuring energy intake of high‐fat snack foods labelled as low fat or low energy (Girz 2012 ‐ study 1; Wansink 2006 ‐ study 1; Wansink 2006 ‐ study 3). We consider these latter three in the section below on potential harms associated with labelling (see also Table 5).
| Reference and study design | Participants and setting | Intervention/comparison (sample sizes) | Outcome | Results | Summary effect |
|---|---|---|---|---|---|
| Labelling on menus or placed on a range of food options on energy consumed during a meal | |||||
| RCT | University students Experimental (laboratory) study at a university | Energy content on menu plus information on recommended daily energy intake for women and men (n = 60) vs no label (n = 66)a | Mean kcal consumed during a meal (salad and pasta) | 608.2 kcal (SD 350.8)b vs 631.3 kcal (SD 324.0) | MD −23.02 kcal (95% CI −141.28 to 95.24) |
| RCT | University students Experimental (laboratory) study at a university | Energy content on menu (n = 24) vs no label (n = 25) | Mean kcal consumed during a meal | 433.1 kcal (SD 260.2) vs 426.5 kcal (SD 237.4)c | MD 6.60 kcal (95% CI −133.02 to 146.22) |
| RCT | Adults Experimental (laboratory) study at a university | 1. Energy content on menu (n = 165) 2. Menu with energy content using a traffic light format (n = 156) 3. Menu with energy, fat, salt, and sugar content using traffic light format (n = 152) vs no label (n = 162) | Mean kcal consumed during a fast food meal | 761.6 kcal (SD 348.9)d vs 839.6 kcal (SD 318.8) | MD −78.00 kcal (95% CI −136.29 to −19.70) |
| RCT | Adolescents and adults Experimental study conducted in hotel conference rooms/church hall | Energy content on menu plus information on recommended daily energy intake for women and men (n = 151) vs no label (n = 150)e | Mean kcal consumed during a fast food meal | 804.7 kcal (SD 423.9) vs 739.0 kcal (SD 358.2) | MD 65.70 kcal (95% CI −22.94 to 154.34) |
| RCT | Adults, including university students Experimental study at a university | Energy content on menu plus information on recommended daily energy intake for women and men (n = 99) vs no label (n = 99)f | Mean kcal consumed during a meal | 722.0 kcal (SD 271.6)g vs 770.0 (SD 269.1) | MD −48.00 kcal (95% CI −123.31 to 27.31) |
| RCT | Female university students Experimental (laboratory) study at a university | 1. Energy content on menu (n = 20) 2. Menu with energy content and exercise equivalents (n = 20) vs no label (n = 22) | Mean kcal consumed during a fast food meal | 870.1 kcal (SD 375.9)h vs 995.4 (SD 429.4) | MD −125.33 kcal (95% CI −339.26 to 88.59) |
| RCT | Adults from the community Experimental (classroom) study at a university | 1. Energy content on menu (n = 92) 2. Menu with energy content plus information on recommended daily intake (n = 103) vs no label (n = 92) | Mean kcal consumed during a meal | 1293.3 kcal (SD 656.8)i vs 1458.9 kcal (SD 724.6) | MD −165.58 kcal (95% CI −340.01 to 8.84) |
| RCT | Adults Experimental (laboratory) study at a university | Nutrition facts label on foods (n = 23) vs no label (n = 24) | Mean kcal consumed during a meal | 620.4 kcal (SD 203.6) vs 822.8 kcal (SD 408.7)j | MD −202.40 kcal (SD −385.86 to −18.94) |
| Labelling of a single food or drink option on energy consumed during a snack or meal | |||||
| RCT | Female university students Experimental (laboratory) study at a university | Energy label on chocolate cookie (130 kcal) (n = 62) vs no label (n = 62)k | Mean grams consumed from snack of chocolate chip cookies | 45.1 g (SD 21.50) vs 33.1 g (SD 21.57)l | SMD 0.55 (95% CI 0.19 to 0.91) |
| RCT | Adults Experimental study at a cinema | Red 'high fat' label on side of popcorn container (n = 96) vs no label (n = 88)m | Mean kcal consumed from snack of toffee or salted popcorn (high‐fat snack) | 413.5 kcal (SD 307.6)n vs 468.1 kcal (SD 361.9) | SMD −0.16 (95% CI −0.45 to 0.13) |
| RCT | Female university students Experimental study at a university | Energy label ('new colours of regular M&M's, 240 calories per serving"') on glass container containing M&M's (n = 41) vs no energy content label ('new colours of regular M&M's') (n = 38)o | Mean kcal consumed during snack of M&M's (high‐fat snack) | 157.2 kcal (SD 98.5) vs165.9 kcal (SD 141.5) | SMD −0.07 (95% CI −0.51 to 0.37) |
| Q‐RCT | Females Experimental (laboratory) study at a university | Energy label plus 'colour‐coded' information on level of energy density on an entrée (n = 20) vs no label (n = 20) | Mean kcal consumed from an entrée at breakfast, lunch and dinner | 1534.0 kcal (SD 451.7) vs 1569.0 kcal (SD 335.4) | SMD −0.09 (95% CI −0.71 to 0.53) |
| RCT | Adults Experimental (laboratory) study at a university | 1. Smart choices label on cereal box (n = 76 analysed) 2. Modified smart choices label (n = 71) vs no label (n = 69) | Mean grams of high‐sugar breakfast cereal and milk consumed | 225.7 g (SD 138.2)p vs 219.9 g (SD 127.1) | SMD 0.04 (95% CI −0.24 to 0.33) |
| Q‐RCT | Adults Experimental study at a cinema | Portion size and energy content label (display board) (n = 48) vs no label (n = 41) | Mean millilitres of soft drink consumed | 376.3 mL (SD 125.4) vs 382.14 mL (SD 147.6)q | SMD −0.04 (95% CI−0.46 to 0.37) |
aTwo other interventions were combined by the study authors as a 'calorie only' intervention (400 kcal salad and 1200 kcal pasta, and 1200 kcal salad and 400 kcal pasta (although both salad and pasta contained 1200 kcal)). We did not include this data in the above analysis as it involved mislabelling some of the foods (data were not reported separately for consumption of foods that were accurately labelled).
bMeans and SDs were reported separately for men and women by the study authors; we have combined these data.
cData were obtained from the study authors (Girz ongoing).
dMean and SDs for all three intervention groups were combined (intervention 1: 744.2 kcal (SD 368.1); intervention 2: 776.8 kcal (SD 350.9); intervention 3: 764.9 (SD 326.2)).
eThe authors also evaluated other labelling interventions (energy information and daily recommended intake plus price modification, and price modification alone) that were not eligible for inclusion in this review.
fThe authors also evaluated another intervention (exercise label describing the number of minutes of brisk walking required to burn the energy for each food item), but as this intervention did not present energy content information, it was not eligible for inclusion in this review.
gSDs were calculated from confidence intervals.
hSDs were calculated from standard errors. Means and SDs for both intervention groups were combined (intervention 1: 898.82 kcal (SD 392); intervention 2: 841.31 kcal (SD 82.07)).
iMeans and SDs for both intervention groups were combined (intervention 1: 1334.72 kcal (SD 621); intervention 2: 1256.37 kcal (SD 689)).
jData were obtained from the study authors (Temple 2010).
kThe authors also evaluated another labelling intervention (high energy label on a low energy cookie) that was not eligible for inclusion in this review.
lThese data were converted kcal using formula presented in DeGroot 2012.
mThe authors also evaluated another labelling intervention (green 'low fat' label on high fat popcorn) that is not reported here (see Table 5).
nMeans and SDs for two types of popcorn (toffee and salted), reported separately in the paper, were combined.
oThe authors also evaluated two other labelling interventions (low fat label with and without energy information on high fat snacks) that is not reported here (see Table 5).
pMeans and SDs for both intervention groups were combined (intervention 1: 219.21 (SD 133); intervention 2: 232.61 (SD 144)). These data were then converted kcal using formula presented in DeGroot 2012.
qThese data were converted kcal using formula presented in DeGroot 2012.
| Reference and study design | Participants and setting | Intervention/comparison (sample sizes) | Outcome | Results | Summary effect |
|---|---|---|---|---|---|
| RCT | Adults Experimental study at a cinema | Green 'low fat' label on side of container containing high‐fat popcorn (n = 103) vs no label (n = 88) | Mean kcal consumed from snack of popcorn | 402.44 kcal (SD 288.68) vs 468.07 kcal (SD 361.93) | SMD −0.20 (95% CI −0.48 to 0.08) |
| RCT | Female university students Experimental study at a university | Low fat label ('new low fat M&M's') on glass container containing M&M's (n = 49) vs no energy information label ('new colours of regular M&M's') (n = 38) | Mean kcal consumed during snack of M&M's | 192.34 kcal (SD 145.53) vs165.88 kcal (SD 141.5) | SMD 0.18 (95% CI−0.25 to 0.61) |
| RCT | Female university students Experimental (laboratory) study at a university | Lower energy label (600 kcal) on high‐energy salad and pasta (actually 1200 kcal) (n = 56) vs no label (n = 49)a | Mean kcal consumed during a meal (salad and pasta) | 400.26 kcal (SD 199.8) vs 420.19 kcal (SD 233.69) | SMD −0.09 (95% CI −0.47 to 0.29) |
| Q‐RCT | Students and their families Experimental study at a university | Low fat label ('new low fat M&M's') on glass container containing M&M's vs no energy information label ('new colours of regular M&M's') (n = 269 overall (n by group not reported)) | Mean kcal consumed from snack of M&M's | Mean 244 kcal (SD not reported) vs 190 kcal (SD not reported) | SMD 0.44 (95% CI 0.20 to 0.68)b |
| Q‐RCT | University staff, graduates and undergraduates Experimental study at a university | Low fat label ('Low‐Fat Rocky Mountain Granola') on zip lock bag vs no label ('Regular Rocky Mountain Granola') (n = 66 overall (n by group not reported)) | Mean kcal consumed from snack of granola | Mean 249 kcal (SD not reported) vs 165 kcal (SD not reported) | SMD 0.69 (95% CI 0.20 to 1.18)c |
aData were extracted for those who chose pasta or salad when it was inaccurately as '600 calories'.
bSMD was calculated based on F‐test data reported in the text.
cSMD was calculated based on F‐test data reported in the text.
Energy consumed during a meal with a range of available food options
A meta‐analysis of eight RCTs did not conclusively demonstrate a reduction in energy consumed when menus (7 studies) or a range of foods (1 study) were labelled (MD −50.27 kcal, 95% CI −104.41to 3.88, P = 0.07, N = 1705; Analysis 2.1; Figure 6; Girz 2012 ‐ study 2; Girz ongoing, Hammond 2013; Harnack 2008a; James 2015; Platkin 2014; Roberto 2010; Temple 2010), and there was moderate heterogeneity between the studies (Chi² = 13.06, P = 0.07, I² = 46%). The pooled result shows a positive effect for labelling, although the 95% confidence interval crosses the line of no effect. Assuming an average meal intake of 600 kcal, the size of this effect suggests that energy labelling of menus or food would reduce consumption per meal by 8.4% (95% CI −0.7% to 17.4%).

Forest plot of comparison: Labelling on menus or placed on a range of food options vs. no labelling in laboratory settings, and energy (kcal) consumed
A pre‐planned sensitivity analysis, including the three studies judged to be at low risk of bias (James 2015; Platkin 2014; Roberto 2010), resulted in an increased effect size (MD −72.04 kcal, 95% CI −137.84 to −6.25, P = 0.03, N = 547; Analysis 3.1) with little evidence of heterogeneity (Chi² = 1.73, P = 0.42, I² = 0%). This equated to a per meal reduction of 12.0% (95% CI 1.0% to 23.0%), again assuming an average meal intake of 600 kcal.
Of the eight RCTs that evaluated this outcome, we considered three to be at low risk of bias (James 2015; Platkin 2014; Roberto 2010), while five were at unclear risk due to there being insufficient information on study methods to make an assessment (Girz 2012 ‐ study 2; Girz ongoing; Hammond 2013; Harnack 2008a; Temple 2010).
Using GRADE criteria, we downgraded the evidence one level for imprecision (as the 95% confidence interval included the possibility of no effect and of a meaningful decrease) and one level for indirectness (as behaviour observed in a laboratory setting may not be applicable to real‐world settings). Although five of the included studies were at unclear risk of bias, we did not downgrade for risk of bias. Thus, we considered quality of the evidence for the impact of labelling on menus or multiple foods on energy consumption to be low, meaning that our confidence in the effect estimate is limited, and the estimate may change with further studies.
Energy consumed during a snack or meal with a single food or drink option
Four RCTs (Cavanagh 2014; Crockett 2014; Ebneter 2013; Roberto 2012), plus two Q‐RCTs (Kral 2002; Vermeer 2011), assessed the impact of labelling on energy (kcal) consumption when participants were offered a single food option: cookies, high‐sugar breakfast cereal, chocolate, popcorn, an entrée, or soft drinks. In these studies, the nutritional label was placed on the container or packaging, adjacent to the food, or presented on a display board. A meta‐analysis of these six studies did not demonstrate a statistically significant reduction in energy consumed with labelling, but the confidence intervals were wide, suggesting uncertainty in the true effect size (SMD 0.05, 95% CI −0.17 to 0.27, P = 0.67, N = 732; Analysis 4.1), and the effect size was small (see Cohen 1988). Heterogeneity between the studies was moderate, principally due to Cavanagh 2014, which differed in using low‐energy (as opposed to high‐energy) snack foods (Chi² = 10.28, P = 0.07, I² = 51%). Within this analysis there is a probable lack of consistency in the distributions of values associated with measures of meal compared to snack consumption, which is a potential limitation, affecting the extent to which the SD units can be equated across the studies; however, we are confident that alternative analysis options would not affect our overall conclusions. The results were similar in a sensitivity analysis that included only the two studies we judged to be at low risk of bias (SMD −0.06, 95% CI −0.26 to 0.15, P = 0.57, N = 400; Analysis 5.1; Crockett 2014; Roberto 2012), with little evidence of heterogeneity (Chi² = 0.98, P = 0.32, I² = 0%).
Of the four RCTs and two Q‐RCTs that evaluated this outcome, we considered two RCTs to be at low risk of bias (Crockett 2014; Roberto 2012), one RCT to be at unclear risk of bias (given insufficient information reported to enable an assessment) (Cavanagh 2014), and one RCT and the two Q‐RCTs to be at high risk of bias (Ebneter 2013; Kral 2002; Vermeer 2011).
Using GRADE criteria, we downgraded the evidence one level for serious risk of bias and one level for indirectness, as behaviour observed in a laboratory setting may not be applicable to real‐world settings. Although the confidence intervals were wide, this did not affect the overall rating. Thus, we considered the quality of the evidence for the impact of labelling of a single food or drink option on energy consumption to be low, meaning that our confidence in the effect estimate is limited, and that the estimate may change with further studies.
Subgroup analyses
We conducted pre‐planned subgroup analyses by dietary restraint and by study country. We performed separate analyses for studies that provided a range of food options and for studies that provided single food options. No analyses demonstrated statistically significant differences, but the confidence intervals were wide, suggesting uncertainty in the true effect size.
For studies providing multiple food options, the pooled effect size for restrained eaters was MD 20.87 kcal (95% CI −37.44 to 79.18, P = 0.48, N = 129; Girz 2012 ‐ study 2; Girz ongoing), and for unrestrained eaters the MD was 10.98 kcal (95% CI −38.85 to 60.81, P = 0.67, N = 138; Girz 2012 ‐ study 2; Girz ongoing), with the test for subgroup differences showing no significant effect (Chi² = 0.06, df = 1, P = 0.80, I² = 0%); see Analysis 6.1.
Of the studies that provided single food options, only one study reported data for restrained and unrestrained eaters, presenting the results as standardised mean energy consumption. The effect size for restrained eaters was SMD −0.44 (95% CI −0.94 to 0.05) (sample size not reported), and for unrestrained eaters it was SMD 0.03 (95% CI −0.34 to 0.39) (sample size not reported) (Crockett 2014), with the test for subgroup differences showing no significant effect (Chi² = 2.24, df = 1, P = 0.13, I² = 55%); see Analysis 7.1.
For studies providing multiple food options, the pooled effect size for US studies was MD −70.57 kcal (95% CI −167.65 to 26.52, P = 0.15, N = 895; Harnack 2008a; James 2015; Platkin 2014; Roberto 2010; Temple 2010). The effect size for studies conducted in other countries was MD −58.18 kcal (95% CI −107.15 to −9.21; Girz 2012 ‐ study 2; Girz ongoing; Hammond 2013), with the test for subgroup differences showing no significant effect (Chi² = 0.05, df = 1, P = 0.82, I² = 0%); see Analysis 8.1.
For studies providing a single food option, the pooled effect size for US studies was SMD 0.14 (95% CI −0.17 to 0.45, P = 0.37, N = 459; Cavanagh 2014; Ebneter 2013; Kral 2002; Roberto 2012), and for studies conducted in other countries the SMD was −0.12 (95% CI −0.36 to 0.11, P = 0.31, N = 273; Crockett 2014; Vermeer 2011), with the test for subgroup differences showing no significant effect (Chi² = 1.75, df = 1, P = 0.19, I² = 43%); see Analysis 9.1.
Potential harms associated with labelling
Based on the analyses described above, there is no evidence that nutritional labelling has the unintended harm of increasing energy purchased or consumed.
Indirect evidence concerning potential harm comes from five studies that involve mislabelling content for a single nutrient (Crockett 2014; Ebneter 2013; Girz 2012 ‐ study 1; Wansink 2006 ‐ study 1; Wansink 2006 ‐ study 3). Two Q‐RCTs examined the impact of low fat labels on energy consumption of high‐energy snack foods (chocolate and granola) (Wansink 2006 ‐ study 1; Wansink 2006 ‐ study 3), and one RCT evaluated the impact of low energy labels on energy consumption of high‐fat foods (a pasta dish and an energy dense salad) (Girz 2012 ‐ study 1). In addition, two RCTs evaluated treatment arms in which high‐fat snack foods carried a low fat label (Crockett 2014; Ebneter 2013). In one of these studies a treatment group received toffee and salted popcorn with a green low fat label (Crockett 2014), and in the other study, a treatment group received a chocolate confectionery coated with hard candy shell (M&M's) labelled as 'low fat' (without any other energy information) (Ebneter 2013). A meta‐analysis of these five studies did not demonstrate a statistically significant increase in energy (kcal) consumed with mislabelling, but the confidence intervals are wide, suggesting uncertainty in the true effect size (SMD 0.19, 95% CI −0.14 to 0.51, P = 0.25, N = 718), and the effect size was small (see Cohen 1988). There was also a high degree of heterogeneity between the studies (Chi² =17.44, P = 0.002, I² = 77%); see Analysis 10.1.
Only one of the five studies was at low risk of bias (Crockett 2014), while one was at unclear risk (Girz 2012 ‐ study 1), and the other three were at high risk of bias (Ebneter 2013; Wansink 2006 ‐ study 1; Wansink 2006 ‐ study 3).
Using GRADE criteria, we downgraded the evidence one level for serious risk of bias, one level for heterogeneity, and one level for indirectness, as behaviour observed in a laboratory setting may not be applicable to real‐world settings. In addition, the 95% confidence interval included the possibility of a meaningful decrease or increase; however, the quality score was already very low, and we could not reduce it further to recognise this imprecision. Thus, we judged the quality of the evidence for studies of mislabelling on energy consumption to be very low, meaning we have very little confidence in the results presented, and the true effect is likely to be substantially different from the estimate of effect.
Discussion
Summary of main results
Purchasing food or drinks in real‐world settings (vending machines, grocery stores, restaurants, cafeterias or coffee shops)
Eleven studies, comprising five RCTs and six interrupted time series (ITS) studies, assessed the impact of nutritional labels on menus or menu boards, or nutritional labels placed on, or adjacent to, a range of food or drink options, on purchasing in real‐world settings. One cluster‐RCT assessed purchasing from vending machines; one ITS study, from grocery stores; and three RCTs, one Q‐RCT and five ITS, from restaurants and cafeterias. We could not interpret study results on vending machines and grocery stores and considered the evidence to be of very low quality. A meta‐analysis of the three RCTs, all of which assessed energy labelling in restaurants, demonstrated a statistically significant reduction of 47 kcal in energy purchased when menus were labelled. Assuming an average meal of 600 kcal, this represents a 7.8% reduction (95% CI 2.5% to 13.1%) in energy purchasing. Applying the GRADE system, we considered the quality of the evidence for these three studies as low, so our confidence in the effect estimate is limited and may change with further studies. Of the remaining six studies, we considered only two (both ITS studies involving energy labels on menus or menu boards) to be at low risk of bias, and their results support the meta‐analysis. The other four studies which were conducted in a restaurant, cafeterias (2 studies) or a coffee shop, did not clearly report their results, so we considered them to be at high risk of bias.
Consumption of food or drinks in laboratory settings
Seventeen studies, comprising 13 RCTs and 4 Q‐RCTs, assessed the impact of nutritional labelling on consumption of food or drink in an artificial settings or scenarios (referred to as laboratory settings in this review).
Of these, eight RCTs assessed the effect of labels on menus, or labels placed on a range of food options, on energy consumed during a meal. A meta‐analysis of these eight studies did not conclusively demonstrate a reduction in energy consumed when menus or foods were labelled, but the results favoured nutritional labelling. Assuming an average meal intake of 600 kcal, the size of this effect suggests that energy labelling of menus or food would reduce consumption per meal by about 8.4% (95% CI −0.7% to 17.4%). Applying the GRADE system, we considered the quality of the evidence for this group of studies to be low, meaning that our confidence in the effect estimate is limited and that the estimate may change with further studies. In a pre‐planned sensitivity analysis including only the three studies at low risk of bias, we found a statistically significant reduction of 72 kcal in energy consumed, equating to a reduction of 12.0% per meal (95% CI 1% to 23%). Further studies at low risk of bias are needed to increase confidence in this effect size.
Six laboratory studies (four RCTs and two Q‐RCTs) assessed the impact of labelling a single food or drink option (cookies, high‐sugar breakfast cereal, chocolate, popcorn, an entrée, or soft drinks) on energy consumed during a snack or meal. A meta‐analysis of these six studies did not demonstrate a statistically significant difference in energy (kcal) consumed with labelling, and in any case the effect size was small (Cohen 1988). However, the confidence intervals were wide, suggesting uncertainty in the true effect size. Applying the GRADE system, we considered the quality of the evidence for this group of studies to be low, so our confidence in the effect estimate is limited and may change with further studies. The results were similar in a sensitivity analysis that included only two studies at low risk of bias.
Subgroup analysis exploring possible moderating effects (restrained eaters and unrestrained eaters; studies conducted in the USA and studies conducted in other countries) did not show a difference in impact of nutritional labelling. However, these analyses were likely underpowered due to the small number of studies in each subgroup.
Potential harms associated with labelling
Based on the analyses described above, there was no evidence that nutritional labelling had the unintended harm of increasing energy purchased or consumed. Indirect evidence concerning potential harm came from five laboratory studies that involved mislabelling content for a single nutrient (i.e. placing low energy or low fat labels on high‐energy foods) during a snack or meal. A meta‐analysis of these five studies did not demonstrate a statistically significant increase in energy (kcal) consumed, and the effect size was small (Cohen 1988). However, the confidence intervals were wide, suggesting uncertainty in the true effect size. We considered the quality of the evidence from these studies to be very low, providing very little confidence in the effect estimate.
Overall completeness and applicability of evidence
We used an extensive search strategy involving a comprehensive range of databases and other sources and, whilst possible, it is unlikely that we missed relevant references. In addition, we included only studies with objectively assessed outcomes, thus increasing the applicability of the evidence to actual behaviour. However, the applicability of the evidence was limited by several study characteristics. Most (21/28) studies took place in the USA and none were in low‐ or middle‐income countries. Furthermore, many of the studies took place in university settings (19/28), and 17 took place in artificial or laboratory settings. While the review results are necessarily limited to the foods and drinks evaluated in the included studies, these encompassed a range of foods including fast food and other meals, soft drinks and snacks. The extent to which the results of this review are applicable beyond North American university settings or laboratory settings is uncertain. For one of the meta‐analyses (Analysis 4.1), we acknowledge that the probable lack of consistency in the distributions of values associated with the different outcome measures is a potential limitation, constraining the extent to which the SD units are comparable across the studies.
One of the strengths of this review is that we included all types of nutritional labels. This review, however, did not set out to compare labels in terms of content or format. Thus, the results apply to nutritional labelling in general.
Quality of the evidence
We assessed the quality of the evidence included in this review as low or very low using GRADE criteria. These low ratings were largely due to the large number of studies with a high risk of bias, imprecision in the pooled effect estimates, and unknown applicability of laboratory studies to real‐world settings.
Potential biases in the review process
At least two independent reviewers were involved in the selection of studies and in the data extraction and quality assessment processes, thus reducing the potential for reviewer error and bias. We sought published and unpublished studies in any language, thus reducing the potential for language and publication biases. It is possible that we failed to identify all relevant research for inclusion in the review, although we took steps to reduce this possibility by citation searching and contacting researchers in the field regarding eligible studies. We also made a number of changes to the review after writing the protocol, although we provided a rationale for these changes in Differences between protocol and review. In addition, we could have re‐analysed the graphs in some of the interrupted time series studies using segmented time series regression techniques, although in most cases data presented in the graphs were inadequate to enable this. However, even when adequate data were available, we did not do this because we considered most studies to be at high risk of bias.
Agreements and disagreements with other studies or reviews
We identified 12 systematic reviews that concern nutritional labelling (Bleich 2017; Campos 2011; Cantu‐Jungles 2017; Cecchini 2016; Cowburn 2005; Grech 2015; Grunert 2007; Harnack 2008b; Mhurchu 2007; Shemilt 2017; Sinclair 2014; Swartz 2011), nine of which assessed at least one type of behavioural outcome (i.e. purchasing or consumption). Of the three reviews that did not report behavioural outcomes, two evaluated outcomes such as consumer knowledge and understanding of nutritional labelling (Campos 2011; Cowburn 2005). The third review aimed to assess behavioural outcomes, but it included no studies that evaluated these types of outcomes (Mhurchu 2007). Despite differences in assessed outcomes between these latter three reviews and our review, all three studies found evidence to support nutritional labelling that is understandable and accessible as a means to promote healthier food choices in different consumer groups such as children, adolescents or older people (Campos 2011).
Of the nine reviews that assessed at least one type of behavioural outcome (Bleich 2017; Cantu‐Jungles 2017; Cecchini 2016; Grech 2015; Grunert 2007; Harnack 2008b; Shemilt 2017; Sinclair 2014; Swartz 2011), none had the same inclusion criteria as our review in terms of the interventions, study design or outcomes evaluated here, making comparisons between these and the current review difficult. There were also major differences between some of these reviews and ours in terms of data comparison and analysis. Unlike previous reviews, ours differentiated the impacts of nutritional labels used in different physical contexts, including vending machines, grocery stores, and cafeterias, restaurants or coffee shops. We also considered the impacts on purchasing and the impacts on consumption separately. These previous reviews assessed a range of outcomes (including 'choice', 'selection', 'foods ordered' or 'intentions') and several contexts (including real‐world settings, laboratory settings or in response to hypothetical scenarios).
The five systematic reviews we judged most similar to ours were Bleich 2017; Cantu‐Jungles 2017; Swartz 2011, Sinclair 2014, and Cecchini 2016. Swartz 2011 assessed the impact of energy labels on menus in restaurants but included only non‐RCTs. Based on a narrative synthesis of seven studies, the authors concluded that energy labelling on menus did not decrease energy purchasing or consumption. Three of the studies included in that review also met the inclusion criteria for our review. We judged them as having poor quality, and they did not present data that we could clearly interpret or use to estimate effect sizes.
Bleich 2017 assessed the effectiveness of menu labelling on calories offered, ordered, purchased, or consumed in restaurant, cafeteria, and laboratory settings. The authors concluded that the impact of menu labelling on encouraging lower calorie purchases remains unclear. This systematic review substantially differed from our review in that it included a number of types of study designs that did not meet our eligibility criteria, and it did not include a meta‐analysis or quality assessment of the included studies.
Similarly, Cantu‐Jungles 2017 examined the effect of restaurant menu labelling on calories and nutrients chosen by adults in restaurants or simulated settings. Their meta‐analysis of 14 studies showed no effect of menu labelling on calories chosen, either ordered or consumed (MD −0.21 calories (95% CI: −1.36 to 0.94). The authors did, however, report a significant difference of −115.2 calories when the meta‐analysis was restricted to studies conducted in laboratory settings. As above, this systematic review substantially differed from our review despite the authors using a modified version of our review protocol (Crockett 2011). For example, before‐and‐after controlled studies were included in the Cantu‐Jungles 2017 review which we also assessed, but that we found did not meet EPOC requirements for implementation in at least two intervention and two control sites. Moreover, this review did not report a full quality assessment of the individual studies or summarise the quality of evidence using the GRADE system. In addition, purchasing and consumption outcomes were not treated separately, as in the current review, as we considered them, a priori, to be different outcomes.
Sinclair 2014 also assessed the impact of nutritional labelling on menus. A meta‐analysis of six studies (with 24 comparisons) resulted in a significant reduction in energy consumed (MD −41 kcal (95% CI −79 to −3) compared to no intervention. These results were consistent with the effects we found in our review. Our analysis of consumption also included five out of six of the studies included in Sinclair 2014 (of the total eight studies in our meta‐analysis); the sixth study failed to meet our inclusion criteria.
Similar to our review, Cecchini 2016 aimed to assess the effectiveness of food labelling for increasing the selection of healthier products and reducing energy intake. Unlike our review, the authors included a heterogeneous range of labels, including logos such as the healthy choice tick, serving size labels, as well as labels with nutrient information (guideline daily amounts, or GDA), and a mix of outcomes including purchasing intentions, an outcome we excluded from our review due to validity concerns. Moreover, the authors excluded studies that evaluated menu labelling. Cecchini 2016 reported a significant increase in the number of people making a healthier choice and a non‐significant decrease in calorie intake. Differences in our review methods have allowed us to form stronger conclusions. For example, our search strategy retrieved seven more RCTs, despite having narrower inclusion criteria.

Examples of nutritional labels used in practice

Logic model of the process by which nutritional labelling may have an impact on diets and health

Study flow diagram

Risk of bias summary

Forest plot of comparison: Labelling on menus vs no labelling in restaurants, and energy (kcal) of food purchased

Forest plot of comparison: Labelling on menus or placed on a range of food options vs. no labelling in laboratory settings, and energy (kcal) consumed

Comparison 1: Labelling on menus vs no labelling in restaurants, Outcome 1: Energy (kcal) of food purchased

Comparison 2: Labelling on menus or placed on a range of food options vs no labelling in laboratory settings, Outcome 1: Energy (kcal) consumed during a meal

Comparison 3: Labelling on menus vs no labelling in laboratory settings (studies with a low risk of bias), Outcome 1: Energy (kcal) consumed during a meal

Comparison 4: Labelling of a single food or drink option vs no labelling in laboratory settings, Outcome 1: Energy (kcal) consumption

Comparison 5: Labelling of a single food or drink option vs no labelling in laboratory settings (studies at low risk of bias), Outcome 1: Energy (kcal) consumption

Comparison 6: Consumption in laboratory settings: subgroup analysis by dietary restraint (studies providing a range of food options), Outcome 1: Energy (kcal) consumed during a meal

Comparison 7: Consumption in laboratory settings: subgroup analysis by dietary restraint (study providing a single food option), Outcome 1: Energy (kcal) consumed during a snack

Comparison 8: Consumption in laboratory settings: subgroup analysis by study country (studies providing a range of food options), Outcome 1: Energy (kcal) consumed during a snack/meal

Comparison 9: Consumption in laboratory settings: subgroup analysis by study country (studies providing single food option), Outcome 1: Energy (kcal) consumed during a snack/meal

Comparison 10: Low fat (or energy) labelling vs no labelling on high‐energy foods, Outcome 1: Energy (kcal) consumed during a snack/meal in laboratory settings
| Nutritional labelling compared to no labelling for healthier food purchasing and consumption | ||||||
| Patient or population: university students/staff and general consumers | ||||||
| Outcomes | Anticipated absolute effects* (95% CI) | Relative effect | № of participants | Quality of the evidence | Comments | |
|---|---|---|---|---|---|---|
| Risk with no labelling | Risk with nutritional labelling | |||||
| Food purchased from vending machines | Although more beverages were purchased in the labelling group, large baseline imbalances arising from a small number of randomised units meant that an accurate effect size could not be calculated. | — | (1 RCT) | ⊕⊝⊝⊝ | Sample size unknown (population purchasing from 3 intervention and 2 control public vending machines) | |
| Food purchased from a grocery store | Sales performance decreased after labelling was introduced in this interrupted time series study, although this was difficult to interpret because results were measured as health foods as a proportion of overall foods, rather than directly measuring the number of products purchased. | — | (1 ITS study) | ⊕⊝⊝⊝ | Sample size unknown (population purchasing from a large chain of grocery stores) | |
| Food purchased in restaurants (labels on menus) assessed with: kcal | The median food purchased in restaurants was 746 kcald | MD 46.72 kcal fewer (78.35 fewer to 15.10 fewer)e | — | 1877 | ⊕⊕⊝⊝ | Six additional studies (one Q‐RCT and 5 ITS studies which took place in a restaurant, cafeterias or coffee shops) also measured purchasing, 2 of which were ITS studies at low risk of bias (which assessed energy labels on menus/menu boards in a coffee shop or cafeteria) and found results consistent with this meta‐analysis. |
| Food consumed in laboratory settings (labels on menus or labels placed on a range of food options) | The median food consumed in laboratory settings was 796.4 kcald | MD 50.27 kcal fewer (104.41 fewer to 3.88 more) | — | 1705 | ⊕⊕⊝⊝ | — |
| Food consumed in laboratory settings (single snack food or drink option) | The median food consumed in laboratory settings was 316.975 kcald | SMD 0.05 (95% CI −0.17 to 0.27), P = 0.67 | — | 732 | ⊕⊕⊝⊝ | An SMD of 0.05 represents a small effect (Cohen 1988). |
| Potential harms (high‐energy snack foods consumed with misleading low fat/energy labels in laboratory settings) | The median food consumed with misleading low fat/energy labels in laboratory settings was 190 kcald | SMD of 0.19 (95% CI −0.14to 0.51), P = 0.25 | — | 831 | ⊕⊝⊝⊝ | An SMD of 0.19 represents a small effect (Cohen 1988). |
| *The risk in the intervention group (and its 95% confidence interval) is based on the assumed risk in the comparison group and the relative effect of the intervention (and its 95% CI). | ||||||
| GRADE Working Group grades of evidence | ||||||
| aAll outcomes measuring immediate purchasing or consumption decisions at the point of exposure to the label, although returning customers in non‐laboratory settings may have experienced repeat exposure during the study period. | ||||||
| Reference and study design | Participants and Setting | Intervention/Comparison (sample sizes) | Outcome | Results | Summary effect |
|---|---|---|---|---|---|
| Cluster‐RCT | Students and employees at a university Real‐world setting | Brightly coloured '0 calories, 0 carbs' labels (n = 3 vending machines) vs no labels (n = 2 vending machines)a | Mean number of diet soda beverages (with '0 calories, 0 carbs') purchased from vending machines (weekly) | Mean 54.40 beverages (SD 16.69) vs 48.90 beverages (SD 1.84) | The methods used to analyse the data were not clearly reported and an accurate effect size and confidence intervals could not be calculated.b |
| aThe authors also evaluated another intervention ('0 calorie, 0 carbs' plus a motivational poster encouraging the purchase of water and non‐energy‐containing soft drinks) that was not eligible for inclusion in this review. | |||||
| Reference and study design | Participants and setting | Intervention/comparison (sample sizes) | Outcome | Results | Summary effect |
|---|---|---|---|---|---|
| Interrupted time series | Customers at a major grocery store chain Real‐world setting | 'Low calorie', 'diet' 'light' label on front of package vs no label (sample sizes not clear)a | Share (%) of sales of different food categories | "Regression models featuring calorie‐healthy foods consistently show [that] the relative sales performance of such items decreased after the onset of [mandatory labelling]": 'low calorie/diet/light' bottled juices = −1.538 (SE 0.191); 'light' frozen entrées = −2.601 (SE 0.373); 'light' frozen dinners = −4.507 (SE 0.963)b | Regression P values of < 0.001 indicated fewer foods with 'calorie healthy' descriptors were purchased. |
| aThe authors also evaluated 'vitamin C fortified' bottled juices, 'plus calcium/calcium added' juices, and 'low fat/reduced fat/fat free' cheese and cookies. These data were not eligible for inclusion in this review. | |||||
| Reference and study design | Participants and setting | Intervention/comparison (sample sizes) | Outcome | Results | Summary effect |
|---|---|---|---|---|---|
| Q‐RCT | Coffee shop customers at academic hospital Real‐world setting | Energy content of all food and drinks available on point of purchase signs vs. no information (N = 20,516 items purchased) | Proportion of high energy food and drinks purchased (as a percentage of total drinks and snacks sold) | The proportion of high energy snacks purchased was 41% in the intervention and 45% the control group (P = 0.04); the proportion of high energy drinks purchased was 46% in the intervention group and 50% in the control group (P = 0.15). | Effect size and confidence intervals could not be calculated. |
| Interrupted time series | Coffee shop customers Real‐world setting | Energy content on menu and menu boards vs no information (N = 118,480 transactions reported) | Mean kcal of food and drinks purchased per transaction | "Estimates of the effect of calorie posting (calories per transaction): log (beverages and food) = −0.060 (0.001)a–representing a ... decrease in average calories per transaction, equivalent to 14.4 calories" | Regression P value < 0.01 |
| Interrupted time series | Customers at a university dining centre Real‐world setting | Nutrition facts information on menu board (N = 14,199 entrées sold) vs no label (pre‐intervention: N = 13,951 entrées sold; post‐intervention N = 14,020 entrées sold) | Mean kcal content of entrées purchased per day | Mean energy content of entrées sold at start of the pre‐intervention period: 646.5 kcal with a slope of 0.094 kcal per day. The difference in energy content of entrées sold between the pre‐treatment last day and treatment first day was −12.4 kcal (P = 0.007). Following this reduction, the difference in slope pre‐intervention to intervention was −0.298 kcal per day, and the difference in slope intervention to post‐intervention was 1.512 kcal per day. This means that the average energy content of entrées purchased reduced immediately after the intervention, and gradually increased when the intervention was removed. | Regression P values were 0.56 (pre‐intervention to intervention slope), and 0.013 (intervention to post‐intervention slope). |
| Interrupted time series | Customers at a university dining centre Real‐world setting | Nutrition facts label on pre‐packaged meals and snacks vs no label (sample sizes not reported) | Mean kcal purchased per week from meals and snacks | "Mean [energy] purchased decreased significantly across the 3 [time points] of the pre‐labelling period. However, no such trend was observed in the post‐labelling period." (data compared over 3 time points)."After labelling, the mean energy content of the items purchased per week decreased significantly from 476.2 (SD 8.7) kcals to 445.3 (SD 8.1) kcals per week (p<0.001)." | A statistical comparison of time trends (i.e. slope) before and after the intervention was not reported, so that the overall effectiveness of the intervention is not clear. |
| Interrupted time series | Customers at a public cafeteria Real‐world setting | 'Lower calorie' label on green paper with a red dot on right‐hand corner beside food item vs no label (sample sizes of foods purchased is not clear) | Probability of choosing low energy entrées, vegetables, or salads | "The probability of choosing a low [energy] entrée did not differ from baseline." The probability of purchasing lower‐energy vegetables and salads significantly increased compared to the no label baseline conditions (P < 0.001). | A statistical comparison of time trends before and after the intervention was not clearly reported, so that the overall effectiveness of the intervention is not clear. |
| RCT | Customers at a restaurant Real‐world setting | 1. Energy content on menu (n = 54) 2. Menu with energy content using traffic light format (n = 54) 3. No label (n = 30) | Mean kcal purchased per meal (including entrées, desserts and drinks) | 756.5 kcal (SD 338.5)b vs 765 kcal (SD 368.0) | MD −8.50 kcal (95% CI −154.85 to 137.85) |
| RCT | Customers at a restaurant Real‐world setting | 1. Energy content on menu (n = 469) 2. Menu with energy content using traffic light format (n = 591) 3. No label (n = 472) | Mean kcal purchased per meal (entrées only) | 705.6 kcal (SD 334.7)c vs. 746 kcal (SD 368.0) | MD −40.38 kcal (95% CI −79.21 to −1.55) |
| Interrupted time series | Families at a restaurant Real‐world setting | Children's menu with energy and fat content label vs no label (N = 1275 meals)d | Mean kcal purchased per meal | "The calorie and fat menu had the biggest change in calories compared to the control menu (−9.54), but it was not significant." | A statistical comparison of time trends before and after the intervention was not reported, so that the overall effectiveness of the intervention is not clear. |
| RCT | Employees at large company buying lunch online Real‐world setting | 1. Energy content on menu (n = 38) 2. Menu with energy content using traffic light format (n = 46) 3. No label (n = 123)e | Mean kcal purchased per meal | 537.9 kcal (SD 203.9)f vs. 605.3 kcal (SD 222.5) | MD −67.38 kcal (95% CI −126.09 to −8.66) |
| aAccounting for effects of week, day of week and weather. | |||||
| Reference and study design | Participants and setting | Intervention/comparison (sample sizes) | Outcome | Results | Summary effect |
|---|---|---|---|---|---|
| Labelling on menus or placed on a range of food options on energy consumed during a meal | |||||
| RCT | University students Experimental (laboratory) study at a university | Energy content on menu plus information on recommended daily energy intake for women and men (n = 60) vs no label (n = 66)a | Mean kcal consumed during a meal (salad and pasta) | 608.2 kcal (SD 350.8)b vs 631.3 kcal (SD 324.0) | MD −23.02 kcal (95% CI −141.28 to 95.24) |
| RCT | University students Experimental (laboratory) study at a university | Energy content on menu (n = 24) vs no label (n = 25) | Mean kcal consumed during a meal | 433.1 kcal (SD 260.2) vs 426.5 kcal (SD 237.4)c | MD 6.60 kcal (95% CI −133.02 to 146.22) |
| RCT | Adults Experimental (laboratory) study at a university | 1. Energy content on menu (n = 165) 2. Menu with energy content using a traffic light format (n = 156) 3. Menu with energy, fat, salt, and sugar content using traffic light format (n = 152) vs no label (n = 162) | Mean kcal consumed during a fast food meal | 761.6 kcal (SD 348.9)d vs 839.6 kcal (SD 318.8) | MD −78.00 kcal (95% CI −136.29 to −19.70) |
| RCT | Adolescents and adults Experimental study conducted in hotel conference rooms/church hall | Energy content on menu plus information on recommended daily energy intake for women and men (n = 151) vs no label (n = 150)e | Mean kcal consumed during a fast food meal | 804.7 kcal (SD 423.9) vs 739.0 kcal (SD 358.2) | MD 65.70 kcal (95% CI −22.94 to 154.34) |
| RCT | Adults, including university students Experimental study at a university | Energy content on menu plus information on recommended daily energy intake for women and men (n = 99) vs no label (n = 99)f | Mean kcal consumed during a meal | 722.0 kcal (SD 271.6)g vs 770.0 (SD 269.1) | MD −48.00 kcal (95% CI −123.31 to 27.31) |
| RCT | Female university students Experimental (laboratory) study at a university | 1. Energy content on menu (n = 20) 2. Menu with energy content and exercise equivalents (n = 20) vs no label (n = 22) | Mean kcal consumed during a fast food meal | 870.1 kcal (SD 375.9)h vs 995.4 (SD 429.4) | MD −125.33 kcal (95% CI −339.26 to 88.59) |
| RCT | Adults from the community Experimental (classroom) study at a university | 1. Energy content on menu (n = 92) 2. Menu with energy content plus information on recommended daily intake (n = 103) vs no label (n = 92) | Mean kcal consumed during a meal | 1293.3 kcal (SD 656.8)i vs 1458.9 kcal (SD 724.6) | MD −165.58 kcal (95% CI −340.01 to 8.84) |
| RCT | Adults Experimental (laboratory) study at a university | Nutrition facts label on foods (n = 23) vs no label (n = 24) | Mean kcal consumed during a meal | 620.4 kcal (SD 203.6) vs 822.8 kcal (SD 408.7)j | MD −202.40 kcal (SD −385.86 to −18.94) |
| Labelling of a single food or drink option on energy consumed during a snack or meal | |||||
| RCT | Female university students Experimental (laboratory) study at a university | Energy label on chocolate cookie (130 kcal) (n = 62) vs no label (n = 62)k | Mean grams consumed from snack of chocolate chip cookies | 45.1 g (SD 21.50) vs 33.1 g (SD 21.57)l | SMD 0.55 (95% CI 0.19 to 0.91) |
| RCT | Adults Experimental study at a cinema | Red 'high fat' label on side of popcorn container (n = 96) vs no label (n = 88)m | Mean kcal consumed from snack of toffee or salted popcorn (high‐fat snack) | 413.5 kcal (SD 307.6)n vs 468.1 kcal (SD 361.9) | SMD −0.16 (95% CI −0.45 to 0.13) |
| RCT | Female university students Experimental study at a university | Energy label ('new colours of regular M&M's, 240 calories per serving"') on glass container containing M&M's (n = 41) vs no energy content label ('new colours of regular M&M's') (n = 38)o | Mean kcal consumed during snack of M&M's (high‐fat snack) | 157.2 kcal (SD 98.5) vs165.9 kcal (SD 141.5) | SMD −0.07 (95% CI −0.51 to 0.37) |
| Q‐RCT | Females Experimental (laboratory) study at a university | Energy label plus 'colour‐coded' information on level of energy density on an entrée (n = 20) vs no label (n = 20) | Mean kcal consumed from an entrée at breakfast, lunch and dinner | 1534.0 kcal (SD 451.7) vs 1569.0 kcal (SD 335.4) | SMD −0.09 (95% CI −0.71 to 0.53) |
| RCT | Adults Experimental (laboratory) study at a university | 1. Smart choices label on cereal box (n = 76 analysed) 2. Modified smart choices label (n = 71) vs no label (n = 69) | Mean grams of high‐sugar breakfast cereal and milk consumed | 225.7 g (SD 138.2)p vs 219.9 g (SD 127.1) | SMD 0.04 (95% CI −0.24 to 0.33) |
| Q‐RCT | Adults Experimental study at a cinema | Portion size and energy content label (display board) (n = 48) vs no label (n = 41) | Mean millilitres of soft drink consumed | 376.3 mL (SD 125.4) vs 382.14 mL (SD 147.6)q | SMD −0.04 (95% CI−0.46 to 0.37) |
| aTwo other interventions were combined by the study authors as a 'calorie only' intervention (400 kcal salad and 1200 kcal pasta, and 1200 kcal salad and 400 kcal pasta (although both salad and pasta contained 1200 kcal)). We did not include this data in the above analysis as it involved mislabelling some of the foods (data were not reported separately for consumption of foods that were accurately labelled). | |||||
| Reference and study design | Participants and setting | Intervention/comparison (sample sizes) | Outcome | Results | Summary effect |
|---|---|---|---|---|---|
| RCT | Adults Experimental study at a cinema | Green 'low fat' label on side of container containing high‐fat popcorn (n = 103) vs no label (n = 88) | Mean kcal consumed from snack of popcorn | 402.44 kcal (SD 288.68) vs 468.07 kcal (SD 361.93) | SMD −0.20 (95% CI −0.48 to 0.08) |
| RCT | Female university students Experimental study at a university | Low fat label ('new low fat M&M's') on glass container containing M&M's (n = 49) vs no energy information label ('new colours of regular M&M's') (n = 38) | Mean kcal consumed during snack of M&M's | 192.34 kcal (SD 145.53) vs165.88 kcal (SD 141.5) | SMD 0.18 (95% CI−0.25 to 0.61) |
| RCT | Female university students Experimental (laboratory) study at a university | Lower energy label (600 kcal) on high‐energy salad and pasta (actually 1200 kcal) (n = 56) vs no label (n = 49)a | Mean kcal consumed during a meal (salad and pasta) | 400.26 kcal (SD 199.8) vs 420.19 kcal (SD 233.69) | SMD −0.09 (95% CI −0.47 to 0.29) |
| Q‐RCT | Students and their families Experimental study at a university | Low fat label ('new low fat M&M's') on glass container containing M&M's vs no energy information label ('new colours of regular M&M's') (n = 269 overall (n by group not reported)) | Mean kcal consumed from snack of M&M's | Mean 244 kcal (SD not reported) vs 190 kcal (SD not reported) | SMD 0.44 (95% CI 0.20 to 0.68)b |
| Q‐RCT | University staff, graduates and undergraduates Experimental study at a university | Low fat label ('Low‐Fat Rocky Mountain Granola') on zip lock bag vs no label ('Regular Rocky Mountain Granola') (n = 66 overall (n by group not reported)) | Mean kcal consumed from snack of granola | Mean 249 kcal (SD not reported) vs 165 kcal (SD not reported) | SMD 0.69 (95% CI 0.20 to 1.18)c |
| aData were extracted for those who chose pasta or salad when it was inaccurately as '600 calories'. | |||||
| Outcome or subgroup title | No. of studies | No. of participants | Statistical method | Effect size |
| 1.1 Energy (kcal) of food purchased Show forest plot | 3 | 1877 | Mean Difference (IV, Random, 95% CI) | ‐46.72 [‐78.35, ‐15.10] |
| Outcome or subgroup title | No. of studies | No. of participants | Statistical method | Effect size |
| 2.1 Energy (kcal) consumed during a meal Show forest plot | 8 | 1705 | Mean Difference (IV, Random, 95% CI) | ‐50.27 [‐104.41, 3.88] |
| Outcome or subgroup title | No. of studies | No. of participants | Statistical method | Effect size |
| 3.1 Energy (kcal) consumed during a meal Show forest plot | 3 | 547 | Mean Difference (IV, Random, 95% CI) | ‐72.04 [‐137.84, ‐6.25] |
| Outcome or subgroup title | No. of studies | No. of participants | Statistical method | Effect size |
| 4.1 Energy (kcal) consumption Show forest plot | 6 | 732 | Std. Mean Difference (IV, Random, 95% CI) | 0.05 [‐0.17, 0.27] |
| Outcome or subgroup title | No. of studies | No. of participants | Statistical method | Effect size |
| 5.1 Energy (kcal) consumption Show forest plot | 2 | 400 | Std. Mean Difference (IV, Random, 95% CI) | ‐0.06 [‐0.26, 0.15] |
| Outcome or subgroup title | No. of studies | No. of participants | Statistical method | Effect size |
| 6.1 Energy (kcal) consumed during a meal Show forest plot | 2 | 267 | Mean Difference (IV, Random, 95% CI) | 15.48 [‐20.08, 51.04] |
| 6.1.1 Restrained eaters | 2 | 129 | Mean Difference (IV, Random, 95% CI) | 20.87 [‐37.44, 79.18] |
| 6.1.2 Unrestrained eaters | 2 | 138 | Mean Difference (IV, Random, 95% CI) | 10.98 [‐38.85, 60.81] |
| Outcome or subgroup title | No. of studies | No. of participants | Statistical method | Effect size |
| 7.1 Energy (kcal) consumed during a snack Show forest plot | 1 | Std. Mean Difference (IV, Random, 95% CI) | ‐0.17 [‐0.63, 0.28] | |
| 7.1.1 Restrained eaters | 1 | Std. Mean Difference (IV, Random, 95% CI) | ‐0.44 [‐0.94, 0.05] | |
| 7.1.2 Urestrained eaters | 1 | Std. Mean Difference (IV, Random, 95% CI) | 0.03 [‐0.34, 0.39] | |
| Outcome or subgroup title | No. of studies | No. of participants | Statistical method | Effect size |
| 8.1 Energy (kcal) consumed during a snack/meal Show forest plot | 8 | 1705 | Mean Difference (IV, Random, 95% CI) | ‐50.28 [‐104.42, 3.87] |
| 8.1.1 Studies conducted in the USA | 5 | 895 | Mean Difference (IV, Random, 95% CI) | ‐70.57 [‐167.65, 26.52] |
| 8.1.2 Studies conducted in other countries | 3 | 810 | Mean Difference (IV, Random, 95% CI) | ‐58.18 [‐107.15, ‐9.21] |
| Outcome or subgroup title | No. of studies | No. of participants | Statistical method | Effect size |
| 9.1 Energy (kcal) consumed during a snack/meal Show forest plot | 6 | 732 | Std. Mean Difference (IV, Random, 95% CI) | 0.05 [‐0.17, 0.27] |
| 9.1.1 Studies conducted in the USA | 4 | 459 | Std. Mean Difference (IV, Random, 95% CI) | 0.14 [‐0.17, 0.45] |
| 9.1.2 Studies conducted in other countries | 2 | 273 | Std. Mean Difference (IV, Random, 95% CI) | ‐0.12 [‐0.36, 0.11] |
| Outcome or subgroup title | No. of studies | No. of participants | Statistical method | Effect size |
| 10.1 Energy (kcal) consumed during a snack/meal in laboratory settings Show forest plot | 5 | 718 | Std. Mean Difference (IV, Random, 95% CI) | 0.19 [‐0.14, 0.51] |