| 1 Operative delivery Show forest plot | 1 | 30 | Risk Ratio (M‐H, Fixed, 95% CI) | 1.08 [0.79, 1.49] |
|
| 2 Maternal mortality Show forest plot | 1 | 30 | Risk Ratio (M‐H, Fixed, 95% CI) | 0.0 [0.0, 0.0] |
|
| 3 Perinatal mortality Show forest plot | 1 | 30 | Risk Ratio (M‐H, Fixed, 95% CI) | 0.0 [0.0, 0.0] |
|
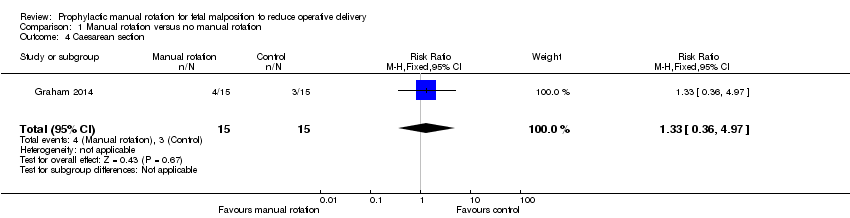
| 4 Caesarean section Show forest plot | 1 | 30 | Risk Ratio (M‐H, Fixed, 95% CI) | 1.33 [0.36, 4.97] |
|
| 5 Forceps delivery Show forest plot | 1 | 30 | Risk Ratio (M‐H, Fixed, 95% CI) | 0.75 [0.20, 2.79] |
|
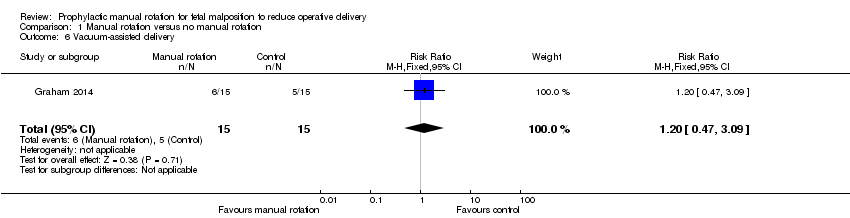
| 6 Vacuum‐assisted delivery Show forest plot | 1 | 30 | Risk Ratio (M‐H, Fixed, 95% CI) | 1.2 [0.47, 3.09] |
|
| 7 Third‐ or fourth‐degree perineal trauma Show forest plot | 1 | 30 | Risk Ratio (M‐H, Fixed, 95% CI) | 0.2 [0.01, 3.85] |
|
| 8 Nitrous oxide analgesia in labour Show forest plot | 1 | 30 | Risk Ratio (M‐H, Fixed, 95% CI) | 0.73 [0.41, 1.28] |
|
| 9 Opiate analgesia in labour Show forest plot | 1 | 30 | Risk Ratio (M‐H, Fixed, 95% CI) | 1.0 [0.24, 4.18] |
|
| 10 Epidural analgesia in labour Show forest plot | 1 | 30 | Risk Ratio (M‐H, Fixed, 95% CI) | 1.17 [0.88, 1.55] |
|
| 11 Duration of second stage of labour Show forest plot | 1 | 30 | Mean Difference (IV, Fixed, 95% CI) | ‐5.70 [‐58.34, 46.94] |
|
| 12 Blood loss (mL) Show forest plot | 1 | 30 | Mean Difference (IV, Fixed, 95% CI) | 109.30 [‐78.51, 297.11] |
|
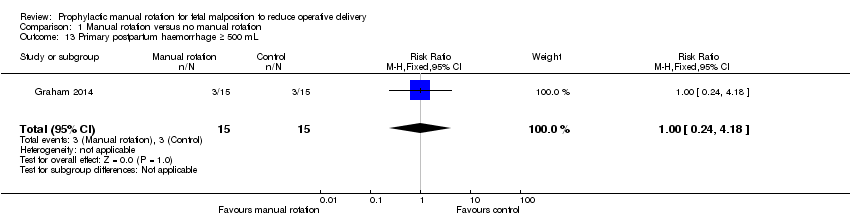
| 13 Primary postpartum haemorrhage ≥ 500 mL Show forest plot | 1 | 30 | Risk Ratio (M‐H, Fixed, 95% CI) | 1.0 [0.24, 4.18] |
|
| 14 Maternal blood transfusion Show forest plot | 1 | 30 | Risk Ratio (M‐H, Fixed, 95% CI) | 0.0 [0.0, 0.0] |
|
| 15 Maternal postnatal infection Show forest plot | 1 | 30 | Risk Ratio (M‐H, Fixed, 95% CI) | 0.0 [0.0, 0.0] |
|
| 16 Length of maternal hospital stay (days) Show forest plot | 1 | 30 | Mean Difference (IV, Fixed, 95% CI) | 0.84 [‐0.04, 1.72] |
|
| 17 Non‐reassuring or pathological cardiotocograph during procedure Show forest plot | 1 | 30 | Risk Ratio (M‐H, Fixed, 95% CI) | 3.0 [0.13, 68.26] |
|
| 18 Non‐reassuring or pathological cardiotocograph at any time after allocation Show forest plot | 1 | 30 | Risk Ratio (M‐H, Fixed, 95% CI) | 0.57 [0.21, 1.55] |
|
| 19 Cord blood gas acidosis Show forest plot | 1 | 23 | Risk Ratio (M‐H, Fixed, 95% CI) | 1.83 [0.19, 17.51] |
|
| 20 Admission to neonatal intensive care unit Show forest plot | 1 | 30 | Risk Ratio (M‐H, Fixed, 95% CI) | 2.0 [0.61, 6.55] |
|
| 21 Neonatal resuscitation (positive pressure ventilation, cardiac compression or drug therapy) Show forest plot | 1 | 30 | Risk Ratio (M‐H, Fixed, 95% CI) | 1.0 [0.31, 3.28] |
|
| 22 Mechanical ventilation (intermittent positive‐pressure ventilation/continuous positive airways pressure after resuscitation) Show forest plot | 1 | 30 | Risk Ratio (M‐H, Fixed, 95% CI) | 3.0 [0.35, 25.68] |
|
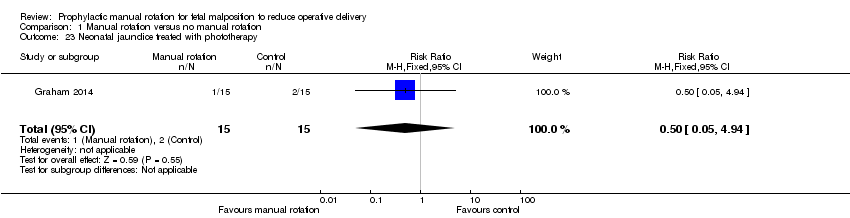
| 23 Neonatal jaundice treated with phototherapy Show forest plot | 1 | 30 | Risk Ratio (M‐H, Fixed, 95% CI) | 0.5 [0.05, 4.94] |
|
| 24 Neonatal exchange transfusion Show forest plot | 1 | 30 | Risk Ratio (M‐H, Fixed, 95% CI) | 0.0 [0.0, 0.0] |
|
| 25 Polycythaemia treated with partial volume exchange transfusion Show forest plot | 1 | 30 | Risk Ratio (M‐H, Fixed, 95% CI) | 0.0 [0.0, 0.0] |
|
| 26 Neonatal stroke Show forest plot | 1 | 30 | Risk Ratio (M‐H, Fixed, 95% CI) | 0.0 [0.0, 0.0] |
|
| 27 Neonatal intracranial bleed Show forest plot | 1 | 30 | Risk Ratio (M‐H, Fixed, 95% CI) | 0.0 [0.0, 0.0] |
|
| 28 Neonatal fracture Show forest plot | 1 | 30 | Risk Ratio (M‐H, Fixed, 95% CI) | 0.0 [0.0, 0.0] |
|
| 29 Scalp haematoma (e.g. cephalohaematoma or subgaleal haemorrhage) Show forest plot | 1 | 30 | Risk Ratio (M‐H, Fixed, 95% CI) | 3.0 [0.13, 68.26] |
|
| 30 Neonatal encephalopathy Show forest plot | 1 | 30 | Risk Ratio (M‐H, Fixed, 95% CI) | 0.0 [0.0, 0.0] |
|
| 31 Neonatal neuropraxia Show forest plot | 1 | 30 | Risk Ratio (M‐H, Fixed, 95% CI) | 0.0 [0.0, 0.0] |
|