Ručno okretanje loše položenog djeteta kao prevencija pri smanjenju operativnog ishoda poroda
Referencias
References to studies included in this review
References to ongoing studies
Additional references
Characteristics of studies
Characteristics of included studies [ordered by study ID]
Ir a:
| Methods | Randomised blinded, parallel arm controlled trial. | |
| Participants | Setting and population: 30 women from a tertiary referral hospital in Australia, with cephalic, singleton pregnancies. 15 women were randomised to each arm (intervention and control). Inclusion criteria: women who had completed 37 weeks of gestation with a cephalic singleton pregnancy, planned a vaginal delivery, had a cervix at full dilatation with an OP position of the fetal head confirmed by a mobile transabdominal ultrasound scan, aged > 16 years old and had given written informed consent. A vaginal examination at full dilatation was performed. A bedside mobile ultrasound scan was performed to confirm fetal head position by the labour ward registrar or consultant. If the position was OP, a study investigator performed either the manual rotation or sham procedure. Fetal OP position was established by obtaining a transverse view of the fetal orbits. OP was defined as fetal occiput within 45 degrees of the midline. At the first urge to push or 1 hour after full dilatation (whichever came first), the study investigator repeated the bedside ultrasound and if the OP position persisted, randomised the participant to either the control or intervention arm of the study. Exclusion criteria: clinical suspicion of cephalo‐pelvic disproportion, a history of previous uterine surgery (caesarean section, open myomectomy), a brow or face presentation, a pathologic CTG according to the RCOG guidelines plus either abnormal baseline or reduced variability for more than 90 minutes, suspected fetal compromise, an anatomical fetal abnormality, suspected or known chorioamnionitis, any condition requiring immediate delivery, any condition requiring an elective caesarean section, an intrapartum haemorrhage > 50 mL, a temperature more than 38.4 °C in the first stage of labour or a suspected fetal bleeding diathesis. | |
| Interventions | Intervention: manual rotation using the digital technique, with the operator's fingers placed along the lambdoid sutures and rotating the posterior fontanelle towards the pubic symphysis during contractions with maternal expulsive efforts over 3 contractions. The fetal occiput was then held in the OA position for a further 1 or 2 contractions. Control: sham manual rotation that involved a vaginal examination over 4 or 5 contractions during which the attending midwife was asked not to observe. | |
| Outcomes | Primary outcomes: operative delivery (defined as caesarean, forceps or vacuum delivery), and the feasibility of running a large trial. Other outcomes: duration of the second stage of labour, the time between intervention and delivery, degree of perineal trauma, incidence of postpartum haemorrhage (estimated blood loss > 500 mL), cervical laceration, cord prolapse, admission to the NICU, perinatal mortality and serious neonatal morbidity. Neonatal outcomes: birthweight, sex of the infant, 5‐minute Apgar score, cord umbilical artery lactate at delivery, neonatal trauma and admissions to the NICU Study investigator used a repeat mobile transabdominal ultrasound, blinded to the treating clinicians, to confirm and record the final position of the fetal occiput. Digital rotation was considered to be successful if the fetal occiput was OA and within 45 degrees of the midline. | |
| Notes | ||
| Risk of bias | ||
| Bias | Authors' judgement | Support for judgement |
| Random sequence generation (selection bias) | Low risk | Randomisation was performed using computer‐generated random sized blocks with variable block sizes of 4, 6 or 8. |
| Allocation concealment (selection bias) | Low risk | Women were consented, enrolled and then randomised. Treatment allocations were placed into opaque, sequentially numbered, sealed envelopes stratified by parity (nulliparous or multiparous). |
| Blinding of participants and personnel (performance bias) | Unclear risk | Women in the control group underwent a sham manual rotation that involved a vaginal examination over 4 or 5 contractions during which the attending midwife was asked not to observe. However, it is unclear how effective the blinding was (author communication). |
| Blinding of outcome assessment (detection bias) | Low risk | Data collection performed blind to intervention allocation by independent researcher. |
| Incomplete outcome data (attrition bias) | Low risk | No losses reported. |
| Selective reporting (reporting bias) | Low risk | Pre‐specified outcomes. |
| Other bias | Unclear risk | No statistically significant baseline imbalances. Clinical baseline difference in thick meconium‐stained liquor (manual rotation 40% vs. sham 7%; P value = 0.08). |
CTG: cardiotocograph; NICU: neonatal intensive care unit; OA: occiput anterior; OP: occiput posterior; RCOG: Royal College of Gynaecologists.
Characteristics of ongoing studies [ordered by study ID]
Ir a:
| Trial name or title | Does Manual Rotation of the Occiput Posterior Fetus during the Second Stage of Labour Increase the Likelihood of Vaginal Birth? |
| Methods | Double‐blind randomised controlled trial ‐ pilot study |
| Participants | Women with a singleton term pregnancy with a cephalic presentation and in OP position (on ultrasound) at full dilatation |
| Interventions | Eligible women were randomised to receive either a real or a 'sham' manual rotation by an independent investigator, such that both the woman and the labour ward care providers were blinded to the randomisation result. The procedure was performed either 1 hour after full dilatation was diagnosed or with onset of maternal urge to push, whichever occurred first |
| Outcomes | Primary outcomes: operative delivery (caesarean section, forceps‐assisted vaginal delivery or vacuum extraction) |
| Starting date | December 2010 and December 2011 |
| Contact information | Ms Hala Phipps, Research Midwife, RPA Women and Babies, Royal Prince Alfred Hospital, Camperdown, NSW, Australia Email: [email protected] |
| Notes |
OP: occiput posterior.
Data and analyses
| Outcome or subgroup title | No. of studies | No. of participants | Statistical method | Effect size |
| 1 Operative delivery Show forest plot | 1 | 30 | Risk Ratio (M‐H, Fixed, 95% CI) | 1.08 [0.79, 1.49] |
| Analysis 1.1  Comparison 1 Manual rotation versus no manual rotation, Outcome 1 Operative delivery. | ||||
| 2 Maternal mortality Show forest plot | 1 | 30 | Risk Ratio (M‐H, Fixed, 95% CI) | 0.0 [0.0, 0.0] |
| Analysis 1.2  Comparison 1 Manual rotation versus no manual rotation, Outcome 2 Maternal mortality. | ||||
| 3 Perinatal mortality Show forest plot | 1 | 30 | Risk Ratio (M‐H, Fixed, 95% CI) | 0.0 [0.0, 0.0] |
| Analysis 1.3  Comparison 1 Manual rotation versus no manual rotation, Outcome 3 Perinatal mortality. | ||||
| 4 Caesarean section Show forest plot | 1 | 30 | Risk Ratio (M‐H, Fixed, 95% CI) | 1.33 [0.36, 4.97] |
| Analysis 1.4  Comparison 1 Manual rotation versus no manual rotation, Outcome 4 Caesarean section. | ||||
| 5 Forceps delivery Show forest plot | 1 | 30 | Risk Ratio (M‐H, Fixed, 95% CI) | 0.75 [0.20, 2.79] |
| Analysis 1.5  Comparison 1 Manual rotation versus no manual rotation, Outcome 5 Forceps delivery. | ||||
| 6 Vacuum‐assisted delivery Show forest plot | 1 | 30 | Risk Ratio (M‐H, Fixed, 95% CI) | 1.2 [0.47, 3.09] |
| Analysis 1.6 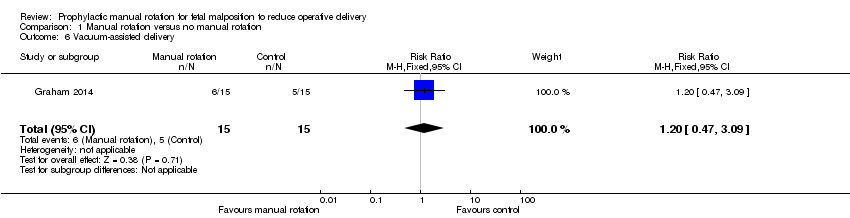 Comparison 1 Manual rotation versus no manual rotation, Outcome 6 Vacuum‐assisted delivery. | ||||
| 7 Third‐ or fourth‐degree perineal trauma Show forest plot | 1 | 30 | Risk Ratio (M‐H, Fixed, 95% CI) | 0.2 [0.01, 3.85] |
| Analysis 1.7  Comparison 1 Manual rotation versus no manual rotation, Outcome 7 Third‐ or fourth‐degree perineal trauma. | ||||
| 8 Nitrous oxide analgesia in labour Show forest plot | 1 | 30 | Risk Ratio (M‐H, Fixed, 95% CI) | 0.73 [0.41, 1.28] |
| Analysis 1.8 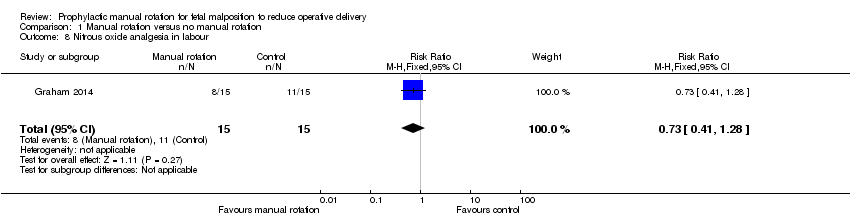 Comparison 1 Manual rotation versus no manual rotation, Outcome 8 Nitrous oxide analgesia in labour. | ||||
| 9 Opiate analgesia in labour Show forest plot | 1 | 30 | Risk Ratio (M‐H, Fixed, 95% CI) | 1.0 [0.24, 4.18] |
| Analysis 1.9  Comparison 1 Manual rotation versus no manual rotation, Outcome 9 Opiate analgesia in labour. | ||||
| 10 Epidural analgesia in labour Show forest plot | 1 | 30 | Risk Ratio (M‐H, Fixed, 95% CI) | 1.17 [0.88, 1.55] |
| Analysis 1.10  Comparison 1 Manual rotation versus no manual rotation, Outcome 10 Epidural analgesia in labour. | ||||
| 11 Duration of second stage of labour Show forest plot | 1 | 30 | Mean Difference (IV, Fixed, 95% CI) | ‐5.70 [‐58.34, 46.94] |
| Analysis 1.11  Comparison 1 Manual rotation versus no manual rotation, Outcome 11 Duration of second stage of labour. | ||||
| 12 Blood loss (mL) Show forest plot | 1 | 30 | Mean Difference (IV, Fixed, 95% CI) | 109.30 [‐78.51, 297.11] |
| Analysis 1.12  Comparison 1 Manual rotation versus no manual rotation, Outcome 12 Blood loss (mL). | ||||
| 13 Primary postpartum haemorrhage ≥ 500 mL Show forest plot | 1 | 30 | Risk Ratio (M‐H, Fixed, 95% CI) | 1.0 [0.24, 4.18] |
| Analysis 1.13  Comparison 1 Manual rotation versus no manual rotation, Outcome 13 Primary postpartum haemorrhage ≥ 500 mL. | ||||
| 14 Maternal blood transfusion Show forest plot | 1 | 30 | Risk Ratio (M‐H, Fixed, 95% CI) | 0.0 [0.0, 0.0] |
| Analysis 1.14  Comparison 1 Manual rotation versus no manual rotation, Outcome 14 Maternal blood transfusion. | ||||
| 15 Maternal postnatal infection Show forest plot | 1 | 30 | Risk Ratio (M‐H, Fixed, 95% CI) | 0.0 [0.0, 0.0] |
| Analysis 1.15  Comparison 1 Manual rotation versus no manual rotation, Outcome 15 Maternal postnatal infection. | ||||
| 16 Length of maternal hospital stay (days) Show forest plot | 1 | 30 | Mean Difference (IV, Fixed, 95% CI) | 0.84 [‐0.04, 1.72] |
| Analysis 1.16  Comparison 1 Manual rotation versus no manual rotation, Outcome 16 Length of maternal hospital stay (days). | ||||
| 17 Non‐reassuring or pathological cardiotocograph during procedure Show forest plot | 1 | 30 | Risk Ratio (M‐H, Fixed, 95% CI) | 3.0 [0.13, 68.26] |
| Analysis 1.17  Comparison 1 Manual rotation versus no manual rotation, Outcome 17 Non‐reassuring or pathological cardiotocograph during procedure. | ||||
| 18 Non‐reassuring or pathological cardiotocograph at any time after allocation Show forest plot | 1 | 30 | Risk Ratio (M‐H, Fixed, 95% CI) | 0.57 [0.21, 1.55] |
| Analysis 1.18  Comparison 1 Manual rotation versus no manual rotation, Outcome 18 Non‐reassuring or pathological cardiotocograph at any time after allocation. | ||||
| 19 Cord blood gas acidosis Show forest plot | 1 | 23 | Risk Ratio (M‐H, Fixed, 95% CI) | 1.83 [0.19, 17.51] |
| Analysis 1.19  Comparison 1 Manual rotation versus no manual rotation, Outcome 19 Cord blood gas acidosis. | ||||
| 20 Admission to neonatal intensive care unit Show forest plot | 1 | 30 | Risk Ratio (M‐H, Fixed, 95% CI) | 2.0 [0.61, 6.55] |
| Analysis 1.20  Comparison 1 Manual rotation versus no manual rotation, Outcome 20 Admission to neonatal intensive care unit. | ||||
| 21 Neonatal resuscitation (positive pressure ventilation, cardiac compression or drug therapy) Show forest plot | 1 | 30 | Risk Ratio (M‐H, Fixed, 95% CI) | 1.0 [0.31, 3.28] |
| Analysis 1.21  Comparison 1 Manual rotation versus no manual rotation, Outcome 21 Neonatal resuscitation (positive pressure ventilation, cardiac compression or drug therapy). | ||||
| 22 Mechanical ventilation (intermittent positive‐pressure ventilation/continuous positive airways pressure after resuscitation) Show forest plot | 1 | 30 | Risk Ratio (M‐H, Fixed, 95% CI) | 3.0 [0.35, 25.68] |
| Analysis 1.22  Comparison 1 Manual rotation versus no manual rotation, Outcome 22 Mechanical ventilation (intermittent positive‐pressure ventilation/continuous positive airways pressure after resuscitation). | ||||
| 23 Neonatal jaundice treated with phototherapy Show forest plot | 1 | 30 | Risk Ratio (M‐H, Fixed, 95% CI) | 0.5 [0.05, 4.94] |
| Analysis 1.23  Comparison 1 Manual rotation versus no manual rotation, Outcome 23 Neonatal jaundice treated with phototherapy. | ||||
| 24 Neonatal exchange transfusion Show forest plot | 1 | 30 | Risk Ratio (M‐H, Fixed, 95% CI) | 0.0 [0.0, 0.0] |
| Analysis 1.24  Comparison 1 Manual rotation versus no manual rotation, Outcome 24 Neonatal exchange transfusion. | ||||
| 25 Polycythaemia treated with partial volume exchange transfusion Show forest plot | 1 | 30 | Risk Ratio (M‐H, Fixed, 95% CI) | 0.0 [0.0, 0.0] |
| Analysis 1.25  Comparison 1 Manual rotation versus no manual rotation, Outcome 25 Polycythaemia treated with partial volume exchange transfusion. | ||||
| 26 Neonatal stroke Show forest plot | 1 | 30 | Risk Ratio (M‐H, Fixed, 95% CI) | 0.0 [0.0, 0.0] |
| Analysis 1.26 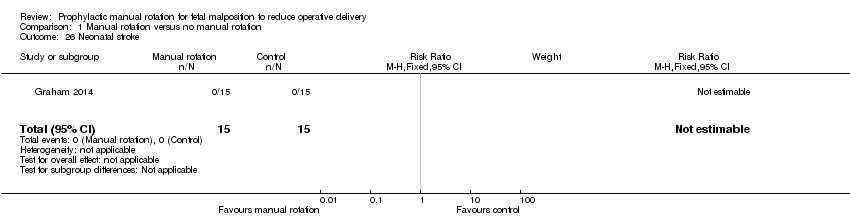 Comparison 1 Manual rotation versus no manual rotation, Outcome 26 Neonatal stroke. | ||||
| 27 Neonatal intracranial bleed Show forest plot | 1 | 30 | Risk Ratio (M‐H, Fixed, 95% CI) | 0.0 [0.0, 0.0] |
| Analysis 1.27  Comparison 1 Manual rotation versus no manual rotation, Outcome 27 Neonatal intracranial bleed. | ||||
| 28 Neonatal fracture Show forest plot | 1 | 30 | Risk Ratio (M‐H, Fixed, 95% CI) | 0.0 [0.0, 0.0] |
| Analysis 1.28  Comparison 1 Manual rotation versus no manual rotation, Outcome 28 Neonatal fracture. | ||||
| 29 Scalp haematoma (e.g. cephalohaematoma or subgaleal haemorrhage) Show forest plot | 1 | 30 | Risk Ratio (M‐H, Fixed, 95% CI) | 3.0 [0.13, 68.26] |
| Analysis 1.29  Comparison 1 Manual rotation versus no manual rotation, Outcome 29 Scalp haematoma (e.g. cephalohaematoma or subgaleal haemorrhage). | ||||
| 30 Neonatal encephalopathy Show forest plot | 1 | 30 | Risk Ratio (M‐H, Fixed, 95% CI) | 0.0 [0.0, 0.0] |
| Analysis 1.30 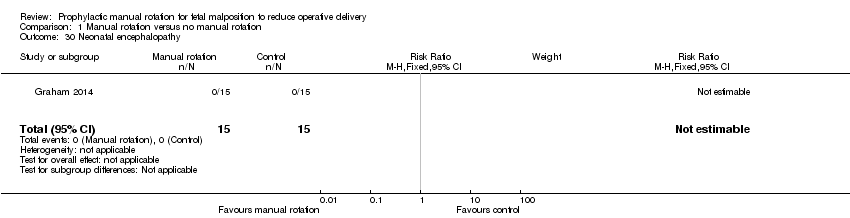 Comparison 1 Manual rotation versus no manual rotation, Outcome 30 Neonatal encephalopathy. | ||||
| 31 Neonatal neuropraxia Show forest plot | 1 | 30 | Risk Ratio (M‐H, Fixed, 95% CI) | 0.0 [0.0, 0.0] |
| Analysis 1.31  Comparison 1 Manual rotation versus no manual rotation, Outcome 31 Neonatal neuropraxia. | ||||

Study flow diagram.

Comparison 1 Manual rotation versus no manual rotation, Outcome 1 Operative delivery.

Comparison 1 Manual rotation versus no manual rotation, Outcome 2 Maternal mortality.

Comparison 1 Manual rotation versus no manual rotation, Outcome 3 Perinatal mortality.
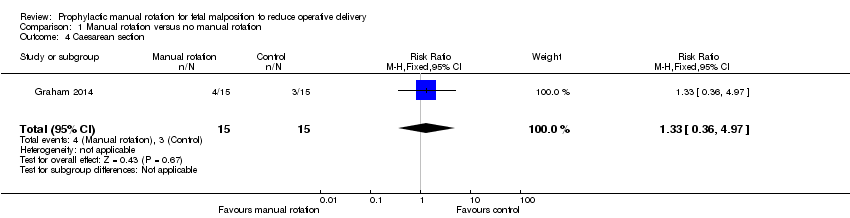
Comparison 1 Manual rotation versus no manual rotation, Outcome 4 Caesarean section.

Comparison 1 Manual rotation versus no manual rotation, Outcome 5 Forceps delivery.

Comparison 1 Manual rotation versus no manual rotation, Outcome 6 Vacuum‐assisted delivery.

Comparison 1 Manual rotation versus no manual rotation, Outcome 7 Third‐ or fourth‐degree perineal trauma.

Comparison 1 Manual rotation versus no manual rotation, Outcome 8 Nitrous oxide analgesia in labour.

Comparison 1 Manual rotation versus no manual rotation, Outcome 9 Opiate analgesia in labour.

Comparison 1 Manual rotation versus no manual rotation, Outcome 10 Epidural analgesia in labour.

Comparison 1 Manual rotation versus no manual rotation, Outcome 11 Duration of second stage of labour.

Comparison 1 Manual rotation versus no manual rotation, Outcome 12 Blood loss (mL).
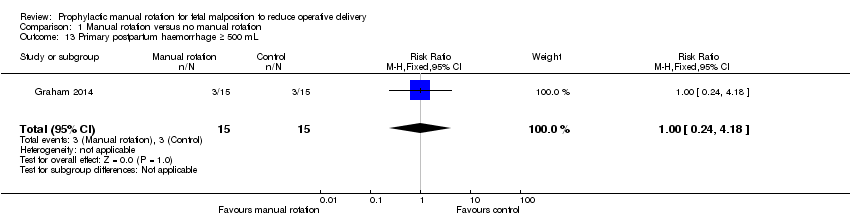
Comparison 1 Manual rotation versus no manual rotation, Outcome 13 Primary postpartum haemorrhage ≥ 500 mL.

Comparison 1 Manual rotation versus no manual rotation, Outcome 14 Maternal blood transfusion.

Comparison 1 Manual rotation versus no manual rotation, Outcome 15 Maternal postnatal infection.

Comparison 1 Manual rotation versus no manual rotation, Outcome 16 Length of maternal hospital stay (days).

Comparison 1 Manual rotation versus no manual rotation, Outcome 17 Non‐reassuring or pathological cardiotocograph during procedure.

Comparison 1 Manual rotation versus no manual rotation, Outcome 18 Non‐reassuring or pathological cardiotocograph at any time after allocation.

Comparison 1 Manual rotation versus no manual rotation, Outcome 19 Cord blood gas acidosis.

Comparison 1 Manual rotation versus no manual rotation, Outcome 20 Admission to neonatal intensive care unit.

Comparison 1 Manual rotation versus no manual rotation, Outcome 21 Neonatal resuscitation (positive pressure ventilation, cardiac compression or drug therapy).

Comparison 1 Manual rotation versus no manual rotation, Outcome 22 Mechanical ventilation (intermittent positive‐pressure ventilation/continuous positive airways pressure after resuscitation).
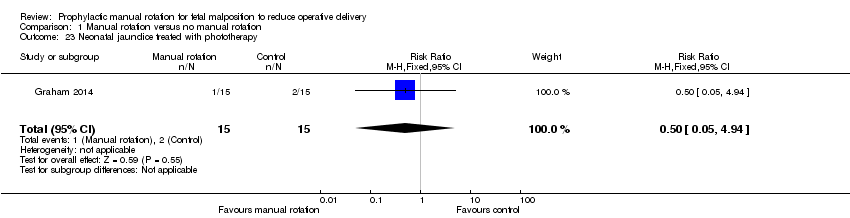
Comparison 1 Manual rotation versus no manual rotation, Outcome 23 Neonatal jaundice treated with phototherapy.
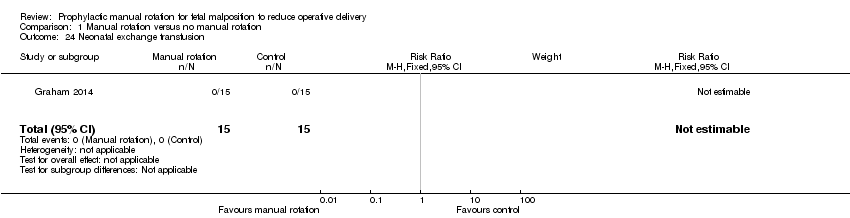
Comparison 1 Manual rotation versus no manual rotation, Outcome 24 Neonatal exchange transfusion.

Comparison 1 Manual rotation versus no manual rotation, Outcome 25 Polycythaemia treated with partial volume exchange transfusion.

Comparison 1 Manual rotation versus no manual rotation, Outcome 26 Neonatal stroke.

Comparison 1 Manual rotation versus no manual rotation, Outcome 27 Neonatal intracranial bleed.
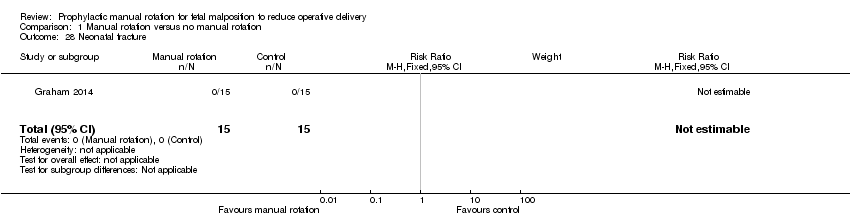
Comparison 1 Manual rotation versus no manual rotation, Outcome 28 Neonatal fracture.

Comparison 1 Manual rotation versus no manual rotation, Outcome 29 Scalp haematoma (e.g. cephalohaematoma or subgaleal haemorrhage).

Comparison 1 Manual rotation versus no manual rotation, Outcome 30 Neonatal encephalopathy.

Comparison 1 Manual rotation versus no manual rotation, Outcome 31 Neonatal neuropraxia.
| Outcome or subgroup title | No. of studies | No. of participants | Statistical method | Effect size |
| 1 Operative delivery Show forest plot | 1 | 30 | Risk Ratio (M‐H, Fixed, 95% CI) | 1.08 [0.79, 1.49] |
| 2 Maternal mortality Show forest plot | 1 | 30 | Risk Ratio (M‐H, Fixed, 95% CI) | 0.0 [0.0, 0.0] |
| 3 Perinatal mortality Show forest plot | 1 | 30 | Risk Ratio (M‐H, Fixed, 95% CI) | 0.0 [0.0, 0.0] |
| 4 Caesarean section Show forest plot | 1 | 30 | Risk Ratio (M‐H, Fixed, 95% CI) | 1.33 [0.36, 4.97] |
| 5 Forceps delivery Show forest plot | 1 | 30 | Risk Ratio (M‐H, Fixed, 95% CI) | 0.75 [0.20, 2.79] |
| 6 Vacuum‐assisted delivery Show forest plot | 1 | 30 | Risk Ratio (M‐H, Fixed, 95% CI) | 1.2 [0.47, 3.09] |
| 7 Third‐ or fourth‐degree perineal trauma Show forest plot | 1 | 30 | Risk Ratio (M‐H, Fixed, 95% CI) | 0.2 [0.01, 3.85] |
| 8 Nitrous oxide analgesia in labour Show forest plot | 1 | 30 | Risk Ratio (M‐H, Fixed, 95% CI) | 0.73 [0.41, 1.28] |
| 9 Opiate analgesia in labour Show forest plot | 1 | 30 | Risk Ratio (M‐H, Fixed, 95% CI) | 1.0 [0.24, 4.18] |
| 10 Epidural analgesia in labour Show forest plot | 1 | 30 | Risk Ratio (M‐H, Fixed, 95% CI) | 1.17 [0.88, 1.55] |
| 11 Duration of second stage of labour Show forest plot | 1 | 30 | Mean Difference (IV, Fixed, 95% CI) | ‐5.70 [‐58.34, 46.94] |
| 12 Blood loss (mL) Show forest plot | 1 | 30 | Mean Difference (IV, Fixed, 95% CI) | 109.30 [‐78.51, 297.11] |
| 13 Primary postpartum haemorrhage ≥ 500 mL Show forest plot | 1 | 30 | Risk Ratio (M‐H, Fixed, 95% CI) | 1.0 [0.24, 4.18] |
| 14 Maternal blood transfusion Show forest plot | 1 | 30 | Risk Ratio (M‐H, Fixed, 95% CI) | 0.0 [0.0, 0.0] |
| 15 Maternal postnatal infection Show forest plot | 1 | 30 | Risk Ratio (M‐H, Fixed, 95% CI) | 0.0 [0.0, 0.0] |
| 16 Length of maternal hospital stay (days) Show forest plot | 1 | 30 | Mean Difference (IV, Fixed, 95% CI) | 0.84 [‐0.04, 1.72] |
| 17 Non‐reassuring or pathological cardiotocograph during procedure Show forest plot | 1 | 30 | Risk Ratio (M‐H, Fixed, 95% CI) | 3.0 [0.13, 68.26] |
| 18 Non‐reassuring or pathological cardiotocograph at any time after allocation Show forest plot | 1 | 30 | Risk Ratio (M‐H, Fixed, 95% CI) | 0.57 [0.21, 1.55] |
| 19 Cord blood gas acidosis Show forest plot | 1 | 23 | Risk Ratio (M‐H, Fixed, 95% CI) | 1.83 [0.19, 17.51] |
| 20 Admission to neonatal intensive care unit Show forest plot | 1 | 30 | Risk Ratio (M‐H, Fixed, 95% CI) | 2.0 [0.61, 6.55] |
| 21 Neonatal resuscitation (positive pressure ventilation, cardiac compression or drug therapy) Show forest plot | 1 | 30 | Risk Ratio (M‐H, Fixed, 95% CI) | 1.0 [0.31, 3.28] |
| 22 Mechanical ventilation (intermittent positive‐pressure ventilation/continuous positive airways pressure after resuscitation) Show forest plot | 1 | 30 | Risk Ratio (M‐H, Fixed, 95% CI) | 3.0 [0.35, 25.68] |
| 23 Neonatal jaundice treated with phototherapy Show forest plot | 1 | 30 | Risk Ratio (M‐H, Fixed, 95% CI) | 0.5 [0.05, 4.94] |
| 24 Neonatal exchange transfusion Show forest plot | 1 | 30 | Risk Ratio (M‐H, Fixed, 95% CI) | 0.0 [0.0, 0.0] |
| 25 Polycythaemia treated with partial volume exchange transfusion Show forest plot | 1 | 30 | Risk Ratio (M‐H, Fixed, 95% CI) | 0.0 [0.0, 0.0] |
| 26 Neonatal stroke Show forest plot | 1 | 30 | Risk Ratio (M‐H, Fixed, 95% CI) | 0.0 [0.0, 0.0] |
| 27 Neonatal intracranial bleed Show forest plot | 1 | 30 | Risk Ratio (M‐H, Fixed, 95% CI) | 0.0 [0.0, 0.0] |
| 28 Neonatal fracture Show forest plot | 1 | 30 | Risk Ratio (M‐H, Fixed, 95% CI) | 0.0 [0.0, 0.0] |
| 29 Scalp haematoma (e.g. cephalohaematoma or subgaleal haemorrhage) Show forest plot | 1 | 30 | Risk Ratio (M‐H, Fixed, 95% CI) | 3.0 [0.13, 68.26] |
| 30 Neonatal encephalopathy Show forest plot | 1 | 30 | Risk Ratio (M‐H, Fixed, 95% CI) | 0.0 [0.0, 0.0] |
| 31 Neonatal neuropraxia Show forest plot | 1 | 30 | Risk Ratio (M‐H, Fixed, 95% CI) | 0.0 [0.0, 0.0] |