வயது வந்தவர்களில் கடுமையான வலிக்கு வலி நிவாரண துணை மருந்தாக காஃபின்
Appendices
Appendix 1. Search strategy for MEDLINE (via OVID)
-
Caffeine/ or caffeine.mp. (26526)
-
exp Pain/ (311576)
-
(pain or painful or analgesi*).mp. (537685)
-
2 or 3 (613026)
-
randomized controlled trial.pt. (385941)
-
controlled clinical trial.pt. (89662)
-
randomized.ab. (282607)
-
drug therapy.fs. (1735361)
-
randomly.ab. (199356)
-
groups.ab. (1275406)
-
5 or 6 or 7 or 8 or 9 or 10 (3174781)
-
1 and 4 and 11 (622)
Appendix 2. Search strategy for EMBASE (via OVID)
-
caffeine/ or caffeine.mp. (43358)
-
exp pain/ (26526)
-
(pain or painful or analgesi*).mp. (913249)
-
2 or 3 (1137545)
-
clinical trial.sh. (837697)
-
controlled clinical trial.sh. (386524)
-
randomized controlled trial.sh. (351013)
-
double‐blind procedure.sh. (117557)
-
(clin* adj25 trial*).ab. (321203)
-
((doubl* or trebl* or tripl*) adj25 (blind* or mask*)).ab. (139362)
-
placebo*.ab. (199403)
-
random*.ab. (882264)
-
5 or 6 or 7 or 8 or 9 or 10 or 11 or 12 (1697273)
-
1 and 4 and 13 (1216)
Appendix 3. Search strategy for CENTRAL (via CRSO)
-
MeSH descriptor Caffeine (1376)
-
caffeine:TI,AB,KY (2107)
-
1 or 2 (2107)
-
MeSH descriptor Pain explode all trees (29853)
-
(pain or painful or analgesi*):TI,AB,KY (71646)
-
4 or 5 (76877)
-
3 and 6 (279)
Appendix 4. Results for individual studies: efficacy and serious adverse events
| Study ID | Condition | Treatment | Efficacy outcome | Participants with outcome | Numerical superiority | Serious adverse events |
| Dysmenorrhoea | (1) Paracetamol 1000 mg + caffeine 140 mg, n = 310 | TOTPAR 4 h: (1) 6.58 (2) 6.07 | ≥ 50% max PR: (1) 134/310 (2) 121/310 | Yes | None | |
| Tension‐type headache | (1) Ibuprofen 400 mg + caffeine 200 mg, n = 97 | Very good or excellent | (1) 37/97 (2) 23/99 | Yes | None | |
| Tension‐type headache and/or migraine | (1) Aspirin 500 mg + paracetamol 400 mg + caffeine 100 mg, n = 482 | Very good, good | Very good (1) 121/482 (2) 107/498 Very good or good (1) 353/482 (2) 328/498 | Yes | (1) 1/482 (2) 0/498 Also 1 SAE following paracetamol only | |
| Dental | (1) Aspirin 650 mg + caffeine 65 mg, n = 66 | TOTPAR 6 h: (1) 6.8 (2) 6.57 | ≥ 50% max PR: (1) 17/66 (2) 17/68 | Yes Note: > 10% attrition | None | |
| Dental | (1) Ibuprofen 100 mg + caffeine 100 mg, n = 49 (3) Ibuprofen 200 mg + caffeine 100 mg, n = 44 | TOTPAR 6 h: (1) 8.95 (2) 6.67 (3) 12.1 (4) 8.65 | ≥ 50% max PR: (1) 19/49 (2) 13/49 (3) 24/44 (4) 17/48s | Yes (100 mg) Yes (200 mg) Note: > 10% attrition | None | |
| Postpartum pain and uterine cramping | (1) Paracetamol 500 mg + caffeine 65 mg, n = 56 (2) Paracetamol 500 mg, n = 54 (4) Paracetamol 1000 mg, n = 50 (6) Paracetamol 1500 mg, n = 60 | TOTPAR 4 h: (1) 8.2 (2) 7.1 (3) 10.3 (4) 8.2 (5) 10.4 (6) 9.1 | ≥ 50% max PR: (1) 32/56 (2) 26/54 (3) 42/57 (4) 28/50 (5) 42/56 (6) 38/60 | Yes (500 mg) Yes (1000 mg) Yes (1500 mg) Note: > 10% attrition | None | |
| Postpartum pain and uterine cramping | (1) Paracetamol 500 mg + caffeine 65 mg, n = 62 (2) Paracetamol 500 mg, n = 68 (4) Paracetamol 1000 mg, n = 68 (6) Paracetamol 1500 mg, n = 66 | TOTPAR 4 h: (1) 8.8 (2) 8.4 (3) 9.0 (4) 8.8 (5) 9.9 (6) 9.3 | ≥ 50% max PR: (1) 38/62 (2) 40/68 (3) 39/62 (4) 42/68 (5) 45/64 (6) 43/66 | Yes (500 mg) Yes (1000 mg) Yes (1500 mg) Note: > 10% attrition | None | |
| Postepisiotomy or postsurgical | (1) Paracetamol 500 mg + caffeine 65 mg, n = 80 (2) Paracetamol 500 mg, n = 81 (4) Paracetamol 1000 mg, n = 81 (6) Paracetamol 1500 mg, n = 81 | TOTPAR 4 h: (1) 9.1 (2) 8.4 (3) 9.1 (4) 9.1 (5) 9.9 (6) 9.7 | ≥ 50% max PR: (1) 51/80 (2) 47/81 (3) 50/78 (4) 52/81 (5) 57/80 (6) 56/81 | Yes (500 mg) No (1000 mg) Yes (1500 mg) Note: > 10% attrition | None | |
| Dental | (1) Paracetamol 1000 mg + caffeine 130 mg, n = 45 (2) Paracetamol 1000 mg, n = 46 (4) Paracetamol 2000 mg, n = 42 | TOTPAR 4 h: (1) 12.6 (2) 11.0 (3) 11.6 (4) 10.8 | ≥ 50% max PR: (1) 42/45 (2) 37/46 (3) 34/40 (4) 33/42 | Yes (1000 mg) Yes (2000 mg) | None | |
| Dental | (1) Ibuprofen 200 mg + caffeine 50 mg, n = 30 | TOTPAR 6 h: (1) 7.0 (2) 10.3 (3) 9.5 (4) 3.0 | ≥ 50% max PR: (1) 8/30 (2) 14/30 (3) 12/29 (4) 2/31 | Yes (all doses of caffeine) | None | |
| Tension‐type headache | (1) Paracetamol 1000 mg + caffeine 130 mg, n = 336 | No extractable data | No usable data | Yes | None | |
| Tension‐type headache | (1) Paracetamol 1000 mg + caffeine 130 mg, n = 339 | No extractable data | No usable data | Yes | None | |
| Migraine | (1) Diclofenac 100 mg + caffeine 100 mg, n = 46 | HR 1 h | No/mild pain (1) 19/46 (2) 12/45 | Yes Note: > 10% attrition | None | |
| Tonsillopharyngitis | (1) Aspirin 800 mg + caffeine 64 mg, n = 70 | TOTPAR 2: (1) 6.3 (2) 4.7 | No usable data | Yes | None | |
| Postepisiotomy | (1) Ibuprofen 100 mg + caffeine 100 mg, n = 50 (3) Ibuprofen 200 mg + caffeine 100 mg, n = 50 | TOTPAR 4: (1) 8.41 (2) 6.65 (3) 10.6 (4) 10.3 | ≥ 50% max PR: (1) 24/50 (2) 17/51 (3) 36/50 (4) 33/50 | Yes (100 mg) Yes (200 mg) | None | |
| Migraine | (1) Tolfenamic acid 200 mg + caffeine 100 mg, n = 79 (2) Tolfenamic acid 200 mg, n = 200 mg, n = 85 | PI 1.5 h | No/mild pain (1) 35/79 (2) 38/85 Baseline pain not reported | No | None | |
| Non‐migrainous headache | (1) Paracetamol 648 mg + caffeine 65 mg, n = 53 (2) Paracetamol 648 mg + caffeine 130 mg, n = 53 (3) Paracetamol 648 mg, n = 53 | SPID 2 h: (1) 32.63 (2) 37.54 (3) 28.30 | No usable data | Yes Note: > 10% attrition | No data | |
| Dental | (1) Paracetamol 1000 mg + caffeine 130 mg, n = 40 | TOTPAR 4 h: (1) 7.1 (2) 7.4 | ≥ 50% max PR: (1) 19/40 (2) 20/41 | No | None | |
| Idiopathic headache | (1) Paracetamol 500 mg + caffeine 50 mg, n = 36 | Pain‐free within 4 hours | No pain: (1) 26/36 (2) 13/36 | Yes (headache) | None | |
| Postoperative pain | (1) Paracetamol 500 mg + caffeine 50 mg, n = 18 | Pain‐free within 4 hours | (1) 12/18 (2) 3/19 | Yes (postoperative) | None | |
| Key: HR ‐ headache relief (moderate/severe to mild/none); PF ‐ pain free; PI ‐ pain intensity; PR ‐ pain relief; SAE ‐ serious adverse event; SPID ‐ summed pain intensity difference; TOTPAR ‐ total pain relief | ||||||

Study flow diagram.

'Risk of bias' graph: review authors' judgements about each risk of bias item presented as percentages across all included studies.
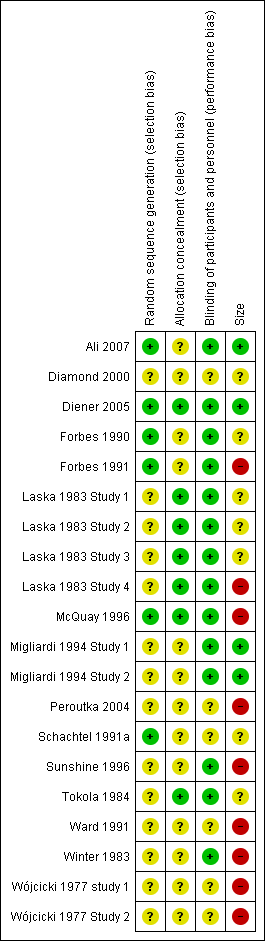
'Risk of bias' summary: review authors' judgements about each risk of bias item for each included study.

Individual studies comparing the primary outcome for analgesic + caffeine versus analgesic alone ‐ any pain condition

Forest plot of comparison: 3 Analgesic plus caffeine versus analgesic alone by dose of caffeine, outcome: 3.1 Primary outcome.

Comparison 1 Analgesic plus caffeine versus analgesic alone by pain condition, Outcome 1 Primary outcome.
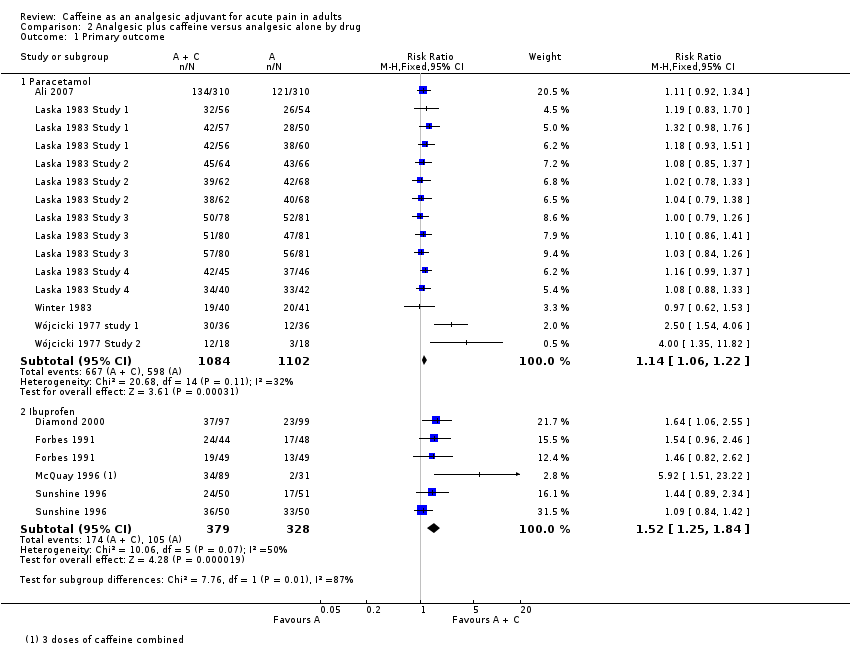
Comparison 2 Analgesic plus caffeine versus analgesic alone by drug, Outcome 1 Primary outcome.
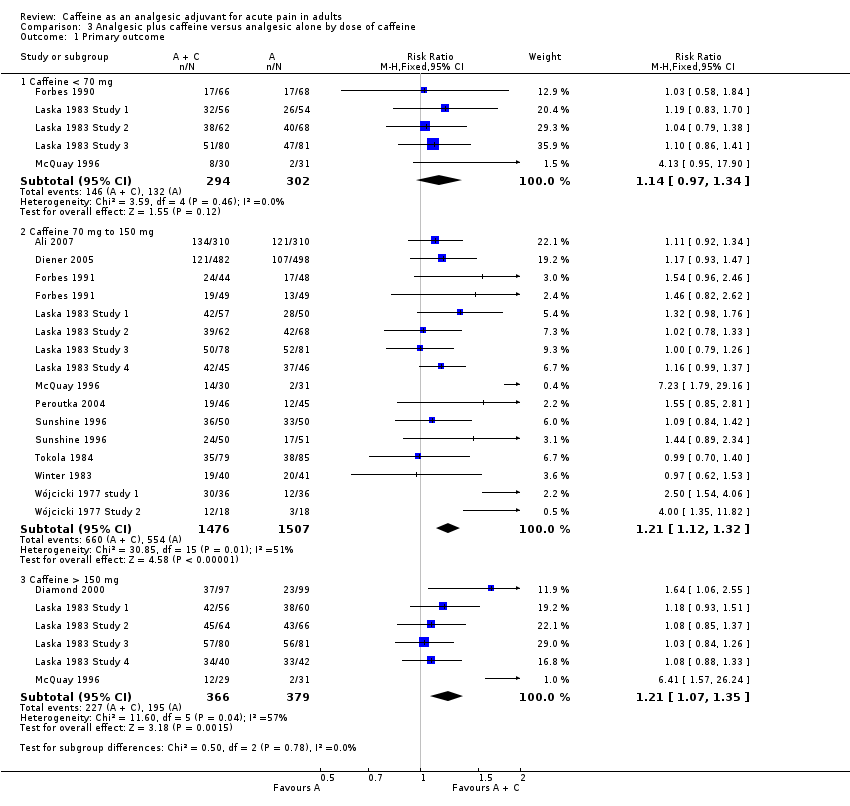
Comparison 3 Analgesic plus caffeine versus analgesic alone by dose of caffeine, Outcome 1 Primary outcome.
| Analgesic plus caffeine compared with analgesic alone for acute pain | ||||||
| Patient or population: adults with acute pain Settings: community Intervention: analgesic plus caffeine Comparison: same dose of analgesic alone | ||||||
| Outcomes | Outcome with analgesic alone | Outcome with analgesic plus caffeine | RR and NNT | No of participants | Quality of the evidence | Comments |
| Effective pain relief | 41% | 48% | RR 1.2 (1.1 to 1.3) NNT 14 (9.9 to 24) | 4262 (27 separate comparisons) | High | Small effect size but large numbers of participants contributing. There is a large amount of data that cannot be incorporated into this review, but this result is robust to analysis assuming all missing data show no effect. In fact, the results of this review are consistent with an almost completely different analysis in 10,000 participants demonstrating the effect of caffeine to have a similar effect size |
| Serious adverse events | 1 event | 1 event | Not calculated | Not calculated | Very low | Neither event judged related to study medication. Single dose studies are not powered to assess serious adverse events |
| CI: confidence interval; NNT: number needed to treat to benefit; RR: risk ratio | ||||||
| GRADE Working Group grades of evidence | ||||||
| Outcome or subgroup title | No. of studies | No. of participants | Statistical method | Effect size |
| 1 Primary outcome Show forest plot | 16 | 4262 | Risk Ratio (M‐H, Fixed, 95% CI) | 1.18 [1.11, 1.26] |
| 1.1 Postoperative/postpartum | 10 | 2139 | Risk Ratio (M‐H, Fixed, 95% CI) | 1.16 [1.08, 1.25] |
| 1.2 Headache | 5 | 1503 | Risk Ratio (M‐H, Fixed, 95% CI) | 1.30 [1.11, 1.52] |
| 1.3 Dysmenorrhoea | 1 | 620 | Risk Ratio (M‐H, Fixed, 95% CI) | 1.11 [0.92, 1.34] |
| Outcome or subgroup title | No. of studies | No. of participants | Statistical method | Effect size |
| 1 Primary outcome Show forest plot | 12 | Risk Ratio (M‐H, Fixed, 95% CI) | Subtotals only | |
| 1.1 Paracetamol | 8 | 2186 | Risk Ratio (M‐H, Fixed, 95% CI) | 1.14 [1.06, 1.22] |
| 1.2 Ibuprofen | 4 | 707 | Risk Ratio (M‐H, Fixed, 95% CI) | 1.52 [1.25, 1.84] |
| Outcome or subgroup title | No. of studies | No. of participants | Statistical method | Effect size |
| 1 Primary outcome Show forest plot | 16 | Risk Ratio (M‐H, Fixed, 95% CI) | Subtotals only | |
| 1.1 Caffeine < 70 mg | 5 | 596 | Risk Ratio (M‐H, Fixed, 95% CI) | 1.14 [0.97, 1.34] |
| 1.2 Caffeine 70 mg to 150 mg | 14 | 2983 | Risk Ratio (M‐H, Fixed, 95% CI) | 1.21 [1.12, 1.32] |
| 1.3 Caffeine > 150 mg | 6 | 745 | Risk Ratio (M‐H, Fixed, 95% CI) | 1.21 [1.07, 1.35] |