Verschiedene Arten der Ernährungsberatung für Frauen mit Schwangerschaftsdiabetes
Referencias
References to studies included in this review
References to studies excluded from this review
Additional references
References to other published versions of this review
Characteristics of studies
Characteristics of included studies [ordered by study ID]
Ir a:
| Methods | Randomised controlled trial. | |
| Participants | 40 women. Inclusion criteria: pregnant women aged 18 to 40 years diagnosed with GDM by a 100 g OGTT (see notes) at 24 to 28 weeks' gestation. Exclusion criteria: untreated hypothyroidism, smoking, kidney or liver diseases, taking oestrogen therapies. Setting: Iran. | |
| Interventions | DASH diet (n = 20 randomised; 17 analysed)
Control diet with matching macronutrients (n = 20 randomised; 17 analysed)
All women:
| |
| Outcomes | Data in meta‐analyses for: hypertensive disorders of pregnancy (pre‐eclampsia); caesarean section; birthweight; gestational weight gain (BMI and weight at the end of intervention); use of additional pharmacotherapy; glycaemic control (end of intervention fasting blood glucose; end of intervention HbA1c). | |
| Notes | GDM diagnosis based on ADA criteria: 2 or more values met or exceeded the following 100 g 3‐hour OGTT:
| |
| Risk of bias | ||
| Bias | Authors' judgement | Support for judgement |
| Random sequence generation (selection bias) | Low risk | Described as "Random assignment was done by the use of computer‐generated random numbers". |
| Allocation concealment (selection bias) | Unclear risk | Described as above; no further details provided regarding allocation concealment. |
| Blinding of participants and personnel (performance bias) | Low risk | Described as "with the exception of the study dietitian, who provided the dietary education, all study personnel and participants were blinded to the dietary assignment". Although the study dietitian was not blinded, all other research personnel were reported to be blinded, and thus the risk of performance bias was judged to be low. |
| Blinding of outcome assessment (detection bias) | Low risk | Described as above and the un‐blinded dietitian was not involved in outcome data collection. |
| Incomplete outcome data (attrition bias) | Low risk | Post‐randomisation exclusions: 3 in the DASH diet group: pre‐eclampsia (n = 2) and complete bed rest (n = 1). 3 in the control diet group: pre‐eclampsia (n = 2) and insulin therapy (n = 1). No losses to follow‐up. |
| Selective reporting (reporting bias) | Unclear risk | No access to study protocol; therefore not able to confidently assess the risk of selective reporting. Data reported for a limited number of review outcomes. |
| Other bias | Low risk | No other obvious risk of bias. |
| Methods | Randomised controlled trial. | |
| Participants | 38 women. Inclusion criteria: pregnant women aged 18 to 40 years, diagnosed with GDM by a 100 g OGTT (see notes) at 24 to 28 weeks' gestation; no previous history of GDM, non‐smoker. Exclusion criteria: premature preterm rupture of membrane, placental abruption, pre‐eclampsia, need to commence insulin therapy or on insulin therapy, recommendation for complete bed rest. Setting: Iran. | |
| Interventions | DASH diet (n = 19 randomised; 16 analysed)
Control diet with matching macronutrients (n = 19 randomised; 16 analysed)
All women:
| |
| Outcomes | Data in meta‐analyses for: hypertensive disorders of pregnancy (pre‐eclampsia); gestational weight gain (BMI and weight at end of intervention); insulin sensitivity (end of intervention insulin and HOMA‐IR); glycaemic control (end of intervention fasting blood glucose). | |
| Notes | GDM diagnosis based on ADA criteria: 2 or more values met or exceeded following 100 g 3‐hour OGTT;
| |
| Risk of bias | ||
| Bias | Authors' judgement | Support for judgement |
| Random sequence generation (selection bias) | Low risk | Described as "random assignment was done by the use of computer‐generated random numbers. A trained midwife at the maternity clinic performed randomization". |
| Allocation concealment (selection bias) | Unclear risk | Described as above; no further details provided regarding allocation concealment. |
| Blinding of participants and personnel (performance bias) | Low risk | Described as "with the exception of the study dietitian, who provided the dietary education, all study personnel and participants were blinded to the dietary assignment". Although the study dietitian was not blinded, all other research personnel were reported to be blinded, and thus the risk of performance bias was judged to be low. |
| Blinding of outcome assessment (detection bias) | Unclear risk | It was unclear whether the un‐blinded dietitian was involved in outcome assessment. |
| Incomplete outcome data (attrition bias) | Low risk | Post‐randomisation exclusions: 3 in the DASH diet group: pre‐eclampsia (n = 2) and complete bed rest (n = 1). 3 in the control diet group: pre‐eclampsia (n = 2) and insulin therapy (n = 1). No losses to follow‐up. |
| Selective reporting (reporting bias) | Unclear risk | No access to study protocol; therefore not able to confidently assess the risk of selective reporting. Data reported for a limited number of review outcomes. |
| Other bias | Low risk | No other obvious risk of bias. |
| Methods | Randomised controlled trial. | |
| Participants | 58 women. Inclusion criteria: primigravid pregnant women aged 18 to 40 years, diagnosed with GDM by a 100 g OGTT (see notes) at 24 to 28 weeks' gestation. Exclusion criteria: previous glucose intolerance or GDM diagnosis, premature preterm rupture of membrane, placenta abruption, pre‐eclampsia, requiring insulin therapy during intervention or complete bed rest, hypothyroidism, urinary tract infection, smoking and kidney or liver diseases, taking oestrogen therapy. Setting: Iran. | |
| Interventions | DASH diet (n = 29 randomised; 26 analysed)
Control diet with matching macronutrients (n = 19 randomised; 26 analysed)
All women:
| |
| Outcomes | Data in meta‐analyses for: hypertensive disorders of pregnancy (pre‐eclampsia); caesarean section; gestational age at birth; macrosomia; birthweight; head circumference at birth; length at birth; ponderal index at birth; placental abruption; use of additional; pharmacotherapy. | |
| Notes | GDM diagnosis based on ADA criteria: 2 or more values met or exceeded following 100g 3‐hour OGTT;
| |
| Risk of bias | ||
| Bias | Authors' judgement | Support for judgement |
| Random sequence generation (selection bias) | Low risk | Described as "random assignment was done using computer‐generated random numbers". |
| Allocation concealment (selection bias) | Unclear risk | Described as above; no further detail provided regarding allocation concealment. |
| Blinding of participants and personnel (performance bias) | Unclear risk | No information about whether women or personnel were blinded. |
| Blinding of outcome assessment (detection bias) | Unclear risk | No information about whether outcome assessors were blinded. |
| Incomplete outcome data (attrition bias) | Low risk | Post‐randomisation exclusions: 3 in the DASH diet group: pre‐eclampsia (n = 1), placenta abruption (n = 1) and complete bed rest (n = 1). 3 in the control diet group: premature preterm rupture of membrane (n = 1), needed to commence insulin therapy during intervention (n = 1) and pre‐eclampsia (n = 1). No losses to follow‐up. |
| Selective reporting (reporting bias) | Unclear risk | No access to study protocol; therefore not able to confidently assess the risk of selective reporting. Data reported for a limited number of review outcomes. |
| Other bias | Low risk | No other obvious risk of bias. |
| Methods | Randomised controlled trial. | |
| Participants | 37 women. A total of 69 women were involved in the trial, but only 37 women were diagnosed with GDM and provided outcome data for this review. Inclusion criteria: women ≤ 30 weeks' gestation, diagnosed with type A2 GDM (see notes), who were planning to give birth at the NIPerIER and required medical treatment from the Department of Endocrinology. Exclusion criteria: women with type 1 diabetes, type A1 GDM (see notes), glucose intolerance, multiple pregnancies, kidney or liver disease and hyperthyroidism or hypothyroidism. Setting: Mexico. | |
| Interventions | Low‐moderate GI diet (n = 19) Only foods with a low‐to‐moderate GI were recommended. Moderate‐high GI diet (n = 18) Control group: any type of carbohydrate was permitted. All women:
| |
| Outcomes | Data in meta‐analyses for: use of additional pharmacotherapy. | |
| Notes |
| |
| Risk of bias | ||
| Bias | Authors' judgement | Support for judgement |
| Random sequence generation (selection bias) | Unclear risk | Described as "women included in this study were randomly divided into two study groups", no further information available. |
| Allocation concealment (selection bias) | Unclear risk | No information was provided regarding allocation concealment. |
| Blinding of participants and personnel (performance bias) | High risk | It is unlikely that women were able to be blinded due to the nature of behavioural intervention used in this study. No information on whether research personnel were able to be blinded or not. |
| Blinding of outcome assessment (detection bias) | Unclear risk | No information about whether outcome assessors were blinded. |
| Incomplete outcome data (attrition bias) | High risk | Of the total randomised cohort of 108 eligible women (mixed cohort of women with GDM and type 2 diabetes) in a clinical trial, 20 declined (15.8%) to participate in the trial with reasons unclear. Another 19 women (17.5%) were excluded due to incomplete dietary information. No information was available for these excluded participants. |
| Selective reporting (reporting bias) | Unclear risk | No access to study protocol; therefore not able to confidently assess the risk of selective reporting; information obtained from translation. |
| Other bias | Low risk | No other obvious risk of bias. |
| Methods | Randomised controlled trial. | |
| Participants | 99 women. Inclusion criteria: women aged 18 to 50 years; 24th to 26th weeks of gestational age; diagnosed with GDM by a 75 g OGTT (see notes); singleton pregnancies. Exclusion criteria: BMI > 40 kg/m², any known diseases, medications or obstetric absolute or relative contraindications to exercise. Setting: Italy. | |
| Interventions | Diet recommendation and diet‐related behavioural advice (n = 49)
Diet recommendation only (n = 50)
All women:
| |
| Outcomes | Data in meta‐analyses for: large‐for‐gestational age; caesarean section; preterm birth; gestational weight gain (BMI and weight at end of intervention); insulin sensitivity (end of intervention insulin, HOMA‐IR); use of additional pharmacotherapy; glycaemic control (end of intervention fasting glucose, postprandial glucose, HbA1c); length of postnatal stay (baby; > 4 days). | |
| Notes | GDM was diagnosed by 75 g OGTT; no diagnostic criteria specified. | |
| Risk of bias | ||
| Bias | Authors' judgement | Support for judgement |
| Random sequence generation (selection bias) | Low risk | Described as "randomization was stratified by baseline body mass index (BMI) and METs, and was implemented through a website (www.epiclin.it)". |
| Allocation concealment (selection bias) | Low risk | Described as above. |
| Blinding of participants and personnel (performance bias) | High risk | It is considered unlikely that women were able to be blinded. |
| Blinding of outcome assessment (detection bias) | Low risk | "The dieticians, the obstetricians who reported maternal/neonatal complications, and the laboratory personnel were blinded to the group assignment." |
| Incomplete outcome data (attrition bias) | Low risk | No loss to follow‐up or post‐randomisation exclusions. |
| Selective reporting (reporting bias) | Unclear risk | No access to study protocol, not able to confidently assess the risk of selective reporting. Trial registration reports birthweight as a secondary outcome, however data not reported for this outcome in the manuscript. |
| Other bias | Low risk | No other obvious risk of bias. |
| Methods | Randomised controlled trial. | |
| Participants | 30 women. Inclusion criteria: Caucasian women with newly diagnosed GDM (see notes). Exclusion criteria: not reported. Setting: Poland. | |
| Interventions | Low‐carbohydrate diet (n = 15) Daily total energy divided as carbohydrate: 45%, protein: 25%, fat: 30% (based on daily total energy of 1800 kcal). Women were encouraged to have the diet until birth. High‐carbohydrate diet (n = 15) Daily total energy divided as carbohydrate: 60%, protein: 25%, fat: 15% (based on daily total energy of 1800 kcal). Women were encouraged to follow the diet until birth. All women:
| |
| Outcomes | Data in meta‐analyses for: caesarean section; gestational age at birth; macrosomia; birthweight; normal vaginal birth; operative vaginal birth; adherence to dietary intervention; use of additional pharmacotherapy; glycaemic control (end of intervention fasting and post breakfast, lunch and dinner 2‐hour blood glucose). | |
| Notes | GDM diagnosis based on WHO criteria: 1 or more value met or exceeded:
| |
| Risk of bias | ||
| Bias | Authors' judgement | Support for judgement |
| Random sequence generation (selection bias) | Unclear risk | Described as "the patients were randomised into two groups"; no further details available. |
| Allocation concealment (selection bias) | Unclear risk | No information was provided regarding allocation concealment. |
| Blinding of participants and personnel (performance bias) | High risk | It is considered unlikely that women were able to be blinded. No information on whether research personnel were able to be blinded or not. |
| Blinding of outcome assessment (detection bias) | Unclear risk | No information about whether outcome assessors were blinded. |
| Incomplete outcome data (attrition bias) | Low risk | No loss to follow‐up or post‐randomisation exclusions. |
| Selective reporting (reporting bias) | High risk | Maternal weight gain was reported incompletely "The proper weight change was observed in all the patients studied;" and data reported for a limited number of review outcomes. No access to study protocol to further assess the risk of selective reporting. |
| Other bias | Low risk | No other obvious risk of bias. |
| Methods | Randomised controlled trial. | |
| Participants | 300 women. Inclusion criteria: pregnant women diagnosed with GDM (see notes) between 24 and 32 weeks' gestation in otherwise low‐risk pregnancies. Exclusion criteria: multiple gestation; maternal‐fetal blood group incompatibility; known congenital anomaly; prior evidence of placenta praevia or abruptio placentae; significant maternal disease including chronic hypertension, connective tissue disease, endocrine disorders, and chronic hepatic disease; long‐term medical therapy affecting glucose metabolism such as steroids and β‐mimetic tocolytic agents; and imminent birth. Setting: Canada. | |
| Interventions | Energy‐restricted diet (n = 150 randomised; 149 analysed)
No energy‐restricted diet (n = 150 randomised and analysed)
| |
| Outcomes | Data in meta‐analyses for: perinatal mortality; caesarean birth; stillbirth; neonatal mortality; gestational age at birth; macrosomia; birthweight; shoulder dystocia; bone fracture; nerve palsy; neonatal hypoglycaemia; hyperbilirubinaemia; hypocalcaemia; normal vaginal birth; gestational weight gain (weight at birth); use of additional pharmacotherapy; glycaemic control (during and end of intervention fasting and postprandial 1‐hour glucose). | |
| Notes | Intention‐to‐treat analysis: data from 'failed control' group was analysed with the no energy‐restricted diet group data. Hatem criteria used for GDM diagnosis: following 75 g OGTT
| |
| Risk of bias | ||
| Bias | Authors' judgement | Support for judgement |
| Random sequence generation (selection bias) | Low risk | Described as "those women who agreed to participate in the study signed an informed consent form and were randomly allocated to treatment or control groups by randomisation tables". |
| Allocation concealment (selection bias) | Unclear risk | No further detail regarding allocation concealment provided. |
| Blinding of participants and personnel (performance bias) | High risk | It is unlikely that study women were able to be blinded. It was reported that healthcare workers involved in the trial were blinded to the home blood glucose monitoring results for women in the no energy‐restricted diet group; no further information was available. |
| Blinding of outcome assessment (detection bias) | Unclear risk | No information on whether outcome assessors were blinded. |
| Incomplete outcome data (attrition bias) | Low risk | 1 woman from the energy‐restricted diet group was lost to follow‐up. No post‐randomisation exclusions or withdrawals. |
| Selective reporting (reporting bias) | Unclear risk | No access to study protocol; therefore not able to confidently assess the risk of selective reporting. |
| Other bias | Unclear risk | There were 16 women in the no energy‐restricted diet group who received the same interventions as those in the energy‐restricted diet group (failed control); intention‐to‐treat analysis was applied. |
| Methods | Randomised controlled trial. | |
| Participants | 29 women. A total of 43 women were involved in the trial, but only 29 women were diagnosed with GDM and provided outcome data for this review. Inclusion criteria: pregnant women, 18 to 45 years, diagnosed with GDM (see notes), and who had been referred to the Diabetes in Pregnancy, St. Michael's Hospital, Canada. Exclusion criteria: presence of a multiple pregnancy or an acute or chronic illness affecting carbohydrate metabolism; presence of type 1 or 2 diabetes prior to the current pregnancy; use of insulin treatment prior to providing consent; greater than 34 weeks' gestation; unable to communicate in English with no translator available. Setting: Canada. | |
| Interventions | Low‐moderate GI diet (n = 13) Women were asked to select their starch choices from an exchange list of low‐GI foods. Moderate‐high GI diet (n = 16) Women were asked to select their starch choices from an exchange list of intermediate‐ and high‐GI foods, reflecting the usual intake of typical diabetes in pregnancy clinic patients. All women:
| |
| Outcomes | Data in meta‐analyses for: large‐for‐gestational age; macrosomia; use of additional pharmacotherapy. | |
| Notes | CDA criteria used for GDM diagnosis: 2 of the values are met or exceeded following 76 g OGTT:
| |
| Risk of bias | ||
| Bias | Authors' judgement | Support for judgement |
| Random sequence generation (selection bias) | Low risk | Randomisation order was created by 1 of the investigators who was not involved in recruitment. It is unclear how the sequence was generated; it was considered likely to be a computer‐generated sequence. |
| Allocation concealment (selection bias) | Low risk | Sealed, numbered, opaque envelopes were used, and various block sizes in randomisation were used. |
| Blinding of participants and personnel (performance bias) | High risk | Described as an "open‐label" pilot study. |
| Blinding of outcome assessment (detection bias) | Unclear risk | No information on whether outcome assessors were blinded. |
| Incomplete outcome data (attrition bias) | Low risk | 3 women in the low‐moderate GI group withdrew after randomisation, reasons given. Data were analysed on an intent‐to‐treat basis. |
| Selective reporting (reporting bias) | Unclear risk | No access to study protocol; therefore not able to confidently assess the risk of selective reporting. Data reported for a limited number of review outcomes. |
| Other bias | Low risk | No other obvious risk of bias. |
| Methods | Randomised controlled trial. | |
| Participants | 68 women. Inclusion criteria: pregnant women with GDM (see notes), aged 18 to 40 years, at week 24 to 28 gestation. Exclusion criteria: women with a fasting plasma glucose > 5.8 mmol/L and 2‐hour > 6.7 mmol/L ("because of ethical consideration, because they might needed insulin therapy"); with a history of diabetes (type 1 or 2 diagnosed in the current pregnancy), significant renal impairment, with premature preterm rupture of membranes, placental abruption, pre‐eclampsia, eclampsia, chronic hypertension or hypothyroidism. Setting: Iran. | |
| Interventions | Soy protein‐enriched diet (n = 34) Diet containing 0.8 g/kg protein with 35% animal protein, 35% soy protein, and 30% other plant proteins. Women received textured soy protein (Sobhan) and were educated regarding the preparation of their meals with soy protein. A trained nutritionist explained that soy protein should be washed and soaked for 30 minutes and then cooked in boiling water with turmeric, lemon juice, and tomato paste for 10 minutes. No soy protein diet (n = 34) Diet containing 0.8 g/kg protein with 70% animal and 30% plant proteins. All women:
| |
| Outcomes | Data in meta‐analyses for: hypertensive disorders of pregnancy (pre‐eclampsia); caesarean section; gestational age at birth; preterm birth; macrosomia; birthweight; head circumference at birth; length at birth; neonatal hypoglycaemia; hyperbilirubinaemia; gestational weight gain (BMI and weight at end of intervention); insulin sensitivity (end of intervention HOMA‐IR; QUICKI; insulin); use of additional pharmacotherapy; glycaemic control (end of intervention fasting glucose); maternal hospitalisation; neonatal hospitalisations. | |
| Notes | GDM was diagnosed by a "one‐step" 2 hour 75 g OGTT, based on the ADA criteria. GDM diagnosed when any of the values were met or exceeded:
| |
| Risk of bias | ||
| Bias | Authors' judgement | Support for judgement |
| Random sequence generation (selection bias) | Unclear risk | Quote: "Randomization and allocation were done by a trained midwife and were masked from the researcher and patients until the main analyses were completed." |
| Allocation concealment (selection bias) | Unclear risk | As above. |
| Blinding of participants and personnel (performance bias) | High risk | "Randomization and allocation were done by a trained midwife and were masked from the researcher and patients until the main analyses were completed." Considered unlikely to have been successful in view of the interventions. |
| Blinding of outcome assessment (detection bias) | Unclear risk | Not clearly reported. |
| Incomplete outcome data (attrition bias) | Low risk | 2 women from the no soy protein diet group were excluded "due to personal reasons"; however all women were included in the analyses. |
| Selective reporting (reporting bias) | Unclear risk | No access to study protocol; therefore not able to confidently assess the risk of selective reporting. Trial registered online, but retrospectively. |
| Other bias | Low risk | No other obvious risk of bias. |
| Methods | Randomised controlled trial. | |
| Participants | 27 women. Inclusion criteria: women with GDM diagnosed by a positive 3‐hour 75 g OGTT (see notes) before the 34 weeks' gestation. Exclusion criteria: use of any hypoglycaemic, anti‐lipidaemic or antihypertensive medication. Setting: Denmark. | |
| Interventions | High unsaturated fat diet (n = 13) From 34 weeks' gestation women had a high‐monounsaturated fat diet; no details about high‐monounsaturated fat diet provided. Low unsaturated fat diet (n = 14) From 34 weeks' gestation women had a high‐carbohydrate diet; no details about high‐carbohydrate diet provided. All women: after being diagnosed with GDM, all women were instructed to follow a high‐carbohydrate diet until the 34th week. | |
| Outcomes | Data in meta‐analyses for: large‐for‐gestational age; hypertensive disorders of pregnancy (pre‐eclampsia; hypertension); caesarean section; type 2 diabetes; gestational age at birth; macrosomia; birthweight; placental abruption; gestational weight gain (BMI and weight at birth); insulin sensitivity (during intervention); use of additional pharmacotherapy; glycaemic control (during intervention fasting and postprandial glucose, HbA1c); BMI postpartum; impaired glucose tolerance postpartum. | |
| Notes | GDM diagnosis based on 3‐hour 75 g OGTT, bloods taken every 30 minutes; GDM was defined as 2 or more plasma glucose concentrations above 3 SD of the mean. | |
| Risk of bias | ||
| Bias | Authors' judgement | Support for judgement |
| Random sequence generation (selection bias) | Low risk | Reported as "the randomisation was performed block‐wise stratified for pre‐pregnancy weight with an expected ratio of obese to normal weight of three to one. The block sizes were six and two in the two strata". |
| Allocation concealment (selection bias) | Low risk | Reported as that "the randomisation was performed by a third person at an independent centre outside our institution, which produced information about the outcome of randomisation at baseline measurement in week 33". |
| Blinding of participants and personnel (performance bias) | High risk | It is unlikely that women were able to be blinded. No information on whether research personnel were able to be blinded or not. |
| Blinding of outcome assessment (detection bias) | Unclear risk | No information on whether outcome assessors were blinded. |
| Incomplete outcome data (attrition bias) | Low risk | Data were missing at multiple collection points for 1 to 2 women but this was explained in the text and was considered unlikely to impact outcomes. Only women who had a positive OGTT at early postnatal period or those who were unable to attend the early postnatal follow‐up, were followed up at ≥ 4 months postpartum, Therefore, there were only 6 women who provided outcome data for development of type 2 diabetes and 7 women provided outcome data for development of glucose intolerance at ≥ 4 months postpartum. |
| Selective reporting (reporting bias) | Unclear risk | No access to study protocol; therefore not able to confidently assess the risk of selective reporting. |
| Other bias | High risk | Women in the high‐monounsaturated fat diet group had a higher trial entry BMI (mean (SD): 35 (2.4) kg/m²) when compared with women in the high‐carbohydrate group (mean (SD): 32.2 (1.5) kg/m²). |
| Methods | Randomised controlled trial. | |
| Participants | 99 women. Inclusion criteria: women aged at 18 to 45 years, diagnosed with GDM by a 75 g OGTT (see notes) between 20 and 32 weeks' gestation, with an otherwise healthy singleton pregnancy. Exclusion criteria: women who had special dietary requirements (including vegetarianism/veganism), pre‐existing diabetes, or pregnancy achieved by assisted reproduction and those who smoked or consumed alcohol during pregnancy. Setting: Australia. | |
| Interventions | Low‐GI diet (n = 50 randomised, 47 analysed) Diet GI target of ≤ 50; other nutrients were the same as the comparison group. High‐fibre moderate‐GI diet (n = 49 randomised, 45 analysed) Diet GI target of around 60, which represented average GI of Australian population. All women:
| |
| Outcomes | Data in meta‐analyses for: large‐for‐gestational age; caesarean section; type 2 diabetes; gestational age at birth; preterm birth; macrosomia; small‐for‐gestational age; birthweight; head circumference at birth; length at birth; ponderal index; weight and height at 3 months postpartum; weight gain during pregnancy; adherence to intervention; insulin sensitivity (end of intervention HOMA‐IR, insulin); use of additional pharmacotherapy; glycaemic control (end of intervention blood glucose, HbA1c); return to pre‐pregnancy weight and BMI at 3 months postpartum; impaired glucose tolerance and insulin sensitivity at 3 months postpartum. | |
| Notes | Insulin treatment was commenced if the mean fasting blood glucose or 1‐hour postprandial blood glucose in the preceding week exceeded 5.2 and 7.5 mmol/L, respectively. ADIPS criteria used for GDM diagnosis: 1 or more value met or exceeded:
WHO criteria used for diagnosis of type 2 diabetes and impaired glucose tolerance:
| |
| Risk of bias | ||
| Bias | Authors' judgement | Support for judgement |
| Random sequence generation (selection bias) | Low risk | Described as "the enrolled subjects were centrally randomised to study diet by computer generated random numbers, stratified by BMI and weeks of gestation". |
| Allocation concealment (selection bias) | Low risk | Described as "the allocation sequence was unpredictable and concealed from the recruiter". |
| Blinding of participants and personnel (performance bias) | Low risk | Reported that (besides research dietitian who provided trial intervention) all study personnel and women were blinded to dietary assignment. |
| Blinding of outcome assessment (detection bias) | High risk | Un‐blinded research dietitian was responsible for data collection. |
| Incomplete outcome data (attrition bias) | High risk | In the low‐GI diet group, 1 woman was excluded due to incorrect GDM diagnosis, 3 women withdrew after intervention, 2 women had preterm births, leaving 44 women who completed the study, and 47 women were included in analyses. In high‐fibre moderate‐GI diet group, 2 women withdrew after group allocation, another 2 women withdrew after intervention; 2 women had preterm births, leaving 43 women who completed the study and 45 women who were included in analyses. Only 58 of the 99 women randomised and their babies participated the 3‐month follow‐up. |
| Selective reporting (reporting bias) | Unclear risk | No access to study protocol; therefore not able to confidently assess the risk of selective reporting. |
| Other bias | High risk | At baseline, 2‐hour post 75 g glucose load blood glucose concentrations for women in low‐GI group were significantly higher than those in high‐fibre moderate‐GI group (mean (SD): low‐GI group 8.6 (1.2) mmol/L versus high‐fibre moderate GI group 8.0 (1.3) mmol/L; P = 0.024). |
| Methods | Randomised controlled trial. | |
| Participants | 95 women. Inclusion criteria: women who were residents of Guangzhow, aged between 18 and 40 years, with GDM diagnosed at 24 to 26 weeks' gestation (see notes). Exclusion criteria: pre‐pregnancy diabetes; multiple gestation; other severe diseases (hypertension, chronic hepatic and kidney disease and cancer); use of insulin or hypoglycaemic medications; less than 9 years of formal schooling; previous intensive nutrition education or intervention for diabetes. Setting: China. | |
| Interventions | Low‐moderate GI diet (n = 47 randomised; 41 analysed) The exchange lists provided contained low‐GL foods. Moderate‐high GI diet (n = 48 randomised; 42 analysed) The exchange lists comprised intermediate to high‐GL foods (typical Guangzhou diet). All women:
| |
| Outcomes | Data in meta‐analyses for: hypertensive disorders of pregnancy (severe hypertension or pre‐eclampsia; eclampsia); preterm birth; macrosomia; birthweight; postpartum haemorrhage; postpartum infection; gestational weight gain; use of additional pharmacotherapy; glycaemic control (end of intervention fasting and 2‐hour postprandial glucose, and HbA1c). | |
| Notes | Women were screened with a 50 g OGCT according to guidelines of the Chinese Medical Association and the ADA; positive cases (glucose ≥ 7.8 mmol/L following OGCT) were confirmed by further evaluation with a 3‐hour 75 g OGTT, and were diagnosed if they met at least 2 of the following:
| |
| Risk of bias | ||
| Bias | Authors' judgement | Support for judgement |
| Random sequence generation (selection bias) | Low risk | Random numbers were generated by Excel software. |
| Allocation concealment (selection bias) | High risk | Discussion: "We did not use allocation concealment." |
| Blinding of participants and personnel (performance bias) | High risk | Discussion: "Both the researchers (the dietitians) and the participants could not be blinded to group status." |
| Blinding of outcome assessment (detection bias) | Unclear risk | Not detailed. |
| Incomplete outcome data (attrition bias) | Unclear risk | "A modified intention‐to‐treat principle including all participants who completed the baseline and follow‐up assessments was used in the analysis." 6 women from the low‐moderate GI group were excluded from the analyses (protocol violation: 3; insulin treatment: 1; pre‐eclampsia: 1; declined: 1); 6 women from the moderate‐high GI group were excluded from the analyses (protocol violation: 3; insulin treatment: 2; severe hypertension: 1). |
| Selective reporting (reporting bias) | Unclear risk | No access to study protocol; therefore not able to confidently assess the risk of selective reporting. |
| Other bias | Low risk | No other obvious sources of bias. |
| Methods | Randomised controlled trial. | |
| Participants | 12 women. Inclusion criteria: obese women (defined as: pre‐pregnancy weight > 120% of ideal body weight as specified by the Corrected 1959 Metropolitan Life Insurance table) with GDM (see notes). Exclusion criteria: not reported. Setting: the USA. | |
| Interventions | During the second hospitalised week: Energy‐restricted diet (n = 7) Energy‐restricted diet of 1200 kcal/day diet by reducing serving size without changing the pattern and content of the diet in the first hospitalised week. No energy‐restricted diet (n = 5) Continued the standard diet prescribed as the first week, for about 2400 kcal/day. All women: hospitalised for the 2 weeks duration. Studies and diet during the first week were identical for all patients. During the first hospitalised week:
| |
| Outcomes | Data in meta‐analyses for: insulin sensitivity (during and end of intervention fasting insulin); glycaemic control (during and end of intervention fasting and 24‐hour plasma glucose). | |
| Notes | Carpenter and Coustan's criteria used for GDM diagnosis: 2 or more values meeting the following in 100 g 3‐hour OGTT;
| |
| Risk of bias | ||
| Bias | Authors' judgement | Support for judgement |
| Random sequence generation (selection bias) | Unclear risk | Described as "subjects were randomised to the control or calorie‐restricted group". |
| Allocation concealment (selection bias) | Unclear risk | No information was given on allocation concealment. |
| Blinding of participants and personnel (performance bias) | Unclear risk | No information on whether women or research personnel were blinded or not. |
| Blinding of outcome assessment (detection bias) | Unclear risk | No information on whether outcome assessors were blinded. |
| Incomplete outcome data (attrition bias) | Low risk | No loss to follow‐up or post‐randomisation exclusions reported. |
| Selective reporting (reporting bias) | Unclear risk | No clinical outcomes were reported (data available regarding insulin sensitivity and glycaemic control only). No access to study protocol; therefore not able to confidently assess the risk of selective reporting. |
| Other bias | Low risk | No other obvious risk of bias. |
| Methods | Randomised controlled trial. | |
| Participants | 152 women randomised. Inclusion criteria: women aged 18 to 45 years, diagnosed with GDM (see notes) with singleton pregnancies and a gestational age ≤ 35 weeks. Exclusion criteria: women who were unwilling to follow a prescribed diet, unable to understand Spanish, pregnancy co‐morbidities other than obesity, hypertension, and/or dyslipidaemia. Setting: Spain | |
| Interventions | Low‐carbohydrate diet (n = 76 randomised; 75 analysed)
High‐carbohydrate diet (n = 76 randomised; 75 analysed)
For both groups: energy content of the diet for each patient was calculated on the basis of pre‐gestational weight with a minimum of 1800 kcal/day. | |
| Outcomes | Data in meta‐analyses for: large‐for‐gestational age; perinatal mortality; hypertensive disorders of pregnancy (hypertension); caesarean section; stillbirth; gestational age at birth; macrosomia; small‐for‐gestational age; neonatal hypoglycaemia; gestational weight gain; use of additional pharmacotherapy. | |
| Notes | Screening and diagnosis of GDM based on the 2006 National Diabetes and Pregnancy clinical guidelines. All women were screened for GDM at 24 to 28 weeks with 50 g OGCT. If OGCT ≥ 7.8 mmol/L, they underwent an OGTT; diagnostic criteria were based on the National Diabetes Data Group criteria: 2 or more values met or exceeded the following in 100 g 3‐hour OGTT;
| |
| Risk of bias | ||
| Bias | Authors' judgement | Support for judgement |
| Random sequence generation (selection bias) | Unclear risk | Described as "group allocation was performed using a sealed envelope". |
| Allocation concealment (selection bias) | Unclear risk | As above; no further details provided. |
| Blinding of participants and personnel (performance bias) | High risk | Described as "two‐arm, open, parallel, randomised controlled trial". |
| Blinding of outcome assessment (detection bias) | Unclear risk | No information on whether outcome assessors were blinded. |
| Incomplete outcome data (attrition bias) | Unclear risk | Post‐randomisation exclusion:
Although intention‐to‐treat principles were employed in the analyses (including those women who discontinued the intervention), a considerable number of women discontinued their allocated diet during the study period, and more women in the high‐carbohydrate diet group discontinued their diet. Discontinued intervention:
|
| Selective reporting (reporting bias) | Unclear risk | No access to study protocol; therefore not able to confidently assess the risk of selective reporting. |
| Other bias | Low risk | No other obvious risk of bias. |
| Methods | Randomised controlled trial. | |
| Participants | 63 women. Inclusion criteria: women aged at 18 to 40 years diagnosed with GDM (see notes), with a singleton pregnancy, no previous GDM, non‐smokers, and seen for the first dietary visit between 28 and 32 weeks' gestation, with an ability to follow the protocol requirements. Exclusion criteria: any condition or medication that could affect glucose concentrations and unwillingness to follow the prescribed diet. Setting: Australia. | |
| Interventions | Low‐moderate GI diet (n = 31) Diet based on previously verified low–GI food, including pasta, grain breads, and unprocessed breakfast cereals with a high‐fibre content. Women were specifically asked to avoid consuming white bread, processed commercial breakfast cereals, potatoes, and some rice varieties. Moderate‐high GI diet (n = 32) Women were advised to follow a diet with a high‐fibre and low‐sugar content, with no specific mention of the GI. Potatoes, whole wheat bread, and specific high‐fibre, moderate‐to‐high GI breakfast cereals were recommended. All women:
| |
| Outcomes | Data in meta‐analyses for: large‐for‐gestational age; caesarean section; gestational age at birth; preterm birth; macrosomia; small‐for‐gestational age; birthweight; head circumference at birth; length at birth; ponderal index at birth; normal vaginal birth; operative vaginal birth; induction of labour; use of additional pharmacotherapy. | |
| Notes | ADIPS criteria used for GDM diagnosis: 1 or more value met or exceeded:
| |
| Risk of bias | ||
| Bias | Authors' judgement | Support for judgement |
| Random sequence generation (selection bias) | Low risk | Described as: "participants were randomly assigned to receive one of two different diets using permuted blocks of unequal size with the list generated using STATA (Version 7.0)". |
| Allocation concealment (selection bias) | Unclear risk | Described as above; unclear methods for allocation concealment. |
| Blinding of participants and personnel (performance bias) | High risk | Women and study dietitian were not blinded. The physician caring for the women was blinded to group allocation. |
| Blinding of outcome assessment (detection bias) | Unclear risk | No information on whether outcome assessors were blinded. |
| Incomplete outcome data (attrition bias) | Low risk | No loss to follow‐up or post‐randomisation exclusion. |
| Selective reporting (reporting bias) | Unclear risk | Data reported incompletely for some outcomes in the manuscript; "There were no significant differences between the women in either group with respect to weight gain from baseline to delivery, induction of labor, method of delivery, or gestational age at delivery (data not shown)." Trial authors provided additional unpublished data. |
| Other bias | Low risk | No other obvious risk of bias. |
| Methods | Randomised controlled trial. | |
| Participants | 125 women. Inclusion criteria: women at ≤ 35 weeks and 6 days gestation; > 110% of ideal body weight for height (adjusted for expected pregnancy weight gain and using a BMI of 25 as equal to 100% ideal body weight); diagnosed with GDM (see notes). Exclusion criteria: not reported. Setting: Australia. | |
| Interventions | Energy‐restricted diet (n = 67 randomised; 63 analysed) Women were placed on a diabetic diet providing between 6800 and 7600 kJ energy per day, which represented 70% of the Recommended Dietary Intake for pregnant women (30% energy restriction). No energy‐restricted diet (n = 58 randomised; 54 analysed): Women were placed on diabetic diet without energy restriction, providing 8600 to 9500 kJ energy per day. All women:
| |
| Outcomes | Data in meta‐analyses for: large‐for‐gestational age; caesarean section; gestational age at birth; preterm birth; macrosomia; small‐for‐gestational age; birthweight; head circumference at birth; length at birth; ponderal index at birth; normal vaginal birth; operative vaginal birth; induction of labour; use of additional pharmacotherapy. | |
| Notes | 7 sets of twins were included in the study, 3 sets in the energy‐restricted diet group and 4 sets in the no energy‐restricted diet group. GDM diagnosed if:
| |
| Risk of bias | ||
| Bias | Authors' judgement | Support for judgement |
| Random sequence generation (selection bias) | Unclear risk | Described as "women were allocated at random by draw of opaque numbered envelopes". |
| Allocation concealment (selection bias) | Unclear risk | Described as above. |
| Blinding of participants and personnel (performance bias) | Low risk | Women and diabetes service staff were blinded to allocation to diet group. |
| Blinding of outcome assessment (detection bias) | Unclear risk | Described as that "demographic, obstetric and neonatal data were collected prospectively". No information on whether or not outcome assessors were able to be blinded to group allocation. |
| Incomplete outcome data (attrition bias) | Low risk | A total of 8 women (4 from each group) withdrew and were excluded from data analysis; reasons for withdrawal and baseline details about these 8 women were not given. Some data points have small numbers of lost women that are unexplained in the text; this was considered unlikely to have affected the overall outcomes. |
| Selective reporting (reporting bias) | High risk | A number of outcomes for the neonate were reported incompletely and thus data could not be used in a meta‐analysis: e.g. SE not reported for birthweight in energy‐restricted diet group; and "The mean maximum bilirubin level measured in the two groups was the same." No access to study protocol to further assess the risk of selective reporting. |
| Other bias | High risk | "The reported maternal medical and obstetric histories were similar in the two groups except for a significantly higher proportion of women with a history of preterm labour in the control group." |
| Methods | Randomised controlled trial. | |
| Participants | 22 women. A total of 50 women were involved in the trial, but only 22 women were diagnosed with GDM and provided outcome data for this review. Inclusion criteria: women diagnosed with GDM (see notes) between 24 and 29 weeks' gestation. Exclusion criteria: diagnosis of GDM after 29 weeks' gestation. Setting: United States. | |
| Interventions | High‐fibre diet (n = 11) Diet containing 80 g fibre per day; 20% daily energy intake derived from fat, and 60% derived from carbohydrate. Standard‐fibre diet (n = 11) ADA diet; diet containing 20 g fibre per day; 30% daily energy intake derived from fat, and 50% derived from carbohydrate. All women: Capillary blood glucose assessments 6 times a day (before and after each meal), twice weekly. | |
| Outcomes | Data in meta‐analyses for: gestational age at birth; birthweight; gestational weight gain; use of additional pharmacotherapy; glycaemic control (mean blood glucose); maternal hypoglycaemia. | |
| Notes | GDM diagnostic criteria not reported. | |
| Risk of bias | ||
| Bias | Authors' judgement | Support for judgement |
| Random sequence generation (selection bias) | Low risk | Randomisation was done using a random numbers table. |
| Allocation concealment (selection bias) | Unclear risk | Detail regarding allocation concealment was not reported. |
| Blinding of participants and personnel (performance bias) | High risk | Women were unlikely to have been blinded. The research dietitian and the diabetes nurse specialist who were responsible for monitoring diet compliance and glycaemic control were unlikely to have been blinded. Unclear whether other research personnel were able to be blinded or not. |
| Blinding of outcome assessment (detection bias) | Unclear risk | No information on whether outcome assessors were blinded. |
| Incomplete outcome data (attrition bias) | Unclear risk | Women with insulin‐dependent diabetes and GDM were included in the trial. It was reported that 11 women (5 in the standard‐fibre diet group and 6 in the high‐fibre diet) were excluded from the study after randomisation: 1 had a spontaneous abortion, 2 moved away, and 4 from each group were noncompliant. It is unclear how many of these 11 women excluded after randomisation were women with GDM. |
| Selective reporting (reporting bias) | Unclear risk | No access to study protocol; therefore not able to confidently assess the risk of selective reporting. |
| Other bias | Low risk | No other obvious risk of bias. |
| Methods | Randomised controlled trial. | |
| Participants | 20 women. Inclusion criteria: pregnant immigrant women with GDM (see notes). Exclusion criteria: not reported. Setting: Italy. | |
| Interventions | Ethnic‐specific diet (n = 10)
Standard healthy diet (n = 10)
All women
| |
| Outcomes | Data in meta‐analyses for: large‐for‐gestational age; neonatal composite outcome; hypertensive disorders of pregnancy (gestational hypertension); caesarean section; gestational age at birth; macrosomia; small‐for‐gestational age; birthweight; respiratory distress syndrome; neonatal hypoglycaemia; hyperbilirubinaemia; hypocalcaemia; gestational weight gain; adherence to intervention; use of additional pharmacotherapy. | |
| Notes | Screening for GDM was done with a OGCT between weeks 24 and 28 of gestation, and the diagnosis was confirmed with a 100 g OGTT as recommended by the 4th International Workshop Conference on GDM: GDM diagnosed when ≥ 2 values were met or exceeded:
| |
| Risk of bias | ||
| Bias | Authors' judgement | Support for judgement |
| Random sequence generation (selection bias) | Unclear risk | Described as "the women enrolled were randomly assigned to two groups". |
| Allocation concealment (selection bias) | Unclear risk | As above. |
| Blinding of participants and personnel (performance bias) | High risk | Women and dietitian were unlikely to have been blinded. Unclear whether other research personnel were able to be blinded or not. |
| Blinding of outcome assessment (detection bias) | Unclear risk | No information on whether outcome assessors were blinded. |
| Incomplete outcome data (attrition bias) | Low risk | No loss to follow‐up or post‐randomisation exclusion. |
| Selective reporting (reporting bias) | High risk | Metabolic outcomes reported in Figures, with no variance measures reported; therefore unable to be included in meta‐analyses. No access to study protocol; therefore unable to further assess the risk of selective reporting. |
| Other bias | Low risk | No other obvious risk of bias. |
| Methods | Randomised controlled trial. | |
| Participants | 84 women. Inclusion criteria: women diagnosed with GDM (see notes), aged 22 to 38 years and between 24 and 28 weeks' gestation; residents of Changzhou and only performed light physical activity (such as type writing, 6 hours per day); did not have pregnancy‐related complications and had no history of diabetes, hypertension or GDM; willingness to accept dietary intervention, cook and dine out. Exclusion criteria: not reported. Setting: China. | |
| Interventions | High unsaturated fat diet (n = 41) Carbohydrates accounted for 50% to 54% of the total energy; fat accounted for 31% to 35% of the total energy; sunflower oil (45 g to 50 g daily) was used as cooking oil. Low unsaturated fat diet (n = 43) Carbohydrates accounted for 55% to 60% of the total energy; fat accounted for 25% to 30% of the total energy, sunflower oil (20 g daily) was used as cooking oil. All women
| |
| Outcomes | Data in meta‐analyses for: gestational age at birth; preterm birth; macrosomia; birthweight; gestational weight gain; insulin sensitivity (end of intervention IAI); use of additional pharmacotherapy; glycaemic control (end of intervention fasting and 2‐hour postprandial glucose). | |
| Notes | GDM diagnosis was based on 75 g OGTT at 24 to 28 weeks' gestation. The IADPSG diagnostic criteria used for GDM diagnosis: if the glucose concentration exceeded any of:
| |
| Risk of bias | ||
| Bias | Authors' judgement | Support for judgement |
| Random sequence generation (selection bias) | Unclear risk | Described as "they were randomly divided into 2 groups: 41 and 43 patients were included in the experimental and control groups, respectively." |
| Allocation concealment (selection bias) | Unclear risk | As above. |
| Blinding of participants and personnel (performance bias) | High risk | Women and the nutritionist were unlikely to have been blinded. Unclear whether other research personnel were able to be blinded or not. |
| Blinding of outcome assessment (detection bias) | Unclear risk | No information on whether outcome assessors were blinded. |
| Incomplete outcome data (attrition bias) | Low risk | No loss to follow‐up or post‐randomisation exclusion. |
| Selective reporting (reporting bias) | Unclear risk | No access to study protocol; therefore not able to confidently assess the risk of selective reporting. |
| Other bias | Low risk | No other obvious risk of bias. |
Abbreviations
ADA: the American Diabetes Association
ADIPS: Australian Diabetes in Pregnancy Society
BMI: body mass index
CDA: Canadian Diabetes Association
DASH: Dietary Approaches to Stop Hypertension
g: gram
GDM: gestational diabetes mellitus
GI: glycaemic index
GL: glycaemic load
HbA1c: glycated haemoglobin
HOMA‐IR: homeostatic model assessment of insulin resistance
IADPSG: International Association of Diabetes and Pregnancy Study Group
IAI: intermediate acting insulin
MET: metabolic equivalent
N: number
NIPerIER: National Institute of Perinatology Isidro Espinosa de los Reyes
OGCT: oral glucose challenge test
OGTT: oral glucose tolerance test
QUICKI: quantitative insulin sensitivity check index
SD: standard deviation
SE: standard error
WHO: World Health Organization
Characteristics of excluded studies [ordered by study ID]
Ir a:
| Study | Reason for exclusion |
| This randomised trial did not compare types of dietary advice. Comprehensive intensive therapy (individualised diabetes education; diet and exercise advice; instructions on how to self‐monitor glucose; and regular review by a diabetes physician) was compared with a standard therapeutic regimen (group education on the importance of diet, exercise and self‐monitoring of glucose; instructions on how to self‐monitor glucose (but not advised to monitor as frequently) for women with GDM. | |
| This randomised trial did not compare types of dietary advice, but rather assessed magnesium chloride supplementation for women with GDM. | |
| This randomised trial did not compare types of dietary advice, but rather compared myoinositol and folic acid with folic acid alone for women with GDM. | |
| This randomised trial was not conducted in women with GDM; women with positive 50 g OGCT and negative 100 g OGTT were included. | |
| This randomised trial did not compare types of dietary advice, but rather assessed a lifestyle intervention (which included diet, exercise and breastfeeding interventions) for women with GDM. | |
| This randomised trial did not compare types of dietary advice, but rather compared standard clinical practice also including advice for targeted intakes of foods rich in unsaturated fats, with standard clinical practice, for women with GDM. | |
| This randomised trial did not compare types of dietary advice, but rather compared dietary advice alone or insulin therapy with dietary advice for women with GDM. | |
| This randomised trial did not compare types of dietary advice, but rather assessed the effect of lactobacilli GG yogurt for women with GDM. | |
| This was a randomised cross‐over trial assessing a high complex carbohydrate/low‐fat diet and a low‐carbohydrate/higher‐fat diet for women with GDM. | |
| This was a randomised cross‐over trial assessing a high complex carbohydrate/low‐fat diet and a low‐carbohydrate/higher‐fat diet for women with GDM. | |
| This was a randomised cross‐over trial assessing a high complex carbohydrate/low‐fat diet and a low‐carbohydrate/higher‐fat diet for women with GDM. | |
| This randomised trial did not compare types of dietary advice, but rather assessed vitamin D supplementation for women with GDM. | |
| This randomised trial did not compare types of dietary advice, but rather assessed a 5‐day low‐GI staple diet for women with GDM. | |
| This was a randomised cross‐over trial assessing a saturated fat and monounsaturated fat diet for women with GDM. | |
| This randomised trial did not compare types of dietary advice, but rather assessed omega‐3 fatty acid supplementation for women with GDM. | |
| This was not a randomised controlled trial; it was a literature review management of GDM. | |
| This randomised trial did not compare types of dietary advice, but rather assessed omega‐3 fatty acid supplementation for women with GDM | |
| This randomised trial did not assess dietary advice for women with GDM; it assessed a probiotic capsule for obese pregnant women (excluding women with GDM). | |
| This randomised trial did not compare types of dietary advice, but rather assessed a probiotic for women with GDM. | |
| This was a randomised cross‐over trial assessing a carbohydrate‐controlled, low‐GI bread‐based breakfast and an energy and macronutrient matched high‐GI bread‐based breakfast for women with GDM. | |
| This randomised trial included women with 'abnormal glucose metabolism'; not specifically women with GDM. | |
| This was a randomised cross‐over trial assessing a low‐fat, high unrefined‐carbohydrate diet and a low‐carbohydrate diet. | |
| This randomised trial included women with GDM and women with type 2 diabetes; outcome data have not been reported separately for the group of women with GDM in the published paper. | |
| This randomised trial did not compare types of dietary advice, but rather compared different types of care for women with GDM. Women in the intervention group were cared according to the nutrition practice guidelines for GDM, that emphasised 3 major areas of setting individualised medical nutrition therapy goals, blood glucose monitoring, a minimum of 3 nutrition visits with follow‐ups via phone or in person. Women in the control group received usual prenatal nutrition care. | |
| This randomised trial did not compare types of dietary advice, but rather assessed omega‐3 fatty acid supplementation for women with GDM. | |
| This ongoing randomised trial was not designed to be conducted in women with GDM; eligible participants are pregnant women with metabolic risk factors (i.e. at least 1 of 1) BMI ≥ 30 kg/m²; 2) raised serum triglycerides ≥ 1.7 mmol/L; 3) raised blood pressure of systole ≥ 140 mm Hg or diastole ≥ 90 mm Hg). | |
| This randomised trial did not compare types of dietary advice, but rather assessed a nutritional liquid supplement for women with GDM. | |
| This randomised trial did not compare types of dietary advice, but rather assessed capsaicin for women with GDM. |
BMI: body mass index
GDM: gestational diabetes mellitus
GI: glycaemic index
OGCT: oral glucose challenge test
Data and analyses
| Outcome or subgroup title | No. of studies | No. of participants | Statistical method | Effect size |
| 1 Large‐for‐gestational age Show forest plot | 2 | 89 | Risk Ratio (M‐H, Fixed, 95% CI) | 0.71 [0.22, 2.34] |
| Analysis 1.1 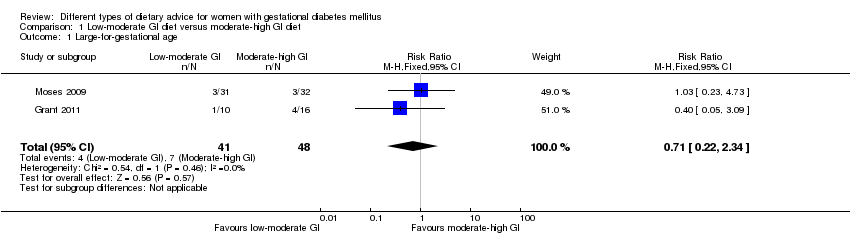 Comparison 1 Low‐moderate GI diet versus moderate‐high GI diet, Outcome 1 Large‐for‐gestational age. | ||||
| 2 Hypertensive disorders of pregnancy (severe hypertension or pre‐eclampsia) Show forest plot | 1 | 95 | Risk Ratio (M‐H, Fixed, 95% CI) | 1.02 [0.07, 15.86] |
| Analysis 1.2 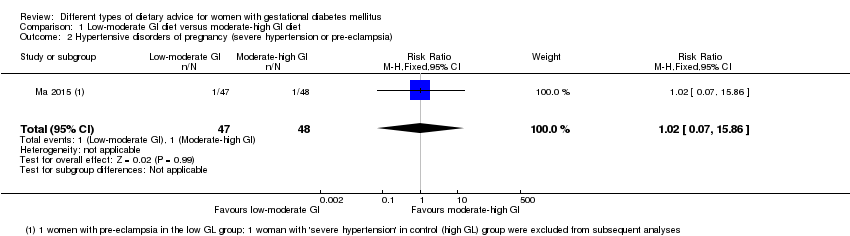 Comparison 1 Low‐moderate GI diet versus moderate‐high GI diet, Outcome 2 Hypertensive disorders of pregnancy (severe hypertension or pre‐eclampsia). | ||||
| 3 Hypertensive disorders of pregnancy (eclampsia) Show forest plot | 1 | 83 | Risk Ratio (M‐H, Fixed, 95% CI) | 0.34 [0.01, 8.14] |
| Analysis 1.3 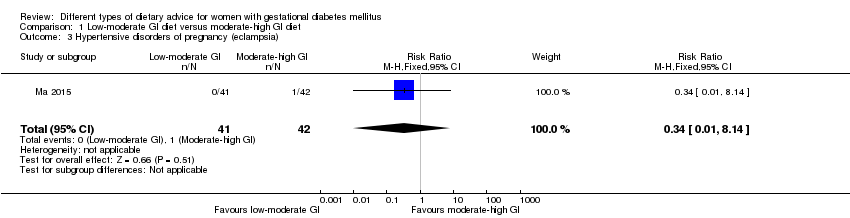 Comparison 1 Low‐moderate GI diet versus moderate‐high GI diet, Outcome 3 Hypertensive disorders of pregnancy (eclampsia). | ||||
| 4 Caesarean section Show forest plot | 1 | 63 | Risk Ratio (M‐H, Fixed, 95% CI) | 0.66 [0.29, 1.47] |
| Analysis 1.4  Comparison 1 Low‐moderate GI diet versus moderate‐high GI diet, Outcome 4 Caesarean section. | ||||
| 5 Gestational age at birth (weeks) Show forest plot | 1 | 62 | Mean Difference (IV, Fixed, 95% CI) | 0.30 [‐0.30, 0.90] |
| Analysis 1.5  Comparison 1 Low‐moderate GI diet versus moderate‐high GI diet, Outcome 5 Gestational age at birth (weeks). | ||||
| 6 Preterm birth Show forest plot | 2 | 146 | Risk Ratio (M‐H, Fixed, 95% CI) | 0.64 [0.22, 1.85] |
| Analysis 1.6  Comparison 1 Low‐moderate GI diet versus moderate‐high GI diet, Outcome 6 Preterm birth. | ||||
| 7 Macrosomia Show forest plot | 3 | 172 | Risk Ratio (M‐H, Fixed, 95% CI) | 0.59 [0.16, 2.26] |
| Analysis 1.7  Comparison 1 Low‐moderate GI diet versus moderate‐high GI diet, Outcome 7 Macrosomia. | ||||
| 8 Small‐for‐gestational age Show forest plot | 1 | 63 | Risk Ratio (M‐H, Fixed, 95% CI) | 5.16 [0.26, 103.27] |
| Analysis 1.8 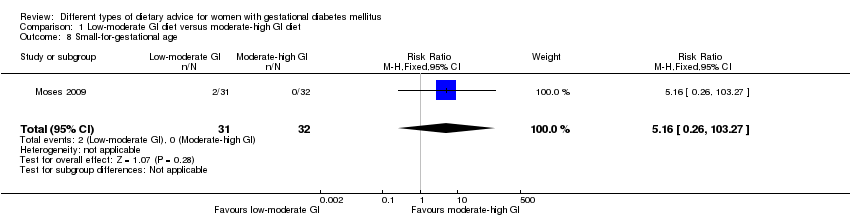 Comparison 1 Low‐moderate GI diet versus moderate‐high GI diet, Outcome 8 Small‐for‐gestational age. | ||||
| 9 Birthweight (g) Show forest plot | 2 | 145 | Mean Difference (IV, Fixed, 95% CI) | ‐55.98 [‐201.90, 89.95] |
| Analysis 1.9  Comparison 1 Low‐moderate GI diet versus moderate‐high GI diet, Outcome 9 Birthweight (g). | ||||
| 10 Head circumference at birth (cm) Show forest plot | 1 | 59 | Mean Difference (IV, Fixed, 95% CI) | 0.40 [‐0.58, 1.38] |
| Analysis 1.10  Comparison 1 Low‐moderate GI diet versus moderate‐high GI diet, Outcome 10 Head circumference at birth (cm). | ||||
| 11 Length at birth (cm) Show forest plot | 1 | 60 | Mean Difference (IV, Fixed, 95% CI) | ‐0.5 [‐1.54, 0.54] |
| Analysis 1.11  Comparison 1 Low‐moderate GI diet versus moderate‐high GI diet, Outcome 11 Length at birth (cm). | ||||
| 12 Ponderal index at birth (kg/m³) Show forest plot | 1 | 60 | Mean Difference (IV, Fixed, 95% CI) | 0.10 [‐0.03, 0.23] |
| Analysis 1.12 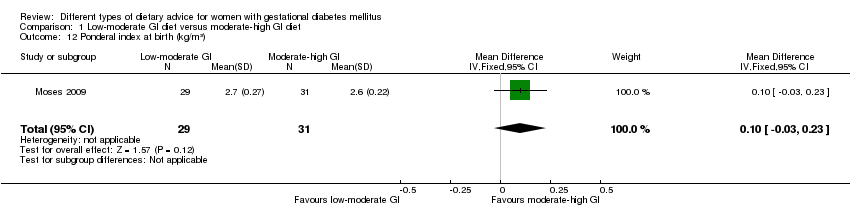 Comparison 1 Low‐moderate GI diet versus moderate‐high GI diet, Outcome 12 Ponderal index at birth (kg/m³). | ||||
| 13 Normal vaginal birth Show forest plot | 1 | 63 | Risk Ratio (M‐H, Fixed, 95% CI) | 1.35 [0.89, 2.07] |
| Analysis 1.13  Comparison 1 Low‐moderate GI diet versus moderate‐high GI diet, Outcome 13 Normal vaginal birth. | ||||
| 14 Operative vaginal birth Show forest plot | 1 | 63 | Risk Ratio (M‐H, Fixed, 95% CI) | 0.62 [0.16, 2.37] |
| Analysis 1.14 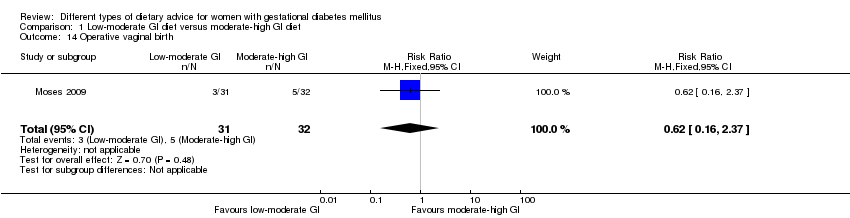 Comparison 1 Low‐moderate GI diet versus moderate‐high GI diet, Outcome 14 Operative vaginal birth. | ||||
| 15 Induction of labour Show forest plot | 1 | 63 | Risk Ratio (M‐H, Fixed, 95% CI) | 0.88 [0.33, 2.34] |
| Analysis 1.15 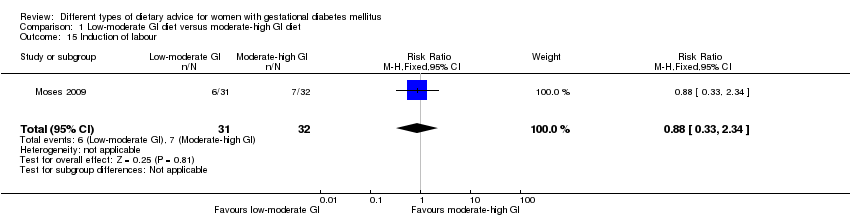 Comparison 1 Low‐moderate GI diet versus moderate‐high GI diet, Outcome 15 Induction of labour. | ||||
| 16 Postpartum haemorrhage Show forest plot | 1 | 83 | Risk Ratio (M‐H, Fixed, 95% CI) | 1.02 [0.15, 6.93] |
| Analysis 1.16  Comparison 1 Low‐moderate GI diet versus moderate‐high GI diet, Outcome 16 Postpartum haemorrhage. | ||||
| 17 Postpartum infection Show forest plot | 1 | 83 | Risk Ratio (M‐H, Fixed, 95% CI) | 0.34 [0.01, 8.14] |
| Analysis 1.17 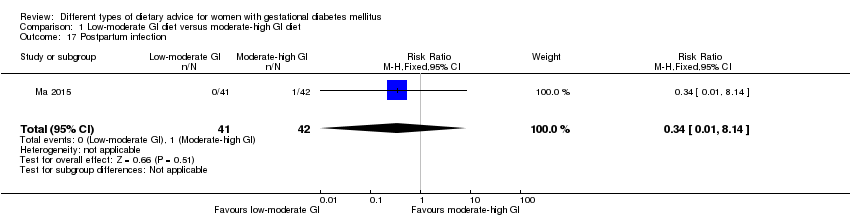 Comparison 1 Low‐moderate GI diet versus moderate‐high GI diet, Outcome 17 Postpartum infection. | ||||
| 18 Gestational weight gain (kg) Show forest plot | 1 | 83 | Mean Difference (IV, Fixed, 95% CI) | ‐0.47 [‐2.18, 1.24] |
| Analysis 1.18  Comparison 1 Low‐moderate GI diet versus moderate‐high GI diet, Outcome 18 Gestational weight gain (kg). | ||||
| 19 Use of additional pharmacotherapy Show forest plot | 4 | 221 | Risk Ratio (M‐H, Random, 95% CI) | 0.82 [0.39, 1.74] |
| Analysis 1.19  Comparison 1 Low‐moderate GI diet versus moderate‐high GI diet, Outcome 19 Use of additional pharmacotherapy. | ||||
| 20 Glycaemic control: end of intervention fasting plasma glucose (mmol/L) Show forest plot | 1 | 83 | Mean Difference (IV, Fixed, 95% CI) | ‐0.15 [‐0.55, 0.25] |
| Analysis 1.20  Comparison 1 Low‐moderate GI diet versus moderate‐high GI diet, Outcome 20 Glycaemic control: end of intervention fasting plasma glucose (mmol/L). | ||||
| 21 Glycaemic control: end of intervention 2‐hour postprandial glucose (mmol/L) Show forest plot | 1 | 83 | Mean Difference (IV, Fixed, 95% CI) | ‐0.71 [‐1.21, ‐0.21] |
| Analysis 1.21  Comparison 1 Low‐moderate GI diet versus moderate‐high GI diet, Outcome 21 Glycaemic control: end of intervention 2‐hour postprandial glucose (mmol/L). | ||||
| 22 Glycaemic control: end of intervention HbA1c (%) Show forest plot | 1 | 83 | Mean Difference (IV, Fixed, 95% CI) | 0.01 [‐0.18, 0.20] |
| Analysis 1.22  Comparison 1 Low‐moderate GI diet versus moderate‐high GI diet, Outcome 22 Glycaemic control: end of intervention HbA1c (%). | ||||
| Outcome or subgroup title | No. of studies | No. of participants | Statistical method | Effect size |
| 1 Large‐for‐gestational age Show forest plot | 1 | 123 | Risk Ratio (M‐H, Fixed, 95% CI) | 1.17 [0.65, 2.12] |
| Analysis 2.1  Comparison 2 Energy‐restricted diet versus no energy‐restricted diet, Outcome 1 Large‐for‐gestational age. | ||||
| 2 Perinatal mortality (stillbirth and neonatal mortality) Show forest plot | 2 | 423 | Risk Ratio (M‐H, Fixed, 95% CI) | 0.0 [0.0, 0.0] |
| Analysis 2.2  Comparison 2 Energy‐restricted diet versus no energy‐restricted diet, Outcome 2 Perinatal mortality (stillbirth and neonatal mortality). | ||||
| 3 Hypertensive disorders of pregnancy: pre‐eclampsia Show forest plot | 1 | 117 | Risk Ratio (M‐H, Fixed, 95% CI) | 1.0 [0.51, 1.97] |
| Analysis 2.3  Comparison 2 Energy‐restricted diet versus no energy‐restricted diet, Outcome 3 Hypertensive disorders of pregnancy: pre‐eclampsia. | ||||
| 4 Caesarean section Show forest plot | 2 | 420 | Risk Ratio (M‐H, Fixed, 95% CI) | 1.12 [0.80, 1.56] |
| Analysis 2.4  Comparison 2 Energy‐restricted diet versus no energy‐restricted diet, Outcome 4 Caesarean section. | ||||
| 5 Stillbirth Show forest plot | 2 | 423 | Risk Ratio (M‐H, Fixed, 95% CI) | 0.0 [0.0, 0.0] |
| Analysis 2.5  Comparison 2 Energy‐restricted diet versus no energy‐restricted diet, Outcome 5 Stillbirth. | ||||
| 6 Neonatal mortality Show forest plot | 2 | 423 | Risk Ratio (M‐H, Fixed, 95% CI) | 0.0 [0.0, 0.0] |
| Analysis 2.6  Comparison 2 Energy‐restricted diet versus no energy‐restricted diet, Outcome 6 Neonatal mortality. | ||||
| 7 Gestational age at birth (weeks) Show forest plot | 2 | 423 | Mean Difference (IV, Random, 95% CI) | ‐0.16 [‐0.67, 0.36] |
| Analysis 2.7  Comparison 2 Energy‐restricted diet versus no energy‐restricted diet, Outcome 7 Gestational age at birth (weeks). | ||||
| 8 Macrosomia (> 4000 g) Show forest plot | 2 | 421 | Risk Ratio (M‐H, Fixed, 95% CI) | 0.99 [0.64, 1.53] |
| Analysis 2.8  Comparison 2 Energy‐restricted diet versus no energy‐restricted diet, Outcome 8 Macrosomia (> 4000 g). | ||||
| 9 Macrosomia (> 4500 g) Show forest plot | 1 | 299 | Risk Ratio (M‐H, Fixed, 95% CI) | 1.01 [0.33, 3.05] |
| Analysis 2.9  Comparison 2 Energy‐restricted diet versus no energy‐restricted diet, Outcome 9 Macrosomia (> 4500 g). | ||||
| 10 Birthweight (g) Show forest plot | 1 | 299 | Mean Difference (IV, Fixed, 95% CI) | ‐107.0 [‐240.32, 26.32] |
| Analysis 2.10  Comparison 2 Energy‐restricted diet versus no energy‐restricted diet, Outcome 10 Birthweight (g). | ||||
| 11 Shoulder dystocia Show forest plot | 2 | 418 | Risk Ratio (M‐H, Fixed, 95% CI) | 0.12 [0.01, 2.26] |
| Analysis 2.11  Comparison 2 Energy‐restricted diet versus no energy‐restricted diet, Outcome 11 Shoulder dystocia. | ||||
| 12 Bone fracture Show forest plot | 1 | 299 | Risk Ratio (M‐H, Fixed, 95% CI) | 0.0 [0.0, 0.0] |
| Analysis 2.12  Comparison 2 Energy‐restricted diet versus no energy‐restricted diet, Outcome 12 Bone fracture. | ||||
| 13 Nerve palsy Show forest plot | 1 | 299 | Risk Ratio (M‐H, Fixed, 95% CI) | 0.0 [0.0, 0.0] |
| Analysis 2.13  Comparison 2 Energy‐restricted diet versus no energy‐restricted diet, Outcome 13 Nerve palsy. | ||||
| 14 Neonatal hypoglycaemia Show forest plot | 2 | 408 | Risk Ratio (M‐H, Random, 95% CI) | 1.06 [0.48, 2.32] |
| Analysis 2.14  Comparison 2 Energy‐restricted diet versus no energy‐restricted diet, Outcome 14 Neonatal hypoglycaemia. | ||||
| 15 Neonatal hyperbilirubinemia Show forest plot | 1 | 299 | Risk Ratio (M‐H, Fixed, 95% CI) | 0.81 [0.33, 1.98] |
| Analysis 2.15  Comparison 2 Energy‐restricted diet versus no energy‐restricted diet, Outcome 15 Neonatal hyperbilirubinemia. | ||||
| 16 Neonatal hypocalcaemia Show forest plot | 1 | 299 | Risk Ratio (M‐H, Fixed, 95% CI) | 1.36 [1.00, 1.86] |
| Analysis 2.16  Comparison 2 Energy‐restricted diet versus no energy‐restricted diet, Outcome 16 Neonatal hypocalcaemia. | ||||
| 17 Normal vaginal birth Show forest plot | 2 | 420 | Risk Ratio (M‐H, Fixed, 95% CI) | 0.96 [0.86, 1.08] |
| Analysis 2.17  Comparison 2 Energy‐restricted diet versus no energy‐restricted diet, Outcome 17 Normal vaginal birth. | ||||
| 18 Operative vaginal birth Show forest plot | 1 | 121 | Risk Ratio (M‐H, Fixed, 95% CI) | 0.98 [0.38, 2.54] |
| Analysis 2.18  Comparison 2 Energy‐restricted diet versus no energy‐restricted diet, Outcome 18 Operative vaginal birth. | ||||
| 19 Induction of labour Show forest plot | 1 | 114 | Risk Ratio (M‐H, Fixed, 95% CI) | 1.02 [0.68, 1.53] |
| Analysis 2.19  Comparison 2 Energy‐restricted diet versus no energy‐restricted diet, Outcome 19 Induction of labour. | ||||
| 20 Gestational weight gain (kg) Show forest plot | 1 | 117 | Mean Difference (IV, Fixed, 95% CI) | 1.88 [‐1.96, 5.72] |
| Analysis 2.20  Comparison 2 Energy‐restricted diet versus no energy‐restricted diet, Outcome 20 Gestational weight gain (kg). | ||||
| 21 Gestational weight gain: weight at birth (kg) Show forest plot | 1 | 299 | Mean Difference (IV, Fixed, 95% CI) | ‐3.15 [‐7.29, 0.99] |
| Analysis 2.21 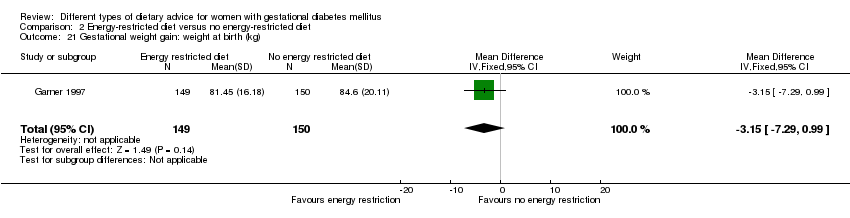 Comparison 2 Energy‐restricted diet versus no energy‐restricted diet, Outcome 21 Gestational weight gain: weight at birth (kg). | ||||
| 22 Insulin sensitivity: during intervention fasting plasma insulin (pM) Show forest plot | 1 | 12 | Mean Difference (IV, Fixed, 95% CI) | 100.0 [‐26.02, 226.02] |
| Analysis 2.22 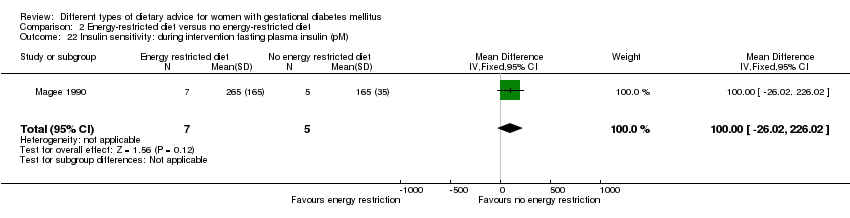 Comparison 2 Energy‐restricted diet versus no energy‐restricted diet, Outcome 22 Insulin sensitivity: during intervention fasting plasma insulin (pM). | ||||
| 23 Insulin sensitivity: end of intervention fasting plasma insulin (pM) Show forest plot | 1 | 12 | Mean Difference (IV, Fixed, 95% CI) | ‐20.0 [‐127.70, 87.70] |
| Analysis 2.23  Comparison 2 Energy‐restricted diet versus no energy‐restricted diet, Outcome 23 Insulin sensitivity: end of intervention fasting plasma insulin (pM). | ||||
| 24 Use of additional pharmacotherapy Show forest plot | 2 | Risk Ratio (M‐H, Random, 95% CI) | Subtotals only | |
| Analysis 2.24  Comparison 2 Energy‐restricted diet versus no energy‐restricted diet, Outcome 24 Use of additional pharmacotherapy. | ||||
| 25 Glycaemic control: during intervention preprandial/fasting glucose (mmol/L) Show forest plot | 2 | 311 | Mean Difference (IV, Random, 95% CI) | 0.21 [‐0.58, 0.99] |
| Analysis 2.25  Comparison 2 Energy‐restricted diet versus no energy‐restricted diet, Outcome 25 Glycaemic control: during intervention preprandial/fasting glucose (mmol/L). | ||||
| 26 Glycaemic control: during intervention 24 hour mean plasma glucose (mmol/L) Show forest plot | 1 | 12 | Mean Difference (IV, Fixed, 95% CI) | 0.10 [‐0.82, 1.02] |
| Analysis 2.26 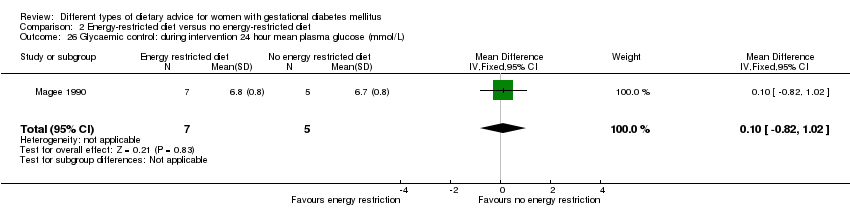 Comparison 2 Energy‐restricted diet versus no energy‐restricted diet, Outcome 26 Glycaemic control: during intervention 24 hour mean plasma glucose (mmol/L). | ||||
| 27 Glycaemic control: during intervention 1 hour postprandial glucose (mmol/L) Show forest plot | 1 | 299 | Mean Difference (IV, Fixed, 95% CI) | ‐0.25 [‐0.68, 0.18] |
| Analysis 2.27  Comparison 2 Energy‐restricted diet versus no energy‐restricted diet, Outcome 27 Glycaemic control: during intervention 1 hour postprandial glucose (mmol/L). | ||||
| 28 Glycaemic control: end of intervention preprandial/fasting glucose (mmol/L) Show forest plot | 2 | 311 | Mean Difference (IV, Fixed, 95% CI) | ‐0.23 [‐0.44, ‐0.03] |
| Analysis 2.28  Comparison 2 Energy‐restricted diet versus no energy‐restricted diet, Outcome 28 Glycaemic control: end of intervention preprandial/fasting glucose (mmol/L). | ||||
| 29 Glycaemic control: end of intervention 24‐hour mean plasma glucose (mmol/L) Show forest plot | 1 | 12 | Mean Difference (IV, Fixed, 95% CI) | ‐1.30 [‐2.25, ‐0.35] |
| Analysis 2.29  Comparison 2 Energy‐restricted diet versus no energy‐restricted diet, Outcome 29 Glycaemic control: end of intervention 24‐hour mean plasma glucose (mmol/L). | ||||
| 30 Glycaemic control: end of intervention 1‐hour postprandial glucose (mmol/L) Show forest plot | 1 | 299 | Mean Difference (IV, Fixed, 95% CI) | ‐0.51 [‐0.89, ‐0.13] |
| Analysis 2.30  Comparison 2 Energy‐restricted diet versus no energy‐restricted diet, Outcome 30 Glycaemic control: end of intervention 1‐hour postprandial glucose (mmol/L). | ||||
| 31 Glycaemic control: during/at end of intervention fasting glucose (mmol/L) Show forest plot | 1 | 117 | Mean Difference (IV, Fixed, 95% CI) | 0.10 [‐0.18, 0.38] |
| Analysis 2.31  Comparison 2 Energy‐restricted diet versus no energy‐restricted diet, Outcome 31 Glycaemic control: during/at end of intervention fasting glucose (mmol/L). | ||||
| 32 Glycaemic control: during/at end of intervention mean plasma glucose (mmol/L) Show forest plot | 1 | 117 | Mean Difference (IV, Fixed, 95% CI) | 0.10 [‐0.34, 0.54] |
| Analysis 2.32 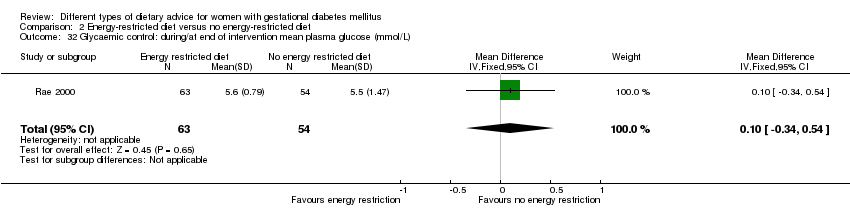 Comparison 2 Energy‐restricted diet versus no energy‐restricted diet, Outcome 32 Glycaemic control: during/at end of intervention mean plasma glucose (mmol/L). | ||||
| 33 Glycaemic control: during/at end of intervention mean HbA1c (%) Show forest plot | 1 | 117 | Mean Difference (IV, Fixed, 95% CI) | ‐0.20 [‐0.64, 0.24] |
| Analysis 2.33  Comparison 2 Energy‐restricted diet versus no energy‐restricted diet, Outcome 33 Glycaemic control: during/at end of intervention mean HbA1c (%). | ||||
| Outcome or subgroup title | No. of studies | No. of participants | Statistical method | Effect size |
| 1 Hypertensive disorders of pregnancy: pre‐eclampsia Show forest plot | 3 | 136 | Risk Ratio (M‐H, Fixed, 95% CI) | 1.0 [0.31, 3.26] |
| Analysis 3.1  Comparison 3 DASH diet versus control diet with matching macronutrient contents, Outcome 1 Hypertensive disorders of pregnancy: pre‐eclampsia. | ||||
| 2 Caesarean section Show forest plot | 2 | 86 | Risk Ratio (M‐H, Fixed, 95% CI) | 0.53 [0.37, 0.76] |
| Analysis 3.2  Comparison 3 DASH diet versus control diet with matching macronutrient contents, Outcome 2 Caesarean section. | ||||
| 3 Gestational age at birth (weeks) Show forest plot | 1 | 52 | Mean Difference (IV, Fixed, 95% CI) | 0.20 [‐0.45, 0.85] |
| Analysis 3.3  Comparison 3 DASH diet versus control diet with matching macronutrient contents, Outcome 3 Gestational age at birth (weeks). | ||||
| 4 Macrosomia (≥ 4000 g) Show forest plot | 1 | 52 | Risk Ratio (M‐H, Fixed, 95% CI) | 0.1 [0.01, 0.73] |
| Analysis 3.4  Comparison 3 DASH diet versus control diet with matching macronutrient contents, Outcome 4 Macrosomia (≥ 4000 g). | ||||
| 5 Birthweight (g) Show forest plot | 2 | 86 | Mean Difference (IV, Fixed, 95% CI) | ‐581.27 [‐790.32, ‐372.22] |
| Analysis 3.5  Comparison 3 DASH diet versus control diet with matching macronutrient contents, Outcome 5 Birthweight (g). | ||||
| 6 Head circumference at birth (cm) Show forest plot | 1 | 52 | Mean Difference (IV, Fixed, 95% CI) | ‐0.90 [‐1.44, ‐0.36] |
| Analysis 3.6  Comparison 3 DASH diet versus control diet with matching macronutrient contents, Outcome 6 Head circumference at birth (cm). | ||||
| 7 Length at birth(cm) Show forest plot | 1 | 52 | Mean Difference (IV, Fixed, 95% CI) | ‐0.5 [‐1.59, 0.59] |
| Analysis 3.7  Comparison 3 DASH diet versus control diet with matching macronutrient contents, Outcome 7 Length at birth(cm). | ||||
| 8 Ponderal index at birth (kg/m³) Show forest plot | 1 | 52 | Mean Difference (IV, Fixed, 95% CI) | ‐0.37 [‐0.54, ‐0.20] |
| Analysis 3.8  Comparison 3 DASH diet versus control diet with matching macronutrient contents, Outcome 8 Ponderal index at birth (kg/m³). | ||||
| 9 Placental abruption Show forest plot | 1 | 58 | Risk Ratio (M‐H, Fixed, 95% CI) | 3.0 [0.13, 70.74] |
| Analysis 3.9  Comparison 3 DASH diet versus control diet with matching macronutrient contents, Outcome 9 Placental abruption. | ||||
| 10 Gestational weight gain: BMI at end of intervention (kg/m²) Show forest plot | 2 | 66 | Mean Difference (IV, Random, 95% CI) | ‐0.83 [‐3.76, 2.11] |
| Analysis 3.10  Comparison 3 DASH diet versus control diet with matching macronutrient contents, Outcome 10 Gestational weight gain: BMI at end of intervention (kg/m²). | ||||
| 11 Gestational weight gain: weight at end of intervention (kg) Show forest plot | 2 | 66 | Mean Difference (IV, Fixed, 95% CI) | ‐2.88 [‐8.48, 2.71] |
| Analysis 3.11  Comparison 3 DASH diet versus control diet with matching macronutrient contents, Outcome 11 Gestational weight gain: weight at end of intervention (kg). | ||||
| 12 Insulin sensitivity: end of intervention HOMA‐IR Show forest plot | 1 | 32 | Mean Difference (IV, Fixed, 95% CI) | 1.00 [‐1.34, ‐0.66] |
| Analysis 3.12  Comparison 3 DASH diet versus control diet with matching macronutrient contents, Outcome 12 Insulin sensitivity: end of intervention HOMA‐IR. | ||||
| 13 Insulin sensitivity: end of intervention insulin (µIU/mL) Show forest plot | 1 | 32 | Mean Difference (IV, Fixed, 95% CI) | ‐3.26 [‐4.42, ‐2.10] |
| Analysis 3.13  Comparison 3 DASH diet versus control diet with matching macronutrient contents, Outcome 13 Insulin sensitivity: end of intervention insulin (µIU/mL). | ||||
| 14 Use of additional pharmacotherapy Show forest plot | 2 | 86 | Risk Ratio (M‐H, Fixed, 95% CI) | 0.28 [0.14, 0.53] |
| Analysis 3.14  Comparison 3 DASH diet versus control diet with matching macronutrient contents, Outcome 14 Use of additional pharmacotherapy. | ||||
| 15 Glycaemic control: end of intervention fasting blood glucose (mmol/L) Show forest plot | 2 | 66 | Mean Difference (IV, Fixed, 95% CI) | ‐0.42 [‐0.53, ‐0.32] |
| Analysis 3.15  Comparison 3 DASH diet versus control diet with matching macronutrient contents, Outcome 15 Glycaemic control: end of intervention fasting blood glucose (mmol/L). | ||||
| 16 Glycaemic control: at end of intervention HbA1c (%) Show forest plot | 1 | 34 | Mean Difference (IV, Fixed, 95% CI) | ‐0.25 [‐0.76, 0.26] |
| Analysis 3.16  Comparison 3 DASH diet versus control diet with matching macronutrient contents, Outcome 16 Glycaemic control: at end of intervention HbA1c (%). | ||||
| Outcome or subgroup title | No. of studies | No. of participants | Statistical method | Effect size |
| 1 Large‐for‐gestational age Show forest plot | 1 | 149 | Risk Ratio (M‐H, Fixed, 95% CI) | 0.51 [0.13, 1.95] |
| Analysis 4.1  Comparison 4 Low‐carbohydrate diet versus high‐carbohydrate diet, Outcome 1 Large‐for‐gestational age. | ||||
| 2 Perinatal mortality (stillbirth and neonatal mortality) Show forest plot | 1 | 150 | Risk Ratio (M‐H, Fixed, 95% CI) | 3.0 [0.12, 72.49] |
| Analysis 4.2  Comparison 4 Low‐carbohydrate diet versus high‐carbohydrate diet, Outcome 2 Perinatal mortality (stillbirth and neonatal mortality). | ||||
| 3 Hypertensive disorders of pregnancy: maternal hypertension Show forest plot | 1 | 150 | Risk Ratio (M‐H, Fixed, 95% CI) | 0.4 [0.13, 1.22] |
| Analysis 4.3  Comparison 4 Low‐carbohydrate diet versus high‐carbohydrate diet, Outcome 3 Hypertensive disorders of pregnancy: maternal hypertension. | ||||
| 4 Caesarean section Show forest plot | 2 | 179 | Risk Ratio (M‐H, Fixed, 95% CI) | 1.29 [0.84, 1.99] |
| Analysis 4.4  Comparison 4 Low‐carbohydrate diet versus high‐carbohydrate diet, Outcome 4 Caesarean section. | ||||
| 5 Stillbirth Show forest plot | 1 | 150 | Risk Ratio (M‐H, Fixed, 95% CI) | 3.0 [0.12, 72.49] |
| Analysis 4.5  Comparison 4 Low‐carbohydrate diet versus high‐carbohydrate diet, Outcome 5 Stillbirth. | ||||
| 6 Gestational age at birth (weeks) Show forest plot | 2 | 180 | Mean Difference (IV, Fixed, 95% CI) | 0.10 [‐0.42, 0.62] |
| Analysis 4.6  Comparison 4 Low‐carbohydrate diet versus high‐carbohydrate diet, Outcome 6 Gestational age at birth (weeks). | ||||
| 7 Macrosomia (> 4000 g) Show forest plot | 2 | 179 | Risk Ratio (M‐H, Fixed, 95% CI) | 0.20 [0.02, 1.69] |
| Analysis 4.7 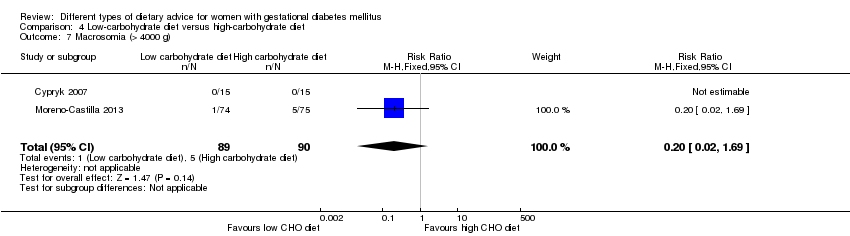 Comparison 4 Low‐carbohydrate diet versus high‐carbohydrate diet, Outcome 7 Macrosomia (> 4000 g). | ||||
| 8 Small‐for‐gestational age Show forest plot | 1 | 149 | Risk Ratio (M‐H, Fixed, 95% CI) | 0.68 [0.29, 1.56] |
| Analysis 4.8 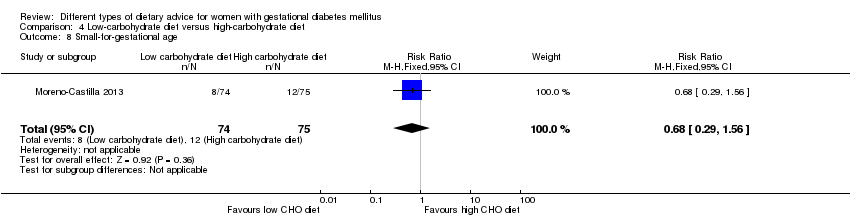 Comparison 4 Low‐carbohydrate diet versus high‐carbohydrate diet, Outcome 8 Small‐for‐gestational age. | ||||
| 9 Birthweight (g) Show forest plot | 1 | 30 | Mean Difference (IV, Fixed, 95% CI) | 22.0 [‐241.06, 285.06] |
| Analysis 4.9  Comparison 4 Low‐carbohydrate diet versus high‐carbohydrate diet, Outcome 9 Birthweight (g). | ||||
| 10 Neonatal hypoglycaemia Show forest plot | 1 | 149 | Risk Ratio (M‐H, Fixed, 95% CI) | 0.91 [0.39, 2.12] |
| Analysis 4.10  Comparison 4 Low‐carbohydrate diet versus high‐carbohydrate diet, Outcome 10 Neonatal hypoglycaemia. | ||||
| 11 Normal vaginal birth Show forest plot | 1 | 30 | Risk Ratio (M‐H, Fixed, 95% CI) | 0.78 [0.39, 1.54] |
| Analysis 4.11  Comparison 4 Low‐carbohydrate diet versus high‐carbohydrate diet, Outcome 11 Normal vaginal birth. | ||||
| 12 Operative vaginal birth Show forest plot | 1 | 30 | Risk Ratio (M‐H, Fixed, 95% CI) | 1.0 [0.07, 14.55] |
| Analysis 4.12  Comparison 4 Low‐carbohydrate diet versus high‐carbohydrate diet, Outcome 12 Operative vaginal birth. | ||||
| 13 Gestational weight gain: maternal weight gain (kg) Show forest plot | 1 | 145 | Mean Difference (IV, Fixed, 95% CI) | ‐0.90 [‐1.60, ‐0.20] |
| Analysis 4.13  Comparison 4 Low‐carbohydrate diet versus high‐carbohydrate diet, Outcome 13 Gestational weight gain: maternal weight gain (kg). | ||||
| 14 Adherence to dietary intervention: fully applied the recommended menu Show forest plot | 1 | 30 | Risk Ratio (M‐H, Fixed, 95% CI) | 1.09 [0.73, 1.62] |
| Analysis 4.14  Comparison 4 Low‐carbohydrate diet versus high‐carbohydrate diet, Outcome 14 Adherence to dietary intervention: fully applied the recommended menu. | ||||
| 15 Use of additional pharmacotherapy. Show forest plot | 2 | 180 | Risk Ratio (M‐H, Fixed, 95% CI) | 1.02 [0.77, 1.37] |
| Analysis 4.15  Comparison 4 Low‐carbohydrate diet versus high‐carbohydrate diet, Outcome 15 Use of additional pharmacotherapy.. | ||||
| 16 Glycaemic control: end of intervention fasting blood glucose (mg/dL) Show forest plot | 1 | 30 | Mean Difference (IV, Fixed, 95% CI) | 5.0 [‐0.01, 10.01] |
| Analysis 4.16  Comparison 4 Low‐carbohydrate diet versus high‐carbohydrate diet, Outcome 16 Glycaemic control: end of intervention fasting blood glucose (mg/dL). | ||||
| 17 Glycaemic control: end of intervention 2‐hour post breakfast blood glucose (mg/dL) Show forest plot | 1 | 30 | Mean Difference (IV, Fixed, 95% CI) | 5.0 [‐1.60, 11.60] |
| Analysis 4.17  Comparison 4 Low‐carbohydrate diet versus high‐carbohydrate diet, Outcome 17 Glycaemic control: end of intervention 2‐hour post breakfast blood glucose (mg/dL). | ||||
| 18 Glycaemic control: end of intervention 2‐hour post lunch blood glucose (mg/dL) Show forest plot | 1 | 30 | Mean Difference (IV, Fixed, 95% CI) | 3.0 [‐2.77, 8.77] |
| Analysis 4.18  Comparison 4 Low‐carbohydrate diet versus high‐carbohydrate diet, Outcome 18 Glycaemic control: end of intervention 2‐hour post lunch blood glucose (mg/dL). | ||||
| 19 Glycaemic control: end of intervention 2‐hour post dinner blood glucose (mg/dL) Show forest plot | 1 | 30 | Mean Difference (IV, Fixed, 95% CI) | 6.0 [‐1.47, 13.47] |
| Analysis 4.19  Comparison 4 Low‐carbohydrate diet versus high‐carbohydrate diet, Outcome 19 Glycaemic control: end of intervention 2‐hour post dinner blood glucose (mg/dL). | ||||
| Outcome or subgroup title | No. of studies | No. of participants | Statistical method | Effect size |
| 1 Large‐for‐gestational age Show forest plot | 1 | 27 | Risk Ratio (M‐H, Fixed, 95% CI) | 0.54 [0.21, 1.37] |
| Analysis 5.1  Comparison 5 High unsaturated fat diet versus low unsaturated fat diet with matching calories, Outcome 1 Large‐for‐gestational age. | ||||
| 2 Hypertensive disorders of pregnancy: pre‐eclampsia Show forest plot | 1 | 27 | Risk Ratio (M‐H, Fixed, 95% CI) | 0.0 [0.0, 0.0] |
| Analysis 5.2  Comparison 5 High unsaturated fat diet versus low unsaturated fat diet with matching calories, Outcome 2 Hypertensive disorders of pregnancy: pre‐eclampsia. | ||||
| 3 Hypertensive disorders of pregnancy: hypertension in pregnancy Show forest plot | 1 | 27 | Risk Ratio (M‐H, Fixed, 95% CI) | 0.54 [0.06, 5.26] |
| Analysis 5.3  Comparison 5 High unsaturated fat diet versus low unsaturated fat diet with matching calories, Outcome 3 Hypertensive disorders of pregnancy: hypertension in pregnancy. | ||||
| 4 Caesarean section Show forest plot | 1 | 27 | Risk Ratio (M‐H, Fixed, 95% CI) | 1.08 [0.07, 15.50] |
| Analysis 5.4 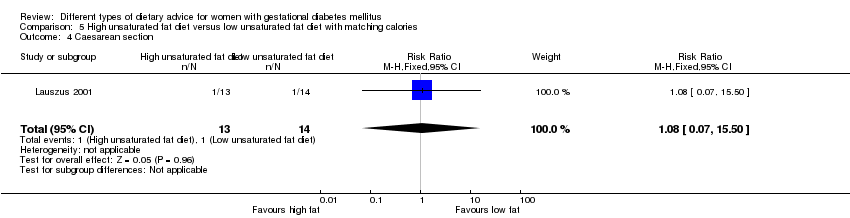 Comparison 5 High unsaturated fat diet versus low unsaturated fat diet with matching calories, Outcome 4 Caesarean section. | ||||
| 5 Type 2 diabetes: 'diabetic' OGTT 1‐2 weeks postpartum Show forest plot | 1 | 24 | Risk Ratio (M‐H, Fixed, 95% CI) | 2.0 [0.45, 8.94] |
| Analysis 5.5  Comparison 5 High unsaturated fat diet versus low unsaturated fat diet with matching calories, Outcome 5 Type 2 diabetes: 'diabetic' OGTT 1‐2 weeks postpartum. | ||||
| 6 Type 2 diabetes: 'diabetic' OGTT 4‐13 months postpartum Show forest plot | 1 | 6 | Risk Ratio (M‐H, Fixed, 95% CI) | 1.0 [0.10, 9.61] |
| Analysis 5.6  Comparison 5 High unsaturated fat diet versus low unsaturated fat diet with matching calories, Outcome 6 Type 2 diabetes: 'diabetic' OGTT 4‐13 months postpartum. | ||||
| 7 Gestational age at birth (weeks) Show forest plot | 2 | 111 | Mean Difference (IV, Fixed, 95% CI) | 0.25 [‐0.51, 1.01] |
| Analysis 5.7  Comparison 5 High unsaturated fat diet versus low unsaturated fat diet with matching calories, Outcome 7 Gestational age at birth (weeks). | ||||
| 8 Preterm birth Show forest plot | 1 | 84 | Risk Ratio (M‐H, Fixed, 95% CI) | 0.0 [0.0, 0.0] |
| Analysis 5.8  Comparison 5 High unsaturated fat diet versus low unsaturated fat diet with matching calories, Outcome 8 Preterm birth. | ||||
| 9 Macrosomia (> 4000 g) Show forest plot | 2 | 111 | Risk Ratio (M‐H, Fixed, 95% CI) | 0.53 [0.18, 1.56] |
| Analysis 5.9  Comparison 5 High unsaturated fat diet versus low unsaturated fat diet with matching calories, Outcome 9 Macrosomia (> 4000 g). | ||||
| 10 Birthweight (g) Show forest plot | 2 | 111 | Mean Difference (IV, Fixed, 95% CI) | ‐138.19 [‐292.59, 16.21] |
| Analysis 5.10  Comparison 5 High unsaturated fat diet versus low unsaturated fat diet with matching calories, Outcome 10 Birthweight (g). | ||||
| 11 Placental abruption Show forest plot | 1 | 27 | Risk Ratio (M‐H, Fixed, 95% CI) | 0.0 [0.0, 0.0] |
| Analysis 5.11 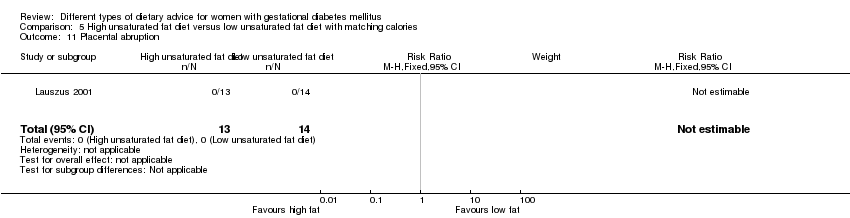 Comparison 5 High unsaturated fat diet versus low unsaturated fat diet with matching calories, Outcome 11 Placental abruption. | ||||
| 12 Gestational weight gain (kg) Show forest plot | 1 | 84 | Mean Difference (IV, Fixed, 95% CI) | ‐1.98 [‐4.32, 0.36] |
| Analysis 5.12 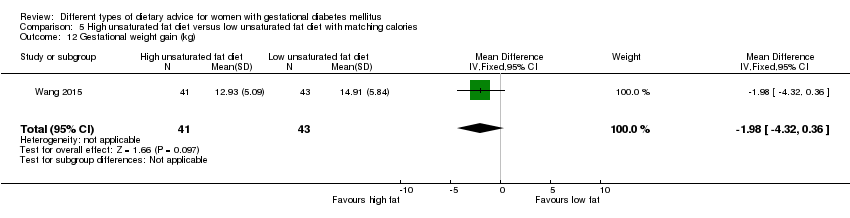 Comparison 5 High unsaturated fat diet versus low unsaturated fat diet with matching calories, Outcome 12 Gestational weight gain (kg). | ||||
| 13 Gestational weight gain: BMI at birth (kg/m²) Show forest plot | 1 | 27 | Mean Difference (IV, Fixed, 95% CI) | 3.90 [2.41, 5.39] |
| Analysis 5.13  Comparison 5 High unsaturated fat diet versus low unsaturated fat diet with matching calories, Outcome 13 Gestational weight gain: BMI at birth (kg/m²). | ||||
| 14 Gestational weight gain: weight at birth (kg) Show forest plot | 1 | 27 | Mean Difference (IV, Fixed, 95% CI) | 11.90 [7.47, 16.33] |
| Analysis 5.14 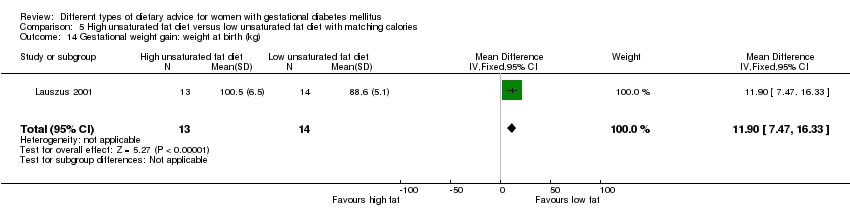 Comparison 5 High unsaturated fat diet versus low unsaturated fat diet with matching calories, Outcome 14 Gestational weight gain: weight at birth (kg). | ||||
| 15 Insulin sensitivity: during intervention (38 week) insulin (mU/L) Show forest plot | 1 | 24 | Mean Difference (IV, Fixed, 95% CI) | 4.40 [2.59, 6.21] |
| Analysis 5.15 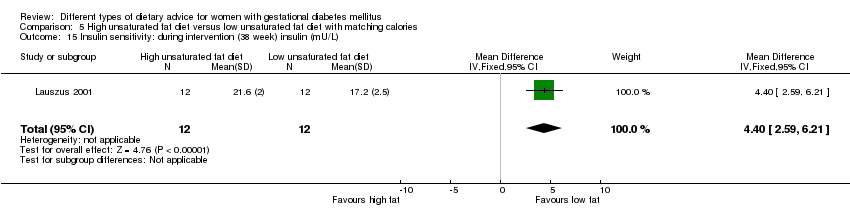 Comparison 5 High unsaturated fat diet versus low unsaturated fat diet with matching calories, Outcome 15 Insulin sensitivity: during intervention (38 week) insulin (mU/L). | ||||
| 16 Insulin sensitivity: during intervention (38 week) insulin sensitivity (10‐5 min‐1 per mU/L min) Show forest plot | 1 | 24 | Mean Difference (IV, Fixed, 95% CI) | ‐0.08 [‐0.21, 0.05] |
| Analysis 5.16  Comparison 5 High unsaturated fat diet versus low unsaturated fat diet with matching calories, Outcome 16 Insulin sensitivity: during intervention (38 week) insulin sensitivity (10‐5 min‐1 per mU/L min). | ||||
| 17 Insulin sensitivity: end of intervention IAI Show forest plot | 1 | 84 | Mean Difference (IV, Fixed, 95% CI) | 0.04 [‐0.28, 0.36] |
| Analysis 5.17  Comparison 5 High unsaturated fat diet versus low unsaturated fat diet with matching calories, Outcome 17 Insulin sensitivity: end of intervention IAI. | ||||
| 18 Use of additional pharmacotherapy Show forest plot | 2 | 111 | Risk Ratio (M‐H, Fixed, 95% CI) | 0.0 [0.0, 0.0] |
| Analysis 5.18  Comparison 5 High unsaturated fat diet versus low unsaturated fat diet with matching calories, Outcome 18 Use of additional pharmacotherapy. | ||||
| 19 Glycaemic control: during intervention (38 week) fasting blood glucose (mmol/L) Show forest plot | 1 | 24 | Mean Difference (IV, Fixed, 95% CI) | 0.5 [0.30, 0.70] |
| Analysis 5.19  Comparison 5 High unsaturated fat diet versus low unsaturated fat diet with matching calories, Outcome 19 Glycaemic control: during intervention (38 week) fasting blood glucose (mmol/L). | ||||
| 20 Glycaemic control: during intervention (38 week) postprandial glucose (mmol/L) Show forest plot | 1 | 25 | Mean Difference (IV, Fixed, 95% CI) | 0.90 [0.58, 1.22] |
| Analysis 5.20  Comparison 5 High unsaturated fat diet versus low unsaturated fat diet with matching calories, Outcome 20 Glycaemic control: during intervention (38 week) postprandial glucose (mmol/L). | ||||
| 21 Glycaemic control: during intervention (38 week) HbA1c (%) Show forest plot | 1 | 25 | Mean Difference (IV, Fixed, 95% CI) | 0.40 [0.32, 0.48] |
| Analysis 5.21 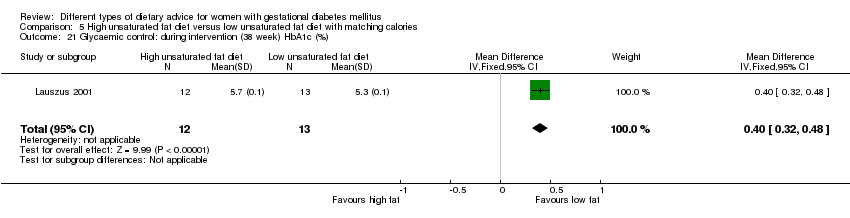 Comparison 5 High unsaturated fat diet versus low unsaturated fat diet with matching calories, Outcome 21 Glycaemic control: during intervention (38 week) HbA1c (%). | ||||
| 22 Glycaemic control: end of intervention fasting blood glucose (mmol/L) Show forest plot | 1 | 84 | Mean Difference (IV, Fixed, 95% CI) | 0.18 [‐0.17, 0.53] |
| Analysis 5.22  Comparison 5 High unsaturated fat diet versus low unsaturated fat diet with matching calories, Outcome 22 Glycaemic control: end of intervention fasting blood glucose (mmol/L). | ||||
| 23 Glycaemic control: end of intervention 2‐hour postprandial blood glucose (mmol/L) Show forest plot | 1 | 84 | Mean Difference (IV, Fixed, 95% CI) | ‐0.02 [‐0.29, 0.25] |
| Analysis 5.23  Comparison 5 High unsaturated fat diet versus low unsaturated fat diet with matching calories, Outcome 23 Glycaemic control: end of intervention 2‐hour postprandial blood glucose (mmol/L). | ||||
| 24 BMI 5‐9 months postpartum (kg/m²) Show forest plot | 1 | 27 | Mean Difference (IV, Fixed, 95% CI) | 4.10 [2.34, 5.86] |
| Analysis 5.24 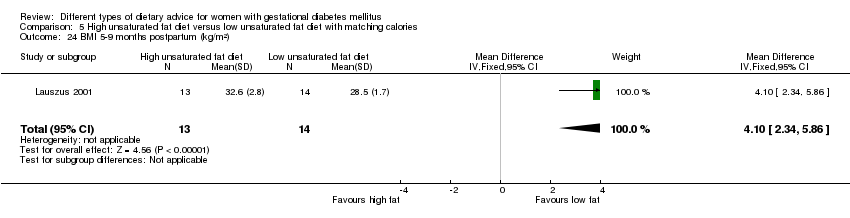 Comparison 5 High unsaturated fat diet versus low unsaturated fat diet with matching calories, Outcome 24 BMI 5‐9 months postpartum (kg/m²). | ||||
| 25 Impaired glucose tolerance: 'borderline' OGTT 1‐2 weeks postpartum Show forest plot | 1 | 24 | Risk Ratio (M‐H, Fixed, 95% CI) | 1.5 [0.30, 7.43] |
| Analysis 5.25  Comparison 5 High unsaturated fat diet versus low unsaturated fat diet with matching calories, Outcome 25 Impaired glucose tolerance: 'borderline' OGTT 1‐2 weeks postpartum. | ||||
| 26 Impaired glucose tolerance: 'borderline' OGTT 4‐13 months postpartum Show forest plot | 1 | 7 | Risk Ratio (M‐H, Fixed, 95% CI) | 0.27 [0.01, 4.93] |
| Analysis 5.26  Comparison 5 High unsaturated fat diet versus low unsaturated fat diet with matching calories, Outcome 26 Impaired glucose tolerance: 'borderline' OGTT 4‐13 months postpartum. | ||||
| Outcome or subgroup title | No. of studies | No. of participants | Statistical method | Effect size | ||||||||||||||||||||||||||||||||
| 1 Large‐for‐gestational age Show forest plot | 1 | 92 | Risk Ratio (M‐H, Fixed, 95% CI) | 2.87 [0.61, 13.50] | ||||||||||||||||||||||||||||||||
| Analysis 6.1  Comparison 6 Low‐GI diet versus high‐fibre moderate‐GI diet, Outcome 1 Large‐for‐gestational age. | ||||||||||||||||||||||||||||||||||||
| 2 Caesarean section Show forest plot | 1 | 92 | Risk Ratio (M‐H, Fixed, 95% CI) | 1.91 [0.91, 4.03] | ||||||||||||||||||||||||||||||||
| Analysis 6.2  Comparison 6 Low‐GI diet versus high‐fibre moderate‐GI diet, Outcome 2 Caesarean section. | ||||||||||||||||||||||||||||||||||||
| 3 Type 2 diabetes mellitus at 3 months postpartum Show forest plot | 1 | 58 | Risk Ratio (M‐H, Fixed, 95% CI) | 0.76 [0.11, 5.01] | ||||||||||||||||||||||||||||||||
| Analysis 6.3  Comparison 6 Low‐GI diet versus high‐fibre moderate‐GI diet, Outcome 3 Type 2 diabetes mellitus at 3 months postpartum. | ||||||||||||||||||||||||||||||||||||
| 4 Gestational age at birth (weeks) Show forest plot | 1 | 92 | Mean Difference (IV, Fixed, 95% CI) | ‐0.10 [‐0.39, 0.19] | ||||||||||||||||||||||||||||||||
| Analysis 6.4  Comparison 6 Low‐GI diet versus high‐fibre moderate‐GI diet, Outcome 4 Gestational age at birth (weeks). | ||||||||||||||||||||||||||||||||||||
| 5 Preterm birth Show forest plot | 1 | 96 | Risk Ratio (M‐H, Fixed, 95% CI) | 0.96 [0.14, 6.53] | ||||||||||||||||||||||||||||||||
| Analysis 6.5  Comparison 6 Low‐GI diet versus high‐fibre moderate‐GI diet, Outcome 5 Preterm birth. | ||||||||||||||||||||||||||||||||||||
| 6 Macrosomia (> 4000 g) Show forest plot | 1 | 92 | Risk Ratio (M‐H, Fixed, 95% CI) | 0.32 [0.03, 2.96] | ||||||||||||||||||||||||||||||||
| Analysis 6.6  Comparison 6 Low‐GI diet versus high‐fibre moderate‐GI diet, Outcome 6 Macrosomia (> 4000 g). | ||||||||||||||||||||||||||||||||||||
| 7 Small‐for‐gestational age Show forest plot | 1 | 92 | Risk Ratio (M‐H, Fixed, 95% CI) | 1.20 [0.34, 4.18] | ||||||||||||||||||||||||||||||||
| Analysis 6.7 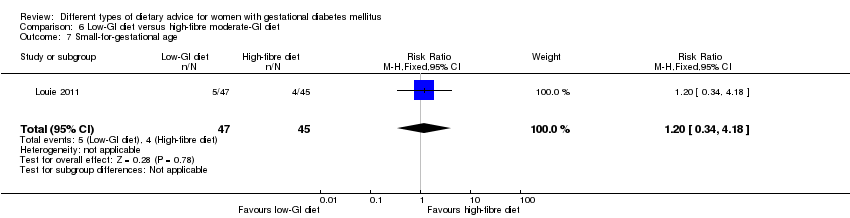 Comparison 6 Low‐GI diet versus high‐fibre moderate‐GI diet, Outcome 7 Small‐for‐gestational age. | ||||||||||||||||||||||||||||||||||||
| 8 Birthweight (g) Show forest plot | 1 | 92 | Mean Difference (IV, Fixed, 95% CI) | 0.0 [‐277.18, 277.18] | ||||||||||||||||||||||||||||||||
| Analysis 6.8  Comparison 6 Low‐GI diet versus high‐fibre moderate‐GI diet, Outcome 8 Birthweight (g). | ||||||||||||||||||||||||||||||||||||
| 9 Head circumference at birth (cm) Show forest plot | 1 | 82 | Mean Difference (IV, Fixed, 95% CI) | ‐0.20 [‐0.91, 0.51] | ||||||||||||||||||||||||||||||||
| Analysis 6.9  Comparison 6 Low‐GI diet versus high‐fibre moderate‐GI diet, Outcome 9 Head circumference at birth (cm). | ||||||||||||||||||||||||||||||||||||
| 10 Length at birth (cm) Show forest plot | 1 | 92 | Mean Difference (IV, Fixed, 95% CI) | 0.0 [‐0.83, 0.83] | ||||||||||||||||||||||||||||||||
| Analysis 6.10  Comparison 6 Low‐GI diet versus high‐fibre moderate‐GI diet, Outcome 10 Length at birth (cm). | ||||||||||||||||||||||||||||||||||||
| 11 Ponderal index at birth (kg/m³) Show forest plot | 1 | 92 | Mean Difference (IV, Fixed, 95% CI) | 0.20 [‐0.79, 1.19] | ||||||||||||||||||||||||||||||||
| Analysis 6.11  Comparison 6 Low‐GI diet versus high‐fibre moderate‐GI diet, Outcome 11 Ponderal index at birth (kg/m³). | ||||||||||||||||||||||||||||||||||||
| 12 Weight and height at 3 months postpartum Show forest plot | Other data | No numeric data | ||||||||||||||||||||||||||||||||||
| Analysis 6.12
Comparison 6 Low‐GI diet versus high‐fibre moderate‐GI diet, Outcome 12 Weight and height at 3 months postpartum. | ||||||||||||||||||||||||||||||||||||
| 12.1 Weight for age percentile (adjusted for breastfeeding status) | Other data | No numeric data | ||||||||||||||||||||||||||||||||||
| 12.2 Length for age percentile (adjusted for breastfeeding status) | Other data | No numeric data | ||||||||||||||||||||||||||||||||||
| 12.3 Weight for length percentile (adjusted for breastfeeding status) | Other data | No numeric data | ||||||||||||||||||||||||||||||||||
| 13 Weight gain during pregnancy (kg) Show forest plot | 1 | 87 | Mean Difference (IV, Fixed, 95% CI) | ‐1.20 [‐3.43, 1.03] | ||||||||||||||||||||||||||||||||
| Analysis 6.13  Comparison 6 Low‐GI diet versus high‐fibre moderate‐GI diet, Outcome 13 Weight gain during pregnancy (kg). | ||||||||||||||||||||||||||||||||||||
| 14 Adherence to dietary intervention Show forest plot | 1 | 92 | Risk Ratio (M‐H, Fixed, 95% CI) | 0.84 [0.64, 1.11] | ||||||||||||||||||||||||||||||||
| Analysis 6.14  Comparison 6 Low‐GI diet versus high‐fibre moderate‐GI diet, Outcome 14 Adherence to dietary intervention. | ||||||||||||||||||||||||||||||||||||
| 15 Insulin sensitivity: end of intervention: HOMA2‐IR (%) Show forest plot | 1 | 77 | Mean Difference (IV, Fixed, 95% CI) | ‐0.10 [‐0.38, 0.18] | ||||||||||||||||||||||||||||||||
| Analysis 6.15 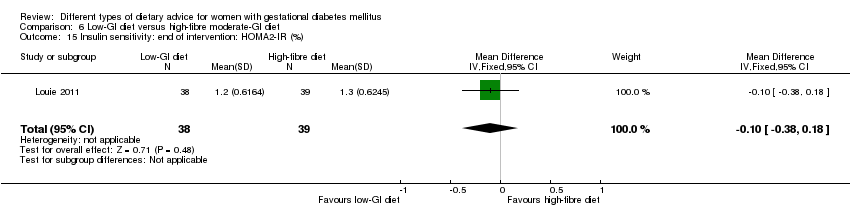 Comparison 6 Low‐GI diet versus high‐fibre moderate‐GI diet, Outcome 15 Insulin sensitivity: end of intervention: HOMA2‐IR (%). | ||||||||||||||||||||||||||||||||||||
| 16 Insulin sensitivity: end of intervention insulin (pmol/L) Show forest plot | 1 | 70 | Mean Difference (IV, Fixed, 95% CI) | 10.80 [‐22.36, 43.96] | ||||||||||||||||||||||||||||||||
| Analysis 6.16  Comparison 6 Low‐GI diet versus high‐fibre moderate‐GI diet, Outcome 16 Insulin sensitivity: end of intervention insulin (pmol/L). | ||||||||||||||||||||||||||||||||||||
| 17 Use of additional pharmacotherapy Show forest plot | 1 | 92 | Risk Ratio (M‐H, Fixed, 95% CI) | 0.83 [0.58, 1.17] | ||||||||||||||||||||||||||||||||
| Analysis 6.17  Comparison 6 Low‐GI diet versus high‐fibre moderate‐GI diet, Outcome 17 Use of additional pharmacotherapy. | ||||||||||||||||||||||||||||||||||||
| 18 Glycaemic control: end of intervention blood glucose (mmol/L) Show forest plot | 1 | 74 | Mean Difference (IV, Fixed, 95% CI) | ‐0.10 [‐0.38, 0.18] | ||||||||||||||||||||||||||||||||
| Analysis 6.18  Comparison 6 Low‐GI diet versus high‐fibre moderate‐GI diet, Outcome 18 Glycaemic control: end of intervention blood glucose (mmol/L). | ||||||||||||||||||||||||||||||||||||
| 19 Glycaemic control: end of intervention HbA1c (%) Show forest plot | Other data | No numeric data | ||||||||||||||||||||||||||||||||||
| Analysis 6.19
Comparison 6 Low‐GI diet versus high‐fibre moderate‐GI diet, Outcome 19 Glycaemic control: end of intervention HbA1c (%). | ||||||||||||||||||||||||||||||||||||
| 20 Return to pre‐pregnancy weight at 3 months postpartum Show forest plot | 1 | 55 | Risk Ratio (M‐H, Fixed, 95% CI) | 1.15 [0.43, 3.07] | ||||||||||||||||||||||||||||||||
| Analysis 6.20 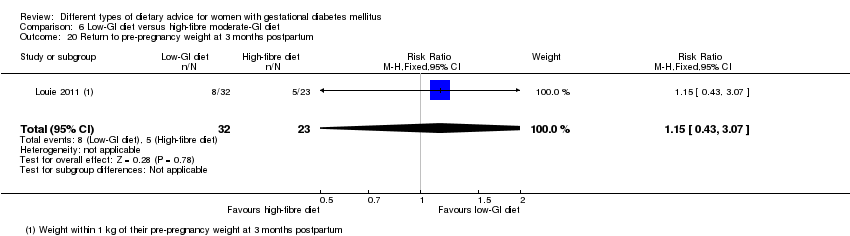 Comparison 6 Low‐GI diet versus high‐fibre moderate‐GI diet, Outcome 20 Return to pre‐pregnancy weight at 3 months postpartum. | ||||||||||||||||||||||||||||||||||||
| 21 BMI at 3 months postpartum (kg/m²) Show forest plot | 1 | 52 | Mean Difference (IV, Fixed, 95% CI) | ‐0.5 [‐2.79, 1.79] | ||||||||||||||||||||||||||||||||
| Analysis 6.21  Comparison 6 Low‐GI diet versus high‐fibre moderate‐GI diet, Outcome 21 BMI at 3 months postpartum (kg/m²). | ||||||||||||||||||||||||||||||||||||
| 22 Impaired glucose tolerance at 3 months postpartum Show forest plot | 1 | 58 | Risk Ratio (M‐H, Fixed, 95% CI) | 1.33 [0.44, 4.04] | ||||||||||||||||||||||||||||||||
| Analysis 6.22  Comparison 6 Low‐GI diet versus high‐fibre moderate‐GI diet, Outcome 22 Impaired glucose tolerance at 3 months postpartum. | ||||||||||||||||||||||||||||||||||||
| 23 Insulin sensitivity at 3 months postpartum (insulin (pmol/L)) Show forest plot | 1 | 55 | Mean Difference (IV, Fixed, 95% CI) | ‐14.20 [‐32.58, 4.18] | ||||||||||||||||||||||||||||||||
| Analysis 6.23  Comparison 6 Low‐GI diet versus high‐fibre moderate‐GI diet, Outcome 23 Insulin sensitivity at 3 months postpartum (insulin (pmol/L)). | ||||||||||||||||||||||||||||||||||||
| 24 Insulin sensitivity at 3 months postpartum (HOMA‐IR (%)) Show forest plot | 1 | 53 | Mean Difference (IV, Fixed, 95% CI) | ‐0.30 [‐0.66, 0.06] | ||||||||||||||||||||||||||||||||
| Analysis 6.24  Comparison 6 Low‐GI diet versus high‐fibre moderate‐GI diet, Outcome 24 Insulin sensitivity at 3 months postpartum (HOMA‐IR (%)). | ||||||||||||||||||||||||||||||||||||
| Outcome or subgroup title | No. of studies | No. of participants | Statistical method | Effect size |
| 1 Large‐for‐gestational age Show forest plot | 1 | 99 | Risk Ratio (M‐H, Fixed, 95% CI) | 0.73 [0.25, 2.14] |
| Analysis 7.1  Comparison 7 Diet recommendation + diet‐related behavioural advice versus diet recommendation only, Outcome 1 Large‐for‐gestational age. | ||||
| 2 Caesarean section Show forest plot | 1 | 99 | Risk Ratio (M‐H, Fixed, 95% CI) | 0.78 [0.38, 1.62] |
| Analysis 7.2  Comparison 7 Diet recommendation + diet‐related behavioural advice versus diet recommendation only, Outcome 2 Caesarean section. | ||||
| 3 Preterm birth (< 37 weeks' gestation) Show forest plot | 1 | 99 | Risk Ratio (M‐H, Fixed, 95% CI) | 0.51 [0.10, 2.66] |
| Analysis 7.3  Comparison 7 Diet recommendation + diet‐related behavioural advice versus diet recommendation only, Outcome 3 Preterm birth (< 37 weeks' gestation). | ||||
| 4 Gestational weight gain: BMI at end of intervention (kg/m²) Show forest plot | 1 | 99 | Mean Difference (IV, Fixed, 95% CI) | 0.0 [‐1.75, 1.75] |
| Analysis 7.4 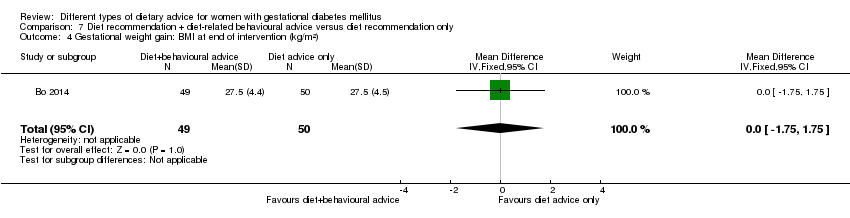 Comparison 7 Diet recommendation + diet‐related behavioural advice versus diet recommendation only, Outcome 4 Gestational weight gain: BMI at end of intervention (kg/m²). | ||||
| 5 Gestational weight gain: weight at end of intervention (kg) Show forest plot | 1 | 99 | Mean Difference (IV, Fixed, 95% CI) | ‐0.10 [‐4.91, 4.71] |
| Analysis 7.5  Comparison 7 Diet recommendation + diet‐related behavioural advice versus diet recommendation only, Outcome 5 Gestational weight gain: weight at end of intervention (kg). | ||||
| 6 Insulin sensitivity: end of intervention HOMA‐IR Show forest plot | 1 | 99 | Mean Difference (IV, Fixed, 95% CI) | ‐0.30 [‐0.77, 0.17] |
| Analysis 7.6  Comparison 7 Diet recommendation + diet‐related behavioural advice versus diet recommendation only, Outcome 6 Insulin sensitivity: end of intervention HOMA‐IR. | ||||
| 7 Insulin sensitivity: end of intervention fasting insulin (µU/mL) Show forest plot | 1 | 99 | Mean Difference (IV, Fixed, 95% CI) | ‐0.5 [‐2.69, 1.69] |
| Analysis 7.7  Comparison 7 Diet recommendation + diet‐related behavioural advice versus diet recommendation only, Outcome 7 Insulin sensitivity: end of intervention fasting insulin (µU/mL). | ||||
| 8 Use of additional pharmacotherapy Show forest plot | 1 | 99 | Risk Ratio (M‐H, Fixed, 95% CI) | 0.61 [0.15, 2.42] |
| Analysis 7.8  Comparison 7 Diet recommendation + diet‐related behavioural advice versus diet recommendation only, Outcome 8 Use of additional pharmacotherapy. | ||||
| 9 Glycaemic control: end of intervention fasting glucose (mg/dL) Show forest plot | 1 | 99 | Mean Difference (IV, Fixed, 95% CI) | 0.0 [‐4.25, 4.25] |
| Analysis 7.9  Comparison 7 Diet recommendation + diet‐related behavioural advice versus diet recommendation only, Outcome 9 Glycaemic control: end of intervention fasting glucose (mg/dL). | ||||
| 10 Glycaemic control: end of intervention postprandial glucose (mg/dL) Show forest plot | 1 | 99 | Mean Difference (IV, Fixed, 95% CI) | ‐9.30 [‐15.58, ‐3.02] |
| Analysis 7.10  Comparison 7 Diet recommendation + diet‐related behavioural advice versus diet recommendation only, Outcome 10 Glycaemic control: end of intervention postprandial glucose (mg/dL). | ||||
| 11 Glycaemic control: end of intervention HbA1c (%) Show forest plot | 1 | 99 | Mean Difference (IV, Fixed, 95% CI) | ‐0.10 [‐0.28, 0.08] |
| Analysis 7.11  Comparison 7 Diet recommendation + diet‐related behavioural advice versus diet recommendation only, Outcome 11 Glycaemic control: end of intervention HbA1c (%). | ||||
| 12 Length of postnatal stay (baby): stay > 4 days Show forest plot | 1 | 99 | Risk Ratio (M‐H, Fixed, 95% CI) | 1.33 [0.73, 2.44] |
| Analysis 7.12 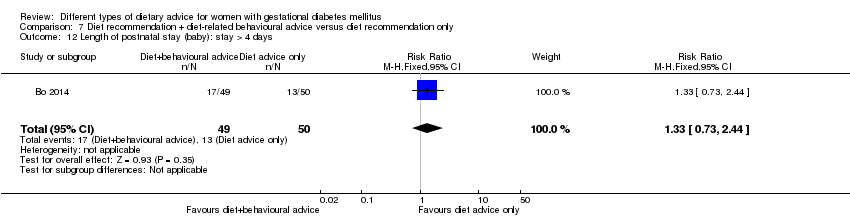 Comparison 7 Diet recommendation + diet‐related behavioural advice versus diet recommendation only, Outcome 12 Length of postnatal stay (baby): stay > 4 days. | ||||
| Outcome or subgroup title | No. of studies | No. of participants | Statistical method | Effect size |
| 1 Hypertensive disorders of pregnancy: pre‐eclampsia Show forest plot | 1 | 68 | Risk Ratio (M‐H, Fixed, 95% CI) | 2.0 [0.19, 21.03] |
| Analysis 8.1  Comparison 8 Soy protein‐enriched diet versus no soy protein diet, Outcome 1 Hypertensive disorders of pregnancy: pre‐eclampsia. | ||||
| 2 Caesarean section Show forest plot | 1 | 68 | Risk Ratio (M‐H, Fixed, 95% CI) | 1.0 [0.57, 1.77] |
| Analysis 8.2  Comparison 8 Soy protein‐enriched diet versus no soy protein diet, Outcome 2 Caesarean section. | ||||
| 3 Gestational age at birth (weeks) Show forest plot | 1 | 68 | Mean Difference (IV, Fixed, 95% CI) | 0.40 [‐0.23, 1.03] |
| Analysis 8.3 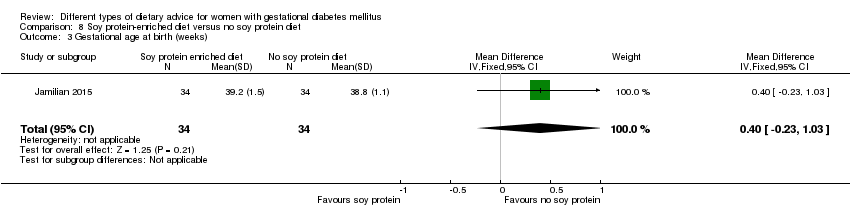 Comparison 8 Soy protein‐enriched diet versus no soy protein diet, Outcome 3 Gestational age at birth (weeks). | ||||
| 4 Preterm birth (< 37 weeks' gestation) Show forest plot | 1 | 68 | Risk Ratio (M‐H, Fixed, 95% CI) | 2.0 [0.19, 21.03] |
| Analysis 8.4  Comparison 8 Soy protein‐enriched diet versus no soy protein diet, Outcome 4 Preterm birth (< 37 weeks' gestation). | ||||
| 5 Macrosomia (> 4000 g) Show forest plot | 1 | 68 | Risk Ratio (M‐H, Fixed, 95% CI) | 0.6 [0.16, 2.31] |
| Analysis 8.5  Comparison 8 Soy protein‐enriched diet versus no soy protein diet, Outcome 5 Macrosomia (> 4000 g). | ||||
| 6 Birthweight (g) Show forest plot | 1 | 68 | Mean Difference (IV, Fixed, 95% CI) | ‐142.60 [‐360.40, 75.20] |
| Analysis 8.6  Comparison 8 Soy protein‐enriched diet versus no soy protein diet, Outcome 6 Birthweight (g). | ||||
| 7 Head circumference at birth (cm) Show forest plot | 1 | 68 | Mean Difference (IV, Fixed, 95% CI) | ‐0.20 [‐1.01, 0.61] |
| Analysis 8.7  Comparison 8 Soy protein‐enriched diet versus no soy protein diet, Outcome 7 Head circumference at birth (cm). | ||||
| 8 Length at birth (cm) Show forest plot | 1 | 68 | Mean Difference (IV, Fixed, 95% CI) | ‐0.10 [‐1.07, 0.87] |
| Analysis 8.8  Comparison 8 Soy protein‐enriched diet versus no soy protein diet, Outcome 8 Length at birth (cm). | ||||
| 9 Neonatal hypoglycaemia Show forest plot | 1 | 68 | Risk Ratio (M‐H, Fixed, 95% CI) | 3.0 [0.33, 27.42] |
| Analysis 8.9  Comparison 8 Soy protein‐enriched diet versus no soy protein diet, Outcome 9 Neonatal hypoglycaemia. | ||||
| 10 Neonatal hyperbilirubinaemia Show forest plot | 1 | 68 | Risk Ratio (M‐H, Fixed, 95% CI) | 0.27 [0.08, 0.89] |
| Analysis 8.10  Comparison 8 Soy protein‐enriched diet versus no soy protein diet, Outcome 10 Neonatal hyperbilirubinaemia. | ||||
| 11 Gestational weight gain: BMI at end of intervention (kg/m²) Show forest plot | 1 | 68 | Mean Difference (IV, Fixed, 95% CI) | 0.60 [‐1.43, 2.63] |
| Analysis 8.11  Comparison 8 Soy protein‐enriched diet versus no soy protein diet, Outcome 11 Gestational weight gain: BMI at end of intervention (kg/m²). | ||||
| 12 Gestational weight gain: weight at end of intervention (kg) Show forest plot | 1 | 68 | Mean Difference (IV, Fixed, 95% CI) | 3.50 [‐1.47, 8.47] |
| Analysis 8.12  Comparison 8 Soy protein‐enriched diet versus no soy protein diet, Outcome 12 Gestational weight gain: weight at end of intervention (kg). | ||||
| 13 Insulin sensitivity: end of intervention HOMA‐IR Show forest plot | 1 | 68 | Mean Difference (IV, Fixed, 95% CI) | ‐1.0 [‐2.20, 0.20] |
| Analysis 8.13  Comparison 8 Soy protein‐enriched diet versus no soy protein diet, Outcome 13 Insulin sensitivity: end of intervention HOMA‐IR. | ||||
| 14 Insulin sensitivity: end of intervention QUICKI Show forest plot | 1 | 68 | Mean Difference (IV, Fixed, 95% CI) | 0.0 [‐0.01, 0.01] |
| Analysis 8.14 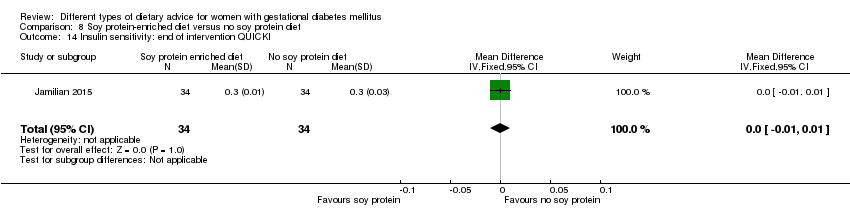 Comparison 8 Soy protein‐enriched diet versus no soy protein diet, Outcome 14 Insulin sensitivity: end of intervention QUICKI. | ||||
| 15 Insulin sensitivity: end of intervention insulin (µIU/mL) Show forest plot | 1 | 68 | Mean Difference (IV, Fixed, 95% CI) | ‐2.60 [‐8.03, 2.83] |
| Analysis 8.15  Comparison 8 Soy protein‐enriched diet versus no soy protein diet, Outcome 15 Insulin sensitivity: end of intervention insulin (µIU/mL). | ||||
| 16 Use of additional pharmacotherapy Show forest plot | 1 | 68 | Risk Ratio (M‐H, Fixed, 95% CI) | 1.0 [0.15, 6.70] |
| Analysis 8.16  Comparison 8 Soy protein‐enriched diet versus no soy protein diet, Outcome 16 Use of additional pharmacotherapy. | ||||
| 17 Glycaemic control: end of intervention fasting plasma glucose (mg/dL) Show forest plot | 1 | 68 | Mean Difference (IV, Fixed, 95% CI) | ‐10.60 [‐15.37, ‐5.83] |
| Analysis 8.17  Comparison 8 Soy protein‐enriched diet versus no soy protein diet, Outcome 17 Glycaemic control: end of intervention fasting plasma glucose (mg/dL). | ||||
| 18 Number of antenatal visits or admissions: maternal hospitalisation Show forest plot | 1 | 68 | Risk Ratio (M‐H, Fixed, 95% CI) | 0.75 [0.18, 3.10] |
| Analysis 8.18  Comparison 8 Soy protein‐enriched diet versus no soy protein diet, Outcome 18 Number of antenatal visits or admissions: maternal hospitalisation. | ||||
| 19 Neonatal intensive care unit admission: neonatal hospitalisations Show forest plot | 1 | 68 | Risk Ratio (M‐H, Fixed, 95% CI) | 0.14 [0.02, 1.10] |
| Analysis 8.19  Comparison 8 Soy protein‐enriched diet versus no soy protein diet, Outcome 19 Neonatal intensive care unit admission: neonatal hospitalisations. | ||||
| Outcome or subgroup title | No. of studies | No. of participants | Statistical method | Effect size |
| 1 Gestational age at birth (weeks) Show forest plot | 1 | 22 | Mean Difference (IV, Fixed, 95% CI) | 0.0 [‐1.30, 1.30] |
| Analysis 9.1  Comparison 9 High‐fibre diet versus standard‐fibre diet, Outcome 1 Gestational age at birth (weeks). | ||||
| 2 Birthweight (g) Show forest plot | 1 | 22 | Mean Difference (IV, Fixed, 95% CI) | ‐94.0 [‐446.71, 258.71] |
| Analysis 9.2  Comparison 9 High‐fibre diet versus standard‐fibre diet, Outcome 2 Birthweight (g). | ||||
| 3 Gestational weight gain (kg) Show forest plot | 1 | 22 | Mean Difference (IV, Fixed, 95% CI) | 2.40 [‐2.20, 7.00] |
| Analysis 9.3 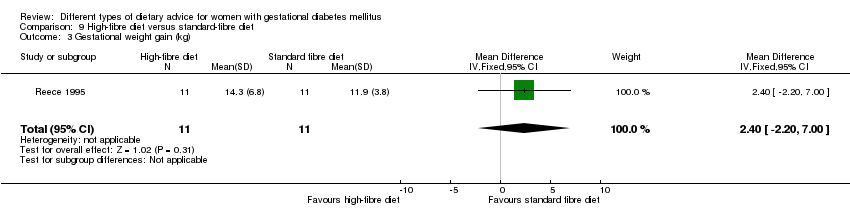 Comparison 9 High‐fibre diet versus standard‐fibre diet, Outcome 3 Gestational weight gain (kg). | ||||
| 4 Use of additional pharmacotherapy Show forest plot | 1 | 22 | Risk Ratio (M‐H, Fixed, 95% CI) | 0.0 [0.0, 0.0] |
| Analysis 9.4  Comparison 9 High‐fibre diet versus standard‐fibre diet, Outcome 4 Use of additional pharmacotherapy. | ||||
| 5 Glycaemic control during/at end of intervention: mean blood glucose (mg/dL) Show forest plot | 1 | 22 | Mean Difference (IV, Fixed, 95% CI) | 0.0 [‐8.26, 8.26] |
| Analysis 9.5  Comparison 9 High‐fibre diet versus standard‐fibre diet, Outcome 5 Glycaemic control during/at end of intervention: mean blood glucose (mg/dL). | ||||
| 6 Maternal hypoglycaemia: mean number of events Show forest plot | 1 | 22 | Mean Difference (IV, Fixed, 95% CI) | ‐1.0 [‐2.08, 0.08] |
| Analysis 9.6  Comparison 9 High‐fibre diet versus standard‐fibre diet, Outcome 6 Maternal hypoglycaemia: mean number of events. | ||||
| Outcome or subgroup title | No. of studies | No. of participants | Statistical method | Effect size |
| 1 Large‐for‐gestational age Show forest plot | 1 | 20 | Risk Ratio (M‐H, Fixed, 95% CI) | 0.14 [0.01, 2.45] |
| Analysis 10.1 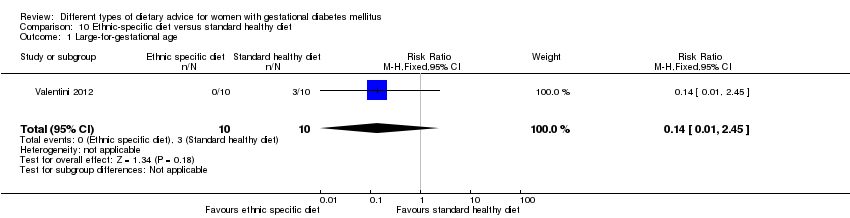 Comparison 10 Ethnic‐specific diet versus standard healthy diet, Outcome 1 Large‐for‐gestational age. | ||||
| 2 Neonatal composite outcome: hypoglycaemia, neonatal asphyxia, respiratory distress syndrome, and hyperbilirubinaemia, hypocalcaemia Show forest plot | 1 | 20 | Risk Ratio (M‐H, Fixed, 95% CI) | 0.0 [0.0, 0.0] |
| Analysis 10.2  Comparison 10 Ethnic‐specific diet versus standard healthy diet, Outcome 2 Neonatal composite outcome: hypoglycaemia, neonatal asphyxia, respiratory distress syndrome, and hyperbilirubinaemia, hypocalcaemia. | ||||
| 3 Hypertensive disorders of pregnancy: gestational hypertension Show forest plot | 1 | 20 | Risk Ratio (M‐H, Fixed, 95% CI) | 0.33 [0.02, 7.32] |
| Analysis 10.3  Comparison 10 Ethnic‐specific diet versus standard healthy diet, Outcome 3 Hypertensive disorders of pregnancy: gestational hypertension. | ||||
| 4 Caesarean section Show forest plot | 1 | 20 | Risk Ratio (M‐H, Fixed, 95% CI) | 1.2 [0.54, 2.67] |
| Analysis 10.4  Comparison 10 Ethnic‐specific diet versus standard healthy diet, Outcome 4 Caesarean section. | ||||
| 5 Gestational age at birth (weeks) Show forest plot | 1 | 20 | Mean Difference (IV, Fixed, 95% CI) | ‐0.40 [‐1.15, 0.35] |
| Analysis 10.5 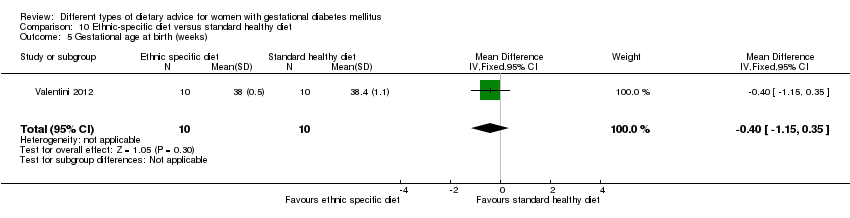 Comparison 10 Ethnic‐specific diet versus standard healthy diet, Outcome 5 Gestational age at birth (weeks). | ||||
| 6 Macrosomia (> 4000 g) Show forest plot | 1 | 20 | Risk Ratio (M‐H, Fixed, 95% CI) | 0.2 [0.01, 3.70] |
| Analysis 10.6  Comparison 10 Ethnic‐specific diet versus standard healthy diet, Outcome 6 Macrosomia (> 4000 g). | ||||
| 7 Small‐for‐gestational age Show forest plot | 1 | 20 | Risk Ratio (M‐H, Fixed, 95% CI) | 0.33 [0.02, 7.32] |
| Analysis 10.7  Comparison 10 Ethnic‐specific diet versus standard healthy diet, Outcome 7 Small‐for‐gestational age. | ||||
| 8 Birthweight (g) Show forest plot | 1 | 20 | Mean Difference (IV, Fixed, 95% CI) | ‐368.00 [‐928.87, 188.87] |
| Analysis 10.8 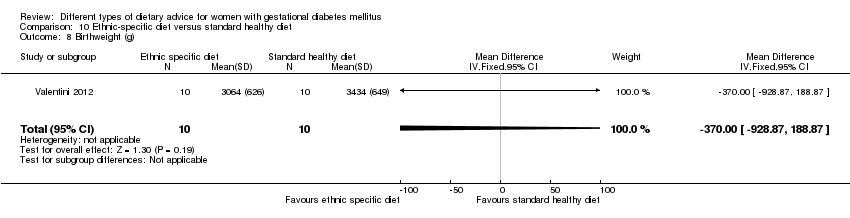 Comparison 10 Ethnic‐specific diet versus standard healthy diet, Outcome 8 Birthweight (g). | ||||
| 9 Respiratory distress syndrome Show forest plot | 1 | 20 | Risk Ratio (M‐H, Fixed, 95% CI) | 0.0 [0.0, 0.0] |
| Analysis 10.9 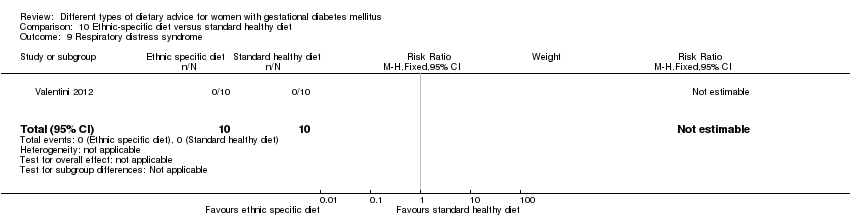 Comparison 10 Ethnic‐specific diet versus standard healthy diet, Outcome 9 Respiratory distress syndrome. | ||||
| 10 Neonatal hypoglycaemia Show forest plot | 1 | 20 | Risk Ratio (M‐H, Fixed, 95% CI) | 0.0 [0.0, 0.0] |
| Analysis 10.10  Comparison 10 Ethnic‐specific diet versus standard healthy diet, Outcome 10 Neonatal hypoglycaemia. | ||||
| 11 Neonatal hyperbilirubinaemia Show forest plot | 1 | 20 | Risk Ratio (M‐H, Fixed, 95% CI) | 0.0 [0.0, 0.0] |
| Analysis 10.11  Comparison 10 Ethnic‐specific diet versus standard healthy diet, Outcome 11 Neonatal hyperbilirubinaemia. | ||||
| 12 Neonatal hypocalcaemia Show forest plot | 1 | 20 | Risk Ratio (M‐H, Fixed, 95% CI) | 0.0 [0.0, 0.0] |
| Analysis 10.12  Comparison 10 Ethnic‐specific diet versus standard healthy diet, Outcome 12 Neonatal hypocalcaemia. | ||||
| 13 Gestational weight gain (kg) Show forest plot | 1 | 20 | Mean Difference (IV, Fixed, 95% CI) | ‐2.20 [‐7.24, 2.84] |
| Analysis 10.13 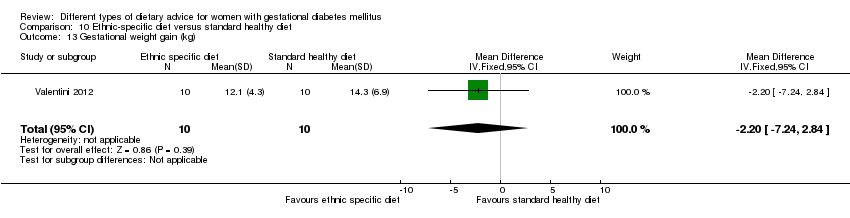 Comparison 10 Ethnic‐specific diet versus standard healthy diet, Outcome 13 Gestational weight gain (kg). | ||||
| 14 Adherence to dietary intervention: good adherence Show forest plot | 1 | 20 | Risk Ratio (M‐H, Fixed, 95% CI) | 3.5 [0.95, 12.90] |
| Analysis 10.14 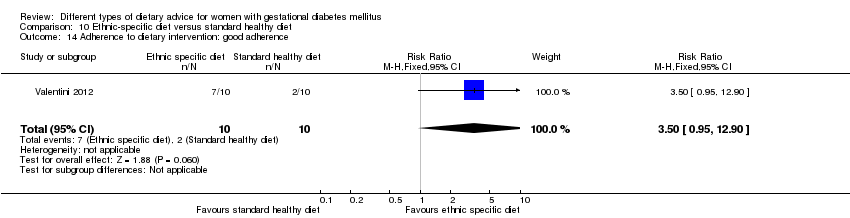 Comparison 10 Ethnic‐specific diet versus standard healthy diet, Outcome 14 Adherence to dietary intervention: good adherence. | ||||
| 15 Use of additional pharmacotherapy Show forest plot | 1 | 20 | Risk Ratio (M‐H, Fixed, 95% CI) | 2.0 [0.21, 18.69] |
| Analysis 10.15  Comparison 10 Ethnic‐specific diet versus standard healthy diet, Outcome 15 Use of additional pharmacotherapy. | ||||

Study flow diagram.
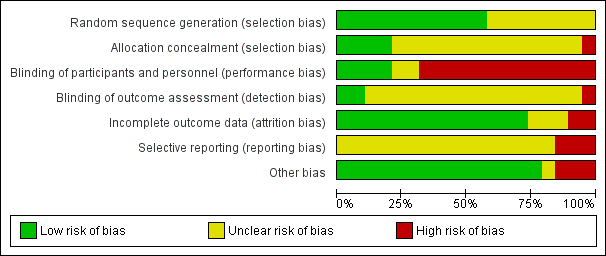
'Risk of bias' graph: review authors' judgements about each risk of bias item presented as percentages across all included studies.

'Risk of bias' summary: review authors' judgements about each risk of bias item for each included study.

Comparison 1 Low‐moderate GI diet versus moderate‐high GI diet, Outcome 1 Large‐for‐gestational age.

Comparison 1 Low‐moderate GI diet versus moderate‐high GI diet, Outcome 2 Hypertensive disorders of pregnancy (severe hypertension or pre‐eclampsia).

Comparison 1 Low‐moderate GI diet versus moderate‐high GI diet, Outcome 3 Hypertensive disorders of pregnancy (eclampsia).
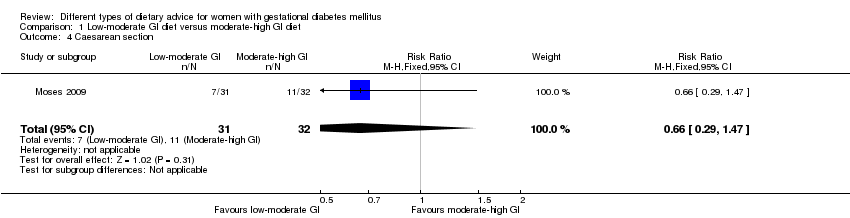
Comparison 1 Low‐moderate GI diet versus moderate‐high GI diet, Outcome 4 Caesarean section.

Comparison 1 Low‐moderate GI diet versus moderate‐high GI diet, Outcome 5 Gestational age at birth (weeks).

Comparison 1 Low‐moderate GI diet versus moderate‐high GI diet, Outcome 6 Preterm birth.
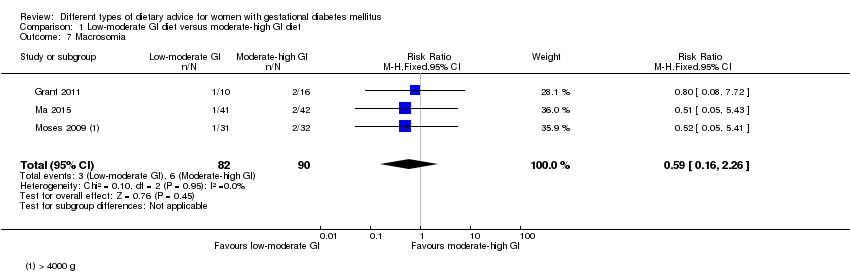
Comparison 1 Low‐moderate GI diet versus moderate‐high GI diet, Outcome 7 Macrosomia.

Comparison 1 Low‐moderate GI diet versus moderate‐high GI diet, Outcome 8 Small‐for‐gestational age.

Comparison 1 Low‐moderate GI diet versus moderate‐high GI diet, Outcome 9 Birthweight (g).

Comparison 1 Low‐moderate GI diet versus moderate‐high GI diet, Outcome 10 Head circumference at birth (cm).

Comparison 1 Low‐moderate GI diet versus moderate‐high GI diet, Outcome 11 Length at birth (cm).

Comparison 1 Low‐moderate GI diet versus moderate‐high GI diet, Outcome 12 Ponderal index at birth (kg/m³).
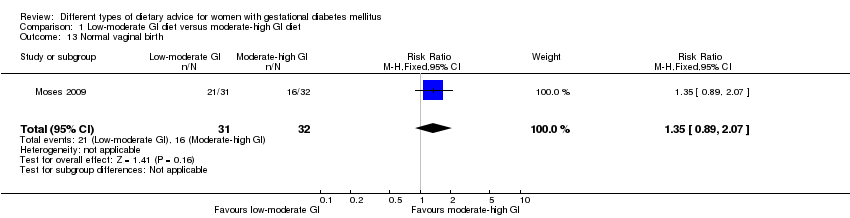
Comparison 1 Low‐moderate GI diet versus moderate‐high GI diet, Outcome 13 Normal vaginal birth.

Comparison 1 Low‐moderate GI diet versus moderate‐high GI diet, Outcome 14 Operative vaginal birth.

Comparison 1 Low‐moderate GI diet versus moderate‐high GI diet, Outcome 15 Induction of labour.

Comparison 1 Low‐moderate GI diet versus moderate‐high GI diet, Outcome 16 Postpartum haemorrhage.

Comparison 1 Low‐moderate GI diet versus moderate‐high GI diet, Outcome 17 Postpartum infection.

Comparison 1 Low‐moderate GI diet versus moderate‐high GI diet, Outcome 18 Gestational weight gain (kg).
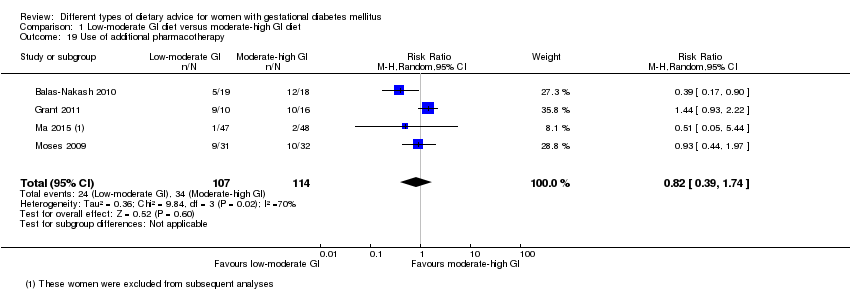
Comparison 1 Low‐moderate GI diet versus moderate‐high GI diet, Outcome 19 Use of additional pharmacotherapy.

Comparison 1 Low‐moderate GI diet versus moderate‐high GI diet, Outcome 20 Glycaemic control: end of intervention fasting plasma glucose (mmol/L).

Comparison 1 Low‐moderate GI diet versus moderate‐high GI diet, Outcome 21 Glycaemic control: end of intervention 2‐hour postprandial glucose (mmol/L).

Comparison 1 Low‐moderate GI diet versus moderate‐high GI diet, Outcome 22 Glycaemic control: end of intervention HbA1c (%).

Comparison 2 Energy‐restricted diet versus no energy‐restricted diet, Outcome 1 Large‐for‐gestational age.
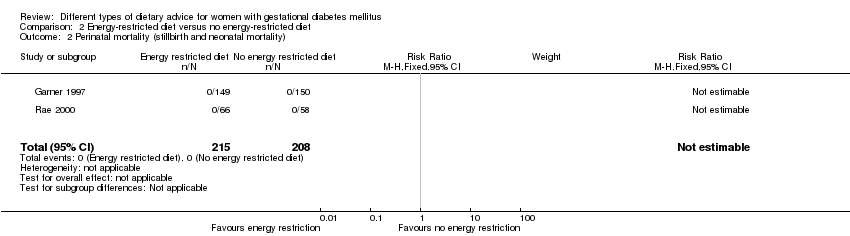
Comparison 2 Energy‐restricted diet versus no energy‐restricted diet, Outcome 2 Perinatal mortality (stillbirth and neonatal mortality).

Comparison 2 Energy‐restricted diet versus no energy‐restricted diet, Outcome 3 Hypertensive disorders of pregnancy: pre‐eclampsia.

Comparison 2 Energy‐restricted diet versus no energy‐restricted diet, Outcome 4 Caesarean section.

Comparison 2 Energy‐restricted diet versus no energy‐restricted diet, Outcome 5 Stillbirth.
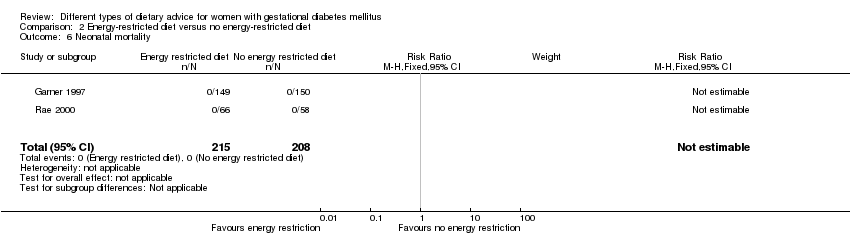
Comparison 2 Energy‐restricted diet versus no energy‐restricted diet, Outcome 6 Neonatal mortality.
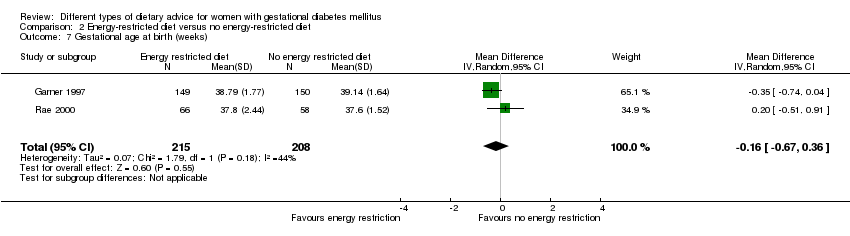
Comparison 2 Energy‐restricted diet versus no energy‐restricted diet, Outcome 7 Gestational age at birth (weeks).

Comparison 2 Energy‐restricted diet versus no energy‐restricted diet, Outcome 8 Macrosomia (> 4000 g).

Comparison 2 Energy‐restricted diet versus no energy‐restricted diet, Outcome 9 Macrosomia (> 4500 g).
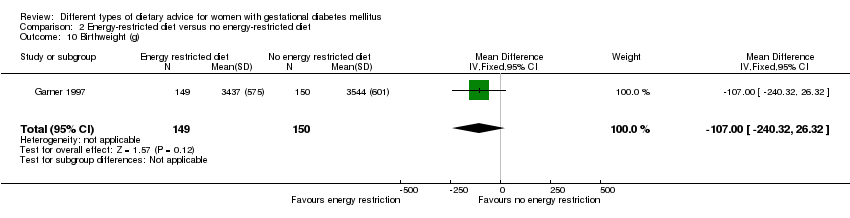
Comparison 2 Energy‐restricted diet versus no energy‐restricted diet, Outcome 10 Birthweight (g).

Comparison 2 Energy‐restricted diet versus no energy‐restricted diet, Outcome 11 Shoulder dystocia.
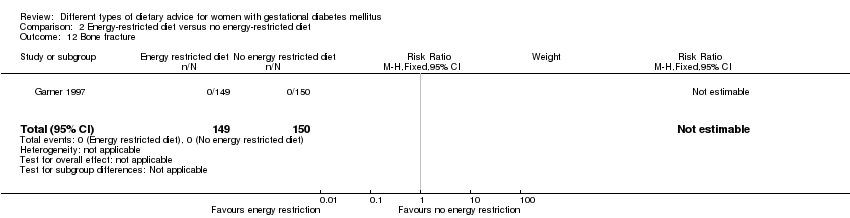
Comparison 2 Energy‐restricted diet versus no energy‐restricted diet, Outcome 12 Bone fracture.

Comparison 2 Energy‐restricted diet versus no energy‐restricted diet, Outcome 13 Nerve palsy.

Comparison 2 Energy‐restricted diet versus no energy‐restricted diet, Outcome 14 Neonatal hypoglycaemia.
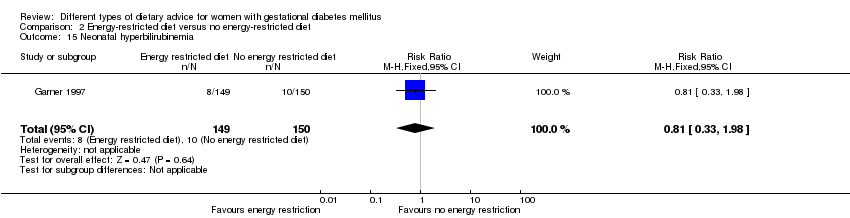
Comparison 2 Energy‐restricted diet versus no energy‐restricted diet, Outcome 15 Neonatal hyperbilirubinemia.

Comparison 2 Energy‐restricted diet versus no energy‐restricted diet, Outcome 16 Neonatal hypocalcaemia.

Comparison 2 Energy‐restricted diet versus no energy‐restricted diet, Outcome 17 Normal vaginal birth.
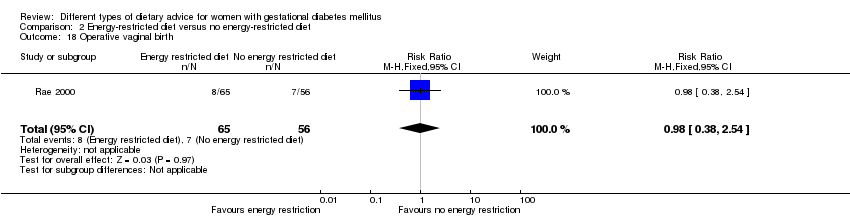
Comparison 2 Energy‐restricted diet versus no energy‐restricted diet, Outcome 18 Operative vaginal birth.

Comparison 2 Energy‐restricted diet versus no energy‐restricted diet, Outcome 19 Induction of labour.

Comparison 2 Energy‐restricted diet versus no energy‐restricted diet, Outcome 20 Gestational weight gain (kg).

Comparison 2 Energy‐restricted diet versus no energy‐restricted diet, Outcome 21 Gestational weight gain: weight at birth (kg).

Comparison 2 Energy‐restricted diet versus no energy‐restricted diet, Outcome 22 Insulin sensitivity: during intervention fasting plasma insulin (pM).
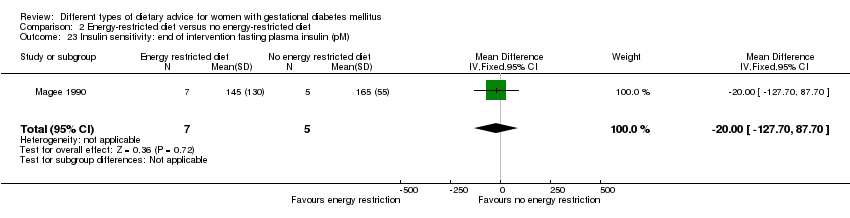
Comparison 2 Energy‐restricted diet versus no energy‐restricted diet, Outcome 23 Insulin sensitivity: end of intervention fasting plasma insulin (pM).
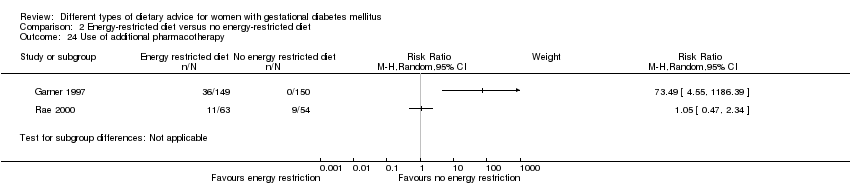
Comparison 2 Energy‐restricted diet versus no energy‐restricted diet, Outcome 24 Use of additional pharmacotherapy.
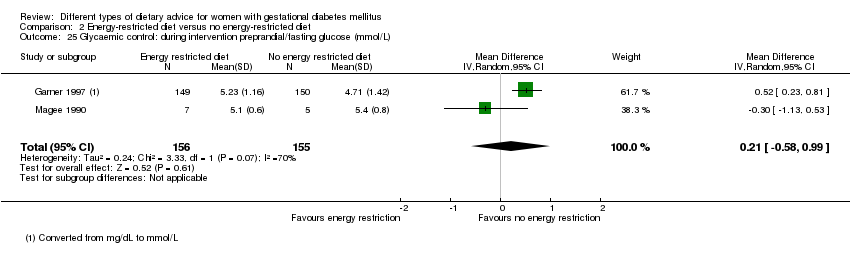
Comparison 2 Energy‐restricted diet versus no energy‐restricted diet, Outcome 25 Glycaemic control: during intervention preprandial/fasting glucose (mmol/L).

Comparison 2 Energy‐restricted diet versus no energy‐restricted diet, Outcome 26 Glycaemic control: during intervention 24 hour mean plasma glucose (mmol/L).

Comparison 2 Energy‐restricted diet versus no energy‐restricted diet, Outcome 27 Glycaemic control: during intervention 1 hour postprandial glucose (mmol/L).
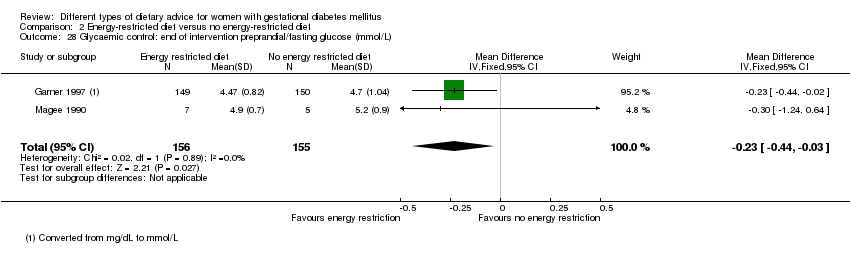
Comparison 2 Energy‐restricted diet versus no energy‐restricted diet, Outcome 28 Glycaemic control: end of intervention preprandial/fasting glucose (mmol/L).
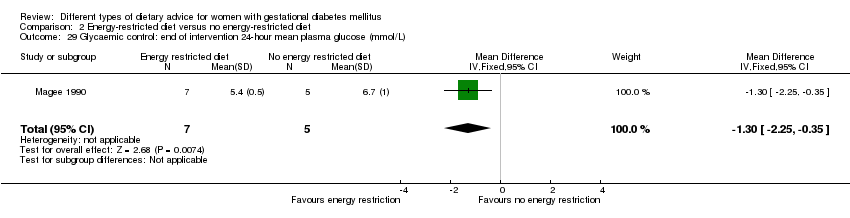
Comparison 2 Energy‐restricted diet versus no energy‐restricted diet, Outcome 29 Glycaemic control: end of intervention 24‐hour mean plasma glucose (mmol/L).
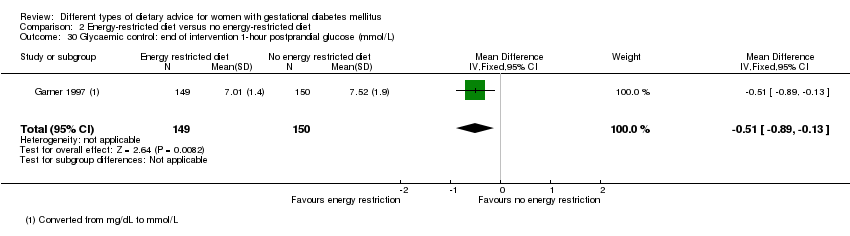
Comparison 2 Energy‐restricted diet versus no energy‐restricted diet, Outcome 30 Glycaemic control: end of intervention 1‐hour postprandial glucose (mmol/L).

Comparison 2 Energy‐restricted diet versus no energy‐restricted diet, Outcome 31 Glycaemic control: during/at end of intervention fasting glucose (mmol/L).

Comparison 2 Energy‐restricted diet versus no energy‐restricted diet, Outcome 32 Glycaemic control: during/at end of intervention mean plasma glucose (mmol/L).

Comparison 2 Energy‐restricted diet versus no energy‐restricted diet, Outcome 33 Glycaemic control: during/at end of intervention mean HbA1c (%).

Comparison 3 DASH diet versus control diet with matching macronutrient contents, Outcome 1 Hypertensive disorders of pregnancy: pre‐eclampsia.
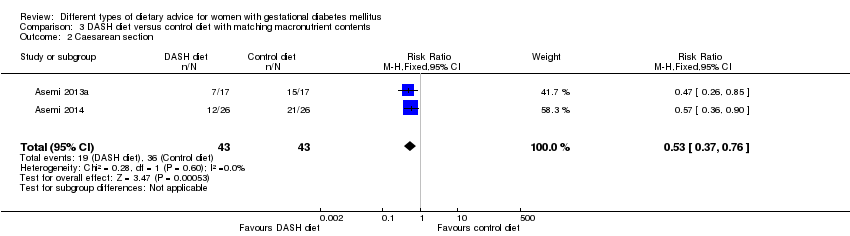
Comparison 3 DASH diet versus control diet with matching macronutrient contents, Outcome 2 Caesarean section.

Comparison 3 DASH diet versus control diet with matching macronutrient contents, Outcome 3 Gestational age at birth (weeks).
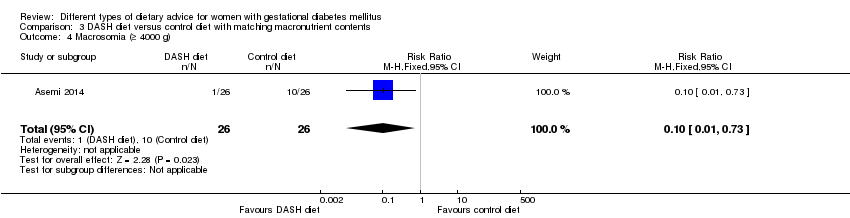
Comparison 3 DASH diet versus control diet with matching macronutrient contents, Outcome 4 Macrosomia (≥ 4000 g).
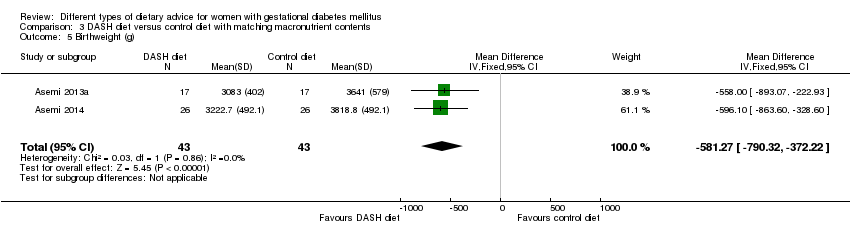
Comparison 3 DASH diet versus control diet with matching macronutrient contents, Outcome 5 Birthweight (g).

Comparison 3 DASH diet versus control diet with matching macronutrient contents, Outcome 6 Head circumference at birth (cm).
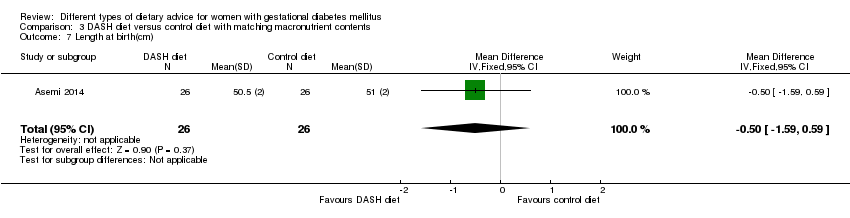
Comparison 3 DASH diet versus control diet with matching macronutrient contents, Outcome 7 Length at birth(cm).

Comparison 3 DASH diet versus control diet with matching macronutrient contents, Outcome 8 Ponderal index at birth (kg/m³).
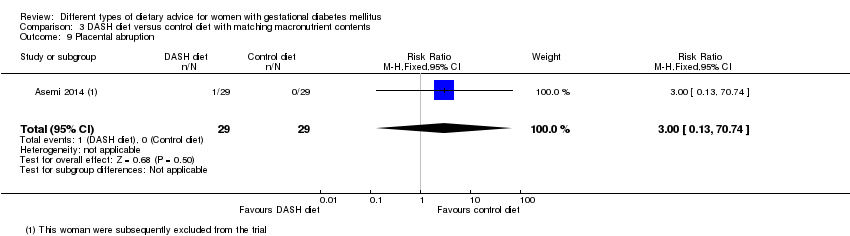
Comparison 3 DASH diet versus control diet with matching macronutrient contents, Outcome 9 Placental abruption.

Comparison 3 DASH diet versus control diet with matching macronutrient contents, Outcome 10 Gestational weight gain: BMI at end of intervention (kg/m²).
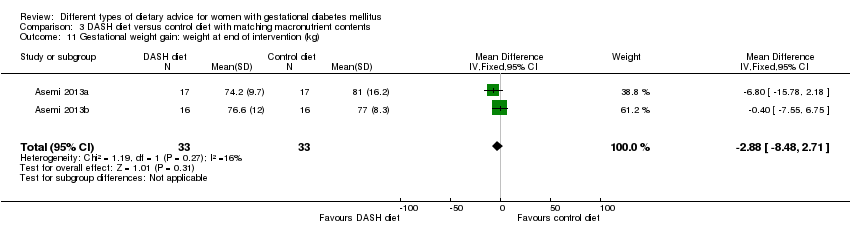
Comparison 3 DASH diet versus control diet with matching macronutrient contents, Outcome 11 Gestational weight gain: weight at end of intervention (kg).

Comparison 3 DASH diet versus control diet with matching macronutrient contents, Outcome 12 Insulin sensitivity: end of intervention HOMA‐IR.
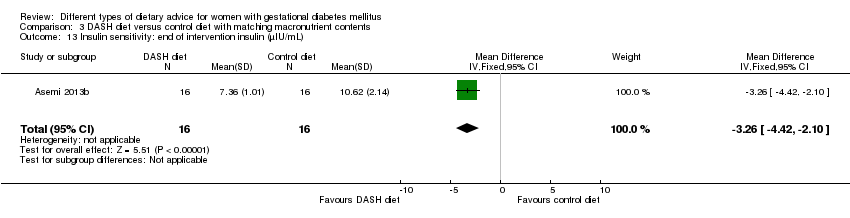
Comparison 3 DASH diet versus control diet with matching macronutrient contents, Outcome 13 Insulin sensitivity: end of intervention insulin (µIU/mL).
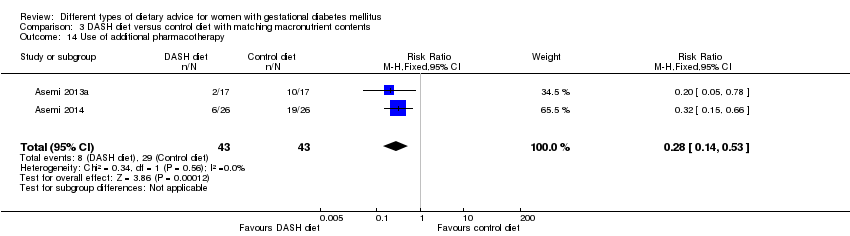
Comparison 3 DASH diet versus control diet with matching macronutrient contents, Outcome 14 Use of additional pharmacotherapy.

Comparison 3 DASH diet versus control diet with matching macronutrient contents, Outcome 15 Glycaemic control: end of intervention fasting blood glucose (mmol/L).

Comparison 3 DASH diet versus control diet with matching macronutrient contents, Outcome 16 Glycaemic control: at end of intervention HbA1c (%).

Comparison 4 Low‐carbohydrate diet versus high‐carbohydrate diet, Outcome 1 Large‐for‐gestational age.

Comparison 4 Low‐carbohydrate diet versus high‐carbohydrate diet, Outcome 2 Perinatal mortality (stillbirth and neonatal mortality).
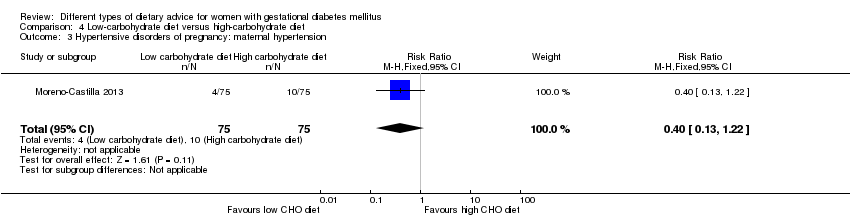
Comparison 4 Low‐carbohydrate diet versus high‐carbohydrate diet, Outcome 3 Hypertensive disorders of pregnancy: maternal hypertension.
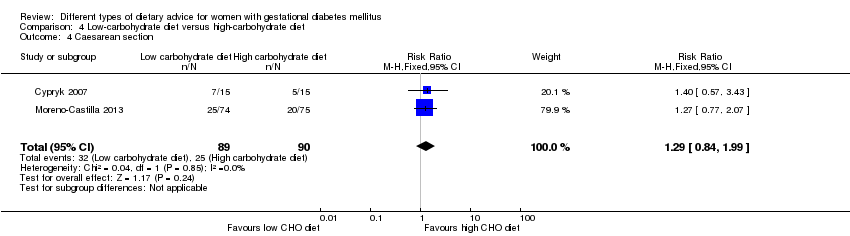
Comparison 4 Low‐carbohydrate diet versus high‐carbohydrate diet, Outcome 4 Caesarean section.

Comparison 4 Low‐carbohydrate diet versus high‐carbohydrate diet, Outcome 5 Stillbirth.
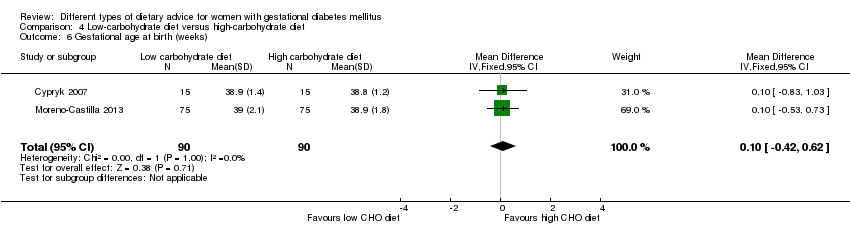
Comparison 4 Low‐carbohydrate diet versus high‐carbohydrate diet, Outcome 6 Gestational age at birth (weeks).

Comparison 4 Low‐carbohydrate diet versus high‐carbohydrate diet, Outcome 7 Macrosomia (> 4000 g).

Comparison 4 Low‐carbohydrate diet versus high‐carbohydrate diet, Outcome 8 Small‐for‐gestational age.
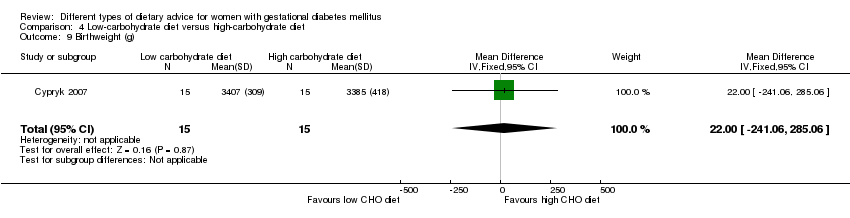
Comparison 4 Low‐carbohydrate diet versus high‐carbohydrate diet, Outcome 9 Birthweight (g).

Comparison 4 Low‐carbohydrate diet versus high‐carbohydrate diet, Outcome 10 Neonatal hypoglycaemia.
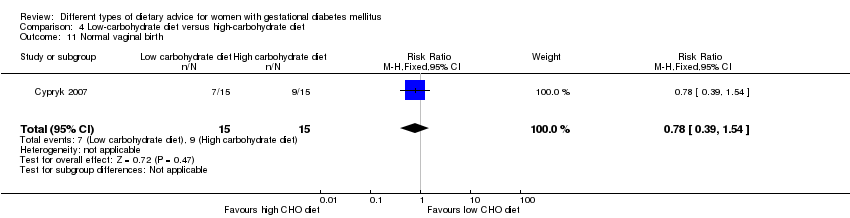
Comparison 4 Low‐carbohydrate diet versus high‐carbohydrate diet, Outcome 11 Normal vaginal birth.

Comparison 4 Low‐carbohydrate diet versus high‐carbohydrate diet, Outcome 12 Operative vaginal birth.
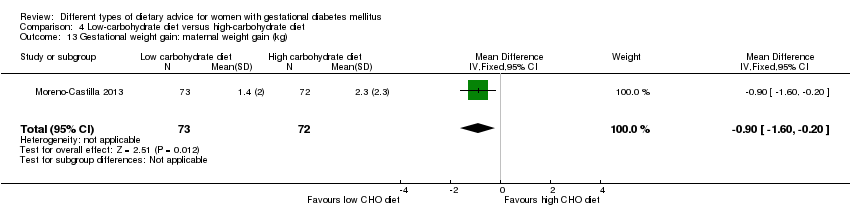
Comparison 4 Low‐carbohydrate diet versus high‐carbohydrate diet, Outcome 13 Gestational weight gain: maternal weight gain (kg).

Comparison 4 Low‐carbohydrate diet versus high‐carbohydrate diet, Outcome 14 Adherence to dietary intervention: fully applied the recommended menu.
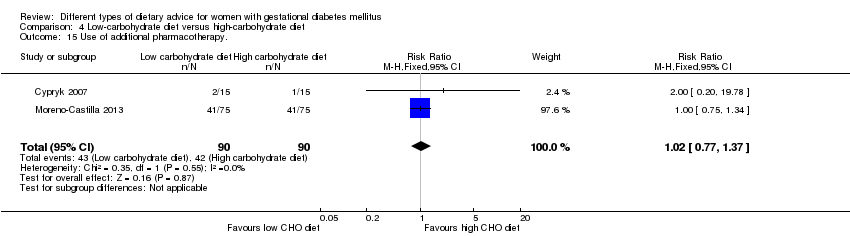
Comparison 4 Low‐carbohydrate diet versus high‐carbohydrate diet, Outcome 15 Use of additional pharmacotherapy..

Comparison 4 Low‐carbohydrate diet versus high‐carbohydrate diet, Outcome 16 Glycaemic control: end of intervention fasting blood glucose (mg/dL).
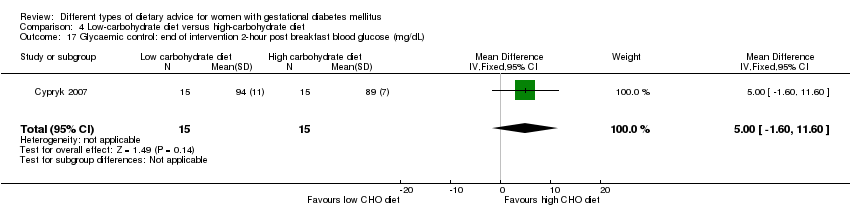
Comparison 4 Low‐carbohydrate diet versus high‐carbohydrate diet, Outcome 17 Glycaemic control: end of intervention 2‐hour post breakfast blood glucose (mg/dL).

Comparison 4 Low‐carbohydrate diet versus high‐carbohydrate diet, Outcome 18 Glycaemic control: end of intervention 2‐hour post lunch blood glucose (mg/dL).
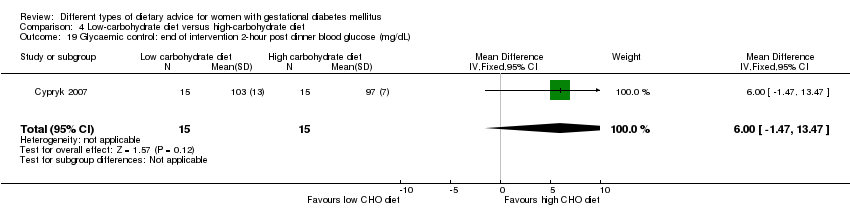
Comparison 4 Low‐carbohydrate diet versus high‐carbohydrate diet, Outcome 19 Glycaemic control: end of intervention 2‐hour post dinner blood glucose (mg/dL).

Comparison 5 High unsaturated fat diet versus low unsaturated fat diet with matching calories, Outcome 1 Large‐for‐gestational age.
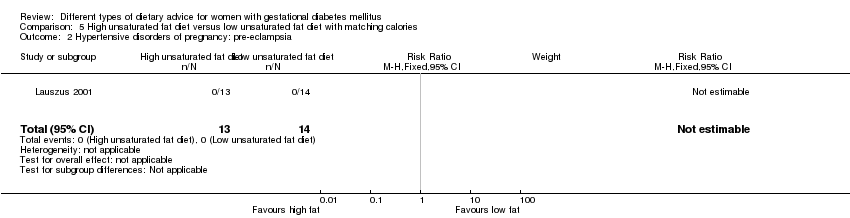
Comparison 5 High unsaturated fat diet versus low unsaturated fat diet with matching calories, Outcome 2 Hypertensive disorders of pregnancy: pre‐eclampsia.

Comparison 5 High unsaturated fat diet versus low unsaturated fat diet with matching calories, Outcome 3 Hypertensive disorders of pregnancy: hypertension in pregnancy.

Comparison 5 High unsaturated fat diet versus low unsaturated fat diet with matching calories, Outcome 4 Caesarean section.
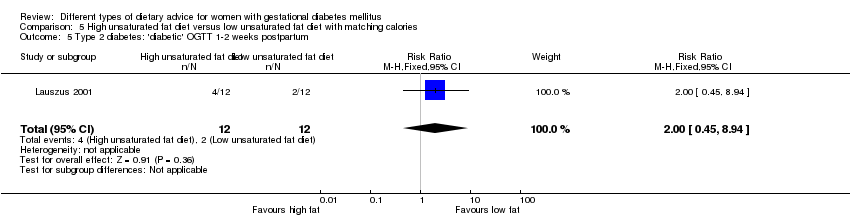
Comparison 5 High unsaturated fat diet versus low unsaturated fat diet with matching calories, Outcome 5 Type 2 diabetes: 'diabetic' OGTT 1‐2 weeks postpartum.
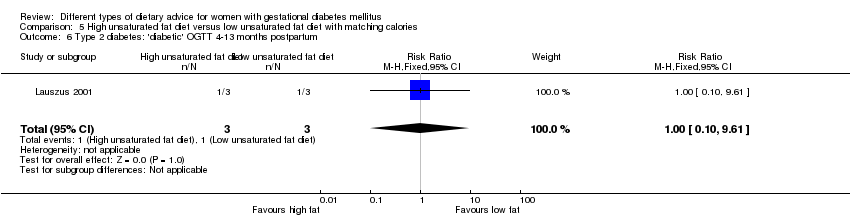
Comparison 5 High unsaturated fat diet versus low unsaturated fat diet with matching calories, Outcome 6 Type 2 diabetes: 'diabetic' OGTT 4‐13 months postpartum.

Comparison 5 High unsaturated fat diet versus low unsaturated fat diet with matching calories, Outcome 7 Gestational age at birth (weeks).

Comparison 5 High unsaturated fat diet versus low unsaturated fat diet with matching calories, Outcome 8 Preterm birth.

Comparison 5 High unsaturated fat diet versus low unsaturated fat diet with matching calories, Outcome 9 Macrosomia (> 4000 g).

Comparison 5 High unsaturated fat diet versus low unsaturated fat diet with matching calories, Outcome 10 Birthweight (g).

Comparison 5 High unsaturated fat diet versus low unsaturated fat diet with matching calories, Outcome 11 Placental abruption.

Comparison 5 High unsaturated fat diet versus low unsaturated fat diet with matching calories, Outcome 12 Gestational weight gain (kg).
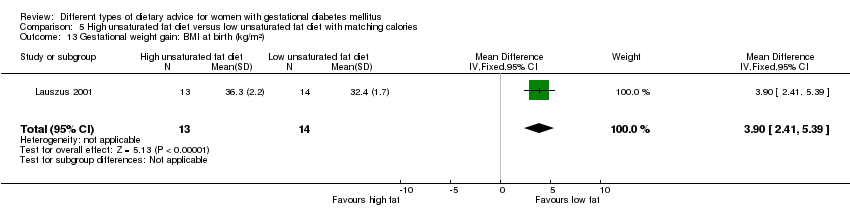
Comparison 5 High unsaturated fat diet versus low unsaturated fat diet with matching calories, Outcome 13 Gestational weight gain: BMI at birth (kg/m²).

Comparison 5 High unsaturated fat diet versus low unsaturated fat diet with matching calories, Outcome 14 Gestational weight gain: weight at birth (kg).

Comparison 5 High unsaturated fat diet versus low unsaturated fat diet with matching calories, Outcome 15 Insulin sensitivity: during intervention (38 week) insulin (mU/L).

Comparison 5 High unsaturated fat diet versus low unsaturated fat diet with matching calories, Outcome 16 Insulin sensitivity: during intervention (38 week) insulin sensitivity (10‐5 min‐1 per mU/L min).

Comparison 5 High unsaturated fat diet versus low unsaturated fat diet with matching calories, Outcome 17 Insulin sensitivity: end of intervention IAI.

Comparison 5 High unsaturated fat diet versus low unsaturated fat diet with matching calories, Outcome 18 Use of additional pharmacotherapy.
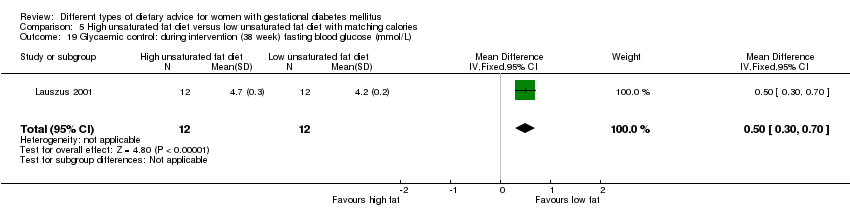
Comparison 5 High unsaturated fat diet versus low unsaturated fat diet with matching calories, Outcome 19 Glycaemic control: during intervention (38 week) fasting blood glucose (mmol/L).

Comparison 5 High unsaturated fat diet versus low unsaturated fat diet with matching calories, Outcome 20 Glycaemic control: during intervention (38 week) postprandial glucose (mmol/L).

Comparison 5 High unsaturated fat diet versus low unsaturated fat diet with matching calories, Outcome 21 Glycaemic control: during intervention (38 week) HbA1c (%).
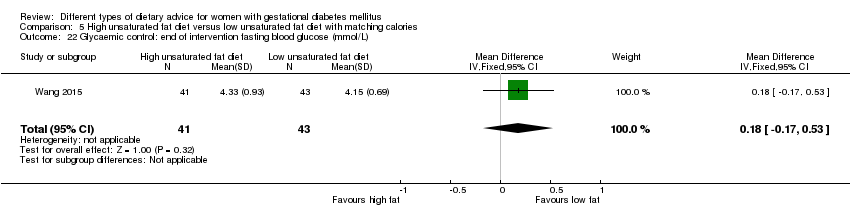
Comparison 5 High unsaturated fat diet versus low unsaturated fat diet with matching calories, Outcome 22 Glycaemic control: end of intervention fasting blood glucose (mmol/L).
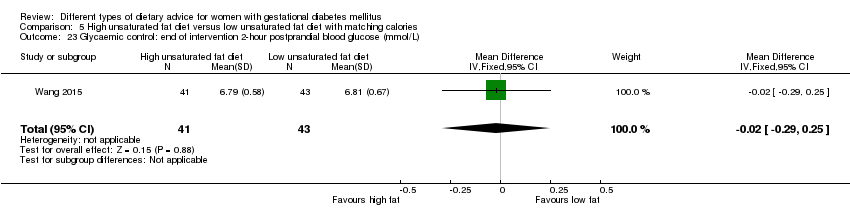
Comparison 5 High unsaturated fat diet versus low unsaturated fat diet with matching calories, Outcome 23 Glycaemic control: end of intervention 2‐hour postprandial blood glucose (mmol/L).

Comparison 5 High unsaturated fat diet versus low unsaturated fat diet with matching calories, Outcome 24 BMI 5‐9 months postpartum (kg/m²).

Comparison 5 High unsaturated fat diet versus low unsaturated fat diet with matching calories, Outcome 25 Impaired glucose tolerance: 'borderline' OGTT 1‐2 weeks postpartum.

Comparison 5 High unsaturated fat diet versus low unsaturated fat diet with matching calories, Outcome 26 Impaired glucose tolerance: 'borderline' OGTT 4‐13 months postpartum.

Comparison 6 Low‐GI diet versus high‐fibre moderate‐GI diet, Outcome 1 Large‐for‐gestational age.
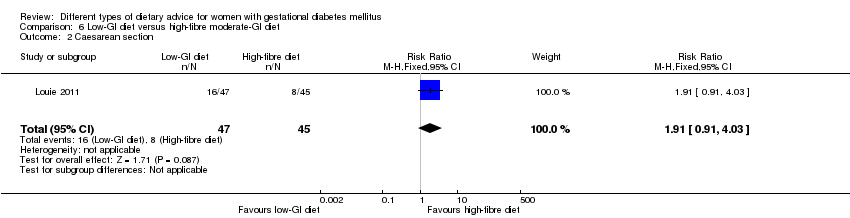
Comparison 6 Low‐GI diet versus high‐fibre moderate‐GI diet, Outcome 2 Caesarean section.

Comparison 6 Low‐GI diet versus high‐fibre moderate‐GI diet, Outcome 3 Type 2 diabetes mellitus at 3 months postpartum.

Comparison 6 Low‐GI diet versus high‐fibre moderate‐GI diet, Outcome 4 Gestational age at birth (weeks).
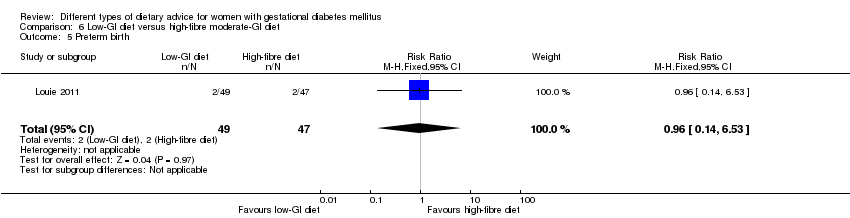
Comparison 6 Low‐GI diet versus high‐fibre moderate‐GI diet, Outcome 5 Preterm birth.
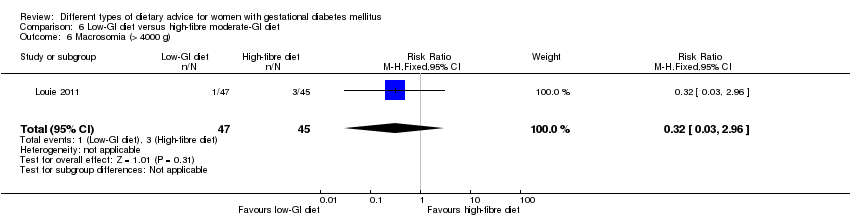
Comparison 6 Low‐GI diet versus high‐fibre moderate‐GI diet, Outcome 6 Macrosomia (> 4000 g).

Comparison 6 Low‐GI diet versus high‐fibre moderate‐GI diet, Outcome 7 Small‐for‐gestational age.

Comparison 6 Low‐GI diet versus high‐fibre moderate‐GI diet, Outcome 8 Birthweight (g).
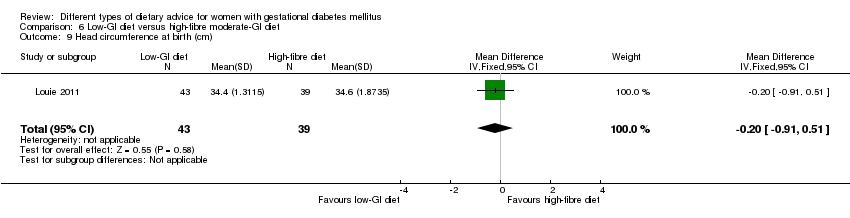
Comparison 6 Low‐GI diet versus high‐fibre moderate‐GI diet, Outcome 9 Head circumference at birth (cm).
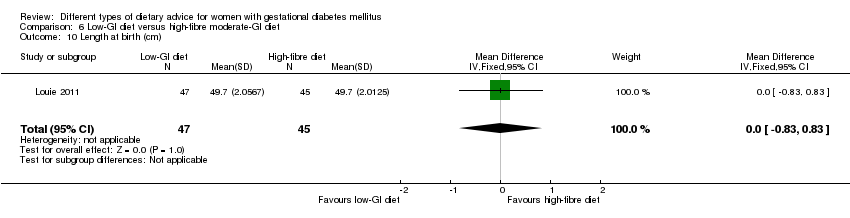
Comparison 6 Low‐GI diet versus high‐fibre moderate‐GI diet, Outcome 10 Length at birth (cm).
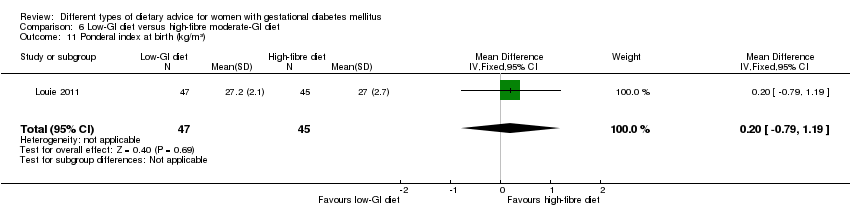
Comparison 6 Low‐GI diet versus high‐fibre moderate‐GI diet, Outcome 11 Ponderal index at birth (kg/m³).
| Study | Low‐GI diet (N =31) | High‐fibre moderate‐GI diet (N =21) | P value |
| Weight for age percentile (adjusted for breastfeeding status) | |||
| Louie 2011 | Mean (95% CI): 69.6 (60.5–78.8) | Mean (95% CI): 68.0 (56.9–79.1) | 0.720 |
| Length for age percentile (adjusted for breastfeeding status) | |||
| Louie 2011 | Mean (95% CI): 47.9 (38.6–57.2) | Mean (95% CI): 48.1 (36.9–59.3) | 0.977 |
| Weight for length percentile (adjusted for breastfeeding status) | |||
| Louie 2011 | Mean (95% CI): 72.4 (61.2–83.6) | Mean (95% CI): 64.6 (51.0–78.1) | 0.511 |
Comparison 6 Low‐GI diet versus high‐fibre moderate‐GI diet, Outcome 12 Weight and height at 3 months postpartum.

Comparison 6 Low‐GI diet versus high‐fibre moderate‐GI diet, Outcome 13 Weight gain during pregnancy (kg).
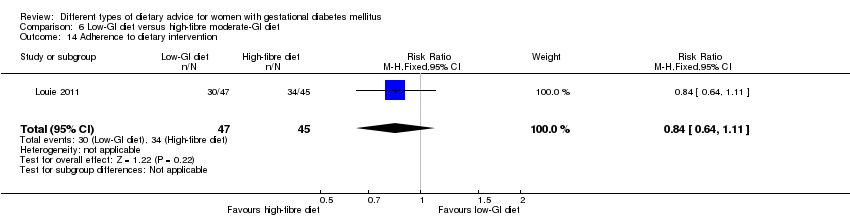
Comparison 6 Low‐GI diet versus high‐fibre moderate‐GI diet, Outcome 14 Adherence to dietary intervention.

Comparison 6 Low‐GI diet versus high‐fibre moderate‐GI diet, Outcome 15 Insulin sensitivity: end of intervention: HOMA2‐IR (%).
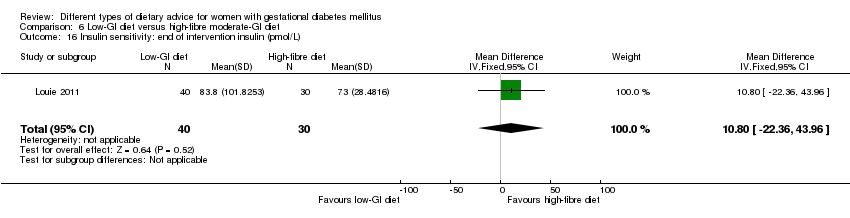
Comparison 6 Low‐GI diet versus high‐fibre moderate‐GI diet, Outcome 16 Insulin sensitivity: end of intervention insulin (pmol/L).
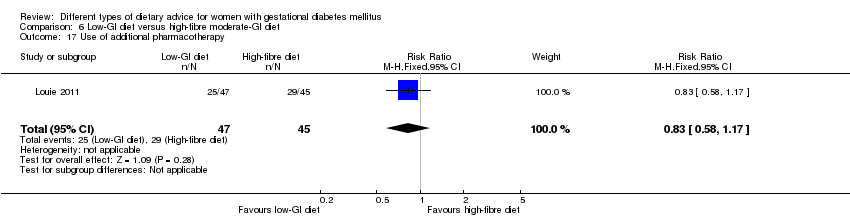
Comparison 6 Low‐GI diet versus high‐fibre moderate‐GI diet, Outcome 17 Use of additional pharmacotherapy.
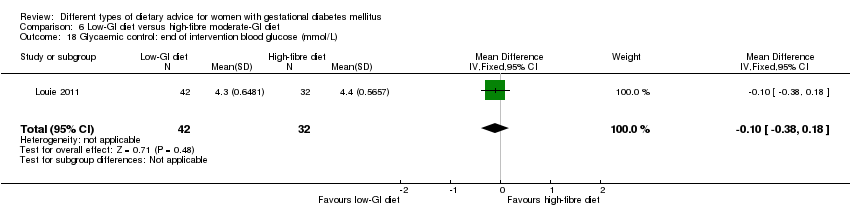
Comparison 6 Low‐GI diet versus high‐fibre moderate‐GI diet, Outcome 18 Glycaemic control: end of intervention blood glucose (mmol/L).
| Study | Low‐GI diet (N =43) | High‐fibre moderate‐GI diet (N =41) | P value |
| Louie 2011 | Mean (SEM): 5.5 (0.1) | Mean (SEM): 5.5 (0.0) | 0.665 |
Comparison 6 Low‐GI diet versus high‐fibre moderate‐GI diet, Outcome 19 Glycaemic control: end of intervention HbA1c (%).

Comparison 6 Low‐GI diet versus high‐fibre moderate‐GI diet, Outcome 20 Return to pre‐pregnancy weight at 3 months postpartum.
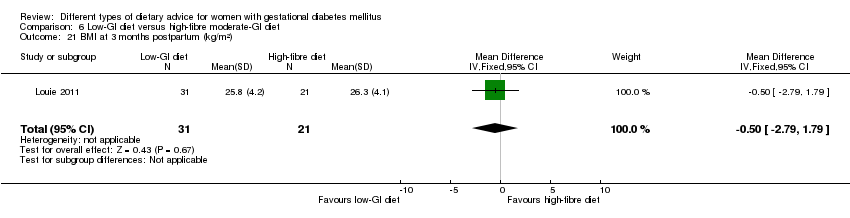
Comparison 6 Low‐GI diet versus high‐fibre moderate‐GI diet, Outcome 21 BMI at 3 months postpartum (kg/m²).
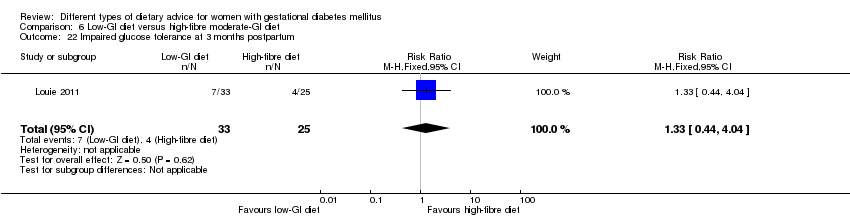
Comparison 6 Low‐GI diet versus high‐fibre moderate‐GI diet, Outcome 22 Impaired glucose tolerance at 3 months postpartum.
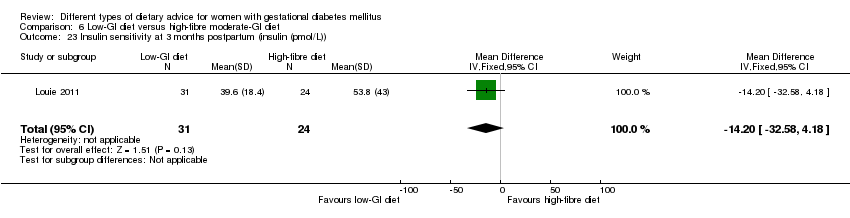
Comparison 6 Low‐GI diet versus high‐fibre moderate‐GI diet, Outcome 23 Insulin sensitivity at 3 months postpartum (insulin (pmol/L)).
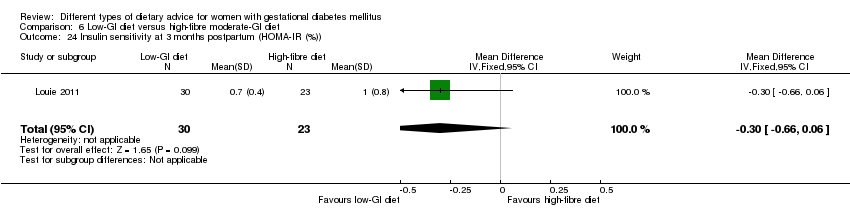
Comparison 6 Low‐GI diet versus high‐fibre moderate‐GI diet, Outcome 24 Insulin sensitivity at 3 months postpartum (HOMA‐IR (%)).

Comparison 7 Diet recommendation + diet‐related behavioural advice versus diet recommendation only, Outcome 1 Large‐for‐gestational age.
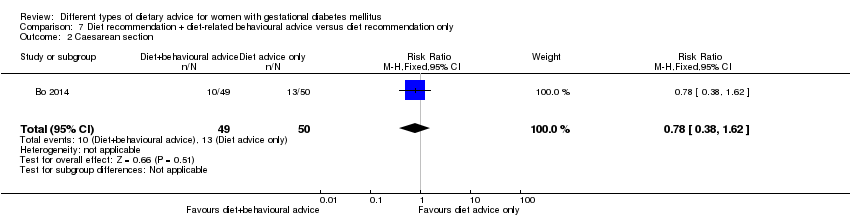
Comparison 7 Diet recommendation + diet‐related behavioural advice versus diet recommendation only, Outcome 2 Caesarean section.
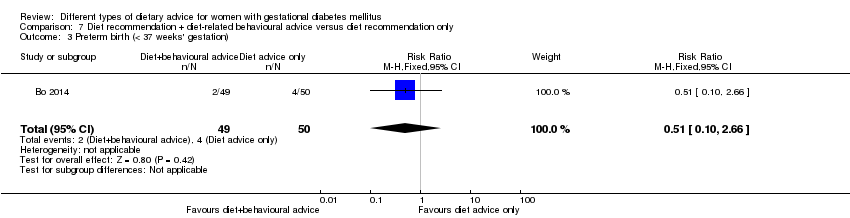
Comparison 7 Diet recommendation + diet‐related behavioural advice versus diet recommendation only, Outcome 3 Preterm birth (< 37 weeks' gestation).

Comparison 7 Diet recommendation + diet‐related behavioural advice versus diet recommendation only, Outcome 4 Gestational weight gain: BMI at end of intervention (kg/m²).
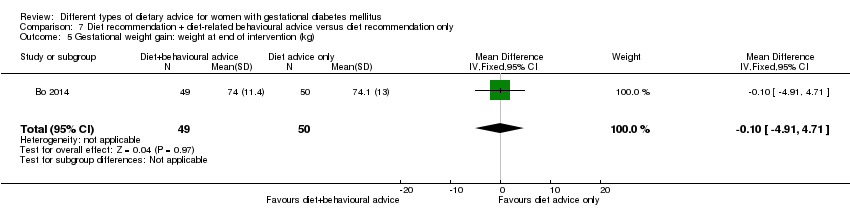
Comparison 7 Diet recommendation + diet‐related behavioural advice versus diet recommendation only, Outcome 5 Gestational weight gain: weight at end of intervention (kg).
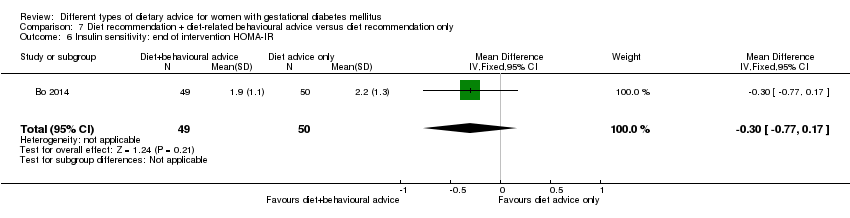
Comparison 7 Diet recommendation + diet‐related behavioural advice versus diet recommendation only, Outcome 6 Insulin sensitivity: end of intervention HOMA‐IR.

Comparison 7 Diet recommendation + diet‐related behavioural advice versus diet recommendation only, Outcome 7 Insulin sensitivity: end of intervention fasting insulin (µU/mL).

Comparison 7 Diet recommendation + diet‐related behavioural advice versus diet recommendation only, Outcome 8 Use of additional pharmacotherapy.

Comparison 7 Diet recommendation + diet‐related behavioural advice versus diet recommendation only, Outcome 9 Glycaemic control: end of intervention fasting glucose (mg/dL).
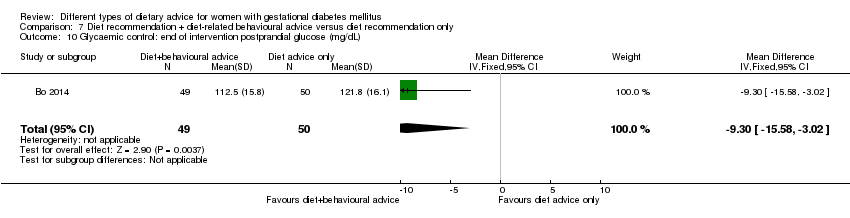
Comparison 7 Diet recommendation + diet‐related behavioural advice versus diet recommendation only, Outcome 10 Glycaemic control: end of intervention postprandial glucose (mg/dL).

Comparison 7 Diet recommendation + diet‐related behavioural advice versus diet recommendation only, Outcome 11 Glycaemic control: end of intervention HbA1c (%).

Comparison 7 Diet recommendation + diet‐related behavioural advice versus diet recommendation only, Outcome 12 Length of postnatal stay (baby): stay > 4 days.
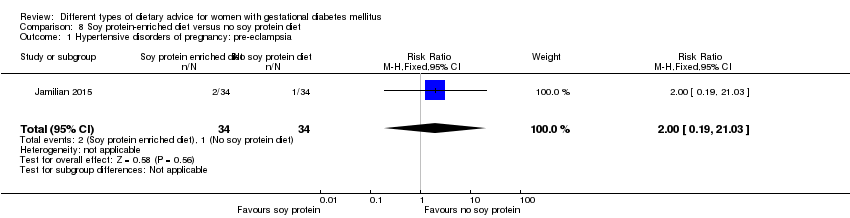
Comparison 8 Soy protein‐enriched diet versus no soy protein diet, Outcome 1 Hypertensive disorders of pregnancy: pre‐eclampsia.
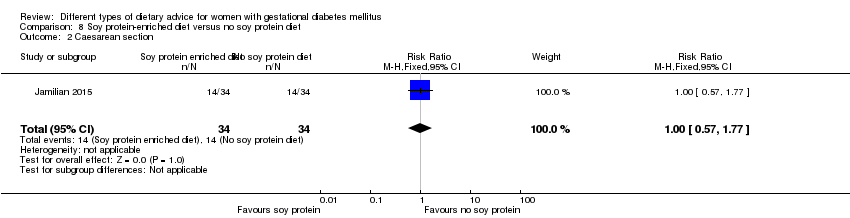
Comparison 8 Soy protein‐enriched diet versus no soy protein diet, Outcome 2 Caesarean section.

Comparison 8 Soy protein‐enriched diet versus no soy protein diet, Outcome 3 Gestational age at birth (weeks).
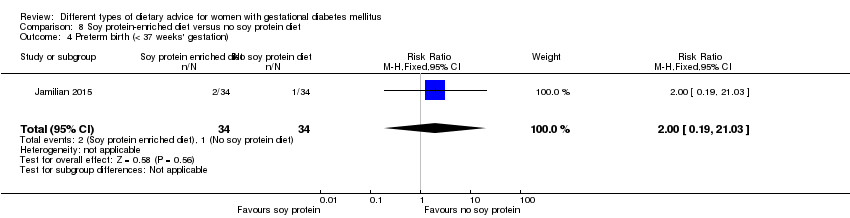
Comparison 8 Soy protein‐enriched diet versus no soy protein diet, Outcome 4 Preterm birth (< 37 weeks' gestation).
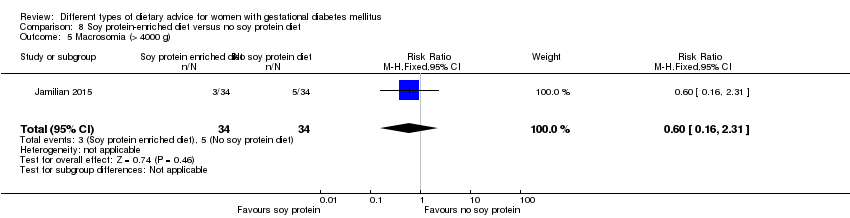
Comparison 8 Soy protein‐enriched diet versus no soy protein diet, Outcome 5 Macrosomia (> 4000 g).

Comparison 8 Soy protein‐enriched diet versus no soy protein diet, Outcome 6 Birthweight (g).

Comparison 8 Soy protein‐enriched diet versus no soy protein diet, Outcome 7 Head circumference at birth (cm).
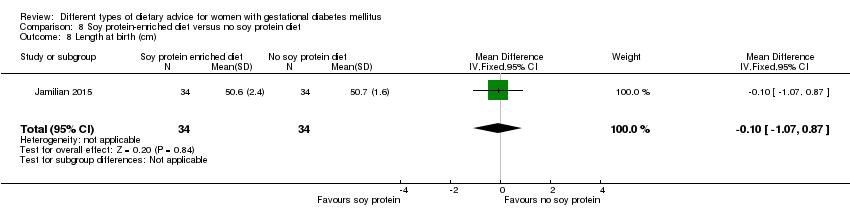
Comparison 8 Soy protein‐enriched diet versus no soy protein diet, Outcome 8 Length at birth (cm).
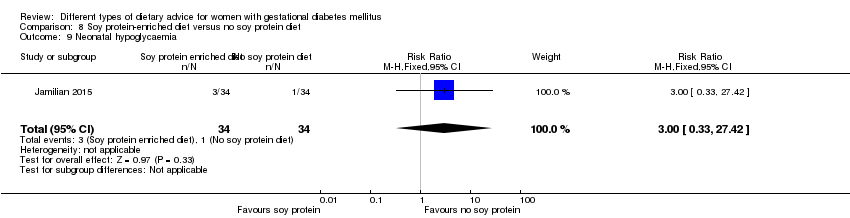
Comparison 8 Soy protein‐enriched diet versus no soy protein diet, Outcome 9 Neonatal hypoglycaemia.
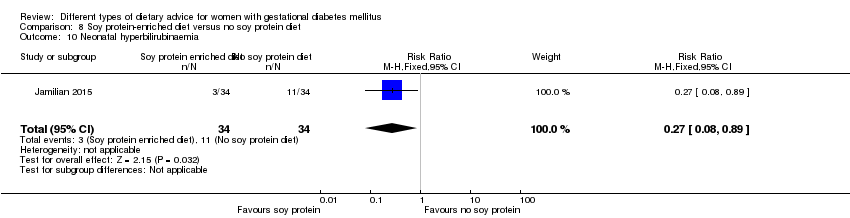
Comparison 8 Soy protein‐enriched diet versus no soy protein diet, Outcome 10 Neonatal hyperbilirubinaemia.

Comparison 8 Soy protein‐enriched diet versus no soy protein diet, Outcome 11 Gestational weight gain: BMI at end of intervention (kg/m²).

Comparison 8 Soy protein‐enriched diet versus no soy protein diet, Outcome 12 Gestational weight gain: weight at end of intervention (kg).

Comparison 8 Soy protein‐enriched diet versus no soy protein diet, Outcome 13 Insulin sensitivity: end of intervention HOMA‐IR.

Comparison 8 Soy protein‐enriched diet versus no soy protein diet, Outcome 14 Insulin sensitivity: end of intervention QUICKI.
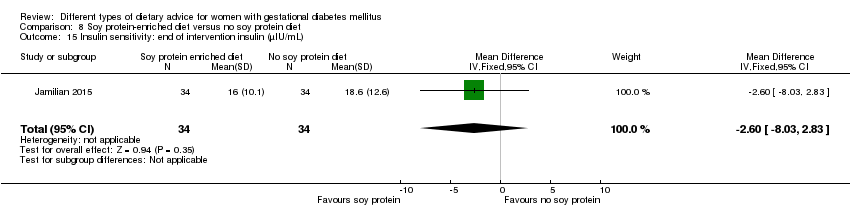
Comparison 8 Soy protein‐enriched diet versus no soy protein diet, Outcome 15 Insulin sensitivity: end of intervention insulin (µIU/mL).
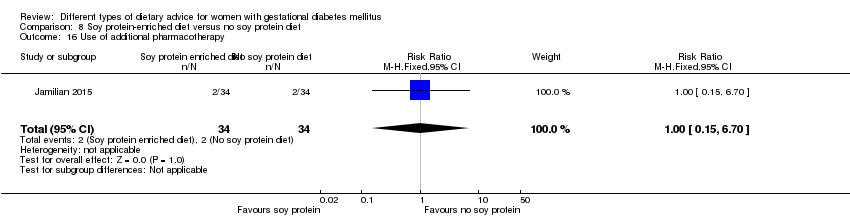
Comparison 8 Soy protein‐enriched diet versus no soy protein diet, Outcome 16 Use of additional pharmacotherapy.

Comparison 8 Soy protein‐enriched diet versus no soy protein diet, Outcome 17 Glycaemic control: end of intervention fasting plasma glucose (mg/dL).
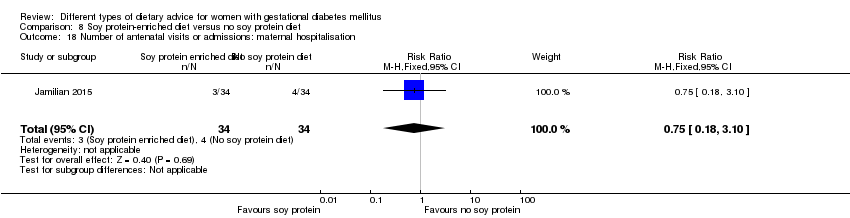
Comparison 8 Soy protein‐enriched diet versus no soy protein diet, Outcome 18 Number of antenatal visits or admissions: maternal hospitalisation.
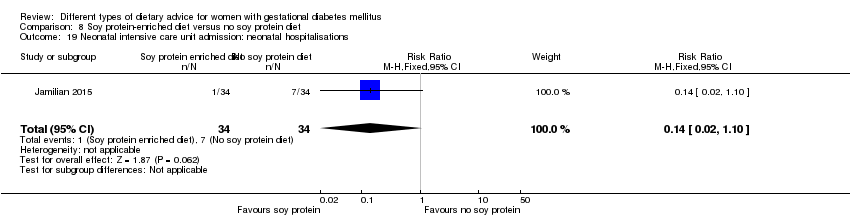
Comparison 8 Soy protein‐enriched diet versus no soy protein diet, Outcome 19 Neonatal intensive care unit admission: neonatal hospitalisations.

Comparison 9 High‐fibre diet versus standard‐fibre diet, Outcome 1 Gestational age at birth (weeks).
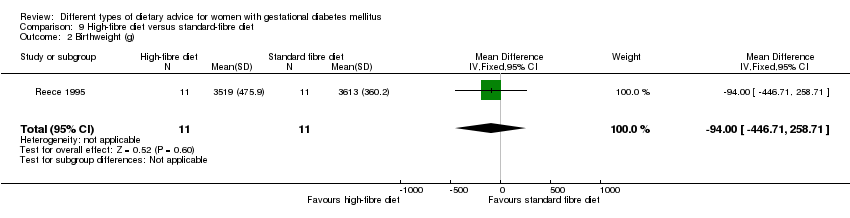
Comparison 9 High‐fibre diet versus standard‐fibre diet, Outcome 2 Birthweight (g).

Comparison 9 High‐fibre diet versus standard‐fibre diet, Outcome 3 Gestational weight gain (kg).
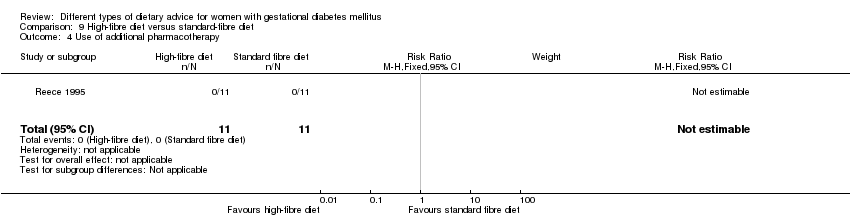
Comparison 9 High‐fibre diet versus standard‐fibre diet, Outcome 4 Use of additional pharmacotherapy.

Comparison 9 High‐fibre diet versus standard‐fibre diet, Outcome 5 Glycaemic control during/at end of intervention: mean blood glucose (mg/dL).
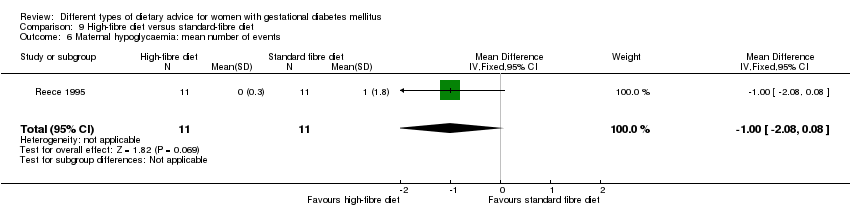
Comparison 9 High‐fibre diet versus standard‐fibre diet, Outcome 6 Maternal hypoglycaemia: mean number of events.

Comparison 10 Ethnic‐specific diet versus standard healthy diet, Outcome 1 Large‐for‐gestational age.

Comparison 10 Ethnic‐specific diet versus standard healthy diet, Outcome 2 Neonatal composite outcome: hypoglycaemia, neonatal asphyxia, respiratory distress syndrome, and hyperbilirubinaemia, hypocalcaemia.
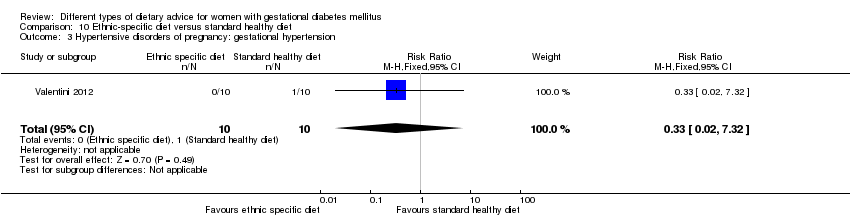
Comparison 10 Ethnic‐specific diet versus standard healthy diet, Outcome 3 Hypertensive disorders of pregnancy: gestational hypertension.
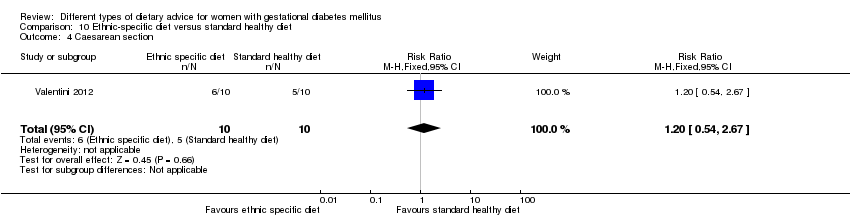
Comparison 10 Ethnic‐specific diet versus standard healthy diet, Outcome 4 Caesarean section.

Comparison 10 Ethnic‐specific diet versus standard healthy diet, Outcome 5 Gestational age at birth (weeks).
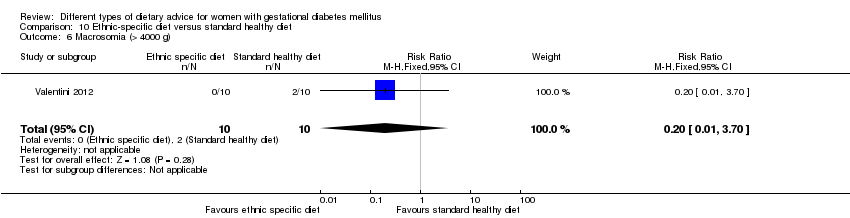
Comparison 10 Ethnic‐specific diet versus standard healthy diet, Outcome 6 Macrosomia (> 4000 g).

Comparison 10 Ethnic‐specific diet versus standard healthy diet, Outcome 7 Small‐for‐gestational age.

Comparison 10 Ethnic‐specific diet versus standard healthy diet, Outcome 8 Birthweight (g).

Comparison 10 Ethnic‐specific diet versus standard healthy diet, Outcome 9 Respiratory distress syndrome.

Comparison 10 Ethnic‐specific diet versus standard healthy diet, Outcome 10 Neonatal hypoglycaemia.

Comparison 10 Ethnic‐specific diet versus standard healthy diet, Outcome 11 Neonatal hyperbilirubinaemia.

Comparison 10 Ethnic‐specific diet versus standard healthy diet, Outcome 12 Neonatal hypocalcaemia.

Comparison 10 Ethnic‐specific diet versus standard healthy diet, Outcome 13 Gestational weight gain (kg).

Comparison 10 Ethnic‐specific diet versus standard healthy diet, Outcome 14 Adherence to dietary intervention: good adherence.

Comparison 10 Ethnic‐specific diet versus standard healthy diet, Outcome 15 Use of additional pharmacotherapy.
| Low‐moderate GI diet versus moderate‐high GI diet (maternal outcomes) | ||||||
| Patient or population: pregnant women with GDM Settings: 4 RCTs in Australia, Canada, China and Mexico Intervention: low‐moderate GI diet Comparison: moderate‐high GI diet | ||||||
| Outcomes | Illustrative comparative risks* (95% CI) | Relative effect | No of participants | Quality of the evidence | Comments | |
| Risk with moderate‐high GI diet | Risk with low‐moderate GI diet | |||||
| Hypertensive disorders of pregnancy: severe hypertension or pre‐eclampsia | Study population | RR 1.02 (0.07 to 15.86) | 95 (1 RCT) | ⊕⊝⊝⊝ VERY LOW1,2 | 1 RCT in China | |
| 21 per 1000 | 21 per 1000 (2 to 333) | |||||
| Hypertensive disorders of pregnancy: eclampsia | Study population | RR 0.34 (0.01 to 8.14) | 83 (1 RCT) | ⊕⊝⊝⊝ VERY LOW1,2 | 1 RCT in China | |
| 24 per 1000 | 8 per 1000 (0 to 195) | |||||
| Caesarean section | Study population | RR 0.66 (0.29 to 1.47) | 63 (1 RCT) | ⊕⊕⊝⊝ LOW3,4 | 1 RCT in Australia | |
| 344 per 1000 | 227 per 1000 (100 to 506) | |||||
| Induction of labour | Study population | RR 0.88 (0.33 to 2.34) | 63 (1 RCT) | ⊕⊕⊝⊝ LOW3,4 | 1 RCT in Australia | |
| 219 per 1000 | 193 per 1000 (72 to 512) | |||||
| Perineal trauma | Not reported | |||||
| Type 2 diabetes mellitus | Not reported | |||||
| Postnatal depression | Not reported | |||||
| Postnatal weight retention or return to pre‐pregnancy weight | Not reported | |||||
| *The risk in the intervention group (and its 95% confidence interval) is based on the assumed risk in the comparison group and the relative effect of the intervention (and its 95% CI). | ||||||
| GRADE Working Group grades of evidence | ||||||
| 1Design limitations: one study at high risk of selection and performance bias; unclear risk of detection bias. 2Imprecision: wide confidence interval crossing the line of no effect, few events and small sample size. 3Design limitations: one study at unclear risk of selection and detection bias; high risk of performance bias. 4Imprecision: wide confidence interval crossing the line of no effect and small sample size. | ||||||
| Low‐moderate GI diet versus moderate‐high GI diet (neonatal/child/adulthood outcomes) | ||||||
| Patient or population: pregnant women with GDM Settings: 4 RCTs in Australia, Canada, China and Mexico Intervention: low‐moderate GI diet Comparison: moderate‐high GI diet | ||||||
| Outcomes | Illustrative comparative risks* (95% CI) | Relative effect | No of participants | Quality of the evidence | Comments | |
| Risk with moderate‐high GI diet | Risk with low‐moderate GI diet | |||||
| Large‐for‐gestational age | Study population | RR 0.71 (0.22 to 2.34) | 89 (2 RCTs) | ⊕⊕⊝⊝ LOW1,2 | 2 RCTs in Australia and Canada | |
| 146 per 1000 | 104 per 1000 (32 to 342) | |||||
| Perinatal mortality | Not reported | |||||
| Neonatal mortality or morbidity composite | Not reported | |||||
| Neonatal hypoglycaemia | Not reported | |||||
| Childhood/adulthood neurosensory disability | Not reported | |||||
| Childhood/adulthood adiposity | Not reported | |||||
| Childhood/adulthood type 2 diabetes mellitus | Not reported | |||||
| *The risk in the intervention group (and its 95% confidence interval) is based on the assumed risk in the comparison group and the relative effect of the intervention (and its 95% CI). | ||||||
| GRADE Working Group grades of evidence | ||||||
| 1Design limitations: one study at unclear risk of selection bias; two at high risk of performance bias and unclear risk of detection bias. 2Imprecision: wide confidence interval crossing the line of no effect and small sample sizes. | ||||||
| Energy‐restricted diet versus no energy‐restricted diet | ||||||
| Patient or population: pregnant women with GDM Settings: 3 RCTs in Australia, Canada and the United States Intervention: energy‐restricted diet Comparison: no energy‐restricted diet | ||||||
| Outcomes | Illustrative comparative risks* (95% CI) | Relative effect | No of participants | Quality of the evidence | Comments | |
| Risk with no energy‐restricted diet | Risk with energy‐restricted diet | |||||
| Hypertensive disorders of pregnancy: pre‐eclampsia | Study population | RR 1.00 (0.51 to 1.97) | 117 (1 RCT) | ⊕⊕⊝⊝ LOW1,2 | 1 RCT in Australia | |
| 222 per 1000 | 222 per 1000 (113 to 437) | |||||
| Caesarean section | Study population | RR 1.12 (0.80 to 1.56) | 420 (2 RCTs) | ⊕⊕⊝⊝ LOW3,4 | 2 RCTs in Australia and Canada | |
| 228 per 1000 | 255 per 1000 (182 to 356) | |||||
| Induction of labour | Study population | RR 1.02 (0.68 to 1.53) | 114 (1 RCT) | ⊕⊕⊝⊝ LOW1,2 | 1 RCT in Australia | |
| 451 per 1000 | 460 per 1000 (307 to 690) | |||||
| Perineal trauma | Not reported | |||||
| Type 2 diabetes mellitus | Not reported | |||||
| Postnatal depression | Not reported | |||||
| Postnatal weight retention or return to pre‐pregnancy weight | Not reported | |||||
| *The risk in the intervention group (and its 95% confidence interval) is based on the assumed risk in the comparison group and the relative effect of the intervention (and its 95% CI). | ||||||
| GRADE Working Group grades of evidence | ||||||
| 1Design limitations: one study at unclear risk of selection and detection bias. 2Imprecision: wide confidence interval crossing the line of no effect and small sample size. 3Design limitations: two studies at unclear risk of selection bias; one at high risk of performance bias and unclear risk of detection bias. 4Imprecision: wide confidence interval crossing the line of no effect. | ||||||
| Energy‐restricted diet versus no energy‐restricted diet (neonatal/child/adulthood outcomes) | ||||||
| Patient or population: pregnant women with GDM Settings: 3 RCTs in Australia, Canada and the United States Intervention: energy‐restricted diet Comparison: no energy‐restricted diet | ||||||
| Outcomes | Illustrative comparative risks* (95% CI) | Relative effect | No of participants | Quality of the evidence | Comments | |
| Risk with no energy‐restricted diet | Risk with energy‐restricted diet | |||||
| Large‐for‐gestational age | Study population | RR 1.17 (0.65 to 2.12) | 123 (1 RCT) | ⊕⊕⊝⊝ LOW1,2 | 1 RCT in Australia | |
| 246 per 1000 | 288 per 1000 (160 to 522) | |||||
| Perinatal mortality | Study population | Not estimable | 423 (2 RCTs) | ⊕⊕⊝⊝ LOW3,4 | No events; 2 RCTs in Australia and Canada | |
| 0 per 1000 | 0 per 1000 (0 to 0) | |||||
| Neonatal mortality or morbidity composite | Not reported | |||||
| Neonatal hypoglycaemia | Study population | RR 1.06 (0.48 to 2.32) | 408 (2 RCTs) | ⊕⊝⊝⊝ VERY LOW3,5,6 | 2 RCTs in Australia and Canada | |
| 190 per 1000 | 201 per 1000 (91 to 441) | |||||
| Childhood/adulthood neurosensory disability | Not reported | |||||
| Childhood/adulthood adiposity | Not reported | |||||
| Childhood/adulthood type 2 diabetes mellitus | Not reported | |||||
| *The risk in the intervention group (and its 95% confidence interval) is based on the assumed risk in the comparison group and the relative effect of the intervention (and its 95% CI). | ||||||
| GRADE Working Group grades of evidence | ||||||
| 1Design limitations: one study at unclear risk of selection and detection bias. 2Imprecision: wide confidence interval crossing the line of no effect and small sample size. 3Design limitations: two studies at unclear risk of selection bias; one at high risk of performance bias and unclear risk of detection bias. 4Imprecision: no events; relatively small sample sizes. 5Imprevision: wide confidence interval crossing the line of no effect. 6Inconsistency: substantial heterogeneity: I² = 75%. | ||||||
| Outcome or subgroup title | No. of studies | No. of participants | Statistical method | Effect size |
| 1 Large‐for‐gestational age Show forest plot | 2 | 89 | Risk Ratio (M‐H, Fixed, 95% CI) | 0.71 [0.22, 2.34] |
| 2 Hypertensive disorders of pregnancy (severe hypertension or pre‐eclampsia) Show forest plot | 1 | 95 | Risk Ratio (M‐H, Fixed, 95% CI) | 1.02 [0.07, 15.86] |
| 3 Hypertensive disorders of pregnancy (eclampsia) Show forest plot | 1 | 83 | Risk Ratio (M‐H, Fixed, 95% CI) | 0.34 [0.01, 8.14] |
| 4 Caesarean section Show forest plot | 1 | 63 | Risk Ratio (M‐H, Fixed, 95% CI) | 0.66 [0.29, 1.47] |
| 5 Gestational age at birth (weeks) Show forest plot | 1 | 62 | Mean Difference (IV, Fixed, 95% CI) | 0.30 [‐0.30, 0.90] |
| 6 Preterm birth Show forest plot | 2 | 146 | Risk Ratio (M‐H, Fixed, 95% CI) | 0.64 [0.22, 1.85] |
| 7 Macrosomia Show forest plot | 3 | 172 | Risk Ratio (M‐H, Fixed, 95% CI) | 0.59 [0.16, 2.26] |
| 8 Small‐for‐gestational age Show forest plot | 1 | 63 | Risk Ratio (M‐H, Fixed, 95% CI) | 5.16 [0.26, 103.27] |
| 9 Birthweight (g) Show forest plot | 2 | 145 | Mean Difference (IV, Fixed, 95% CI) | ‐55.98 [‐201.90, 89.95] |
| 10 Head circumference at birth (cm) Show forest plot | 1 | 59 | Mean Difference (IV, Fixed, 95% CI) | 0.40 [‐0.58, 1.38] |
| 11 Length at birth (cm) Show forest plot | 1 | 60 | Mean Difference (IV, Fixed, 95% CI) | ‐0.5 [‐1.54, 0.54] |
| 12 Ponderal index at birth (kg/m³) Show forest plot | 1 | 60 | Mean Difference (IV, Fixed, 95% CI) | 0.10 [‐0.03, 0.23] |
| 13 Normal vaginal birth Show forest plot | 1 | 63 | Risk Ratio (M‐H, Fixed, 95% CI) | 1.35 [0.89, 2.07] |
| 14 Operative vaginal birth Show forest plot | 1 | 63 | Risk Ratio (M‐H, Fixed, 95% CI) | 0.62 [0.16, 2.37] |
| 15 Induction of labour Show forest plot | 1 | 63 | Risk Ratio (M‐H, Fixed, 95% CI) | 0.88 [0.33, 2.34] |
| 16 Postpartum haemorrhage Show forest plot | 1 | 83 | Risk Ratio (M‐H, Fixed, 95% CI) | 1.02 [0.15, 6.93] |
| 17 Postpartum infection Show forest plot | 1 | 83 | Risk Ratio (M‐H, Fixed, 95% CI) | 0.34 [0.01, 8.14] |
| 18 Gestational weight gain (kg) Show forest plot | 1 | 83 | Mean Difference (IV, Fixed, 95% CI) | ‐0.47 [‐2.18, 1.24] |
| 19 Use of additional pharmacotherapy Show forest plot | 4 | 221 | Risk Ratio (M‐H, Random, 95% CI) | 0.82 [0.39, 1.74] |
| 20 Glycaemic control: end of intervention fasting plasma glucose (mmol/L) Show forest plot | 1 | 83 | Mean Difference (IV, Fixed, 95% CI) | ‐0.15 [‐0.55, 0.25] |
| 21 Glycaemic control: end of intervention 2‐hour postprandial glucose (mmol/L) Show forest plot | 1 | 83 | Mean Difference (IV, Fixed, 95% CI) | ‐0.71 [‐1.21, ‐0.21] |
| 22 Glycaemic control: end of intervention HbA1c (%) Show forest plot | 1 | 83 | Mean Difference (IV, Fixed, 95% CI) | 0.01 [‐0.18, 0.20] |
| Outcome or subgroup title | No. of studies | No. of participants | Statistical method | Effect size |
| 1 Large‐for‐gestational age Show forest plot | 1 | 123 | Risk Ratio (M‐H, Fixed, 95% CI) | 1.17 [0.65, 2.12] |
| 2 Perinatal mortality (stillbirth and neonatal mortality) Show forest plot | 2 | 423 | Risk Ratio (M‐H, Fixed, 95% CI) | 0.0 [0.0, 0.0] |
| 3 Hypertensive disorders of pregnancy: pre‐eclampsia Show forest plot | 1 | 117 | Risk Ratio (M‐H, Fixed, 95% CI) | 1.0 [0.51, 1.97] |
| 4 Caesarean section Show forest plot | 2 | 420 | Risk Ratio (M‐H, Fixed, 95% CI) | 1.12 [0.80, 1.56] |
| 5 Stillbirth Show forest plot | 2 | 423 | Risk Ratio (M‐H, Fixed, 95% CI) | 0.0 [0.0, 0.0] |
| 6 Neonatal mortality Show forest plot | 2 | 423 | Risk Ratio (M‐H, Fixed, 95% CI) | 0.0 [0.0, 0.0] |
| 7 Gestational age at birth (weeks) Show forest plot | 2 | 423 | Mean Difference (IV, Random, 95% CI) | ‐0.16 [‐0.67, 0.36] |
| 8 Macrosomia (> 4000 g) Show forest plot | 2 | 421 | Risk Ratio (M‐H, Fixed, 95% CI) | 0.99 [0.64, 1.53] |
| 9 Macrosomia (> 4500 g) Show forest plot | 1 | 299 | Risk Ratio (M‐H, Fixed, 95% CI) | 1.01 [0.33, 3.05] |
| 10 Birthweight (g) Show forest plot | 1 | 299 | Mean Difference (IV, Fixed, 95% CI) | ‐107.0 [‐240.32, 26.32] |
| 11 Shoulder dystocia Show forest plot | 2 | 418 | Risk Ratio (M‐H, Fixed, 95% CI) | 0.12 [0.01, 2.26] |
| 12 Bone fracture Show forest plot | 1 | 299 | Risk Ratio (M‐H, Fixed, 95% CI) | 0.0 [0.0, 0.0] |
| 13 Nerve palsy Show forest plot | 1 | 299 | Risk Ratio (M‐H, Fixed, 95% CI) | 0.0 [0.0, 0.0] |
| 14 Neonatal hypoglycaemia Show forest plot | 2 | 408 | Risk Ratio (M‐H, Random, 95% CI) | 1.06 [0.48, 2.32] |
| 15 Neonatal hyperbilirubinemia Show forest plot | 1 | 299 | Risk Ratio (M‐H, Fixed, 95% CI) | 0.81 [0.33, 1.98] |
| 16 Neonatal hypocalcaemia Show forest plot | 1 | 299 | Risk Ratio (M‐H, Fixed, 95% CI) | 1.36 [1.00, 1.86] |
| 17 Normal vaginal birth Show forest plot | 2 | 420 | Risk Ratio (M‐H, Fixed, 95% CI) | 0.96 [0.86, 1.08] |
| 18 Operative vaginal birth Show forest plot | 1 | 121 | Risk Ratio (M‐H, Fixed, 95% CI) | 0.98 [0.38, 2.54] |
| 19 Induction of labour Show forest plot | 1 | 114 | Risk Ratio (M‐H, Fixed, 95% CI) | 1.02 [0.68, 1.53] |
| 20 Gestational weight gain (kg) Show forest plot | 1 | 117 | Mean Difference (IV, Fixed, 95% CI) | 1.88 [‐1.96, 5.72] |
| 21 Gestational weight gain: weight at birth (kg) Show forest plot | 1 | 299 | Mean Difference (IV, Fixed, 95% CI) | ‐3.15 [‐7.29, 0.99] |
| 22 Insulin sensitivity: during intervention fasting plasma insulin (pM) Show forest plot | 1 | 12 | Mean Difference (IV, Fixed, 95% CI) | 100.0 [‐26.02, 226.02] |
| 23 Insulin sensitivity: end of intervention fasting plasma insulin (pM) Show forest plot | 1 | 12 | Mean Difference (IV, Fixed, 95% CI) | ‐20.0 [‐127.70, 87.70] |
| 24 Use of additional pharmacotherapy Show forest plot | 2 | Risk Ratio (M‐H, Random, 95% CI) | Subtotals only | |
| 25 Glycaemic control: during intervention preprandial/fasting glucose (mmol/L) Show forest plot | 2 | 311 | Mean Difference (IV, Random, 95% CI) | 0.21 [‐0.58, 0.99] |
| 26 Glycaemic control: during intervention 24 hour mean plasma glucose (mmol/L) Show forest plot | 1 | 12 | Mean Difference (IV, Fixed, 95% CI) | 0.10 [‐0.82, 1.02] |
| 27 Glycaemic control: during intervention 1 hour postprandial glucose (mmol/L) Show forest plot | 1 | 299 | Mean Difference (IV, Fixed, 95% CI) | ‐0.25 [‐0.68, 0.18] |
| 28 Glycaemic control: end of intervention preprandial/fasting glucose (mmol/L) Show forest plot | 2 | 311 | Mean Difference (IV, Fixed, 95% CI) | ‐0.23 [‐0.44, ‐0.03] |
| 29 Glycaemic control: end of intervention 24‐hour mean plasma glucose (mmol/L) Show forest plot | 1 | 12 | Mean Difference (IV, Fixed, 95% CI) | ‐1.30 [‐2.25, ‐0.35] |
| 30 Glycaemic control: end of intervention 1‐hour postprandial glucose (mmol/L) Show forest plot | 1 | 299 | Mean Difference (IV, Fixed, 95% CI) | ‐0.51 [‐0.89, ‐0.13] |
| 31 Glycaemic control: during/at end of intervention fasting glucose (mmol/L) Show forest plot | 1 | 117 | Mean Difference (IV, Fixed, 95% CI) | 0.10 [‐0.18, 0.38] |
| 32 Glycaemic control: during/at end of intervention mean plasma glucose (mmol/L) Show forest plot | 1 | 117 | Mean Difference (IV, Fixed, 95% CI) | 0.10 [‐0.34, 0.54] |
| 33 Glycaemic control: during/at end of intervention mean HbA1c (%) Show forest plot | 1 | 117 | Mean Difference (IV, Fixed, 95% CI) | ‐0.20 [‐0.64, 0.24] |
| Outcome or subgroup title | No. of studies | No. of participants | Statistical method | Effect size |
| 1 Hypertensive disorders of pregnancy: pre‐eclampsia Show forest plot | 3 | 136 | Risk Ratio (M‐H, Fixed, 95% CI) | 1.0 [0.31, 3.26] |
| 2 Caesarean section Show forest plot | 2 | 86 | Risk Ratio (M‐H, Fixed, 95% CI) | 0.53 [0.37, 0.76] |
| 3 Gestational age at birth (weeks) Show forest plot | 1 | 52 | Mean Difference (IV, Fixed, 95% CI) | 0.20 [‐0.45, 0.85] |
| 4 Macrosomia (≥ 4000 g) Show forest plot | 1 | 52 | Risk Ratio (M‐H, Fixed, 95% CI) | 0.1 [0.01, 0.73] |
| 5 Birthweight (g) Show forest plot | 2 | 86 | Mean Difference (IV, Fixed, 95% CI) | ‐581.27 [‐790.32, ‐372.22] |
| 6 Head circumference at birth (cm) Show forest plot | 1 | 52 | Mean Difference (IV, Fixed, 95% CI) | ‐0.90 [‐1.44, ‐0.36] |
| 7 Length at birth(cm) Show forest plot | 1 | 52 | Mean Difference (IV, Fixed, 95% CI) | ‐0.5 [‐1.59, 0.59] |
| 8 Ponderal index at birth (kg/m³) Show forest plot | 1 | 52 | Mean Difference (IV, Fixed, 95% CI) | ‐0.37 [‐0.54, ‐0.20] |
| 9 Placental abruption Show forest plot | 1 | 58 | Risk Ratio (M‐H, Fixed, 95% CI) | 3.0 [0.13, 70.74] |
| 10 Gestational weight gain: BMI at end of intervention (kg/m²) Show forest plot | 2 | 66 | Mean Difference (IV, Random, 95% CI) | ‐0.83 [‐3.76, 2.11] |
| 11 Gestational weight gain: weight at end of intervention (kg) Show forest plot | 2 | 66 | Mean Difference (IV, Fixed, 95% CI) | ‐2.88 [‐8.48, 2.71] |
| 12 Insulin sensitivity: end of intervention HOMA‐IR Show forest plot | 1 | 32 | Mean Difference (IV, Fixed, 95% CI) | 1.00 [‐1.34, ‐0.66] |
| 13 Insulin sensitivity: end of intervention insulin (µIU/mL) Show forest plot | 1 | 32 | Mean Difference (IV, Fixed, 95% CI) | ‐3.26 [‐4.42, ‐2.10] |
| 14 Use of additional pharmacotherapy Show forest plot | 2 | 86 | Risk Ratio (M‐H, Fixed, 95% CI) | 0.28 [0.14, 0.53] |
| 15 Glycaemic control: end of intervention fasting blood glucose (mmol/L) Show forest plot | 2 | 66 | Mean Difference (IV, Fixed, 95% CI) | ‐0.42 [‐0.53, ‐0.32] |
| 16 Glycaemic control: at end of intervention HbA1c (%) Show forest plot | 1 | 34 | Mean Difference (IV, Fixed, 95% CI) | ‐0.25 [‐0.76, 0.26] |
| Outcome or subgroup title | No. of studies | No. of participants | Statistical method | Effect size |
| 1 Large‐for‐gestational age Show forest plot | 1 | 149 | Risk Ratio (M‐H, Fixed, 95% CI) | 0.51 [0.13, 1.95] |
| 2 Perinatal mortality (stillbirth and neonatal mortality) Show forest plot | 1 | 150 | Risk Ratio (M‐H, Fixed, 95% CI) | 3.0 [0.12, 72.49] |
| 3 Hypertensive disorders of pregnancy: maternal hypertension Show forest plot | 1 | 150 | Risk Ratio (M‐H, Fixed, 95% CI) | 0.4 [0.13, 1.22] |
| 4 Caesarean section Show forest plot | 2 | 179 | Risk Ratio (M‐H, Fixed, 95% CI) | 1.29 [0.84, 1.99] |
| 5 Stillbirth Show forest plot | 1 | 150 | Risk Ratio (M‐H, Fixed, 95% CI) | 3.0 [0.12, 72.49] |
| 6 Gestational age at birth (weeks) Show forest plot | 2 | 180 | Mean Difference (IV, Fixed, 95% CI) | 0.10 [‐0.42, 0.62] |
| 7 Macrosomia (> 4000 g) Show forest plot | 2 | 179 | Risk Ratio (M‐H, Fixed, 95% CI) | 0.20 [0.02, 1.69] |
| 8 Small‐for‐gestational age Show forest plot | 1 | 149 | Risk Ratio (M‐H, Fixed, 95% CI) | 0.68 [0.29, 1.56] |
| 9 Birthweight (g) Show forest plot | 1 | 30 | Mean Difference (IV, Fixed, 95% CI) | 22.0 [‐241.06, 285.06] |
| 10 Neonatal hypoglycaemia Show forest plot | 1 | 149 | Risk Ratio (M‐H, Fixed, 95% CI) | 0.91 [0.39, 2.12] |
| 11 Normal vaginal birth Show forest plot | 1 | 30 | Risk Ratio (M‐H, Fixed, 95% CI) | 0.78 [0.39, 1.54] |
| 12 Operative vaginal birth Show forest plot | 1 | 30 | Risk Ratio (M‐H, Fixed, 95% CI) | 1.0 [0.07, 14.55] |
| 13 Gestational weight gain: maternal weight gain (kg) Show forest plot | 1 | 145 | Mean Difference (IV, Fixed, 95% CI) | ‐0.90 [‐1.60, ‐0.20] |
| 14 Adherence to dietary intervention: fully applied the recommended menu Show forest plot | 1 | 30 | Risk Ratio (M‐H, Fixed, 95% CI) | 1.09 [0.73, 1.62] |
| 15 Use of additional pharmacotherapy. Show forest plot | 2 | 180 | Risk Ratio (M‐H, Fixed, 95% CI) | 1.02 [0.77, 1.37] |
| 16 Glycaemic control: end of intervention fasting blood glucose (mg/dL) Show forest plot | 1 | 30 | Mean Difference (IV, Fixed, 95% CI) | 5.0 [‐0.01, 10.01] |
| 17 Glycaemic control: end of intervention 2‐hour post breakfast blood glucose (mg/dL) Show forest plot | 1 | 30 | Mean Difference (IV, Fixed, 95% CI) | 5.0 [‐1.60, 11.60] |
| 18 Glycaemic control: end of intervention 2‐hour post lunch blood glucose (mg/dL) Show forest plot | 1 | 30 | Mean Difference (IV, Fixed, 95% CI) | 3.0 [‐2.77, 8.77] |
| 19 Glycaemic control: end of intervention 2‐hour post dinner blood glucose (mg/dL) Show forest plot | 1 | 30 | Mean Difference (IV, Fixed, 95% CI) | 6.0 [‐1.47, 13.47] |
| Outcome or subgroup title | No. of studies | No. of participants | Statistical method | Effect size |
| 1 Large‐for‐gestational age Show forest plot | 1 | 27 | Risk Ratio (M‐H, Fixed, 95% CI) | 0.54 [0.21, 1.37] |
| 2 Hypertensive disorders of pregnancy: pre‐eclampsia Show forest plot | 1 | 27 | Risk Ratio (M‐H, Fixed, 95% CI) | 0.0 [0.0, 0.0] |
| 3 Hypertensive disorders of pregnancy: hypertension in pregnancy Show forest plot | 1 | 27 | Risk Ratio (M‐H, Fixed, 95% CI) | 0.54 [0.06, 5.26] |
| 4 Caesarean section Show forest plot | 1 | 27 | Risk Ratio (M‐H, Fixed, 95% CI) | 1.08 [0.07, 15.50] |
| 5 Type 2 diabetes: 'diabetic' OGTT 1‐2 weeks postpartum Show forest plot | 1 | 24 | Risk Ratio (M‐H, Fixed, 95% CI) | 2.0 [0.45, 8.94] |
| 6 Type 2 diabetes: 'diabetic' OGTT 4‐13 months postpartum Show forest plot | 1 | 6 | Risk Ratio (M‐H, Fixed, 95% CI) | 1.0 [0.10, 9.61] |
| 7 Gestational age at birth (weeks) Show forest plot | 2 | 111 | Mean Difference (IV, Fixed, 95% CI) | 0.25 [‐0.51, 1.01] |
| 8 Preterm birth Show forest plot | 1 | 84 | Risk Ratio (M‐H, Fixed, 95% CI) | 0.0 [0.0, 0.0] |
| 9 Macrosomia (> 4000 g) Show forest plot | 2 | 111 | Risk Ratio (M‐H, Fixed, 95% CI) | 0.53 [0.18, 1.56] |
| 10 Birthweight (g) Show forest plot | 2 | 111 | Mean Difference (IV, Fixed, 95% CI) | ‐138.19 [‐292.59, 16.21] |
| 11 Placental abruption Show forest plot | 1 | 27 | Risk Ratio (M‐H, Fixed, 95% CI) | 0.0 [0.0, 0.0] |
| 12 Gestational weight gain (kg) Show forest plot | 1 | 84 | Mean Difference (IV, Fixed, 95% CI) | ‐1.98 [‐4.32, 0.36] |
| 13 Gestational weight gain: BMI at birth (kg/m²) Show forest plot | 1 | 27 | Mean Difference (IV, Fixed, 95% CI) | 3.90 [2.41, 5.39] |
| 14 Gestational weight gain: weight at birth (kg) Show forest plot | 1 | 27 | Mean Difference (IV, Fixed, 95% CI) | 11.90 [7.47, 16.33] |
| 15 Insulin sensitivity: during intervention (38 week) insulin (mU/L) Show forest plot | 1 | 24 | Mean Difference (IV, Fixed, 95% CI) | 4.40 [2.59, 6.21] |
| 16 Insulin sensitivity: during intervention (38 week) insulin sensitivity (10‐5 min‐1 per mU/L min) Show forest plot | 1 | 24 | Mean Difference (IV, Fixed, 95% CI) | ‐0.08 [‐0.21, 0.05] |
| 17 Insulin sensitivity: end of intervention IAI Show forest plot | 1 | 84 | Mean Difference (IV, Fixed, 95% CI) | 0.04 [‐0.28, 0.36] |
| 18 Use of additional pharmacotherapy Show forest plot | 2 | 111 | Risk Ratio (M‐H, Fixed, 95% CI) | 0.0 [0.0, 0.0] |
| 19 Glycaemic control: during intervention (38 week) fasting blood glucose (mmol/L) Show forest plot | 1 | 24 | Mean Difference (IV, Fixed, 95% CI) | 0.5 [0.30, 0.70] |
| 20 Glycaemic control: during intervention (38 week) postprandial glucose (mmol/L) Show forest plot | 1 | 25 | Mean Difference (IV, Fixed, 95% CI) | 0.90 [0.58, 1.22] |
| 21 Glycaemic control: during intervention (38 week) HbA1c (%) Show forest plot | 1 | 25 | Mean Difference (IV, Fixed, 95% CI) | 0.40 [0.32, 0.48] |
| 22 Glycaemic control: end of intervention fasting blood glucose (mmol/L) Show forest plot | 1 | 84 | Mean Difference (IV, Fixed, 95% CI) | 0.18 [‐0.17, 0.53] |
| 23 Glycaemic control: end of intervention 2‐hour postprandial blood glucose (mmol/L) Show forest plot | 1 | 84 | Mean Difference (IV, Fixed, 95% CI) | ‐0.02 [‐0.29, 0.25] |
| 24 BMI 5‐9 months postpartum (kg/m²) Show forest plot | 1 | 27 | Mean Difference (IV, Fixed, 95% CI) | 4.10 [2.34, 5.86] |
| 25 Impaired glucose tolerance: 'borderline' OGTT 1‐2 weeks postpartum Show forest plot | 1 | 24 | Risk Ratio (M‐H, Fixed, 95% CI) | 1.5 [0.30, 7.43] |
| 26 Impaired glucose tolerance: 'borderline' OGTT 4‐13 months postpartum Show forest plot | 1 | 7 | Risk Ratio (M‐H, Fixed, 95% CI) | 0.27 [0.01, 4.93] |
| Outcome or subgroup title | No. of studies | No. of participants | Statistical method | Effect size |
| 1 Large‐for‐gestational age Show forest plot | 1 | 92 | Risk Ratio (M‐H, Fixed, 95% CI) | 2.87 [0.61, 13.50] |
| 2 Caesarean section Show forest plot | 1 | 92 | Risk Ratio (M‐H, Fixed, 95% CI) | 1.91 [0.91, 4.03] |
| 3 Type 2 diabetes mellitus at 3 months postpartum Show forest plot | 1 | 58 | Risk Ratio (M‐H, Fixed, 95% CI) | 0.76 [0.11, 5.01] |
| 4 Gestational age at birth (weeks) Show forest plot | 1 | 92 | Mean Difference (IV, Fixed, 95% CI) | ‐0.10 [‐0.39, 0.19] |
| 5 Preterm birth Show forest plot | 1 | 96 | Risk Ratio (M‐H, Fixed, 95% CI) | 0.96 [0.14, 6.53] |
| 6 Macrosomia (> 4000 g) Show forest plot | 1 | 92 | Risk Ratio (M‐H, Fixed, 95% CI) | 0.32 [0.03, 2.96] |
| 7 Small‐for‐gestational age Show forest plot | 1 | 92 | Risk Ratio (M‐H, Fixed, 95% CI) | 1.20 [0.34, 4.18] |
| 8 Birthweight (g) Show forest plot | 1 | 92 | Mean Difference (IV, Fixed, 95% CI) | 0.0 [‐277.18, 277.18] |
| 9 Head circumference at birth (cm) Show forest plot | 1 | 82 | Mean Difference (IV, Fixed, 95% CI) | ‐0.20 [‐0.91, 0.51] |
| 10 Length at birth (cm) Show forest plot | 1 | 92 | Mean Difference (IV, Fixed, 95% CI) | 0.0 [‐0.83, 0.83] |
| 11 Ponderal index at birth (kg/m³) Show forest plot | 1 | 92 | Mean Difference (IV, Fixed, 95% CI) | 0.20 [‐0.79, 1.19] |
| 12 Weight and height at 3 months postpartum Show forest plot | Other data | No numeric data | ||
| 12.1 Weight for age percentile (adjusted for breastfeeding status) | Other data | No numeric data | ||
| 12.2 Length for age percentile (adjusted for breastfeeding status) | Other data | No numeric data | ||
| 12.3 Weight for length percentile (adjusted for breastfeeding status) | Other data | No numeric data | ||
| 13 Weight gain during pregnancy (kg) Show forest plot | 1 | 87 | Mean Difference (IV, Fixed, 95% CI) | ‐1.20 [‐3.43, 1.03] |
| 14 Adherence to dietary intervention Show forest plot | 1 | 92 | Risk Ratio (M‐H, Fixed, 95% CI) | 0.84 [0.64, 1.11] |
| 15 Insulin sensitivity: end of intervention: HOMA2‐IR (%) Show forest plot | 1 | 77 | Mean Difference (IV, Fixed, 95% CI) | ‐0.10 [‐0.38, 0.18] |
| 16 Insulin sensitivity: end of intervention insulin (pmol/L) Show forest plot | 1 | 70 | Mean Difference (IV, Fixed, 95% CI) | 10.80 [‐22.36, 43.96] |
| 17 Use of additional pharmacotherapy Show forest plot | 1 | 92 | Risk Ratio (M‐H, Fixed, 95% CI) | 0.83 [0.58, 1.17] |
| 18 Glycaemic control: end of intervention blood glucose (mmol/L) Show forest plot | 1 | 74 | Mean Difference (IV, Fixed, 95% CI) | ‐0.10 [‐0.38, 0.18] |
| 19 Glycaemic control: end of intervention HbA1c (%) Show forest plot | Other data | No numeric data | ||
| 20 Return to pre‐pregnancy weight at 3 months postpartum Show forest plot | 1 | 55 | Risk Ratio (M‐H, Fixed, 95% CI) | 1.15 [0.43, 3.07] |
| 21 BMI at 3 months postpartum (kg/m²) Show forest plot | 1 | 52 | Mean Difference (IV, Fixed, 95% CI) | ‐0.5 [‐2.79, 1.79] |
| 22 Impaired glucose tolerance at 3 months postpartum Show forest plot | 1 | 58 | Risk Ratio (M‐H, Fixed, 95% CI) | 1.33 [0.44, 4.04] |
| 23 Insulin sensitivity at 3 months postpartum (insulin (pmol/L)) Show forest plot | 1 | 55 | Mean Difference (IV, Fixed, 95% CI) | ‐14.20 [‐32.58, 4.18] |
| 24 Insulin sensitivity at 3 months postpartum (HOMA‐IR (%)) Show forest plot | 1 | 53 | Mean Difference (IV, Fixed, 95% CI) | ‐0.30 [‐0.66, 0.06] |
| Outcome or subgroup title | No. of studies | No. of participants | Statistical method | Effect size |
| 1 Large‐for‐gestational age Show forest plot | 1 | 99 | Risk Ratio (M‐H, Fixed, 95% CI) | 0.73 [0.25, 2.14] |
| 2 Caesarean section Show forest plot | 1 | 99 | Risk Ratio (M‐H, Fixed, 95% CI) | 0.78 [0.38, 1.62] |
| 3 Preterm birth (< 37 weeks' gestation) Show forest plot | 1 | 99 | Risk Ratio (M‐H, Fixed, 95% CI) | 0.51 [0.10, 2.66] |
| 4 Gestational weight gain: BMI at end of intervention (kg/m²) Show forest plot | 1 | 99 | Mean Difference (IV, Fixed, 95% CI) | 0.0 [‐1.75, 1.75] |
| 5 Gestational weight gain: weight at end of intervention (kg) Show forest plot | 1 | 99 | Mean Difference (IV, Fixed, 95% CI) | ‐0.10 [‐4.91, 4.71] |
| 6 Insulin sensitivity: end of intervention HOMA‐IR Show forest plot | 1 | 99 | Mean Difference (IV, Fixed, 95% CI) | ‐0.30 [‐0.77, 0.17] |
| 7 Insulin sensitivity: end of intervention fasting insulin (µU/mL) Show forest plot | 1 | 99 | Mean Difference (IV, Fixed, 95% CI) | ‐0.5 [‐2.69, 1.69] |
| 8 Use of additional pharmacotherapy Show forest plot | 1 | 99 | Risk Ratio (M‐H, Fixed, 95% CI) | 0.61 [0.15, 2.42] |
| 9 Glycaemic control: end of intervention fasting glucose (mg/dL) Show forest plot | 1 | 99 | Mean Difference (IV, Fixed, 95% CI) | 0.0 [‐4.25, 4.25] |
| 10 Glycaemic control: end of intervention postprandial glucose (mg/dL) Show forest plot | 1 | 99 | Mean Difference (IV, Fixed, 95% CI) | ‐9.30 [‐15.58, ‐3.02] |
| 11 Glycaemic control: end of intervention HbA1c (%) Show forest plot | 1 | 99 | Mean Difference (IV, Fixed, 95% CI) | ‐0.10 [‐0.28, 0.08] |
| 12 Length of postnatal stay (baby): stay > 4 days Show forest plot | 1 | 99 | Risk Ratio (M‐H, Fixed, 95% CI) | 1.33 [0.73, 2.44] |
| Outcome or subgroup title | No. of studies | No. of participants | Statistical method | Effect size |
| 1 Hypertensive disorders of pregnancy: pre‐eclampsia Show forest plot | 1 | 68 | Risk Ratio (M‐H, Fixed, 95% CI) | 2.0 [0.19, 21.03] |
| 2 Caesarean section Show forest plot | 1 | 68 | Risk Ratio (M‐H, Fixed, 95% CI) | 1.0 [0.57, 1.77] |
| 3 Gestational age at birth (weeks) Show forest plot | 1 | 68 | Mean Difference (IV, Fixed, 95% CI) | 0.40 [‐0.23, 1.03] |
| 4 Preterm birth (< 37 weeks' gestation) Show forest plot | 1 | 68 | Risk Ratio (M‐H, Fixed, 95% CI) | 2.0 [0.19, 21.03] |
| 5 Macrosomia (> 4000 g) Show forest plot | 1 | 68 | Risk Ratio (M‐H, Fixed, 95% CI) | 0.6 [0.16, 2.31] |
| 6 Birthweight (g) Show forest plot | 1 | 68 | Mean Difference (IV, Fixed, 95% CI) | ‐142.60 [‐360.40, 75.20] |
| 7 Head circumference at birth (cm) Show forest plot | 1 | 68 | Mean Difference (IV, Fixed, 95% CI) | ‐0.20 [‐1.01, 0.61] |
| 8 Length at birth (cm) Show forest plot | 1 | 68 | Mean Difference (IV, Fixed, 95% CI) | ‐0.10 [‐1.07, 0.87] |
| 9 Neonatal hypoglycaemia Show forest plot | 1 | 68 | Risk Ratio (M‐H, Fixed, 95% CI) | 3.0 [0.33, 27.42] |
| 10 Neonatal hyperbilirubinaemia Show forest plot | 1 | 68 | Risk Ratio (M‐H, Fixed, 95% CI) | 0.27 [0.08, 0.89] |
| 11 Gestational weight gain: BMI at end of intervention (kg/m²) Show forest plot | 1 | 68 | Mean Difference (IV, Fixed, 95% CI) | 0.60 [‐1.43, 2.63] |
| 12 Gestational weight gain: weight at end of intervention (kg) Show forest plot | 1 | 68 | Mean Difference (IV, Fixed, 95% CI) | 3.50 [‐1.47, 8.47] |
| 13 Insulin sensitivity: end of intervention HOMA‐IR Show forest plot | 1 | 68 | Mean Difference (IV, Fixed, 95% CI) | ‐1.0 [‐2.20, 0.20] |
| 14 Insulin sensitivity: end of intervention QUICKI Show forest plot | 1 | 68 | Mean Difference (IV, Fixed, 95% CI) | 0.0 [‐0.01, 0.01] |
| 15 Insulin sensitivity: end of intervention insulin (µIU/mL) Show forest plot | 1 | 68 | Mean Difference (IV, Fixed, 95% CI) | ‐2.60 [‐8.03, 2.83] |
| 16 Use of additional pharmacotherapy Show forest plot | 1 | 68 | Risk Ratio (M‐H, Fixed, 95% CI) | 1.0 [0.15, 6.70] |
| 17 Glycaemic control: end of intervention fasting plasma glucose (mg/dL) Show forest plot | 1 | 68 | Mean Difference (IV, Fixed, 95% CI) | ‐10.60 [‐15.37, ‐5.83] |
| 18 Number of antenatal visits or admissions: maternal hospitalisation Show forest plot | 1 | 68 | Risk Ratio (M‐H, Fixed, 95% CI) | 0.75 [0.18, 3.10] |
| 19 Neonatal intensive care unit admission: neonatal hospitalisations Show forest plot | 1 | 68 | Risk Ratio (M‐H, Fixed, 95% CI) | 0.14 [0.02, 1.10] |
| Outcome or subgroup title | No. of studies | No. of participants | Statistical method | Effect size |
| 1 Gestational age at birth (weeks) Show forest plot | 1 | 22 | Mean Difference (IV, Fixed, 95% CI) | 0.0 [‐1.30, 1.30] |
| 2 Birthweight (g) Show forest plot | 1 | 22 | Mean Difference (IV, Fixed, 95% CI) | ‐94.0 [‐446.71, 258.71] |
| 3 Gestational weight gain (kg) Show forest plot | 1 | 22 | Mean Difference (IV, Fixed, 95% CI) | 2.40 [‐2.20, 7.00] |
| 4 Use of additional pharmacotherapy Show forest plot | 1 | 22 | Risk Ratio (M‐H, Fixed, 95% CI) | 0.0 [0.0, 0.0] |
| 5 Glycaemic control during/at end of intervention: mean blood glucose (mg/dL) Show forest plot | 1 | 22 | Mean Difference (IV, Fixed, 95% CI) | 0.0 [‐8.26, 8.26] |
| 6 Maternal hypoglycaemia: mean number of events Show forest plot | 1 | 22 | Mean Difference (IV, Fixed, 95% CI) | ‐1.0 [‐2.08, 0.08] |
| Outcome or subgroup title | No. of studies | No. of participants | Statistical method | Effect size |
| 1 Large‐for‐gestational age Show forest plot | 1 | 20 | Risk Ratio (M‐H, Fixed, 95% CI) | 0.14 [0.01, 2.45] |
| 2 Neonatal composite outcome: hypoglycaemia, neonatal asphyxia, respiratory distress syndrome, and hyperbilirubinaemia, hypocalcaemia Show forest plot | 1 | 20 | Risk Ratio (M‐H, Fixed, 95% CI) | 0.0 [0.0, 0.0] |
| 3 Hypertensive disorders of pregnancy: gestational hypertension Show forest plot | 1 | 20 | Risk Ratio (M‐H, Fixed, 95% CI) | 0.33 [0.02, 7.32] |
| 4 Caesarean section Show forest plot | 1 | 20 | Risk Ratio (M‐H, Fixed, 95% CI) | 1.2 [0.54, 2.67] |
| 5 Gestational age at birth (weeks) Show forest plot | 1 | 20 | Mean Difference (IV, Fixed, 95% CI) | ‐0.40 [‐1.15, 0.35] |
| 6 Macrosomia (> 4000 g) Show forest plot | 1 | 20 | Risk Ratio (M‐H, Fixed, 95% CI) | 0.2 [0.01, 3.70] |
| 7 Small‐for‐gestational age Show forest plot | 1 | 20 | Risk Ratio (M‐H, Fixed, 95% CI) | 0.33 [0.02, 7.32] |
| 8 Birthweight (g) Show forest plot | 1 | 20 | Mean Difference (IV, Fixed, 95% CI) | ‐368.00 [‐928.87, 188.87] |
| 9 Respiratory distress syndrome Show forest plot | 1 | 20 | Risk Ratio (M‐H, Fixed, 95% CI) | 0.0 [0.0, 0.0] |
| 10 Neonatal hypoglycaemia Show forest plot | 1 | 20 | Risk Ratio (M‐H, Fixed, 95% CI) | 0.0 [0.0, 0.0] |
| 11 Neonatal hyperbilirubinaemia Show forest plot | 1 | 20 | Risk Ratio (M‐H, Fixed, 95% CI) | 0.0 [0.0, 0.0] |
| 12 Neonatal hypocalcaemia Show forest plot | 1 | 20 | Risk Ratio (M‐H, Fixed, 95% CI) | 0.0 [0.0, 0.0] |
| 13 Gestational weight gain (kg) Show forest plot | 1 | 20 | Mean Difference (IV, Fixed, 95% CI) | ‐2.20 [‐7.24, 2.84] |
| 14 Adherence to dietary intervention: good adherence Show forest plot | 1 | 20 | Risk Ratio (M‐H, Fixed, 95% CI) | 3.5 [0.95, 12.90] |
| 15 Use of additional pharmacotherapy Show forest plot | 1 | 20 | Risk Ratio (M‐H, Fixed, 95% CI) | 2.0 [0.21, 18.69] |