Diferentes tipos de asesoramiento dietético para las mujeres con diabetes mellitus gestacional
Información
- DOI:
- https://doi.org/10.1002/14651858.CD009275.pub3Copiar DOI

- Base de datos:
-
- Cochrane Database of Systematic Reviews
- Versión publicada:
-
- 25 febrero 2017see what's new
- Tipo:
-
- Intervention
- Etapa:
-
- Review
- Grupo Editorial Cochrane:
-
Grupo Cochrane de Embarazo y parto
- Copyright:
-
- Copyright © 2017 The Cochrane Collaboration. Published by John Wiley & Sons, Ltd.
Cifras del artículo
Altmetric:
Citado por:
Autores
Contributions of authors
For this update of the review: Shanshan Han, Emer Van Ryswyk and Emily Shephered assessed studies for inclusion, extracted data and assessed the risk of bias of included studies. Shanshan Han and Emily Shepherd drafted the update, and all authors reviewed drafts and contributed to the final version.
For the previous version of the review: Shanshan Han wrote drafts of the protocol and review, with Caroline Crowther and Philippa Middleton contributing to data extraction, and commenting on and editing all drafts. Emer Van Ryswyk was involved in data extraction and assessment of risk of bias of the included studies.
Sources of support
Internal sources
-
ARCH, Robinson Research Institute, The University of Adelaide, Australia.
External sources
-
NHMRC: National Health and Medical Research Council, Australia.
-
National Institute for Health Research (NIHR), UK.
Cochrane Programme Grant Project: 13/89/05 – Pregnancy and childbirth systematic reviews to support clinical guidelines, UK
Declarations of interest
Shanshan Han: none known.
Philippa Middleton: none known.
Emily Shepherd: none known.
Emer Van Ryswyk: none known.
Caroline A Crowther: none known.
Acknowledgements
Thanks to Professor Thomas Wolever, Professor Robert Moses, Ms Anne Rae, Mr Jimmy Louie, Professor Jennie Brand‐Miller, and Associate Professor Finn Friis Lauszus for providing additional information regarding their trials. Thanks to Rosie Helmore for her help in translation of Balas‐Nakash 2010's manuscript from Spanish to English.
As part of the pre‐publication editorial process, this review has been commented on by three peers (an editor and two referees who are external to the editorial team) and the Group's Statistical Adviser.
This project was supported by the National Institute for Health Research, via Cochrane Programme Grant funding to Cochrane Pregnancy and Childbirth. The views and opinions expressed therein are those of the authors and do not necessarily reflect those of the Systematic Reviews Programme, NIHR, NHS or the Department of Health.
Version history
| Published | Title | Stage | Authors | Version |
| 2017 Feb 25 | Different types of dietary advice for women with gestational diabetes mellitus | Review | Shanshan Han, Philippa Middleton, Emily Shepherd, Emer Van Ryswyk, Caroline A Crowther | |
| 2013 Mar 28 | Different types of dietary advice for women with gestational diabetes mellitus | Review | Shanshan Han, Caroline A Crowther, Philippa Middleton, Emer Heatley | |
| 2011 Aug 10 | Different types of dietary advice for women with gestational diabetes mellitus | Protocol | Shanshan Han, Caroline A Crowther, Philippa Middleton | |
Differences between protocol and review
In this update of the review:
-
we have updated our primary and secondary review outcomes in line with those that are/will be used in other Cochrane Pregnancy and Childbirth GDM reviews;
-
we have updated the methods in line with those in the standard template used by the Cochrane Pregnancy and Childbirth Group;
-
we have used the GRADE approach to assess the quality of the body of evidence and we have included 'Summary of findings' tables.
Keywords
MeSH
Medical Subject Headings (MeSH) Keywords
- Caloric Restriction;
- Cesarean Section [statistics & numerical data];
- Diabetes, Gestational [*diet therapy];
- Diet, Carbohydrate-Restricted;
- Diet, Diabetic;
- Dietary Carbohydrates [administration & dosage];
- Dietary Fiber [administration & dosage];
- Glycemic Index;
- Hypertension [epidemiology];
- Pregnancy Complications, Cardiovascular [epidemiology];
- Randomized Controlled Trials as Topic;
Medical Subject Headings Check Words
Female; Humans; Pregnancy;
PICO

Study flow diagram.
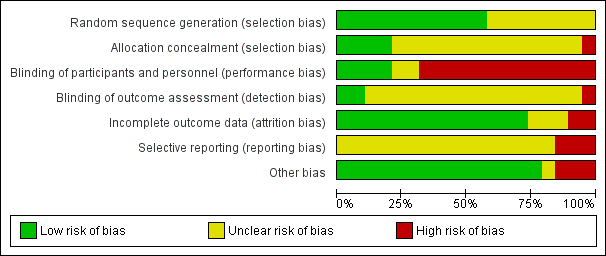
'Risk of bias' graph: review authors' judgements about each risk of bias item presented as percentages across all included studies.

'Risk of bias' summary: review authors' judgements about each risk of bias item for each included study.

Comparison 1 Low‐moderate GI diet versus moderate‐high GI diet, Outcome 1 Large‐for‐gestational age.
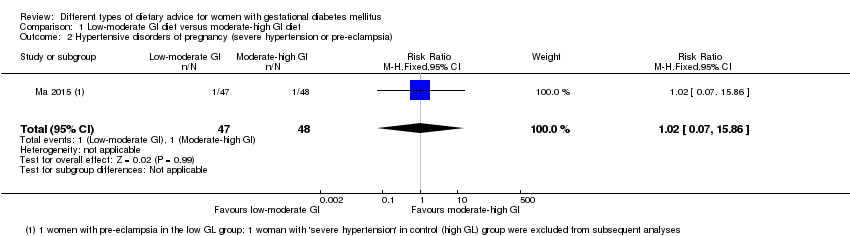
Comparison 1 Low‐moderate GI diet versus moderate‐high GI diet, Outcome 2 Hypertensive disorders of pregnancy (severe hypertension or pre‐eclampsia).
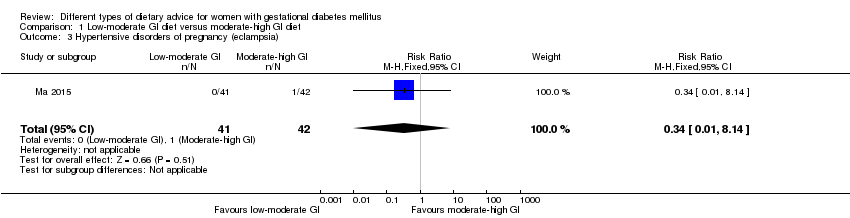
Comparison 1 Low‐moderate GI diet versus moderate‐high GI diet, Outcome 3 Hypertensive disorders of pregnancy (eclampsia).
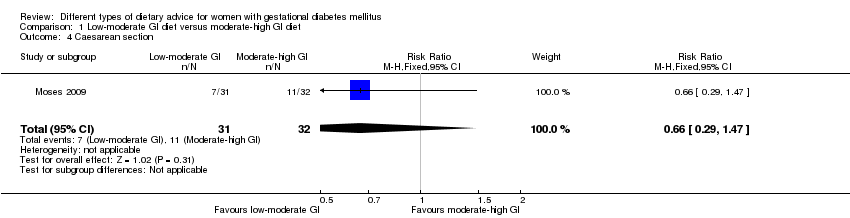
Comparison 1 Low‐moderate GI diet versus moderate‐high GI diet, Outcome 4 Caesarean section.

Comparison 1 Low‐moderate GI diet versus moderate‐high GI diet, Outcome 5 Gestational age at birth (weeks).

Comparison 1 Low‐moderate GI diet versus moderate‐high GI diet, Outcome 6 Preterm birth.
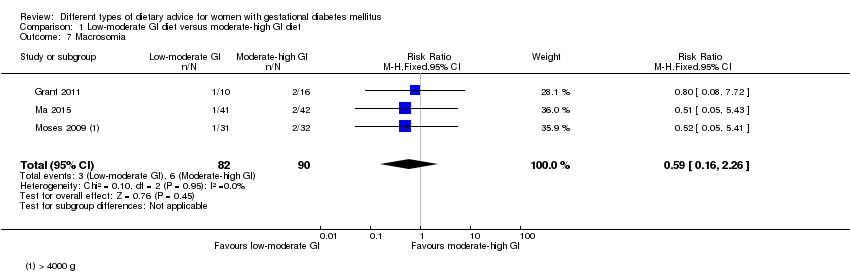
Comparison 1 Low‐moderate GI diet versus moderate‐high GI diet, Outcome 7 Macrosomia.
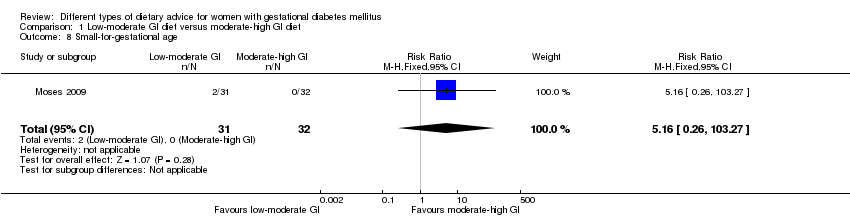
Comparison 1 Low‐moderate GI diet versus moderate‐high GI diet, Outcome 8 Small‐for‐gestational age.

Comparison 1 Low‐moderate GI diet versus moderate‐high GI diet, Outcome 9 Birthweight (g).

Comparison 1 Low‐moderate GI diet versus moderate‐high GI diet, Outcome 10 Head circumference at birth (cm).

Comparison 1 Low‐moderate GI diet versus moderate‐high GI diet, Outcome 11 Length at birth (cm).
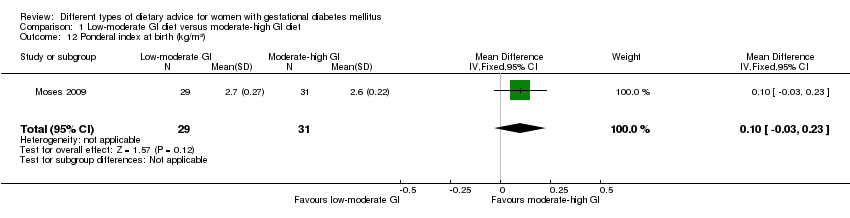
Comparison 1 Low‐moderate GI diet versus moderate‐high GI diet, Outcome 12 Ponderal index at birth (kg/m³).
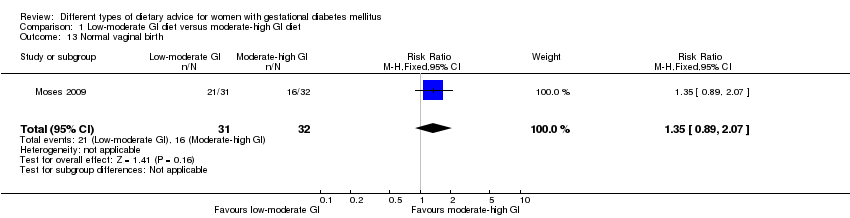
Comparison 1 Low‐moderate GI diet versus moderate‐high GI diet, Outcome 13 Normal vaginal birth.

Comparison 1 Low‐moderate GI diet versus moderate‐high GI diet, Outcome 14 Operative vaginal birth.

Comparison 1 Low‐moderate GI diet versus moderate‐high GI diet, Outcome 15 Induction of labour.

Comparison 1 Low‐moderate GI diet versus moderate‐high GI diet, Outcome 16 Postpartum haemorrhage.
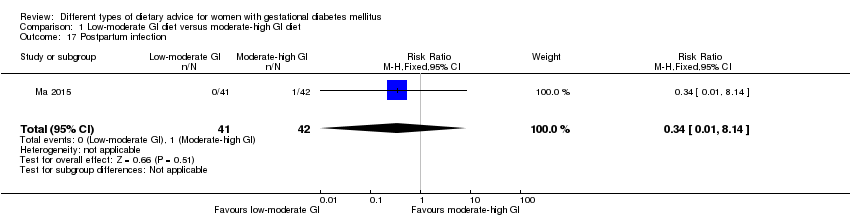
Comparison 1 Low‐moderate GI diet versus moderate‐high GI diet, Outcome 17 Postpartum infection.

Comparison 1 Low‐moderate GI diet versus moderate‐high GI diet, Outcome 18 Gestational weight gain (kg).
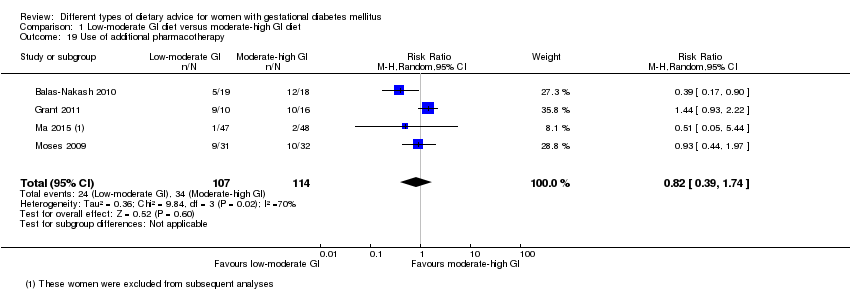
Comparison 1 Low‐moderate GI diet versus moderate‐high GI diet, Outcome 19 Use of additional pharmacotherapy.

Comparison 1 Low‐moderate GI diet versus moderate‐high GI diet, Outcome 20 Glycaemic control: end of intervention fasting plasma glucose (mmol/L).

Comparison 1 Low‐moderate GI diet versus moderate‐high GI diet, Outcome 21 Glycaemic control: end of intervention 2‐hour postprandial glucose (mmol/L).

Comparison 1 Low‐moderate GI diet versus moderate‐high GI diet, Outcome 22 Glycaemic control: end of intervention HbA1c (%).

Comparison 2 Energy‐restricted diet versus no energy‐restricted diet, Outcome 1 Large‐for‐gestational age.
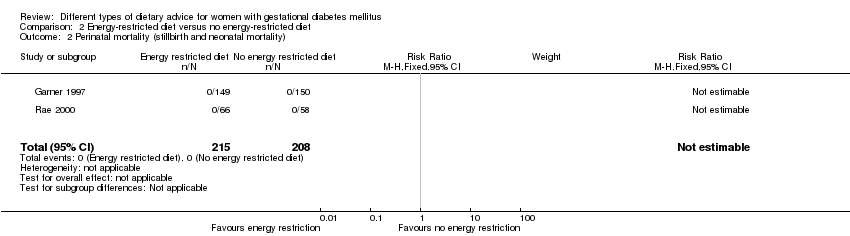
Comparison 2 Energy‐restricted diet versus no energy‐restricted diet, Outcome 2 Perinatal mortality (stillbirth and neonatal mortality).

Comparison 2 Energy‐restricted diet versus no energy‐restricted diet, Outcome 3 Hypertensive disorders of pregnancy: pre‐eclampsia.

Comparison 2 Energy‐restricted diet versus no energy‐restricted diet, Outcome 4 Caesarean section.

Comparison 2 Energy‐restricted diet versus no energy‐restricted diet, Outcome 5 Stillbirth.
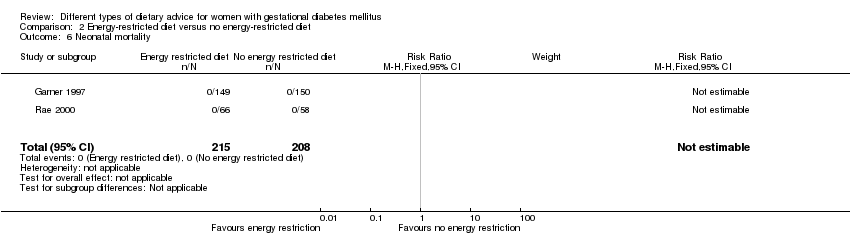
Comparison 2 Energy‐restricted diet versus no energy‐restricted diet, Outcome 6 Neonatal mortality.
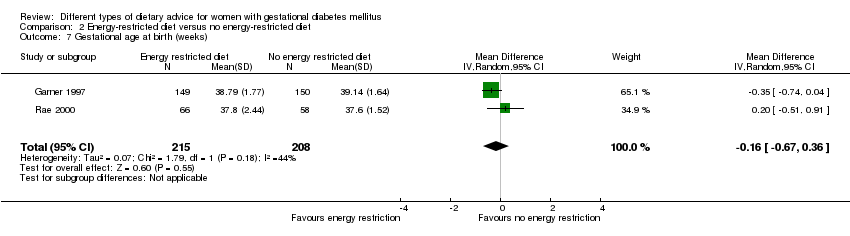
Comparison 2 Energy‐restricted diet versus no energy‐restricted diet, Outcome 7 Gestational age at birth (weeks).

Comparison 2 Energy‐restricted diet versus no energy‐restricted diet, Outcome 8 Macrosomia (> 4000 g).

Comparison 2 Energy‐restricted diet versus no energy‐restricted diet, Outcome 9 Macrosomia (> 4500 g).
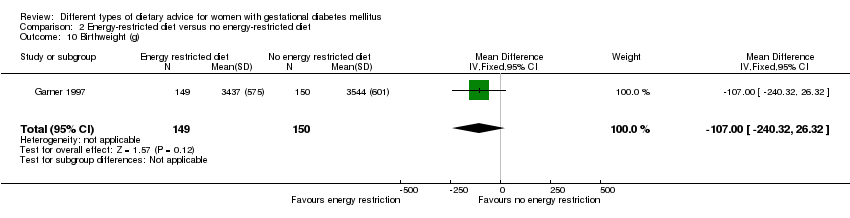
Comparison 2 Energy‐restricted diet versus no energy‐restricted diet, Outcome 10 Birthweight (g).

Comparison 2 Energy‐restricted diet versus no energy‐restricted diet, Outcome 11 Shoulder dystocia.
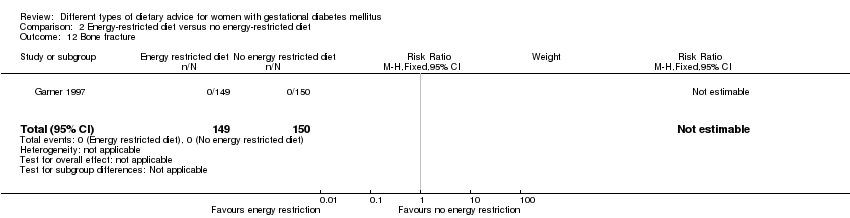
Comparison 2 Energy‐restricted diet versus no energy‐restricted diet, Outcome 12 Bone fracture.

Comparison 2 Energy‐restricted diet versus no energy‐restricted diet, Outcome 13 Nerve palsy.

Comparison 2 Energy‐restricted diet versus no energy‐restricted diet, Outcome 14 Neonatal hypoglycaemia.
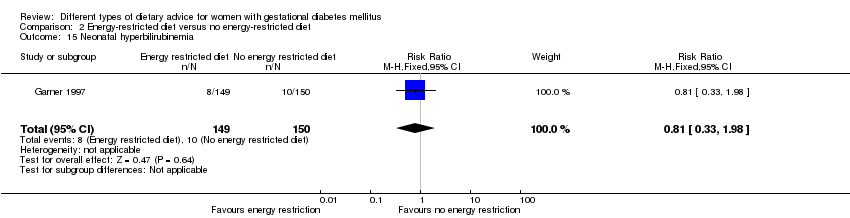
Comparison 2 Energy‐restricted diet versus no energy‐restricted diet, Outcome 15 Neonatal hyperbilirubinemia.

Comparison 2 Energy‐restricted diet versus no energy‐restricted diet, Outcome 16 Neonatal hypocalcaemia.

Comparison 2 Energy‐restricted diet versus no energy‐restricted diet, Outcome 17 Normal vaginal birth.
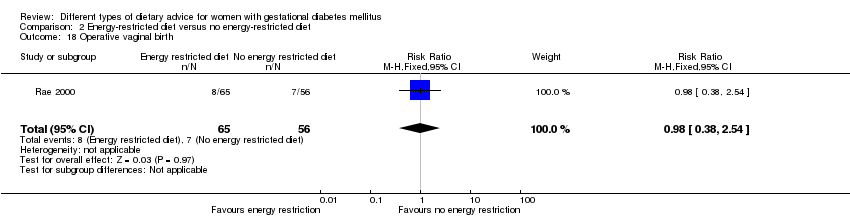
Comparison 2 Energy‐restricted diet versus no energy‐restricted diet, Outcome 18 Operative vaginal birth.

Comparison 2 Energy‐restricted diet versus no energy‐restricted diet, Outcome 19 Induction of labour.

Comparison 2 Energy‐restricted diet versus no energy‐restricted diet, Outcome 20 Gestational weight gain (kg).

Comparison 2 Energy‐restricted diet versus no energy‐restricted diet, Outcome 21 Gestational weight gain: weight at birth (kg).
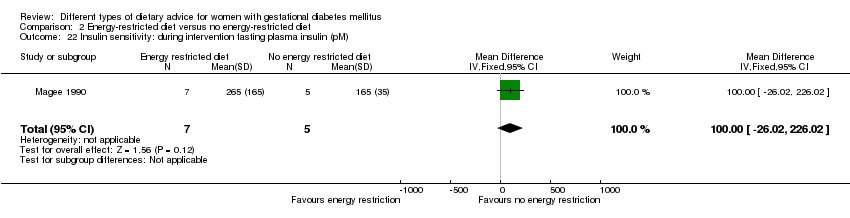
Comparison 2 Energy‐restricted diet versus no energy‐restricted diet, Outcome 22 Insulin sensitivity: during intervention fasting plasma insulin (pM).
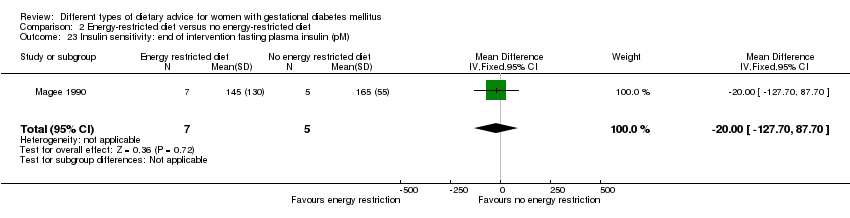
Comparison 2 Energy‐restricted diet versus no energy‐restricted diet, Outcome 23 Insulin sensitivity: end of intervention fasting plasma insulin (pM).
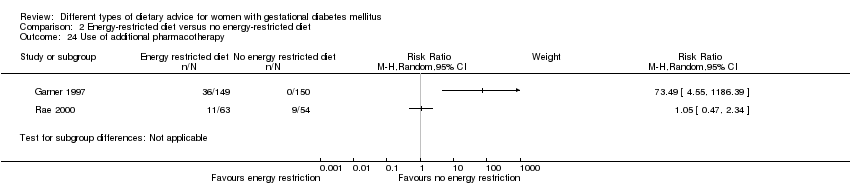
Comparison 2 Energy‐restricted diet versus no energy‐restricted diet, Outcome 24 Use of additional pharmacotherapy.
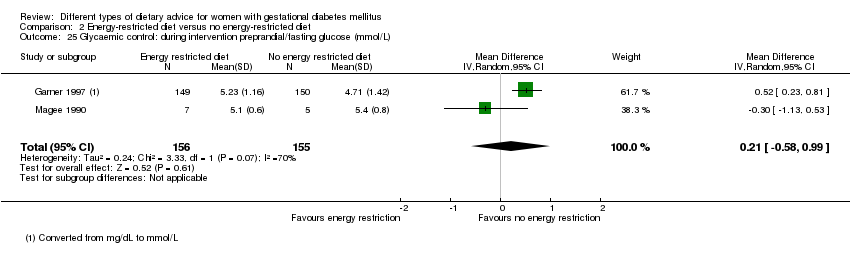
Comparison 2 Energy‐restricted diet versus no energy‐restricted diet, Outcome 25 Glycaemic control: during intervention preprandial/fasting glucose (mmol/L).
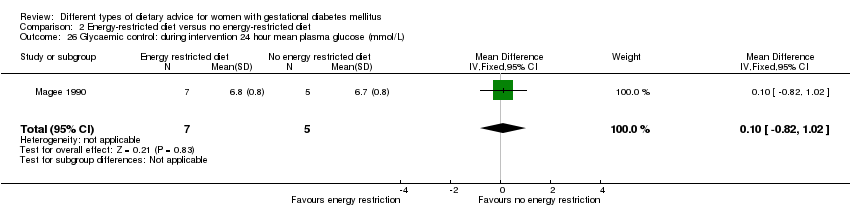
Comparison 2 Energy‐restricted diet versus no energy‐restricted diet, Outcome 26 Glycaemic control: during intervention 24 hour mean plasma glucose (mmol/L).

Comparison 2 Energy‐restricted diet versus no energy‐restricted diet, Outcome 27 Glycaemic control: during intervention 1 hour postprandial glucose (mmol/L).
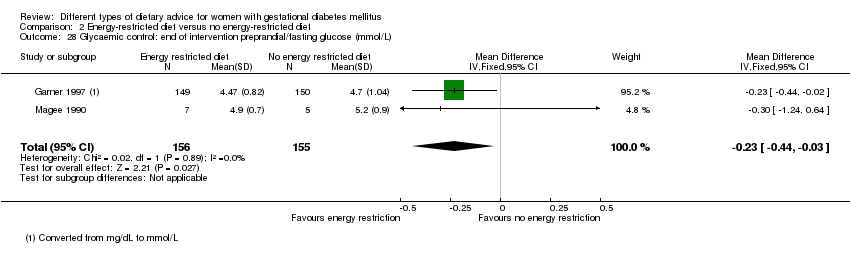
Comparison 2 Energy‐restricted diet versus no energy‐restricted diet, Outcome 28 Glycaemic control: end of intervention preprandial/fasting glucose (mmol/L).
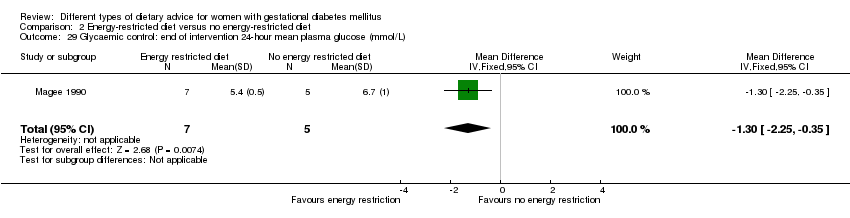
Comparison 2 Energy‐restricted diet versus no energy‐restricted diet, Outcome 29 Glycaemic control: end of intervention 24‐hour mean plasma glucose (mmol/L).
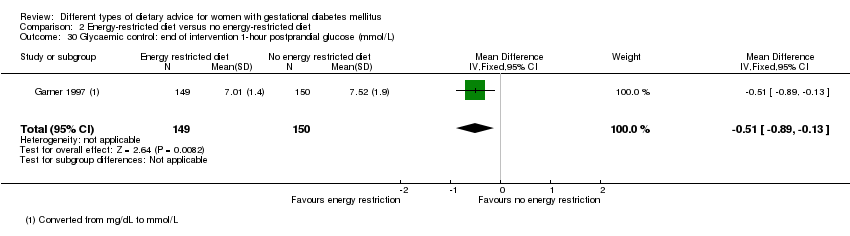
Comparison 2 Energy‐restricted diet versus no energy‐restricted diet, Outcome 30 Glycaemic control: end of intervention 1‐hour postprandial glucose (mmol/L).

Comparison 2 Energy‐restricted diet versus no energy‐restricted diet, Outcome 31 Glycaemic control: during/at end of intervention fasting glucose (mmol/L).
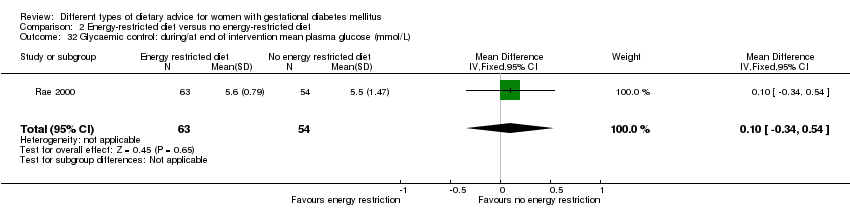
Comparison 2 Energy‐restricted diet versus no energy‐restricted diet, Outcome 32 Glycaemic control: during/at end of intervention mean plasma glucose (mmol/L).

Comparison 2 Energy‐restricted diet versus no energy‐restricted diet, Outcome 33 Glycaemic control: during/at end of intervention mean HbA1c (%).

Comparison 3 DASH diet versus control diet with matching macronutrient contents, Outcome 1 Hypertensive disorders of pregnancy: pre‐eclampsia.
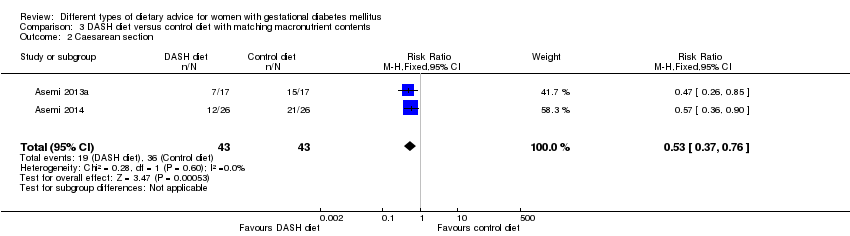
Comparison 3 DASH diet versus control diet with matching macronutrient contents, Outcome 2 Caesarean section.

Comparison 3 DASH diet versus control diet with matching macronutrient contents, Outcome 3 Gestational age at birth (weeks).
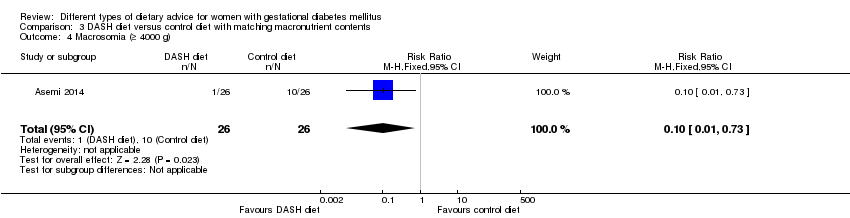
Comparison 3 DASH diet versus control diet with matching macronutrient contents, Outcome 4 Macrosomia (≥ 4000 g).
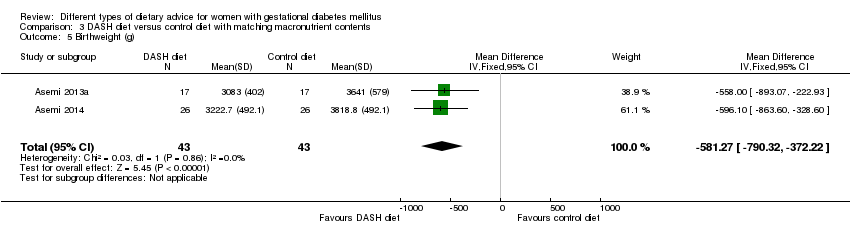
Comparison 3 DASH diet versus control diet with matching macronutrient contents, Outcome 5 Birthweight (g).

Comparison 3 DASH diet versus control diet with matching macronutrient contents, Outcome 6 Head circumference at birth (cm).
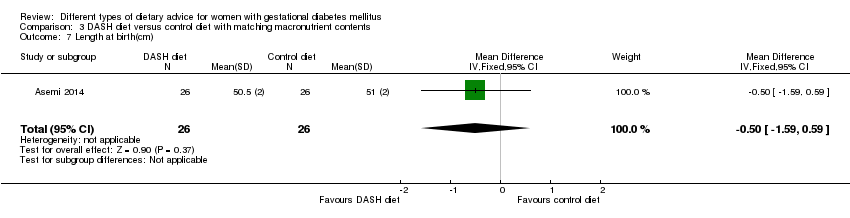
Comparison 3 DASH diet versus control diet with matching macronutrient contents, Outcome 7 Length at birth(cm).

Comparison 3 DASH diet versus control diet with matching macronutrient contents, Outcome 8 Ponderal index at birth (kg/m³).
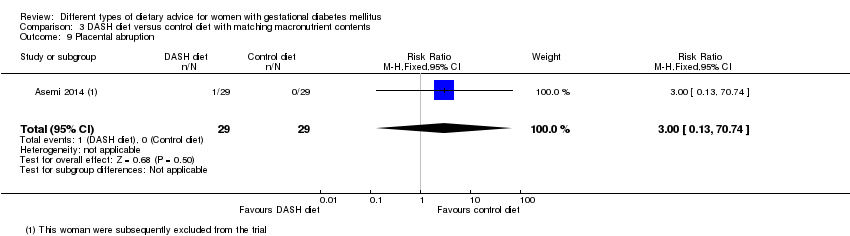
Comparison 3 DASH diet versus control diet with matching macronutrient contents, Outcome 9 Placental abruption.

Comparison 3 DASH diet versus control diet with matching macronutrient contents, Outcome 10 Gestational weight gain: BMI at end of intervention (kg/m²).
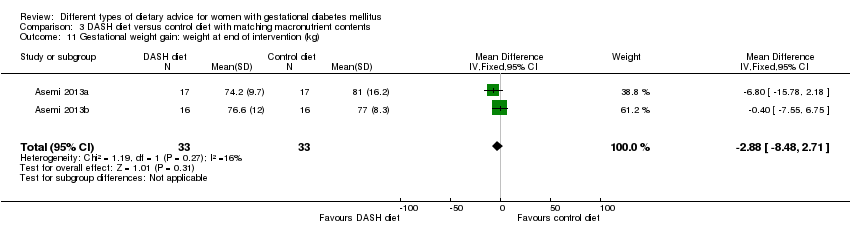
Comparison 3 DASH diet versus control diet with matching macronutrient contents, Outcome 11 Gestational weight gain: weight at end of intervention (kg).

Comparison 3 DASH diet versus control diet with matching macronutrient contents, Outcome 12 Insulin sensitivity: end of intervention HOMA‐IR.
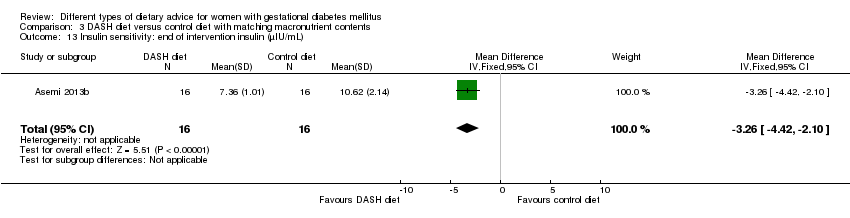
Comparison 3 DASH diet versus control diet with matching macronutrient contents, Outcome 13 Insulin sensitivity: end of intervention insulin (µIU/mL).
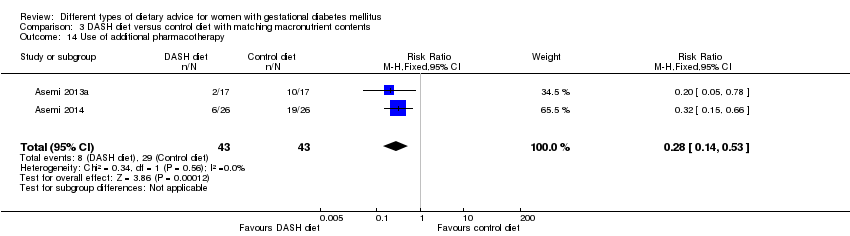
Comparison 3 DASH diet versus control diet with matching macronutrient contents, Outcome 14 Use of additional pharmacotherapy.

Comparison 3 DASH diet versus control diet with matching macronutrient contents, Outcome 15 Glycaemic control: end of intervention fasting blood glucose (mmol/L).

Comparison 3 DASH diet versus control diet with matching macronutrient contents, Outcome 16 Glycaemic control: at end of intervention HbA1c (%).

Comparison 4 Low‐carbohydrate diet versus high‐carbohydrate diet, Outcome 1 Large‐for‐gestational age.

Comparison 4 Low‐carbohydrate diet versus high‐carbohydrate diet, Outcome 2 Perinatal mortality (stillbirth and neonatal mortality).
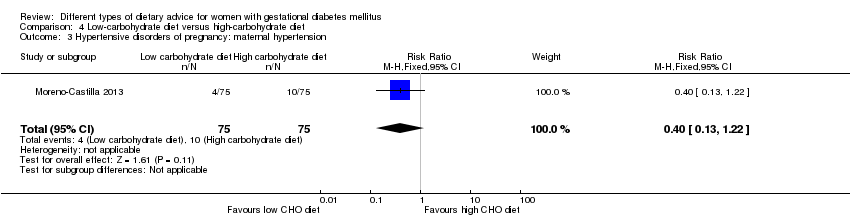
Comparison 4 Low‐carbohydrate diet versus high‐carbohydrate diet, Outcome 3 Hypertensive disorders of pregnancy: maternal hypertension.
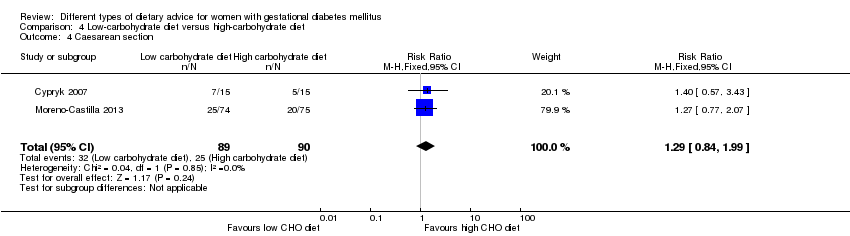
Comparison 4 Low‐carbohydrate diet versus high‐carbohydrate diet, Outcome 4 Caesarean section.

Comparison 4 Low‐carbohydrate diet versus high‐carbohydrate diet, Outcome 5 Stillbirth.
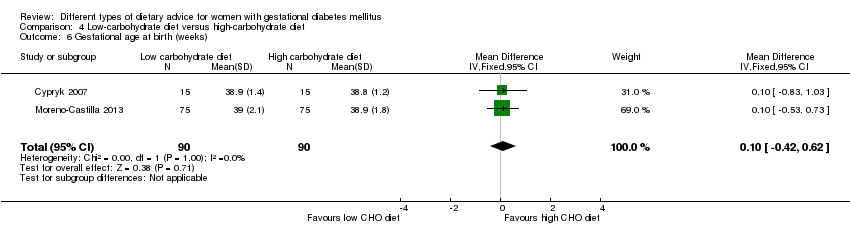
Comparison 4 Low‐carbohydrate diet versus high‐carbohydrate diet, Outcome 6 Gestational age at birth (weeks).

Comparison 4 Low‐carbohydrate diet versus high‐carbohydrate diet, Outcome 7 Macrosomia (> 4000 g).

Comparison 4 Low‐carbohydrate diet versus high‐carbohydrate diet, Outcome 8 Small‐for‐gestational age.
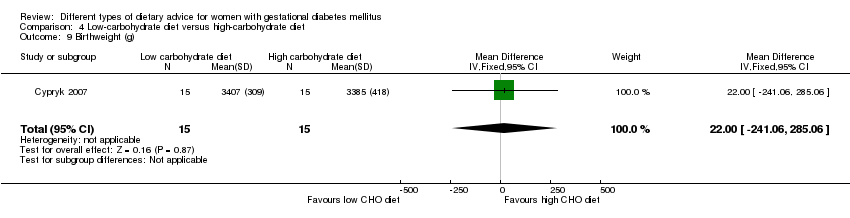
Comparison 4 Low‐carbohydrate diet versus high‐carbohydrate diet, Outcome 9 Birthweight (g).

Comparison 4 Low‐carbohydrate diet versus high‐carbohydrate diet, Outcome 10 Neonatal hypoglycaemia.
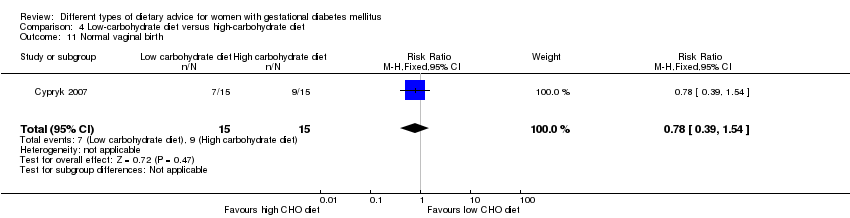
Comparison 4 Low‐carbohydrate diet versus high‐carbohydrate diet, Outcome 11 Normal vaginal birth.

Comparison 4 Low‐carbohydrate diet versus high‐carbohydrate diet, Outcome 12 Operative vaginal birth.
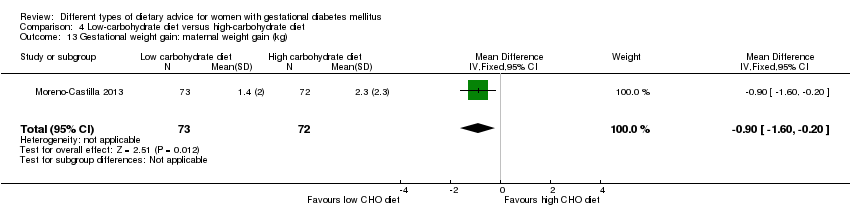
Comparison 4 Low‐carbohydrate diet versus high‐carbohydrate diet, Outcome 13 Gestational weight gain: maternal weight gain (kg).

Comparison 4 Low‐carbohydrate diet versus high‐carbohydrate diet, Outcome 14 Adherence to dietary intervention: fully applied the recommended menu.
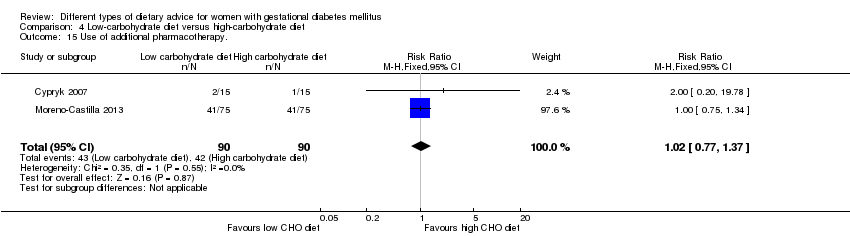
Comparison 4 Low‐carbohydrate diet versus high‐carbohydrate diet, Outcome 15 Use of additional pharmacotherapy..

Comparison 4 Low‐carbohydrate diet versus high‐carbohydrate diet, Outcome 16 Glycaemic control: end of intervention fasting blood glucose (mg/dL).
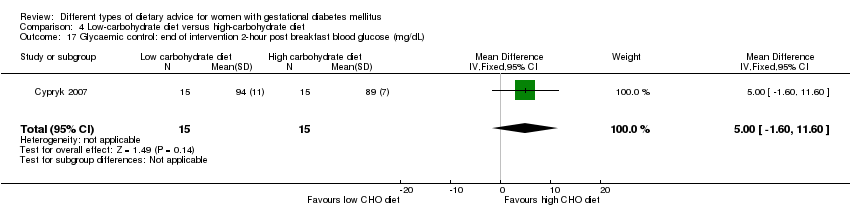
Comparison 4 Low‐carbohydrate diet versus high‐carbohydrate diet, Outcome 17 Glycaemic control: end of intervention 2‐hour post breakfast blood glucose (mg/dL).

Comparison 4 Low‐carbohydrate diet versus high‐carbohydrate diet, Outcome 18 Glycaemic control: end of intervention 2‐hour post lunch blood glucose (mg/dL).
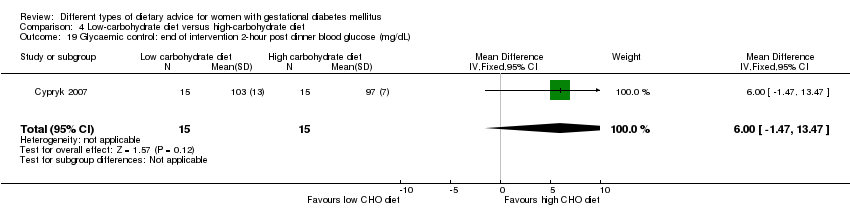
Comparison 4 Low‐carbohydrate diet versus high‐carbohydrate diet, Outcome 19 Glycaemic control: end of intervention 2‐hour post dinner blood glucose (mg/dL).

Comparison 5 High unsaturated fat diet versus low unsaturated fat diet with matching calories, Outcome 1 Large‐for‐gestational age.
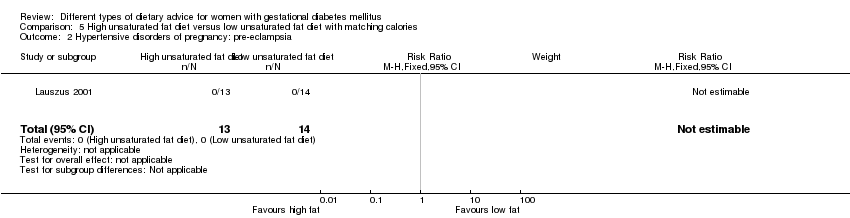
Comparison 5 High unsaturated fat diet versus low unsaturated fat diet with matching calories, Outcome 2 Hypertensive disorders of pregnancy: pre‐eclampsia.

Comparison 5 High unsaturated fat diet versus low unsaturated fat diet with matching calories, Outcome 3 Hypertensive disorders of pregnancy: hypertension in pregnancy.

Comparison 5 High unsaturated fat diet versus low unsaturated fat diet with matching calories, Outcome 4 Caesarean section.
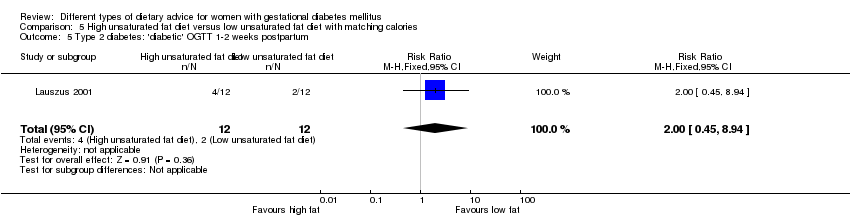
Comparison 5 High unsaturated fat diet versus low unsaturated fat diet with matching calories, Outcome 5 Type 2 diabetes: 'diabetic' OGTT 1‐2 weeks postpartum.
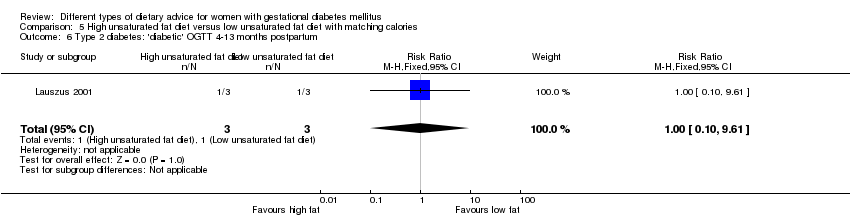
Comparison 5 High unsaturated fat diet versus low unsaturated fat diet with matching calories, Outcome 6 Type 2 diabetes: 'diabetic' OGTT 4‐13 months postpartum.

Comparison 5 High unsaturated fat diet versus low unsaturated fat diet with matching calories, Outcome 7 Gestational age at birth (weeks).

Comparison 5 High unsaturated fat diet versus low unsaturated fat diet with matching calories, Outcome 8 Preterm birth.

Comparison 5 High unsaturated fat diet versus low unsaturated fat diet with matching calories, Outcome 9 Macrosomia (> 4000 g).

Comparison 5 High unsaturated fat diet versus low unsaturated fat diet with matching calories, Outcome 10 Birthweight (g).
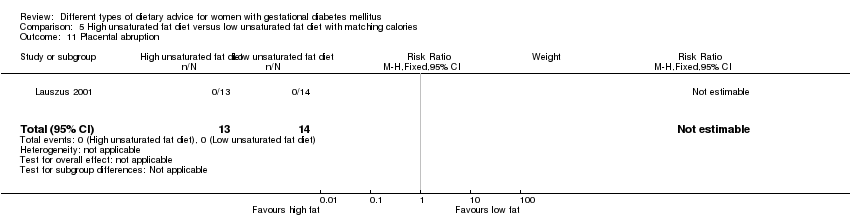
Comparison 5 High unsaturated fat diet versus low unsaturated fat diet with matching calories, Outcome 11 Placental abruption.

Comparison 5 High unsaturated fat diet versus low unsaturated fat diet with matching calories, Outcome 12 Gestational weight gain (kg).
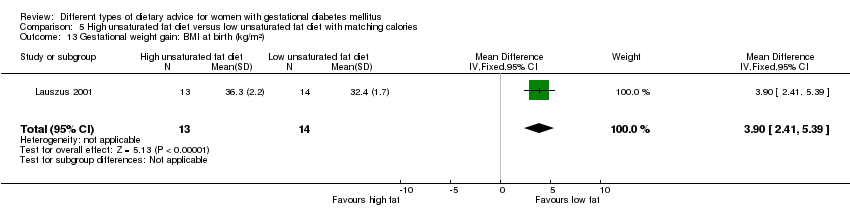
Comparison 5 High unsaturated fat diet versus low unsaturated fat diet with matching calories, Outcome 13 Gestational weight gain: BMI at birth (kg/m²).

Comparison 5 High unsaturated fat diet versus low unsaturated fat diet with matching calories, Outcome 14 Gestational weight gain: weight at birth (kg).
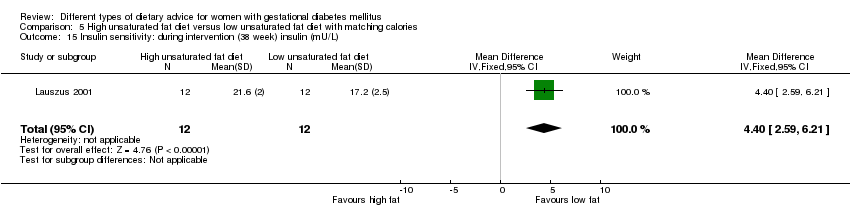
Comparison 5 High unsaturated fat diet versus low unsaturated fat diet with matching calories, Outcome 15 Insulin sensitivity: during intervention (38 week) insulin (mU/L).

Comparison 5 High unsaturated fat diet versus low unsaturated fat diet with matching calories, Outcome 16 Insulin sensitivity: during intervention (38 week) insulin sensitivity (10‐5 min‐1 per mU/L min).

Comparison 5 High unsaturated fat diet versus low unsaturated fat diet with matching calories, Outcome 17 Insulin sensitivity: end of intervention IAI.

Comparison 5 High unsaturated fat diet versus low unsaturated fat diet with matching calories, Outcome 18 Use of additional pharmacotherapy.
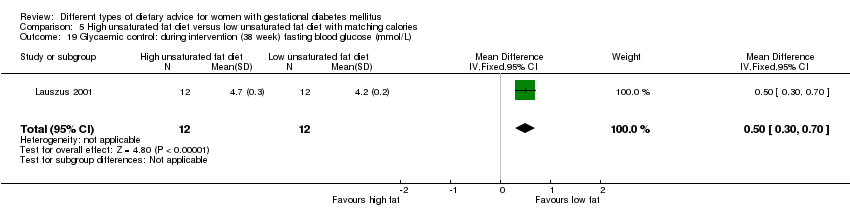
Comparison 5 High unsaturated fat diet versus low unsaturated fat diet with matching calories, Outcome 19 Glycaemic control: during intervention (38 week) fasting blood glucose (mmol/L).

Comparison 5 High unsaturated fat diet versus low unsaturated fat diet with matching calories, Outcome 20 Glycaemic control: during intervention (38 week) postprandial glucose (mmol/L).

Comparison 5 High unsaturated fat diet versus low unsaturated fat diet with matching calories, Outcome 21 Glycaemic control: during intervention (38 week) HbA1c (%).
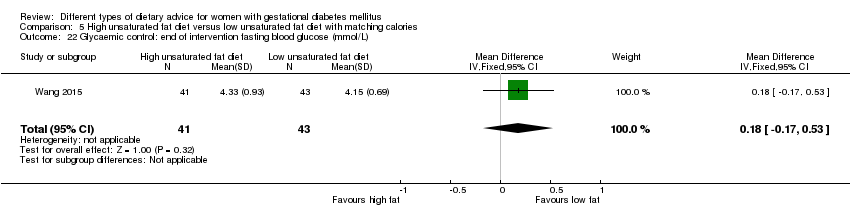
Comparison 5 High unsaturated fat diet versus low unsaturated fat diet with matching calories, Outcome 22 Glycaemic control: end of intervention fasting blood glucose (mmol/L).
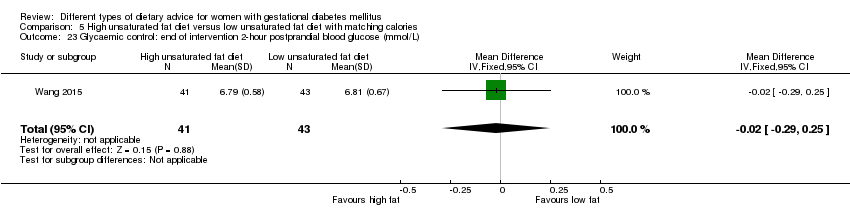
Comparison 5 High unsaturated fat diet versus low unsaturated fat diet with matching calories, Outcome 23 Glycaemic control: end of intervention 2‐hour postprandial blood glucose (mmol/L).

Comparison 5 High unsaturated fat diet versus low unsaturated fat diet with matching calories, Outcome 24 BMI 5‐9 months postpartum (kg/m²).

Comparison 5 High unsaturated fat diet versus low unsaturated fat diet with matching calories, Outcome 25 Impaired glucose tolerance: 'borderline' OGTT 1‐2 weeks postpartum.

Comparison 5 High unsaturated fat diet versus low unsaturated fat diet with matching calories, Outcome 26 Impaired glucose tolerance: 'borderline' OGTT 4‐13 months postpartum.

Comparison 6 Low‐GI diet versus high‐fibre moderate‐GI diet, Outcome 1 Large‐for‐gestational age.
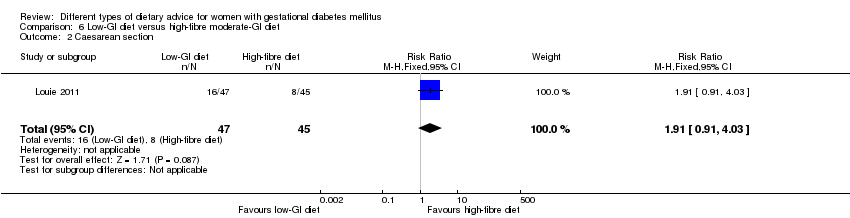
Comparison 6 Low‐GI diet versus high‐fibre moderate‐GI diet, Outcome 2 Caesarean section.

Comparison 6 Low‐GI diet versus high‐fibre moderate‐GI diet, Outcome 3 Type 2 diabetes mellitus at 3 months postpartum.

Comparison 6 Low‐GI diet versus high‐fibre moderate‐GI diet, Outcome 4 Gestational age at birth (weeks).
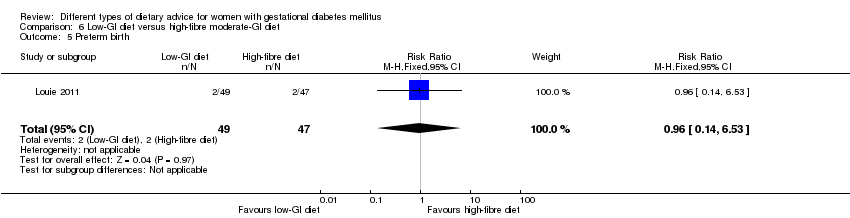
Comparison 6 Low‐GI diet versus high‐fibre moderate‐GI diet, Outcome 5 Preterm birth.
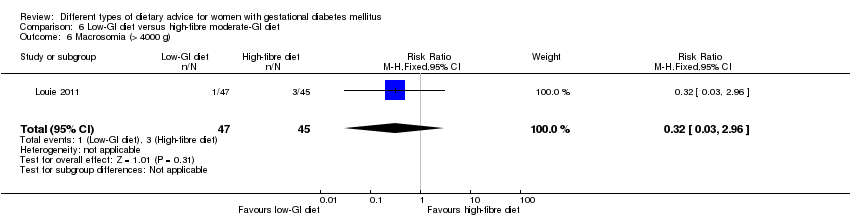
Comparison 6 Low‐GI diet versus high‐fibre moderate‐GI diet, Outcome 6 Macrosomia (> 4000 g).

Comparison 6 Low‐GI diet versus high‐fibre moderate‐GI diet, Outcome 7 Small‐for‐gestational age.

Comparison 6 Low‐GI diet versus high‐fibre moderate‐GI diet, Outcome 8 Birthweight (g).
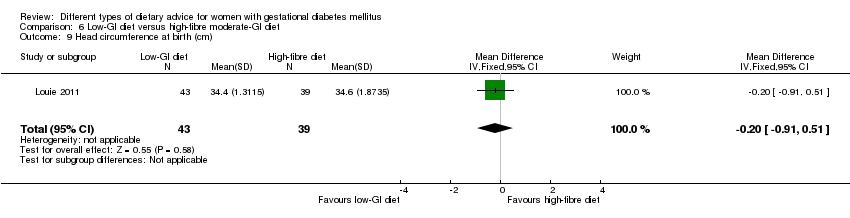
Comparison 6 Low‐GI diet versus high‐fibre moderate‐GI diet, Outcome 9 Head circumference at birth (cm).
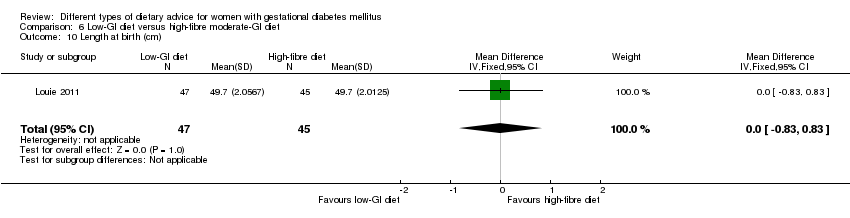
Comparison 6 Low‐GI diet versus high‐fibre moderate‐GI diet, Outcome 10 Length at birth (cm).
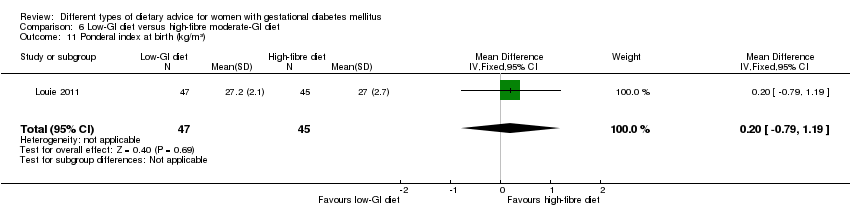
Comparison 6 Low‐GI diet versus high‐fibre moderate‐GI diet, Outcome 11 Ponderal index at birth (kg/m³).
| Study | Low‐GI diet (N =31) | High‐fibre moderate‐GI diet (N =21) | P value |
| Weight for age percentile (adjusted for breastfeeding status) | |||
| Louie 2011 | Mean (95% CI): 69.6 (60.5–78.8) | Mean (95% CI): 68.0 (56.9–79.1) | 0.720 |
| Length for age percentile (adjusted for breastfeeding status) | |||
| Louie 2011 | Mean (95% CI): 47.9 (38.6–57.2) | Mean (95% CI): 48.1 (36.9–59.3) | 0.977 |
| Weight for length percentile (adjusted for breastfeeding status) | |||
| Louie 2011 | Mean (95% CI): 72.4 (61.2–83.6) | Mean (95% CI): 64.6 (51.0–78.1) | 0.511 |
Comparison 6 Low‐GI diet versus high‐fibre moderate‐GI diet, Outcome 12 Weight and height at 3 months postpartum.

Comparison 6 Low‐GI diet versus high‐fibre moderate‐GI diet, Outcome 13 Weight gain during pregnancy (kg).
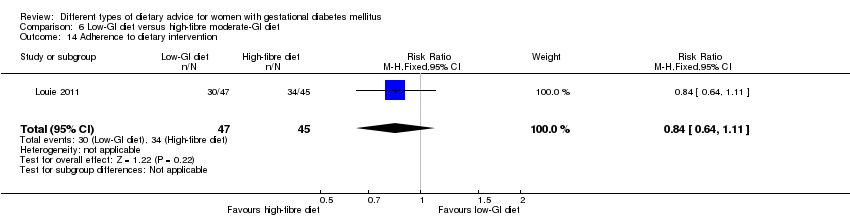
Comparison 6 Low‐GI diet versus high‐fibre moderate‐GI diet, Outcome 14 Adherence to dietary intervention.

Comparison 6 Low‐GI diet versus high‐fibre moderate‐GI diet, Outcome 15 Insulin sensitivity: end of intervention: HOMA2‐IR (%).
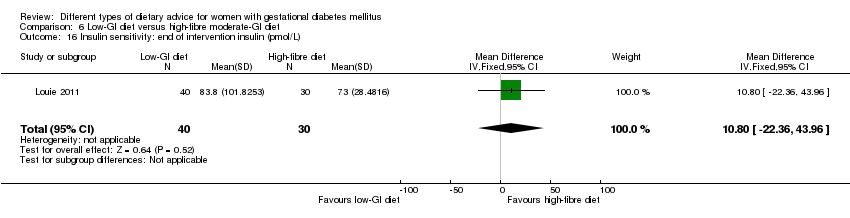
Comparison 6 Low‐GI diet versus high‐fibre moderate‐GI diet, Outcome 16 Insulin sensitivity: end of intervention insulin (pmol/L).
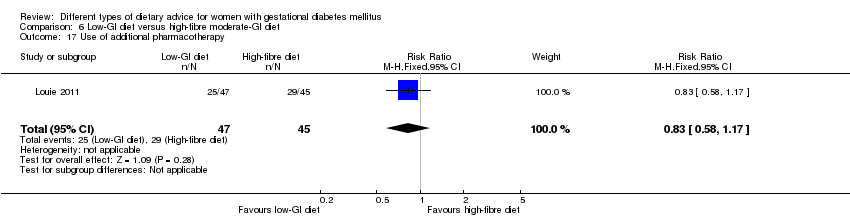
Comparison 6 Low‐GI diet versus high‐fibre moderate‐GI diet, Outcome 17 Use of additional pharmacotherapy.
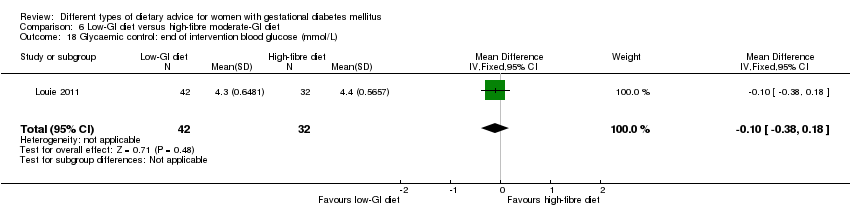
Comparison 6 Low‐GI diet versus high‐fibre moderate‐GI diet, Outcome 18 Glycaemic control: end of intervention blood glucose (mmol/L).
| Study | Low‐GI diet (N =43) | High‐fibre moderate‐GI diet (N =41) | P value |
| Louie 2011 | Mean (SEM): 5.5 (0.1) | Mean (SEM): 5.5 (0.0) | 0.665 |
Comparison 6 Low‐GI diet versus high‐fibre moderate‐GI diet, Outcome 19 Glycaemic control: end of intervention HbA1c (%).

Comparison 6 Low‐GI diet versus high‐fibre moderate‐GI diet, Outcome 20 Return to pre‐pregnancy weight at 3 months postpartum.
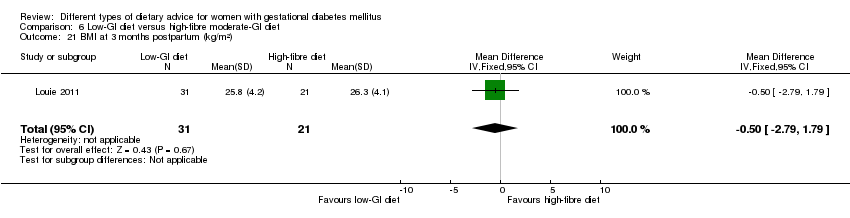
Comparison 6 Low‐GI diet versus high‐fibre moderate‐GI diet, Outcome 21 BMI at 3 months postpartum (kg/m²).
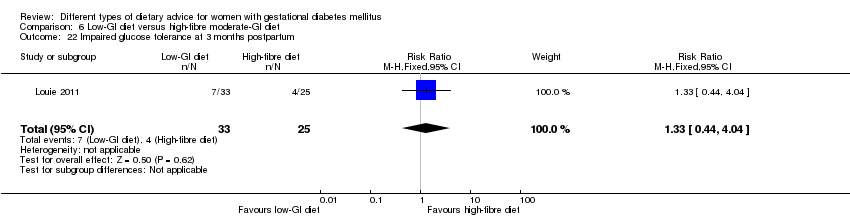
Comparison 6 Low‐GI diet versus high‐fibre moderate‐GI diet, Outcome 22 Impaired glucose tolerance at 3 months postpartum.
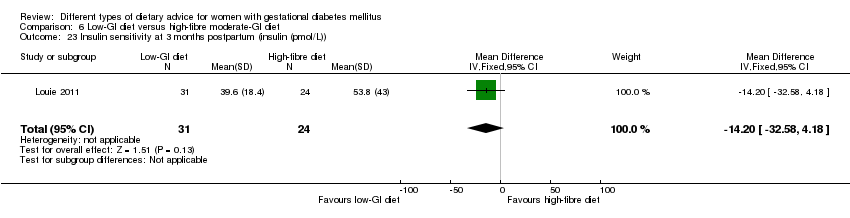
Comparison 6 Low‐GI diet versus high‐fibre moderate‐GI diet, Outcome 23 Insulin sensitivity at 3 months postpartum (insulin (pmol/L)).
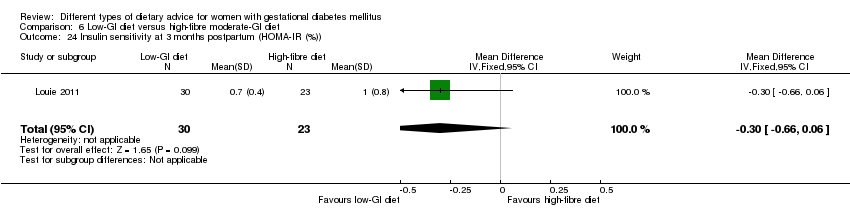
Comparison 6 Low‐GI diet versus high‐fibre moderate‐GI diet, Outcome 24 Insulin sensitivity at 3 months postpartum (HOMA‐IR (%)).

Comparison 7 Diet recommendation + diet‐related behavioural advice versus diet recommendation only, Outcome 1 Large‐for‐gestational age.
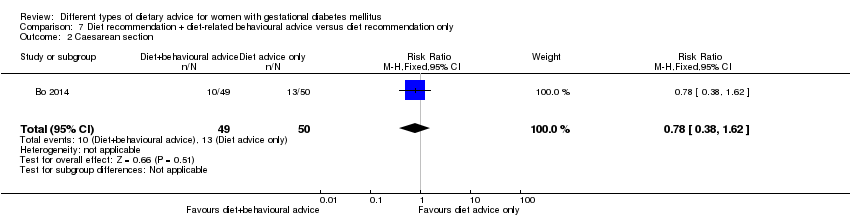
Comparison 7 Diet recommendation + diet‐related behavioural advice versus diet recommendation only, Outcome 2 Caesarean section.
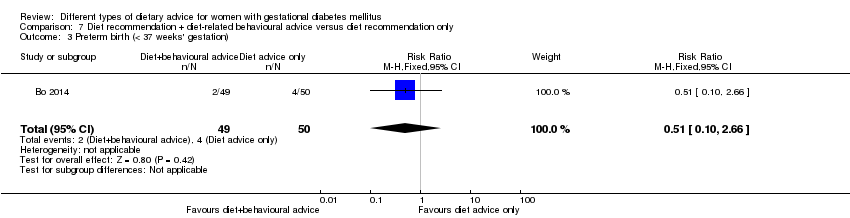
Comparison 7 Diet recommendation + diet‐related behavioural advice versus diet recommendation only, Outcome 3 Preterm birth (< 37 weeks' gestation).

Comparison 7 Diet recommendation + diet‐related behavioural advice versus diet recommendation only, Outcome 4 Gestational weight gain: BMI at end of intervention (kg/m²).
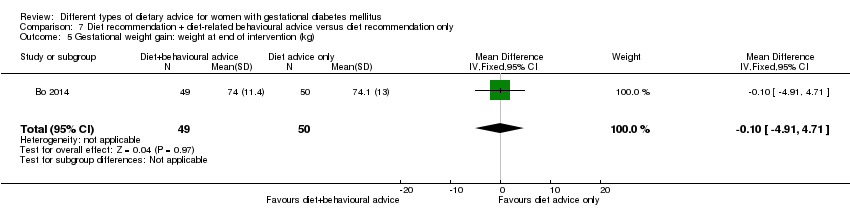
Comparison 7 Diet recommendation + diet‐related behavioural advice versus diet recommendation only, Outcome 5 Gestational weight gain: weight at end of intervention (kg).
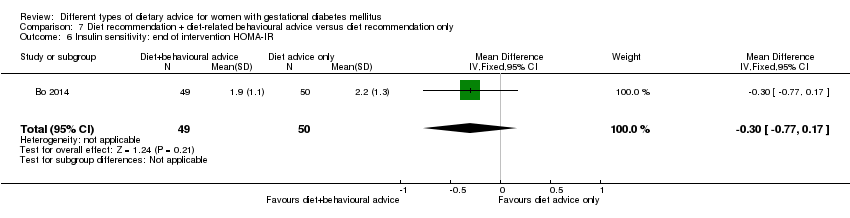
Comparison 7 Diet recommendation + diet‐related behavioural advice versus diet recommendation only, Outcome 6 Insulin sensitivity: end of intervention HOMA‐IR.

Comparison 7 Diet recommendation + diet‐related behavioural advice versus diet recommendation only, Outcome 7 Insulin sensitivity: end of intervention fasting insulin (µU/mL).

Comparison 7 Diet recommendation + diet‐related behavioural advice versus diet recommendation only, Outcome 8 Use of additional pharmacotherapy.

Comparison 7 Diet recommendation + diet‐related behavioural advice versus diet recommendation only, Outcome 9 Glycaemic control: end of intervention fasting glucose (mg/dL).
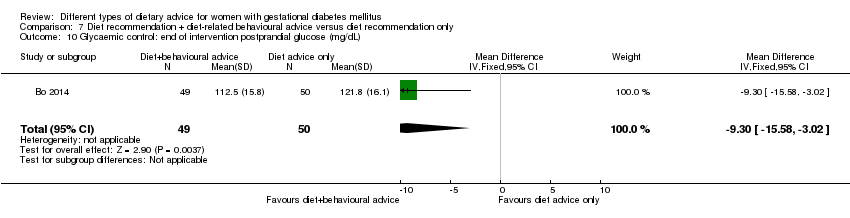
Comparison 7 Diet recommendation + diet‐related behavioural advice versus diet recommendation only, Outcome 10 Glycaemic control: end of intervention postprandial glucose (mg/dL).

Comparison 7 Diet recommendation + diet‐related behavioural advice versus diet recommendation only, Outcome 11 Glycaemic control: end of intervention HbA1c (%).

Comparison 7 Diet recommendation + diet‐related behavioural advice versus diet recommendation only, Outcome 12 Length of postnatal stay (baby): stay > 4 days.
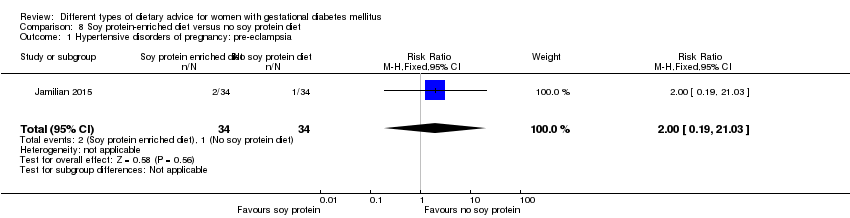
Comparison 8 Soy protein‐enriched diet versus no soy protein diet, Outcome 1 Hypertensive disorders of pregnancy: pre‐eclampsia.
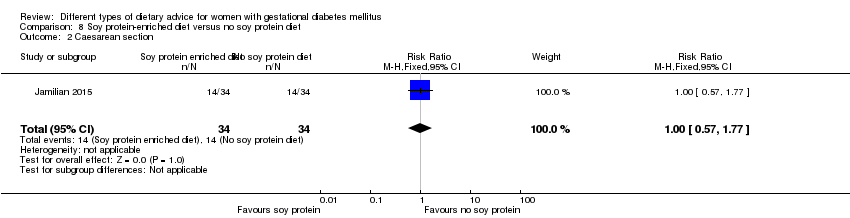
Comparison 8 Soy protein‐enriched diet versus no soy protein diet, Outcome 2 Caesarean section.

Comparison 8 Soy protein‐enriched diet versus no soy protein diet, Outcome 3 Gestational age at birth (weeks).
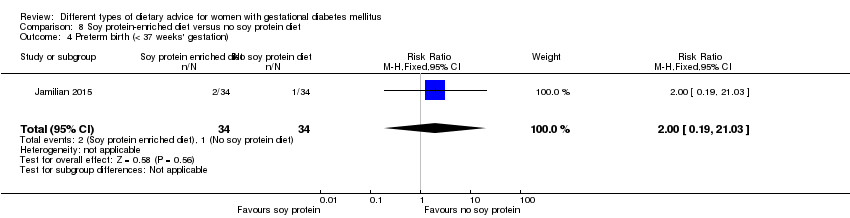
Comparison 8 Soy protein‐enriched diet versus no soy protein diet, Outcome 4 Preterm birth (< 37 weeks' gestation).
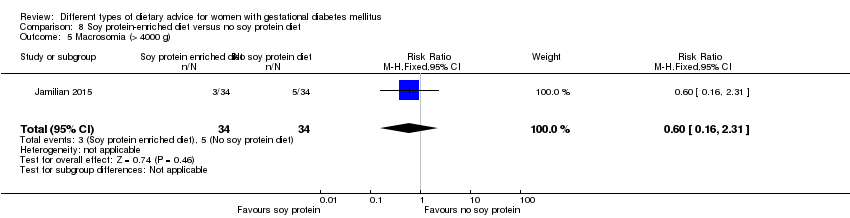
Comparison 8 Soy protein‐enriched diet versus no soy protein diet, Outcome 5 Macrosomia (> 4000 g).

Comparison 8 Soy protein‐enriched diet versus no soy protein diet, Outcome 6 Birthweight (g).

Comparison 8 Soy protein‐enriched diet versus no soy protein diet, Outcome 7 Head circumference at birth (cm).
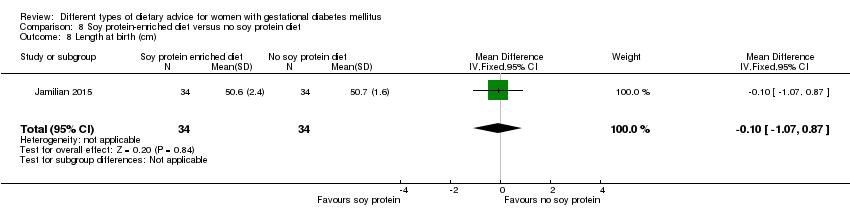
Comparison 8 Soy protein‐enriched diet versus no soy protein diet, Outcome 8 Length at birth (cm).
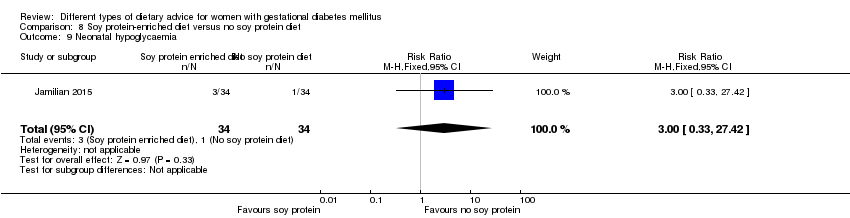
Comparison 8 Soy protein‐enriched diet versus no soy protein diet, Outcome 9 Neonatal hypoglycaemia.
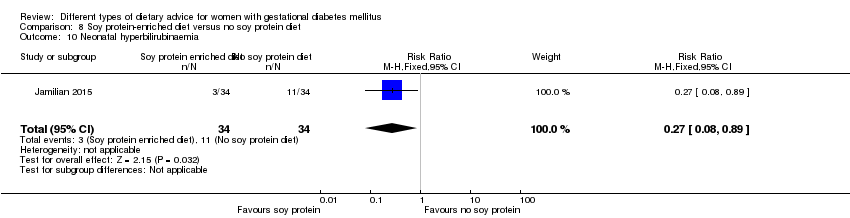
Comparison 8 Soy protein‐enriched diet versus no soy protein diet, Outcome 10 Neonatal hyperbilirubinaemia.

Comparison 8 Soy protein‐enriched diet versus no soy protein diet, Outcome 11 Gestational weight gain: BMI at end of intervention (kg/m²).

Comparison 8 Soy protein‐enriched diet versus no soy protein diet, Outcome 12 Gestational weight gain: weight at end of intervention (kg).

Comparison 8 Soy protein‐enriched diet versus no soy protein diet, Outcome 13 Insulin sensitivity: end of intervention HOMA‐IR.
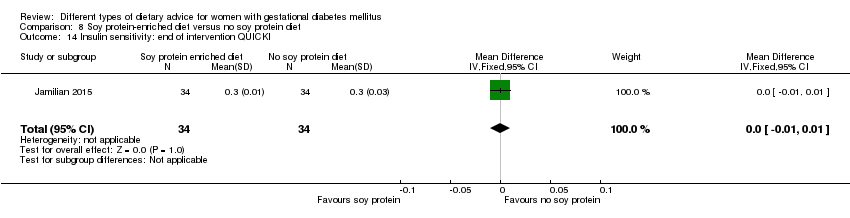
Comparison 8 Soy protein‐enriched diet versus no soy protein diet, Outcome 14 Insulin sensitivity: end of intervention QUICKI.
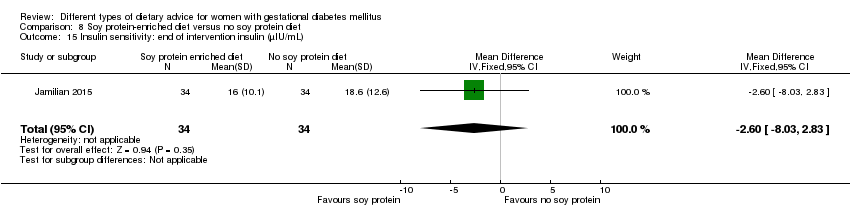
Comparison 8 Soy protein‐enriched diet versus no soy protein diet, Outcome 15 Insulin sensitivity: end of intervention insulin (µIU/mL).
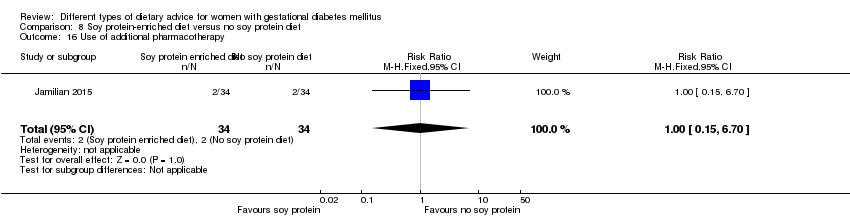
Comparison 8 Soy protein‐enriched diet versus no soy protein diet, Outcome 16 Use of additional pharmacotherapy.

Comparison 8 Soy protein‐enriched diet versus no soy protein diet, Outcome 17 Glycaemic control: end of intervention fasting plasma glucose (mg/dL).
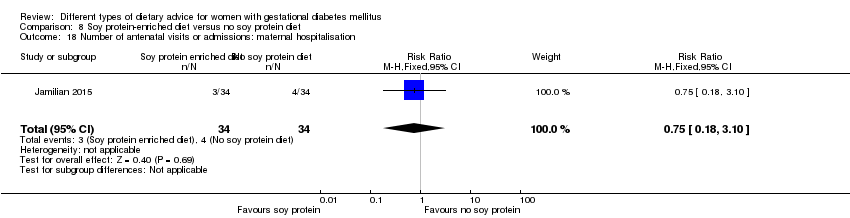
Comparison 8 Soy protein‐enriched diet versus no soy protein diet, Outcome 18 Number of antenatal visits or admissions: maternal hospitalisation.
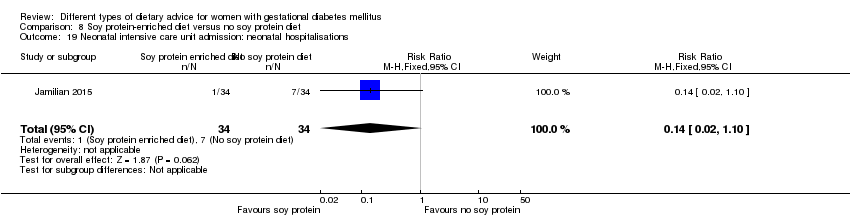
Comparison 8 Soy protein‐enriched diet versus no soy protein diet, Outcome 19 Neonatal intensive care unit admission: neonatal hospitalisations.

Comparison 9 High‐fibre diet versus standard‐fibre diet, Outcome 1 Gestational age at birth (weeks).
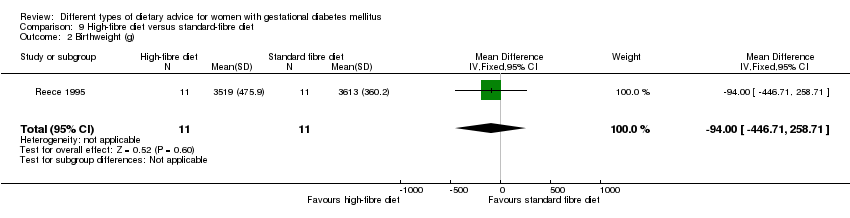
Comparison 9 High‐fibre diet versus standard‐fibre diet, Outcome 2 Birthweight (g).
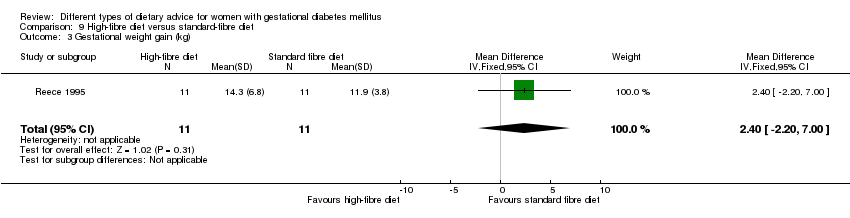
Comparison 9 High‐fibre diet versus standard‐fibre diet, Outcome 3 Gestational weight gain (kg).
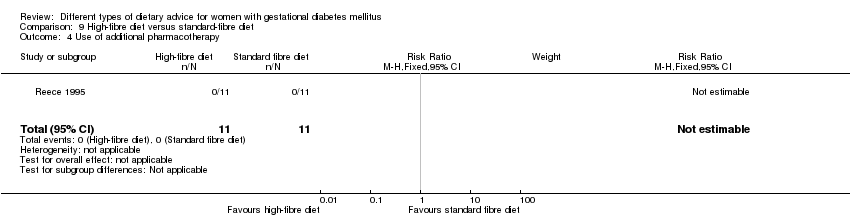
Comparison 9 High‐fibre diet versus standard‐fibre diet, Outcome 4 Use of additional pharmacotherapy.

Comparison 9 High‐fibre diet versus standard‐fibre diet, Outcome 5 Glycaemic control during/at end of intervention: mean blood glucose (mg/dL).
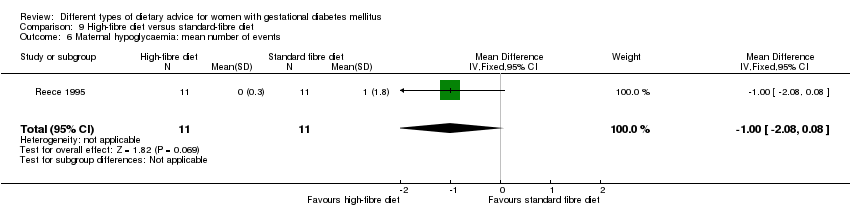
Comparison 9 High‐fibre diet versus standard‐fibre diet, Outcome 6 Maternal hypoglycaemia: mean number of events.

Comparison 10 Ethnic‐specific diet versus standard healthy diet, Outcome 1 Large‐for‐gestational age.

Comparison 10 Ethnic‐specific diet versus standard healthy diet, Outcome 2 Neonatal composite outcome: hypoglycaemia, neonatal asphyxia, respiratory distress syndrome, and hyperbilirubinaemia, hypocalcaemia.
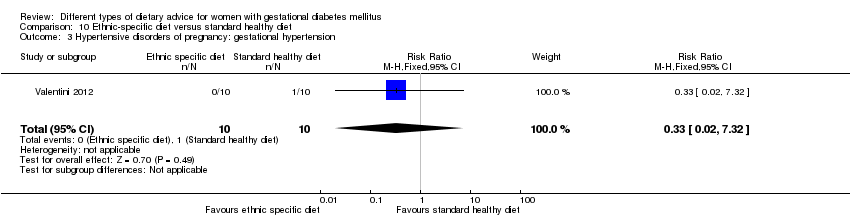
Comparison 10 Ethnic‐specific diet versus standard healthy diet, Outcome 3 Hypertensive disorders of pregnancy: gestational hypertension.
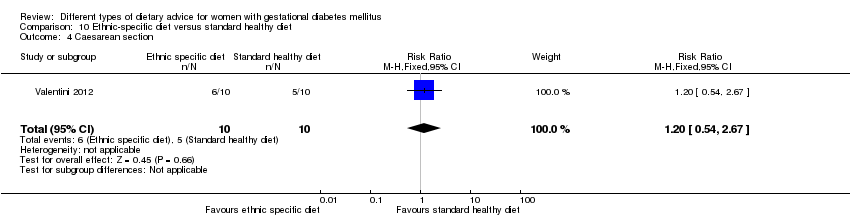
Comparison 10 Ethnic‐specific diet versus standard healthy diet, Outcome 4 Caesarean section.

Comparison 10 Ethnic‐specific diet versus standard healthy diet, Outcome 5 Gestational age at birth (weeks).
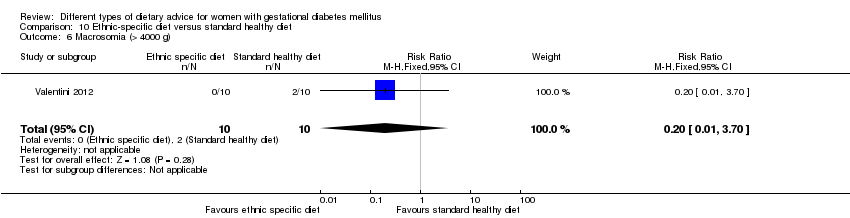
Comparison 10 Ethnic‐specific diet versus standard healthy diet, Outcome 6 Macrosomia (> 4000 g).

Comparison 10 Ethnic‐specific diet versus standard healthy diet, Outcome 7 Small‐for‐gestational age.

Comparison 10 Ethnic‐specific diet versus standard healthy diet, Outcome 8 Birthweight (g).

Comparison 10 Ethnic‐specific diet versus standard healthy diet, Outcome 9 Respiratory distress syndrome.

Comparison 10 Ethnic‐specific diet versus standard healthy diet, Outcome 10 Neonatal hypoglycaemia.

Comparison 10 Ethnic‐specific diet versus standard healthy diet, Outcome 11 Neonatal hyperbilirubinaemia.

Comparison 10 Ethnic‐specific diet versus standard healthy diet, Outcome 12 Neonatal hypocalcaemia.

Comparison 10 Ethnic‐specific diet versus standard healthy diet, Outcome 13 Gestational weight gain (kg).
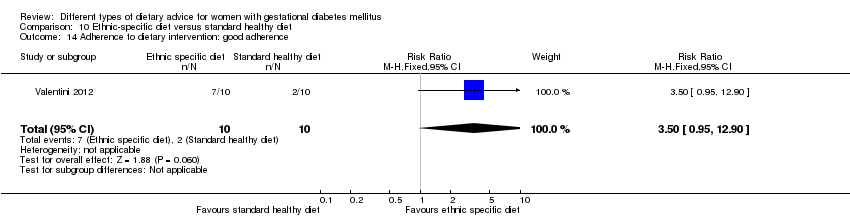
Comparison 10 Ethnic‐specific diet versus standard healthy diet, Outcome 14 Adherence to dietary intervention: good adherence.

Comparison 10 Ethnic‐specific diet versus standard healthy diet, Outcome 15 Use of additional pharmacotherapy.
| Low‐moderate GI diet versus moderate‐high GI diet (maternal outcomes) | ||||||
| Patient or population: pregnant women with GDM Settings: 4 RCTs in Australia, Canada, China and Mexico Intervention: low‐moderate GI diet Comparison: moderate‐high GI diet | ||||||
| Outcomes | Illustrative comparative risks* (95% CI) | Relative effect | No of participants | Quality of the evidence | Comments | |
| Risk with moderate‐high GI diet | Risk with low‐moderate GI diet | |||||
| Hypertensive disorders of pregnancy: severe hypertension or pre‐eclampsia | Study population | RR 1.02 (0.07 to 15.86) | 95 (1 RCT) | ⊕⊝⊝⊝ VERY LOW1,2 | 1 RCT in China | |
| 21 per 1000 | 21 per 1000 (2 to 333) | |||||
| Hypertensive disorders of pregnancy: eclampsia | Study population | RR 0.34 (0.01 to 8.14) | 83 (1 RCT) | ⊕⊝⊝⊝ VERY LOW1,2 | 1 RCT in China | |
| 24 per 1000 | 8 per 1000 (0 to 195) | |||||
| Caesarean section | Study population | RR 0.66 (0.29 to 1.47) | 63 (1 RCT) | ⊕⊕⊝⊝ LOW3,4 | 1 RCT in Australia | |
| 344 per 1000 | 227 per 1000 (100 to 506) | |||||
| Induction of labour | Study population | RR 0.88 (0.33 to 2.34) | 63 (1 RCT) | ⊕⊕⊝⊝ LOW3,4 | 1 RCT in Australia | |
| 219 per 1000 | 193 per 1000 (72 to 512) | |||||
| Perineal trauma | Not reported | |||||
| Type 2 diabetes mellitus | Not reported | |||||
| Postnatal depression | Not reported | |||||
| Postnatal weight retention or return to pre‐pregnancy weight | Not reported | |||||
| *The risk in the intervention group (and its 95% confidence interval) is based on the assumed risk in the comparison group and the relative effect of the intervention (and its 95% CI). | ||||||
| GRADE Working Group grades of evidence | ||||||
| 1Design limitations: one study at high risk of selection and performance bias; unclear risk of detection bias. 2Imprecision: wide confidence interval crossing the line of no effect, few events and small sample size. 3Design limitations: one study at unclear risk of selection and detection bias; high risk of performance bias. 4Imprecision: wide confidence interval crossing the line of no effect and small sample size. | ||||||
| Low‐moderate GI diet versus moderate‐high GI diet (neonatal/child/adulthood outcomes) | ||||||
| Patient or population: pregnant women with GDM Settings: 4 RCTs in Australia, Canada, China and Mexico Intervention: low‐moderate GI diet Comparison: moderate‐high GI diet | ||||||
| Outcomes | Illustrative comparative risks* (95% CI) | Relative effect | No of participants | Quality of the evidence | Comments | |
| Risk with moderate‐high GI diet | Risk with low‐moderate GI diet | |||||
| Large‐for‐gestational age | Study population | RR 0.71 (0.22 to 2.34) | 89 (2 RCTs) | ⊕⊕⊝⊝ LOW1,2 | 2 RCTs in Australia and Canada | |
| 146 per 1000 | 104 per 1000 (32 to 342) | |||||
| Perinatal mortality | Not reported | |||||
| Neonatal mortality or morbidity composite | Not reported | |||||
| Neonatal hypoglycaemia | Not reported | |||||
| Childhood/adulthood neurosensory disability | Not reported | |||||
| Childhood/adulthood adiposity | Not reported | |||||
| Childhood/adulthood type 2 diabetes mellitus | Not reported | |||||
| *The risk in the intervention group (and its 95% confidence interval) is based on the assumed risk in the comparison group and the relative effect of the intervention (and its 95% CI). | ||||||
| GRADE Working Group grades of evidence | ||||||
| 1Design limitations: one study at unclear risk of selection bias; two at high risk of performance bias and unclear risk of detection bias. 2Imprecision: wide confidence interval crossing the line of no effect and small sample sizes. | ||||||
| Energy‐restricted diet versus no energy‐restricted diet | ||||||
| Patient or population: pregnant women with GDM Settings: 3 RCTs in Australia, Canada and the United States Intervention: energy‐restricted diet Comparison: no energy‐restricted diet | ||||||
| Outcomes | Illustrative comparative risks* (95% CI) | Relative effect | No of participants | Quality of the evidence | Comments | |
| Risk with no energy‐restricted diet | Risk with energy‐restricted diet | |||||
| Hypertensive disorders of pregnancy: pre‐eclampsia | Study population | RR 1.00 (0.51 to 1.97) | 117 (1 RCT) | ⊕⊕⊝⊝ LOW1,2 | 1 RCT in Australia | |
| 222 per 1000 | 222 per 1000 (113 to 437) | |||||
| Caesarean section | Study population | RR 1.12 (0.80 to 1.56) | 420 (2 RCTs) | ⊕⊕⊝⊝ LOW3,4 | 2 RCTs in Australia and Canada | |
| 228 per 1000 | 255 per 1000 (182 to 356) | |||||
| Induction of labour | Study population | RR 1.02 (0.68 to 1.53) | 114 (1 RCT) | ⊕⊕⊝⊝ LOW1,2 | 1 RCT in Australia | |
| 451 per 1000 | 460 per 1000 (307 to 690) | |||||
| Perineal trauma | Not reported | |||||
| Type 2 diabetes mellitus | Not reported | |||||
| Postnatal depression | Not reported | |||||
| Postnatal weight retention or return to pre‐pregnancy weight | Not reported | |||||
| *The risk in the intervention group (and its 95% confidence interval) is based on the assumed risk in the comparison group and the relative effect of the intervention (and its 95% CI). | ||||||
| GRADE Working Group grades of evidence | ||||||
| 1Design limitations: one study at unclear risk of selection and detection bias. 2Imprecision: wide confidence interval crossing the line of no effect and small sample size. 3Design limitations: two studies at unclear risk of selection bias; one at high risk of performance bias and unclear risk of detection bias. 4Imprecision: wide confidence interval crossing the line of no effect. | ||||||
| Energy‐restricted diet versus no energy‐restricted diet (neonatal/child/adulthood outcomes) | ||||||
| Patient or population: pregnant women with GDM Settings: 3 RCTs in Australia, Canada and the United States Intervention: energy‐restricted diet Comparison: no energy‐restricted diet | ||||||
| Outcomes | Illustrative comparative risks* (95% CI) | Relative effect | No of participants | Quality of the evidence | Comments | |
| Risk with no energy‐restricted diet | Risk with energy‐restricted diet | |||||
| Large‐for‐gestational age | Study population | RR 1.17 (0.65 to 2.12) | 123 (1 RCT) | ⊕⊕⊝⊝ LOW1,2 | 1 RCT in Australia | |
| 246 per 1000 | 288 per 1000 (160 to 522) | |||||
| Perinatal mortality | Study population | Not estimable | 423 (2 RCTs) | ⊕⊕⊝⊝ LOW3,4 | No events; 2 RCTs in Australia and Canada | |
| 0 per 1000 | 0 per 1000 (0 to 0) | |||||
| Neonatal mortality or morbidity composite | Not reported | |||||
| Neonatal hypoglycaemia | Study population | RR 1.06 (0.48 to 2.32) | 408 (2 RCTs) | ⊕⊝⊝⊝ VERY LOW3,5,6 | 2 RCTs in Australia and Canada | |
| 190 per 1000 | 201 per 1000 (91 to 441) | |||||
| Childhood/adulthood neurosensory disability | Not reported | |||||
| Childhood/adulthood adiposity | Not reported | |||||
| Childhood/adulthood type 2 diabetes mellitus | Not reported | |||||
| *The risk in the intervention group (and its 95% confidence interval) is based on the assumed risk in the comparison group and the relative effect of the intervention (and its 95% CI). | ||||||
| GRADE Working Group grades of evidence | ||||||
| 1Design limitations: one study at unclear risk of selection and detection bias. 2Imprecision: wide confidence interval crossing the line of no effect and small sample size. 3Design limitations: two studies at unclear risk of selection bias; one at high risk of performance bias and unclear risk of detection bias. 4Imprecision: no events; relatively small sample sizes. 5Imprevision: wide confidence interval crossing the line of no effect. 6Inconsistency: substantial heterogeneity: I² = 75%. | ||||||
| Outcome or subgroup title | No. of studies | No. of participants | Statistical method | Effect size |
| 1 Large‐for‐gestational age Show forest plot | 2 | 89 | Risk Ratio (M‐H, Fixed, 95% CI) | 0.71 [0.22, 2.34] |
| 2 Hypertensive disorders of pregnancy (severe hypertension or pre‐eclampsia) Show forest plot | 1 | 95 | Risk Ratio (M‐H, Fixed, 95% CI) | 1.02 [0.07, 15.86] |
| 3 Hypertensive disorders of pregnancy (eclampsia) Show forest plot | 1 | 83 | Risk Ratio (M‐H, Fixed, 95% CI) | 0.34 [0.01, 8.14] |
| 4 Caesarean section Show forest plot | 1 | 63 | Risk Ratio (M‐H, Fixed, 95% CI) | 0.66 [0.29, 1.47] |
| 5 Gestational age at birth (weeks) Show forest plot | 1 | 62 | Mean Difference (IV, Fixed, 95% CI) | 0.30 [‐0.30, 0.90] |
| 6 Preterm birth Show forest plot | 2 | 146 | Risk Ratio (M‐H, Fixed, 95% CI) | 0.64 [0.22, 1.85] |
| 7 Macrosomia Show forest plot | 3 | 172 | Risk Ratio (M‐H, Fixed, 95% CI) | 0.59 [0.16, 2.26] |
| 8 Small‐for‐gestational age Show forest plot | 1 | 63 | Risk Ratio (M‐H, Fixed, 95% CI) | 5.16 [0.26, 103.27] |
| 9 Birthweight (g) Show forest plot | 2 | 145 | Mean Difference (IV, Fixed, 95% CI) | ‐55.98 [‐201.90, 89.95] |
| 10 Head circumference at birth (cm) Show forest plot | 1 | 59 | Mean Difference (IV, Fixed, 95% CI) | 0.40 [‐0.58, 1.38] |
| 11 Length at birth (cm) Show forest plot | 1 | 60 | Mean Difference (IV, Fixed, 95% CI) | ‐0.5 [‐1.54, 0.54] |
| 12 Ponderal index at birth (kg/m³) Show forest plot | 1 | 60 | Mean Difference (IV, Fixed, 95% CI) | 0.10 [‐0.03, 0.23] |
| 13 Normal vaginal birth Show forest plot | 1 | 63 | Risk Ratio (M‐H, Fixed, 95% CI) | 1.35 [0.89, 2.07] |
| 14 Operative vaginal birth Show forest plot | 1 | 63 | Risk Ratio (M‐H, Fixed, 95% CI) | 0.62 [0.16, 2.37] |
| 15 Induction of labour Show forest plot | 1 | 63 | Risk Ratio (M‐H, Fixed, 95% CI) | 0.88 [0.33, 2.34] |
| 16 Postpartum haemorrhage Show forest plot | 1 | 83 | Risk Ratio (M‐H, Fixed, 95% CI) | 1.02 [0.15, 6.93] |
| 17 Postpartum infection Show forest plot | 1 | 83 | Risk Ratio (M‐H, Fixed, 95% CI) | 0.34 [0.01, 8.14] |
| 18 Gestational weight gain (kg) Show forest plot | 1 | 83 | Mean Difference (IV, Fixed, 95% CI) | ‐0.47 [‐2.18, 1.24] |
| 19 Use of additional pharmacotherapy Show forest plot | 4 | 221 | Risk Ratio (M‐H, Random, 95% CI) | 0.82 [0.39, 1.74] |
| 20 Glycaemic control: end of intervention fasting plasma glucose (mmol/L) Show forest plot | 1 | 83 | Mean Difference (IV, Fixed, 95% CI) | ‐0.15 [‐0.55, 0.25] |
| 21 Glycaemic control: end of intervention 2‐hour postprandial glucose (mmol/L) Show forest plot | 1 | 83 | Mean Difference (IV, Fixed, 95% CI) | ‐0.71 [‐1.21, ‐0.21] |
| 22 Glycaemic control: end of intervention HbA1c (%) Show forest plot | 1 | 83 | Mean Difference (IV, Fixed, 95% CI) | 0.01 [‐0.18, 0.20] |
| Outcome or subgroup title | No. of studies | No. of participants | Statistical method | Effect size |
| 1 Large‐for‐gestational age Show forest plot | 1 | 123 | Risk Ratio (M‐H, Fixed, 95% CI) | 1.17 [0.65, 2.12] |
| 2 Perinatal mortality (stillbirth and neonatal mortality) Show forest plot | 2 | 423 | Risk Ratio (M‐H, Fixed, 95% CI) | 0.0 [0.0, 0.0] |
| 3 Hypertensive disorders of pregnancy: pre‐eclampsia Show forest plot | 1 | 117 | Risk Ratio (M‐H, Fixed, 95% CI) | 1.0 [0.51, 1.97] |
| 4 Caesarean section Show forest plot | 2 | 420 | Risk Ratio (M‐H, Fixed, 95% CI) | 1.12 [0.80, 1.56] |
| 5 Stillbirth Show forest plot | 2 | 423 | Risk Ratio (M‐H, Fixed, 95% CI) | 0.0 [0.0, 0.0] |
| 6 Neonatal mortality Show forest plot | 2 | 423 | Risk Ratio (M‐H, Fixed, 95% CI) | 0.0 [0.0, 0.0] |
| 7 Gestational age at birth (weeks) Show forest plot | 2 | 423 | Mean Difference (IV, Random, 95% CI) | ‐0.16 [‐0.67, 0.36] |
| 8 Macrosomia (> 4000 g) Show forest plot | 2 | 421 | Risk Ratio (M‐H, Fixed, 95% CI) | 0.99 [0.64, 1.53] |
| 9 Macrosomia (> 4500 g) Show forest plot | 1 | 299 | Risk Ratio (M‐H, Fixed, 95% CI) | 1.01 [0.33, 3.05] |
| 10 Birthweight (g) Show forest plot | 1 | 299 | Mean Difference (IV, Fixed, 95% CI) | ‐107.0 [‐240.32, 26.32] |
| 11 Shoulder dystocia Show forest plot | 2 | 418 | Risk Ratio (M‐H, Fixed, 95% CI) | 0.12 [0.01, 2.26] |
| 12 Bone fracture Show forest plot | 1 | 299 | Risk Ratio (M‐H, Fixed, 95% CI) | 0.0 [0.0, 0.0] |
| 13 Nerve palsy Show forest plot | 1 | 299 | Risk Ratio (M‐H, Fixed, 95% CI) | 0.0 [0.0, 0.0] |
| 14 Neonatal hypoglycaemia Show forest plot | 2 | 408 | Risk Ratio (M‐H, Random, 95% CI) | 1.06 [0.48, 2.32] |
| 15 Neonatal hyperbilirubinemia Show forest plot | 1 | 299 | Risk Ratio (M‐H, Fixed, 95% CI) | 0.81 [0.33, 1.98] |
| 16 Neonatal hypocalcaemia Show forest plot | 1 | 299 | Risk Ratio (M‐H, Fixed, 95% CI) | 1.36 [1.00, 1.86] |
| 17 Normal vaginal birth Show forest plot | 2 | 420 | Risk Ratio (M‐H, Fixed, 95% CI) | 0.96 [0.86, 1.08] |
| 18 Operative vaginal birth Show forest plot | 1 | 121 | Risk Ratio (M‐H, Fixed, 95% CI) | 0.98 [0.38, 2.54] |
| 19 Induction of labour Show forest plot | 1 | 114 | Risk Ratio (M‐H, Fixed, 95% CI) | 1.02 [0.68, 1.53] |
| 20 Gestational weight gain (kg) Show forest plot | 1 | 117 | Mean Difference (IV, Fixed, 95% CI) | 1.88 [‐1.96, 5.72] |
| 21 Gestational weight gain: weight at birth (kg) Show forest plot | 1 | 299 | Mean Difference (IV, Fixed, 95% CI) | ‐3.15 [‐7.29, 0.99] |
| 22 Insulin sensitivity: during intervention fasting plasma insulin (pM) Show forest plot | 1 | 12 | Mean Difference (IV, Fixed, 95% CI) | 100.0 [‐26.02, 226.02] |
| 23 Insulin sensitivity: end of intervention fasting plasma insulin (pM) Show forest plot | 1 | 12 | Mean Difference (IV, Fixed, 95% CI) | ‐20.0 [‐127.70, 87.70] |
| 24 Use of additional pharmacotherapy Show forest plot | 2 | Risk Ratio (M‐H, Random, 95% CI) | Subtotals only | |
| 25 Glycaemic control: during intervention preprandial/fasting glucose (mmol/L) Show forest plot | 2 | 311 | Mean Difference (IV, Random, 95% CI) | 0.21 [‐0.58, 0.99] |
| 26 Glycaemic control: during intervention 24 hour mean plasma glucose (mmol/L) Show forest plot | 1 | 12 | Mean Difference (IV, Fixed, 95% CI) | 0.10 [‐0.82, 1.02] |
| 27 Glycaemic control: during intervention 1 hour postprandial glucose (mmol/L) Show forest plot | 1 | 299 | Mean Difference (IV, Fixed, 95% CI) | ‐0.25 [‐0.68, 0.18] |
| 28 Glycaemic control: end of intervention preprandial/fasting glucose (mmol/L) Show forest plot | 2 | 311 | Mean Difference (IV, Fixed, 95% CI) | ‐0.23 [‐0.44, ‐0.03] |
| 29 Glycaemic control: end of intervention 24‐hour mean plasma glucose (mmol/L) Show forest plot | 1 | 12 | Mean Difference (IV, Fixed, 95% CI) | ‐1.30 [‐2.25, ‐0.35] |
| 30 Glycaemic control: end of intervention 1‐hour postprandial glucose (mmol/L) Show forest plot | 1 | 299 | Mean Difference (IV, Fixed, 95% CI) | ‐0.51 [‐0.89, ‐0.13] |
| 31 Glycaemic control: during/at end of intervention fasting glucose (mmol/L) Show forest plot | 1 | 117 | Mean Difference (IV, Fixed, 95% CI) | 0.10 [‐0.18, 0.38] |
| 32 Glycaemic control: during/at end of intervention mean plasma glucose (mmol/L) Show forest plot | 1 | 117 | Mean Difference (IV, Fixed, 95% CI) | 0.10 [‐0.34, 0.54] |
| 33 Glycaemic control: during/at end of intervention mean HbA1c (%) Show forest plot | 1 | 117 | Mean Difference (IV, Fixed, 95% CI) | ‐0.20 [‐0.64, 0.24] |
| Outcome or subgroup title | No. of studies | No. of participants | Statistical method | Effect size |
| 1 Hypertensive disorders of pregnancy: pre‐eclampsia Show forest plot | 3 | 136 | Risk Ratio (M‐H, Fixed, 95% CI) | 1.0 [0.31, 3.26] |
| 2 Caesarean section Show forest plot | 2 | 86 | Risk Ratio (M‐H, Fixed, 95% CI) | 0.53 [0.37, 0.76] |
| 3 Gestational age at birth (weeks) Show forest plot | 1 | 52 | Mean Difference (IV, Fixed, 95% CI) | 0.20 [‐0.45, 0.85] |
| 4 Macrosomia (≥ 4000 g) Show forest plot | 1 | 52 | Risk Ratio (M‐H, Fixed, 95% CI) | 0.1 [0.01, 0.73] |
| 5 Birthweight (g) Show forest plot | 2 | 86 | Mean Difference (IV, Fixed, 95% CI) | ‐581.27 [‐790.32, ‐372.22] |
| 6 Head circumference at birth (cm) Show forest plot | 1 | 52 | Mean Difference (IV, Fixed, 95% CI) | ‐0.90 [‐1.44, ‐0.36] |
| 7 Length at birth(cm) Show forest plot | 1 | 52 | Mean Difference (IV, Fixed, 95% CI) | ‐0.5 [‐1.59, 0.59] |
| 8 Ponderal index at birth (kg/m³) Show forest plot | 1 | 52 | Mean Difference (IV, Fixed, 95% CI) | ‐0.37 [‐0.54, ‐0.20] |
| 9 Placental abruption Show forest plot | 1 | 58 | Risk Ratio (M‐H, Fixed, 95% CI) | 3.0 [0.13, 70.74] |
| 10 Gestational weight gain: BMI at end of intervention (kg/m²) Show forest plot | 2 | 66 | Mean Difference (IV, Random, 95% CI) | ‐0.83 [‐3.76, 2.11] |
| 11 Gestational weight gain: weight at end of intervention (kg) Show forest plot | 2 | 66 | Mean Difference (IV, Fixed, 95% CI) | ‐2.88 [‐8.48, 2.71] |
| 12 Insulin sensitivity: end of intervention HOMA‐IR Show forest plot | 1 | 32 | Mean Difference (IV, Fixed, 95% CI) | 1.00 [‐1.34, ‐0.66] |
| 13 Insulin sensitivity: end of intervention insulin (µIU/mL) Show forest plot | 1 | 32 | Mean Difference (IV, Fixed, 95% CI) | ‐3.26 [‐4.42, ‐2.10] |
| 14 Use of additional pharmacotherapy Show forest plot | 2 | 86 | Risk Ratio (M‐H, Fixed, 95% CI) | 0.28 [0.14, 0.53] |
| 15 Glycaemic control: end of intervention fasting blood glucose (mmol/L) Show forest plot | 2 | 66 | Mean Difference (IV, Fixed, 95% CI) | ‐0.42 [‐0.53, ‐0.32] |
| 16 Glycaemic control: at end of intervention HbA1c (%) Show forest plot | 1 | 34 | Mean Difference (IV, Fixed, 95% CI) | ‐0.25 [‐0.76, 0.26] |
| Outcome or subgroup title | No. of studies | No. of participants | Statistical method | Effect size |
| 1 Large‐for‐gestational age Show forest plot | 1 | 149 | Risk Ratio (M‐H, Fixed, 95% CI) | 0.51 [0.13, 1.95] |
| 2 Perinatal mortality (stillbirth and neonatal mortality) Show forest plot | 1 | 150 | Risk Ratio (M‐H, Fixed, 95% CI) | 3.0 [0.12, 72.49] |
| 3 Hypertensive disorders of pregnancy: maternal hypertension Show forest plot | 1 | 150 | Risk Ratio (M‐H, Fixed, 95% CI) | 0.4 [0.13, 1.22] |
| 4 Caesarean section Show forest plot | 2 | 179 | Risk Ratio (M‐H, Fixed, 95% CI) | 1.29 [0.84, 1.99] |
| 5 Stillbirth Show forest plot | 1 | 150 | Risk Ratio (M‐H, Fixed, 95% CI) | 3.0 [0.12, 72.49] |
| 6 Gestational age at birth (weeks) Show forest plot | 2 | 180 | Mean Difference (IV, Fixed, 95% CI) | 0.10 [‐0.42, 0.62] |
| 7 Macrosomia (> 4000 g) Show forest plot | 2 | 179 | Risk Ratio (M‐H, Fixed, 95% CI) | 0.20 [0.02, 1.69] |
| 8 Small‐for‐gestational age Show forest plot | 1 | 149 | Risk Ratio (M‐H, Fixed, 95% CI) | 0.68 [0.29, 1.56] |
| 9 Birthweight (g) Show forest plot | 1 | 30 | Mean Difference (IV, Fixed, 95% CI) | 22.0 [‐241.06, 285.06] |
| 10 Neonatal hypoglycaemia Show forest plot | 1 | 149 | Risk Ratio (M‐H, Fixed, 95% CI) | 0.91 [0.39, 2.12] |
| 11 Normal vaginal birth Show forest plot | 1 | 30 | Risk Ratio (M‐H, Fixed, 95% CI) | 0.78 [0.39, 1.54] |
| 12 Operative vaginal birth Show forest plot | 1 | 30 | Risk Ratio (M‐H, Fixed, 95% CI) | 1.0 [0.07, 14.55] |
| 13 Gestational weight gain: maternal weight gain (kg) Show forest plot | 1 | 145 | Mean Difference (IV, Fixed, 95% CI) | ‐0.90 [‐1.60, ‐0.20] |
| 14 Adherence to dietary intervention: fully applied the recommended menu Show forest plot | 1 | 30 | Risk Ratio (M‐H, Fixed, 95% CI) | 1.09 [0.73, 1.62] |
| 15 Use of additional pharmacotherapy. Show forest plot | 2 | 180 | Risk Ratio (M‐H, Fixed, 95% CI) | 1.02 [0.77, 1.37] |
| 16 Glycaemic control: end of intervention fasting blood glucose (mg/dL) Show forest plot | 1 | 30 | Mean Difference (IV, Fixed, 95% CI) | 5.0 [‐0.01, 10.01] |
| 17 Glycaemic control: end of intervention 2‐hour post breakfast blood glucose (mg/dL) Show forest plot | 1 | 30 | Mean Difference (IV, Fixed, 95% CI) | 5.0 [‐1.60, 11.60] |
| 18 Glycaemic control: end of intervention 2‐hour post lunch blood glucose (mg/dL) Show forest plot | 1 | 30 | Mean Difference (IV, Fixed, 95% CI) | 3.0 [‐2.77, 8.77] |
| 19 Glycaemic control: end of intervention 2‐hour post dinner blood glucose (mg/dL) Show forest plot | 1 | 30 | Mean Difference (IV, Fixed, 95% CI) | 6.0 [‐1.47, 13.47] |
| Outcome or subgroup title | No. of studies | No. of participants | Statistical method | Effect size |
| 1 Large‐for‐gestational age Show forest plot | 1 | 27 | Risk Ratio (M‐H, Fixed, 95% CI) | 0.54 [0.21, 1.37] |
| 2 Hypertensive disorders of pregnancy: pre‐eclampsia Show forest plot | 1 | 27 | Risk Ratio (M‐H, Fixed, 95% CI) | 0.0 [0.0, 0.0] |
| 3 Hypertensive disorders of pregnancy: hypertension in pregnancy Show forest plot | 1 | 27 | Risk Ratio (M‐H, Fixed, 95% CI) | 0.54 [0.06, 5.26] |
| 4 Caesarean section Show forest plot | 1 | 27 | Risk Ratio (M‐H, Fixed, 95% CI) | 1.08 [0.07, 15.50] |
| 5 Type 2 diabetes: 'diabetic' OGTT 1‐2 weeks postpartum Show forest plot | 1 | 24 | Risk Ratio (M‐H, Fixed, 95% CI) | 2.0 [0.45, 8.94] |
| 6 Type 2 diabetes: 'diabetic' OGTT 4‐13 months postpartum Show forest plot | 1 | 6 | Risk Ratio (M‐H, Fixed, 95% CI) | 1.0 [0.10, 9.61] |
| 7 Gestational age at birth (weeks) Show forest plot | 2 | 111 | Mean Difference (IV, Fixed, 95% CI) | 0.25 [‐0.51, 1.01] |
| 8 Preterm birth Show forest plot | 1 | 84 | Risk Ratio (M‐H, Fixed, 95% CI) | 0.0 [0.0, 0.0] |
| 9 Macrosomia (> 4000 g) Show forest plot | 2 | 111 | Risk Ratio (M‐H, Fixed, 95% CI) | 0.53 [0.18, 1.56] |
| 10 Birthweight (g) Show forest plot | 2 | 111 | Mean Difference (IV, Fixed, 95% CI) | ‐138.19 [‐292.59, 16.21] |
| 11 Placental abruption Show forest plot | 1 | 27 | Risk Ratio (M‐H, Fixed, 95% CI) | 0.0 [0.0, 0.0] |
| 12 Gestational weight gain (kg) Show forest plot | 1 | 84 | Mean Difference (IV, Fixed, 95% CI) | ‐1.98 [‐4.32, 0.36] |
| 13 Gestational weight gain: BMI at birth (kg/m²) Show forest plot | 1 | 27 | Mean Difference (IV, Fixed, 95% CI) | 3.90 [2.41, 5.39] |
| 14 Gestational weight gain: weight at birth (kg) Show forest plot | 1 | 27 | Mean Difference (IV, Fixed, 95% CI) | 11.90 [7.47, 16.33] |
| 15 Insulin sensitivity: during intervention (38 week) insulin (mU/L) Show forest plot | 1 | 24 | Mean Difference (IV, Fixed, 95% CI) | 4.40 [2.59, 6.21] |
| 16 Insulin sensitivity: during intervention (38 week) insulin sensitivity (10‐5 min‐1 per mU/L min) Show forest plot | 1 | 24 | Mean Difference (IV, Fixed, 95% CI) | ‐0.08 [‐0.21, 0.05] |
| 17 Insulin sensitivity: end of intervention IAI Show forest plot | 1 | 84 | Mean Difference (IV, Fixed, 95% CI) | 0.04 [‐0.28, 0.36] |
| 18 Use of additional pharmacotherapy Show forest plot | 2 | 111 | Risk Ratio (M‐H, Fixed, 95% CI) | 0.0 [0.0, 0.0] |
| 19 Glycaemic control: during intervention (38 week) fasting blood glucose (mmol/L) Show forest plot | 1 | 24 | Mean Difference (IV, Fixed, 95% CI) | 0.5 [0.30, 0.70] |
| 20 Glycaemic control: during intervention (38 week) postprandial glucose (mmol/L) Show forest plot | 1 | 25 | Mean Difference (IV, Fixed, 95% CI) | 0.90 [0.58, 1.22] |
| 21 Glycaemic control: during intervention (38 week) HbA1c (%) Show forest plot | 1 | 25 | Mean Difference (IV, Fixed, 95% CI) | 0.40 [0.32, 0.48] |
| 22 Glycaemic control: end of intervention fasting blood glucose (mmol/L) Show forest plot | 1 | 84 | Mean Difference (IV, Fixed, 95% CI) | 0.18 [‐0.17, 0.53] |
| 23 Glycaemic control: end of intervention 2‐hour postprandial blood glucose (mmol/L) Show forest plot | 1 | 84 | Mean Difference (IV, Fixed, 95% CI) | ‐0.02 [‐0.29, 0.25] |
| 24 BMI 5‐9 months postpartum (kg/m²) Show forest plot | 1 | 27 | Mean Difference (IV, Fixed, 95% CI) | 4.10 [2.34, 5.86] |
| 25 Impaired glucose tolerance: 'borderline' OGTT 1‐2 weeks postpartum Show forest plot | 1 | 24 | Risk Ratio (M‐H, Fixed, 95% CI) | 1.5 [0.30, 7.43] |
| 26 Impaired glucose tolerance: 'borderline' OGTT 4‐13 months postpartum Show forest plot | 1 | 7 | Risk Ratio (M‐H, Fixed, 95% CI) | 0.27 [0.01, 4.93] |
| Outcome or subgroup title | No. of studies | No. of participants | Statistical method | Effect size |
| 1 Large‐for‐gestational age Show forest plot | 1 | 92 | Risk Ratio (M‐H, Fixed, 95% CI) | 2.87 [0.61, 13.50] |
| 2 Caesarean section Show forest plot | 1 | 92 | Risk Ratio (M‐H, Fixed, 95% CI) | 1.91 [0.91, 4.03] |
| 3 Type 2 diabetes mellitus at 3 months postpartum Show forest plot | 1 | 58 | Risk Ratio (M‐H, Fixed, 95% CI) | 0.76 [0.11, 5.01] |
| 4 Gestational age at birth (weeks) Show forest plot | 1 | 92 | Mean Difference (IV, Fixed, 95% CI) | ‐0.10 [‐0.39, 0.19] |
| 5 Preterm birth Show forest plot | 1 | 96 | Risk Ratio (M‐H, Fixed, 95% CI) | 0.96 [0.14, 6.53] |
| 6 Macrosomia (> 4000 g) Show forest plot | 1 | 92 | Risk Ratio (M‐H, Fixed, 95% CI) | 0.32 [0.03, 2.96] |
| 7 Small‐for‐gestational age Show forest plot | 1 | 92 | Risk Ratio (M‐H, Fixed, 95% CI) | 1.20 [0.34, 4.18] |
| 8 Birthweight (g) Show forest plot | 1 | 92 | Mean Difference (IV, Fixed, 95% CI) | 0.0 [‐277.18, 277.18] |
| 9 Head circumference at birth (cm) Show forest plot | 1 | 82 | Mean Difference (IV, Fixed, 95% CI) | ‐0.20 [‐0.91, 0.51] |
| 10 Length at birth (cm) Show forest plot | 1 | 92 | Mean Difference (IV, Fixed, 95% CI) | 0.0 [‐0.83, 0.83] |
| 11 Ponderal index at birth (kg/m³) Show forest plot | 1 | 92 | Mean Difference (IV, Fixed, 95% CI) | 0.20 [‐0.79, 1.19] |
| 12 Weight and height at 3 months postpartum Show forest plot | Other data | No numeric data | ||
| 12.1 Weight for age percentile (adjusted for breastfeeding status) | Other data | No numeric data | ||
| 12.2 Length for age percentile (adjusted for breastfeeding status) | Other data | No numeric data | ||
| 12.3 Weight for length percentile (adjusted for breastfeeding status) | Other data | No numeric data | ||
| 13 Weight gain during pregnancy (kg) Show forest plot | 1 | 87 | Mean Difference (IV, Fixed, 95% CI) | ‐1.20 [‐3.43, 1.03] |
| 14 Adherence to dietary intervention Show forest plot | 1 | 92 | Risk Ratio (M‐H, Fixed, 95% CI) | 0.84 [0.64, 1.11] |
| 15 Insulin sensitivity: end of intervention: HOMA2‐IR (%) Show forest plot | 1 | 77 | Mean Difference (IV, Fixed, 95% CI) | ‐0.10 [‐0.38, 0.18] |
| 16 Insulin sensitivity: end of intervention insulin (pmol/L) Show forest plot | 1 | 70 | Mean Difference (IV, Fixed, 95% CI) | 10.80 [‐22.36, 43.96] |
| 17 Use of additional pharmacotherapy Show forest plot | 1 | 92 | Risk Ratio (M‐H, Fixed, 95% CI) | 0.83 [0.58, 1.17] |
| 18 Glycaemic control: end of intervention blood glucose (mmol/L) Show forest plot | 1 | 74 | Mean Difference (IV, Fixed, 95% CI) | ‐0.10 [‐0.38, 0.18] |
| 19 Glycaemic control: end of intervention HbA1c (%) Show forest plot | Other data | No numeric data | ||
| 20 Return to pre‐pregnancy weight at 3 months postpartum Show forest plot | 1 | 55 | Risk Ratio (M‐H, Fixed, 95% CI) | 1.15 [0.43, 3.07] |
| 21 BMI at 3 months postpartum (kg/m²) Show forest plot | 1 | 52 | Mean Difference (IV, Fixed, 95% CI) | ‐0.5 [‐2.79, 1.79] |
| 22 Impaired glucose tolerance at 3 months postpartum Show forest plot | 1 | 58 | Risk Ratio (M‐H, Fixed, 95% CI) | 1.33 [0.44, 4.04] |
| 23 Insulin sensitivity at 3 months postpartum (insulin (pmol/L)) Show forest plot | 1 | 55 | Mean Difference (IV, Fixed, 95% CI) | ‐14.20 [‐32.58, 4.18] |
| 24 Insulin sensitivity at 3 months postpartum (HOMA‐IR (%)) Show forest plot | 1 | 53 | Mean Difference (IV, Fixed, 95% CI) | ‐0.30 [‐0.66, 0.06] |
| Outcome or subgroup title | No. of studies | No. of participants | Statistical method | Effect size |
| 1 Large‐for‐gestational age Show forest plot | 1 | 99 | Risk Ratio (M‐H, Fixed, 95% CI) | 0.73 [0.25, 2.14] |
| 2 Caesarean section Show forest plot | 1 | 99 | Risk Ratio (M‐H, Fixed, 95% CI) | 0.78 [0.38, 1.62] |
| 3 Preterm birth (< 37 weeks' gestation) Show forest plot | 1 | 99 | Risk Ratio (M‐H, Fixed, 95% CI) | 0.51 [0.10, 2.66] |
| 4 Gestational weight gain: BMI at end of intervention (kg/m²) Show forest plot | 1 | 99 | Mean Difference (IV, Fixed, 95% CI) | 0.0 [‐1.75, 1.75] |
| 5 Gestational weight gain: weight at end of intervention (kg) Show forest plot | 1 | 99 | Mean Difference (IV, Fixed, 95% CI) | ‐0.10 [‐4.91, 4.71] |
| 6 Insulin sensitivity: end of intervention HOMA‐IR Show forest plot | 1 | 99 | Mean Difference (IV, Fixed, 95% CI) | ‐0.30 [‐0.77, 0.17] |
| 7 Insulin sensitivity: end of intervention fasting insulin (µU/mL) Show forest plot | 1 | 99 | Mean Difference (IV, Fixed, 95% CI) | ‐0.5 [‐2.69, 1.69] |
| 8 Use of additional pharmacotherapy Show forest plot | 1 | 99 | Risk Ratio (M‐H, Fixed, 95% CI) | 0.61 [0.15, 2.42] |
| 9 Glycaemic control: end of intervention fasting glucose (mg/dL) Show forest plot | 1 | 99 | Mean Difference (IV, Fixed, 95% CI) | 0.0 [‐4.25, 4.25] |
| 10 Glycaemic control: end of intervention postprandial glucose (mg/dL) Show forest plot | 1 | 99 | Mean Difference (IV, Fixed, 95% CI) | ‐9.30 [‐15.58, ‐3.02] |
| 11 Glycaemic control: end of intervention HbA1c (%) Show forest plot | 1 | 99 | Mean Difference (IV, Fixed, 95% CI) | ‐0.10 [‐0.28, 0.08] |
| 12 Length of postnatal stay (baby): stay > 4 days Show forest plot | 1 | 99 | Risk Ratio (M‐H, Fixed, 95% CI) | 1.33 [0.73, 2.44] |
| Outcome or subgroup title | No. of studies | No. of participants | Statistical method | Effect size |
| 1 Hypertensive disorders of pregnancy: pre‐eclampsia Show forest plot | 1 | 68 | Risk Ratio (M‐H, Fixed, 95% CI) | 2.0 [0.19, 21.03] |
| 2 Caesarean section Show forest plot | 1 | 68 | Risk Ratio (M‐H, Fixed, 95% CI) | 1.0 [0.57, 1.77] |
| 3 Gestational age at birth (weeks) Show forest plot | 1 | 68 | Mean Difference (IV, Fixed, 95% CI) | 0.40 [‐0.23, 1.03] |
| 4 Preterm birth (< 37 weeks' gestation) Show forest plot | 1 | 68 | Risk Ratio (M‐H, Fixed, 95% CI) | 2.0 [0.19, 21.03] |
| 5 Macrosomia (> 4000 g) Show forest plot | 1 | 68 | Risk Ratio (M‐H, Fixed, 95% CI) | 0.6 [0.16, 2.31] |
| 6 Birthweight (g) Show forest plot | 1 | 68 | Mean Difference (IV, Fixed, 95% CI) | ‐142.60 [‐360.40, 75.20] |
| 7 Head circumference at birth (cm) Show forest plot | 1 | 68 | Mean Difference (IV, Fixed, 95% CI) | ‐0.20 [‐1.01, 0.61] |
| 8 Length at birth (cm) Show forest plot | 1 | 68 | Mean Difference (IV, Fixed, 95% CI) | ‐0.10 [‐1.07, 0.87] |
| 9 Neonatal hypoglycaemia Show forest plot | 1 | 68 | Risk Ratio (M‐H, Fixed, 95% CI) | 3.0 [0.33, 27.42] |
| 10 Neonatal hyperbilirubinaemia Show forest plot | 1 | 68 | Risk Ratio (M‐H, Fixed, 95% CI) | 0.27 [0.08, 0.89] |
| 11 Gestational weight gain: BMI at end of intervention (kg/m²) Show forest plot | 1 | 68 | Mean Difference (IV, Fixed, 95% CI) | 0.60 [‐1.43, 2.63] |
| 12 Gestational weight gain: weight at end of intervention (kg) Show forest plot | 1 | 68 | Mean Difference (IV, Fixed, 95% CI) | 3.50 [‐1.47, 8.47] |
| 13 Insulin sensitivity: end of intervention HOMA‐IR Show forest plot | 1 | 68 | Mean Difference (IV, Fixed, 95% CI) | ‐1.0 [‐2.20, 0.20] |
| 14 Insulin sensitivity: end of intervention QUICKI Show forest plot | 1 | 68 | Mean Difference (IV, Fixed, 95% CI) | 0.0 [‐0.01, 0.01] |
| 15 Insulin sensitivity: end of intervention insulin (µIU/mL) Show forest plot | 1 | 68 | Mean Difference (IV, Fixed, 95% CI) | ‐2.60 [‐8.03, 2.83] |
| 16 Use of additional pharmacotherapy Show forest plot | 1 | 68 | Risk Ratio (M‐H, Fixed, 95% CI) | 1.0 [0.15, 6.70] |
| 17 Glycaemic control: end of intervention fasting plasma glucose (mg/dL) Show forest plot | 1 | 68 | Mean Difference (IV, Fixed, 95% CI) | ‐10.60 [‐15.37, ‐5.83] |
| 18 Number of antenatal visits or admissions: maternal hospitalisation Show forest plot | 1 | 68 | Risk Ratio (M‐H, Fixed, 95% CI) | 0.75 [0.18, 3.10] |
| 19 Neonatal intensive care unit admission: neonatal hospitalisations Show forest plot | 1 | 68 | Risk Ratio (M‐H, Fixed, 95% CI) | 0.14 [0.02, 1.10] |
| Outcome or subgroup title | No. of studies | No. of participants | Statistical method | Effect size |
| 1 Gestational age at birth (weeks) Show forest plot | 1 | 22 | Mean Difference (IV, Fixed, 95% CI) | 0.0 [‐1.30, 1.30] |
| 2 Birthweight (g) Show forest plot | 1 | 22 | Mean Difference (IV, Fixed, 95% CI) | ‐94.0 [‐446.71, 258.71] |
| 3 Gestational weight gain (kg) Show forest plot | 1 | 22 | Mean Difference (IV, Fixed, 95% CI) | 2.40 [‐2.20, 7.00] |
| 4 Use of additional pharmacotherapy Show forest plot | 1 | 22 | Risk Ratio (M‐H, Fixed, 95% CI) | 0.0 [0.0, 0.0] |
| 5 Glycaemic control during/at end of intervention: mean blood glucose (mg/dL) Show forest plot | 1 | 22 | Mean Difference (IV, Fixed, 95% CI) | 0.0 [‐8.26, 8.26] |
| 6 Maternal hypoglycaemia: mean number of events Show forest plot | 1 | 22 | Mean Difference (IV, Fixed, 95% CI) | ‐1.0 [‐2.08, 0.08] |
| Outcome or subgroup title | No. of studies | No. of participants | Statistical method | Effect size |
| 1 Large‐for‐gestational age Show forest plot | 1 | 20 | Risk Ratio (M‐H, Fixed, 95% CI) | 0.14 [0.01, 2.45] |
| 2 Neonatal composite outcome: hypoglycaemia, neonatal asphyxia, respiratory distress syndrome, and hyperbilirubinaemia, hypocalcaemia Show forest plot | 1 | 20 | Risk Ratio (M‐H, Fixed, 95% CI) | 0.0 [0.0, 0.0] |
| 3 Hypertensive disorders of pregnancy: gestational hypertension Show forest plot | 1 | 20 | Risk Ratio (M‐H, Fixed, 95% CI) | 0.33 [0.02, 7.32] |
| 4 Caesarean section Show forest plot | 1 | 20 | Risk Ratio (M‐H, Fixed, 95% CI) | 1.2 [0.54, 2.67] |
| 5 Gestational age at birth (weeks) Show forest plot | 1 | 20 | Mean Difference (IV, Fixed, 95% CI) | ‐0.40 [‐1.15, 0.35] |
| 6 Macrosomia (> 4000 g) Show forest plot | 1 | 20 | Risk Ratio (M‐H, Fixed, 95% CI) | 0.2 [0.01, 3.70] |
| 7 Small‐for‐gestational age Show forest plot | 1 | 20 | Risk Ratio (M‐H, Fixed, 95% CI) | 0.33 [0.02, 7.32] |
| 8 Birthweight (g) Show forest plot | 1 | 20 | Mean Difference (IV, Fixed, 95% CI) | ‐368.00 [‐928.87, 188.87] |
| 9 Respiratory distress syndrome Show forest plot | 1 | 20 | Risk Ratio (M‐H, Fixed, 95% CI) | 0.0 [0.0, 0.0] |
| 10 Neonatal hypoglycaemia Show forest plot | 1 | 20 | Risk Ratio (M‐H, Fixed, 95% CI) | 0.0 [0.0, 0.0] |
| 11 Neonatal hyperbilirubinaemia Show forest plot | 1 | 20 | Risk Ratio (M‐H, Fixed, 95% CI) | 0.0 [0.0, 0.0] |
| 12 Neonatal hypocalcaemia Show forest plot | 1 | 20 | Risk Ratio (M‐H, Fixed, 95% CI) | 0.0 [0.0, 0.0] |
| 13 Gestational weight gain (kg) Show forest plot | 1 | 20 | Mean Difference (IV, Fixed, 95% CI) | ‐2.20 [‐7.24, 2.84] |
| 14 Adherence to dietary intervention: good adherence Show forest plot | 1 | 20 | Risk Ratio (M‐H, Fixed, 95% CI) | 3.5 [0.95, 12.90] |
| 15 Use of additional pharmacotherapy Show forest plot | 1 | 20 | Risk Ratio (M‐H, Fixed, 95% CI) | 2.0 [0.21, 18.69] |