妊娠34周后到足月的高血压疾病的计划性早期分娩对比预期处理
Referencias
References to studies included in this review
References to studies excluded from this review
References to ongoing studies
Additional references
References to other published versions of this review
Characteristics of studies
Characteristics of included studies [ordered by study ID]
| Methods | 2‐arm multicentre randomised controlled trial. | |
| Participants | Setting: 51 hospitals in the Netherlands. June 2009 to March 2013. Inclusion criteria: pregnant women (singleton or multiple pregnancies), 34+0‐36+6 weeks' gestation, who had gestational hypertension, mild pre‐eclampsia, or deteriorating chronic hypertension. Gestational hypertension: diastolic blood pressure ≥ 100 mmHg on 2 occasions at least 6 hours apart in a woman who was normotensive until at least 20 weeks GA. Mild PE: diastolic blood pressure > 90 mmHg on 2 occasions at least 6 hours apart in a woman who was normotensive until at least 20 weeks GA plus proteinuria (> 300 mg total protein in a 24‐hour urine collection or > 30 in a spot urine protein:creatinine ratio). Chronic hypertension: diastolic blood pressure ≥ 90 mmHg on 2 occasions at least 6 hours apart, diagnosed before 20 weeks of gestation. Women with singleton or multiple pregnancies are eligible, independent of the position of the fetus (i.e. cephalic or breech). Neither diabetes mellitus, nor small‐for‐gestational age nor a history of caesarean section are exclusion criteria. Exclusion criteria: diastolic blood pressure ≥ 110 mmHg despite medication, systolic blood pressure ≥ 170 mmHg despite medication, proteinuria ≥ 5 g per 24 hours, eclampsia, HELLP syndrome, pulmonary oedema or cyanosis, oliguria < 500 mL in 24 hours, renal disease, heart disease, HIV‐positive, non‐reassuring fetal heart rate, absent flow or reversed flow in the umbilical artery, fetal abnormalities including an abnormal karyotype, ruptured membranes and severe pre‐eclamptic complaints such as frontal headaches | |
| Interventions | Experimental intervention: planned early delivery with an induction of labour started within 24 hours after randomisation If vaginal delivery was not contraindicated and the cervix was considered favourable an amniotomy was performed and augmentation with oxytocin was used if indicated. In cases of unfavourable cervix, induction was preceded with cervical ripening according to the local protocol. Prostaglandins were not administered to women with a history of caesarean section and in these cases a Foley catheter, followed by amniotomy and oxytocin were used instead Where vaginal delivery is contraindicated (e.g. breech presentation or a history of 2 caesarean sections) the woman will be delivered by caesarean section within 24 hours after randomisation. 353 women randomised (1 woman subsequently withdrew) Control/Comparison intervention: expectant monitoring until 37 weeks of GA. Monitored until the onset of spontaneous delivery. If labour had not started at 37 + 0 weeks, labour was induced. Monitoring consisted of the mother’s assessment of fetal movements, electronic fetal heart rate monitoring at least twice a week and maternal blood pressure measurement and screening of urine for protein. Intervention was recommended if the fetal or maternal condition did not justify expectant monitoring any more, similar to the exclusion criteria of the trial. 351 women randomised | |
| Outcomes | Composite adverse maternal outcome (eclampsia, HELLP syndrome, pulmonary oedema, thromboembolic disease, placental abruption, and/or maternal death), neonatal morbidity, neonatal death | |
| Funding source | This trial was funded by ZonMw, The Netherlands Organisation for Health Research and Development, programme Doelmatigheidsonderzoek (Health Care Efficiency Research, grant 171102012). | |
| Declarations of interest | No conflicts of interests declared. | |
| Notes | Registered with the Netherlands Trial Register (NTR1792) HW emailed Dr Koopmans on 6/8/15 to ask if the composite infant outcome by gestation at randomisation is available | |
| Risk of bias | ||
| Bias | Authors' judgement | Support for judgement |
| Random sequence generation (selection bias) | Low risk | Randomisation was done with a web‐based system by random permuted blocks with variable block size (range 2 ‐ 4), stratified by centre |
| Allocation concealment (selection bias) | Low risk | Central allocation of women concealed allocation |
| Blinding of participants and personnel (performance bias) | High risk | Open‐label study: “it is impossible to blind the healthcare workers and patients involved for the strategy to which the woman is allocated” |
| Blinding of outcome assessment (detection bias) | High risk | Outcome assessment does not appear to have been blinded. Data were entered into a web‐based case report form, coded to ensure confidentiality |
| Incomplete outcome data (attrition bias) | Low risk | All women are accounted for. 1 woman withdrew after being randomised to planned early delivery. Analysis was by intention‐to‐treat in Broekhuijsen 2014, but not in Broekhuijsen 2015. A subset of 200 women received quality‐of‐life questionnaires. The results of this subset of women are not included in this review |
| Selective reporting (reporting bias) | Low risk | All outcomes that were prespecified in the protocol were reported |
| Other bias | Low risk | The baseline characteristics of women randomly assigned to planned delivery and expectant monitoring appear to be similar. “When compared with randomly assigned women, women who declined to be randomly assigned more often finished higher education, were more often non‐smokers, were more often nulliparous, and had a lower GA. Otherwise, baseline characteristics were much the same in randomly assigned and not randomly assigned women”. This may affect the generalisability of the results of this study, but is not a source of bias per se |
| Methods | 2‐arm randomised controlled trial. | |
| Participants | Setting: Saudi Arabia and Egypt. Maternity‐Children Hospital, Al‐Qassim region, Saudi Arabia and Women’s Health Center, Assiut University, Egypt. April 2012 ‐ October 2013 Inclusion criteria: women with a singleton pregnancy with mild to moderate essential chronic hypertension without proteinuria. GA at recruitment 24 ‐ 36 weeks. Diastolic blood pressure between 90 and 110 mmHg and/or systolic pressure between 140 and 160 mmHg on 2 occasions at least 6 hours apart in the first half of pregnancy or if the woman was known to be hypertensive before pregnancy Exclusion criteria: severe chronic hypertension (blood pressure ≥ 160/110 mmHg); gestational hypertension; new onset pre‐eclampsia in a previously normotensive woman; secondary hypertension (excluded by examination and relevant investigations such as kidney function tests, urine analysis, abdominal ultrasound, renal artery Doppler, urinary catecholamine, and autoimmune serologic profile); target organ damage excluded by opthalmological fundus examination, and renal and cardiac assessment; and medical or obstetric risk factors such as malpresentation at recruitment, placenta previa, uterine scar, fetal anomalies, or pregestational diabetes mellitus | |
| Interventions | Experimental intervention: delivery at 37 completed weeks, provided that no maternal or fetal complications demanded elective preterm labour. If the Bishop score was > 8, labour was induced by oxytocin infusion and amniotomy. If the Bishop score was 8 or less, cervical ripening was induced by vaginal misoprostol at a dose of 50 µg every 6 hours up to a maximum of 200 µg, followed by an oxytocin infusion and amniotomy Women continued any antihypertensive drugs that they used before recruitment, and the dose was monitored to achieve control of blood pressure. 38 women were randomised Control/Comparison intervention: expectant management until the spontaneous onset of labour or 41 gestational weeks Monitored as outpatients for blood pressure measurement with dipstick screening for proteinuria 2 ‐ 3 times per week. Hospitalised during the initial evaluation and if maternal or fetal complications developed. Women continued any antihypertensive drugs that they used before recruitment, and the dose was monitored to achieve control of blood pressure. 38 women were randomised | |
| Outcomes | Superimposed pre‐eclampsia, severe hypertension, preterm delivery, placental abruption, oligohydramnios, intrauterine growth restriction, perinatal mortality, GA at delivery, birthweight, caesarean section, neonatal intensive care unit admission | |
| Funding source | The authors acknowledge the Deanship of Scientific Research in Qassim University for financial support for this work through an official grant (research number 1681/1433‐1434). | |
| Declarations of interest | No conflicts of interests declared. | |
| Notes | ||
| Risk of bias | ||
| Bias | Authors' judgement | Support for judgement |
| Random sequence generation (selection bias) | Low risk | Eligible women were randomised by a computer‐generated table, and allocated by 1:1 ratio to group A or group B |
| Allocation concealment (selection bias) | Unclear risk | No description of allocation concealment |
| Blinding of participants and personnel (performance bias) | High risk | Blinding of participants and personnel was not possible. This may have had an effect on other treatment decisions |
| Blinding of outcome assessment (detection bias) | High risk | Outcome assessment does not appear to have been blinded |
| Incomplete outcome data (attrition bias) | Low risk | No loss to follow‐up reported on flow diagram |
| Selective reporting (reporting bias) | Unclear risk | Reporting appeared to be good; however no protocol was available to assess whether all prespecified outcomes were reported |
| Other bias | Low risk | The groups appear to be comparable at baseline |
| Methods | 2‐arm multicentre randomised controlled trial | |
| Participants | Setting: 38 hospitals (6 academic and 32 non‐academic) in Netherlands between October 2005 and March 2008 Inclusion criteria: women with a singleton pregnancy at 36 (0 days) ‐ 41 weeks (0 days) gestation who had gestational hypertension or mild pre‐eclampsia. Gestational hypertension was defined as diastolic blood pressure of 95 mmHg or higher measured on 2 occasions at least 6 hours apart. Mild pre‐eclampsia was defined as diastolic blood pressure of 90 mmHg or higher measured on 2 occasions at least 6 hours apart, combined with proteinuria (2 or more occurrences of protein on a dipstick, > 300 mg total protein within a 24‐hour urine collection, or ratio of protein to creatinine > 30 mg/mmol) Exclusion criteria: severe gestational hypertension or severe pre‐eclampsia, defined as systolic blood pressure of 170 mmHg or higher, diastolic blood pressure of 110 mmHg or higher, or proteinuria of 5 g or higher per 24 hours. Other exclusion criteria: pre‐existing hypertension treated with antihypertensive drugs, diabetes mellitus, gestational diabetes needing insulin treatment, renal disease, heart disease, previous caesarean section, HELLP syndrome, oliguria of less than 500 mL per 24 hours, pulmonary oedema or cyanosis, HIV seropositivity, use of intravenous antihypertensive drugs, fetal anomalies, suspected intrauterine growth restriction, abnormalities detected during fetal‐heart‐rate monitoring, non‐vertex position | |
| Interventions | Experimental intervention: induction of labour within 24 hours of randomisation. If the Bishop score was > 6, labour was induced with amniotomy and if needed augmentation with oxytocin. If the Bishop score was ≤ 6, cervical ripening was stimulated with intracervical or intravaginal prostaglandins or a balloon catheter. Use of oxytocin or prostaglandins depended on local protocols. 377 women randomised. Control/Comparison intervention: expectant monitoring. They were monitored until the onset of spontaneous delivery, in hospital or outpatient setting, depending on the condition of the woman with frequent blood pressure measurements and testing of urine for protein of the mother. Fetal monitoring included movements as reported by the mother, electronic fetal‐heart‐rate monitoring and ultrasound examination. Induction of labour was recommended if the systolic blood pressure was 170 mmHG or higher or if the diastolic blood pressure was 110 mmHg or higher, if there was proteinuria of 5 g or higher per 24 hours, if eclampsia developed, if HELLP syndrome was present, if there was suspected fetal distress, if prelabour rupture of membranes lasting more than 48 hours occurred, if there was meconium‐stained amniotic fluid, or a fetus with GA beyond 41 weeks. 379 women randomised. | |
| Outcomes | Composite of poor maternal outcome which included maternal mortality, maternal morbidity (eclampsia, HELLP syndrome, pulmonary oedema, thromboembolic disease, and placental abruption), progression to severe hypertension or proteinuria and a major postpartum haemorrhage (> 1000 mL blood loss) | |
| Funding source | This trial was funded by ZonMw, the Netherlands organisation for health research and development, programme Doelmatigheidsonderzoek (grant number 945‐06‐553). | |
| Declarations of interest | No conflicts of interests declared. | |
| Notes | HW emailed Dr Koopmans on 6/8/15 to ask if the mean and standard deviation are available for continuous variables (e.g. duration of hospital stay after delivery, economic outcomes), reported in publications as median and IQR. Also, whether health‐related quality of life measures are available in a form that could be used in the review | |
| Risk of bias | ||
| Bias | Authors' judgement | Support for judgement |
| Random sequence generation (selection bias) | Low risk | Good random sequence generation. Block randomisation with a variable block size of 2 ‐ 8. Web‐based application used to stratify for centre, parity, and hypertensive‐related disease (gestational hypertension or pre‐eclampsia). Women were randomly allocated in a 1:1 ratio to receive either induction of labour or expectant monitoring |
| Allocation concealment (selection bias) | Low risk | Central allocation using a web‐based application. |
| Blinding of participants and personnel (performance bias) | High risk | “in this open‐label trial, masking of participants, obstetricians and outcome assessors was not possible for allocation of the randomisation number or intervention.” |
| Blinding of outcome assessment (detection bias) | High risk | “in this open‐label trial, masking of participants, obstetricians and outcome assessors was not possible for allocation of the randomisation number or intervention.” |
| Incomplete outcome data (attrition bias) | Low risk | The analysis was by intention‐to‐treat. Data are reported for all randomised women. Fewer women participated in the quality of life study (questionnaires were not available for 217 women. 48/539 did not respond to the questionnaire, giving a 91% response rate) |
| Selective reporting (reporting bias) | Low risk | All outcomes that were prespecified in the protocol were reported |
| Other bias | Low risk | The groups appear to be comparable at baseline. The report states that the funder "had no role in study design, data collection, data analysis, data interpretation, writing of the report, or the decision to submit the paper for publication" |
| Methods | 2‐arm randomised controlled trial. | |
| Participants | Setting: May 2011 to April 2012 in Government Medical College, Kolkata, India Inclusion criteria: pregnant women at 36 ‐ 40 weeks' gestation, with mild pre‐eclampsia/gestational hypertension without proteinuria. A diagnosis of gestational hypertension was made if systolic blood pressure ≥ 140 or diastolic blood pressure ≥ 90 mmHg for the first time during pregnancy without proteinuria. A diagnosis of mild pre‐eclampsia was made if systolic blood pressure was 140 ‐ 159 mmHg and diastolic blood pressure is 90 ‐ 109 mmHg accompanied by proteinuria of > 0.3 g to < 5 g/24 hours. Exclusion criteria: not described | |
| Interventions | Experimental intervention: induction of labour (no further information) Control/Comparison intervention: expectant management (no further information) 100 women were randomised. The number of women in each group is not stated, so we assume it was 50, as women were randomised in a 1:1 manner | |
| Outcomes | Maternal: severe hypertension, severe proteinuria, eclampsia, placental abruption, HELLP syndrome, disseminated intravascular coagulation, postpartum haemorrhage, retinal haemorrhage, pulmonary oedema. Caesarean section. Admission to delivery interval. Hospital stay. | |
| Funding source | No information given ‐ abstract only. | |
| Declarations of interest | No information given ‐ abstract only. | |
| Notes | This trial report was in abstract form only (which could explain the paucity of detail). HW emailed Professor Singh on 30/4/15 and 5/8/15, asking: How many women were recruited to each group? Please would you describe the process of randomisation and group allocation. Would you be able to provide data on any of the following outcomes (review outcomes listed). No reply received at present. | |
| Risk of bias | ||
| Bias | Authors' judgement | Support for judgement |
| Random sequence generation (selection bias) | Unclear risk | States that women were “randomized in 1:1 manner”, but no information on the method |
| Allocation concealment (selection bias) | Unclear risk | No description |
| Blinding of participants and personnel (performance bias) | High risk | It was not possible to blind participants and personnel to whether they had been assigned to induction of labour or expectant management |
| Blinding of outcome assessment (detection bias) | High risk | No blinding of outcome assessment mentioned |
| Incomplete outcome data (attrition bias) | Unclear risk | The number of women allocated to each group is not reported, so it is not possible to assess whether data for all women have been reported |
| Selective reporting (reporting bias) | High risk | Only outcomes with significant differences between groups were reported |
| Other bias | Low risk | The report states that the groups were comparable at baseline |
| Methods | 2‐arm randomised control trial. | |
| Participants | Setting: women admitted to The Wiser Hospital for Women and Infants at the University of Mississippi Medical Center (UMMC) from March 2002 to June 2009 Inclusion criteria: pregnant women with mild pre‐eclampsia, 34 ‐ 37 weeks (with estimated fetal weight > 2000 g), no other maternal‐fetal‐pregnancy complications. (ACOG 2002 criteria for mild pre‐eclampsia.) No maternal or fetal contraindications to conservative management. Age 18 ‐ 50. Exclusion criteria: non‐gestational diabetes, chronic hypertension, severe pre‐eclampsia, non‐reassuring fetal assessment intrauterine growth restriction fetal anomalies, multiple gestation, premature preterm rupture of membranes, placenta previa, unexplained vaginal bleeding, antihypertensive use, current gestation poor dating, contraindication to conservative management, active labour at admission | |
| Interventions | Experimental intervention: planned early delivery via induction of labour or caesarean delivery within 12 hours of randomisation All study participants were treated with magnesium sulphate prophylaxis intrapartum and immediately postpartum 97 women were randomised, 3 were subsequently excluded for not meeting the inclusion criteria Control/Comparison intervention: inpatient expectant management, to 37 weeks' gestation unless there was spontaneous onset of labour or rupture of membranes, suspected placental abruption, development of severe PE of fetal compromise. All study participants were treated with magnesium sulphate prophylaxis intrapartum and immediately postpartum 86 women were randomised (11 were subsequently excluded for not meeting the inclusion criteria (7), voluntarily withdrawing from the study (1), and leaving the hospital (3)) | |
| Outcomes | Primary: maternal morbidity, mortality, and development of severe pre‐eclampsia. Secondary: major neonatal morbidities and mortality | |
| Funding source | Funded by Division of Maternal‐fetal Medicine in the Department of Obstetrics and Gynaecology, University of Mississippi Medical Centre. | |
| Declarations of interest | No conflicts of interests declared. | |
| Notes | ClinicalTrials.gov: NCT00789919 HW emailed Professor Owens on 11/8/15, asking how the random sequence was generated, if composite maternal and infant outcomes were available, and for duration of infant stay after delivery. No response was received | |
| Risk of bias | ||
| Bias | Authors' judgement | Support for judgement |
| Random sequence generation (selection bias) | Unclear risk | Randomised using stratified and random permuted blocks of 2 in consecutively numbered opaque envelopes. However, the sequence generation was not described |
| Allocation concealment (selection bias) | Low risk | Opaque envelopes concealed allocation |
| Blinding of participants and personnel (performance bias) | High risk | It was not possible to blind participants and personnel to whether they had been assigned to induction of labour or expectant management |
| Blinding of outcome assessment (detection bias) | High risk | No blinding of outcome assessment mentioned |
| Incomplete outcome data (attrition bias) | Unclear risk | The analysis was not intention‐to‐treat. 3 (out of 97) participants left the planned early delivery group, and 11 (out of 86) left the expectant management group, and were excluded from the analyses |
| Selective reporting (reporting bias) | Low risk | The outcomes prespecified in the protocol were reported |
| Other bias | Unclear risk | The study was stopped early, at 74% of the enrolment target, when hospital policy changed to discourage inpatient hospitalisation for "uncomplicated mild preterm preeclampsia”. This left the study underpowered to demonstrate statistically significant differences |
GA gestational age
HELLP: haemolysis, elevated liver enzymes and low platelet count
IQR: interquartile range
PE: pre‐eclampsia
Characteristics of excluded studies [ordered by study ID]
| Study | Reason for exclusion |
| Not a randomised controlled trial. No randomisation. Group allocation based on gestational age at presentation | |
| Comparing planned early delivery by caesarean section with planned early delivery by induction with vaginal misoprostol |
Characteristics of ongoing studies [ordered by study ID]
| Trial name or title | PHOENIX ‐ Pre‐eclampsia in HOspital: Early iNductIon or eXpectant management |
| Methods | 2‐arm trial. “randomly allocated”, no description of method of randomisation in trial registration |
| Participants | Pregnant women with pre‐eclampsia between 34 and 37 weeks of gestation |
| Interventions | Experimental intervention: planned early birth. Induced within 48 hours of group allocation. Control/Comparison intervention: monitored in hospital. Inpatient until 37 weeks then induced |
| Outcomes | Maternal morbidity, perinatal mortality, neurodevelopmental assessment at age 2 |
| Starting date | April 2014. Anticipated to take approximately 3 years to recruit 900 women |
| Contact information | Professor Andrew Shennan ([email protected]) |
| Notes | ISRCTN01879376 |
Data and analyses
| Outcome or subgroup title | No. of studies | No. of participants | Statistical method | Effect size |
| 1 Composite maternal mortality and morbidity Show forest plot | 2 | 1459 | Risk Ratio (M‐H, Fixed, 95% CI) | 0.69 [0.57, 0.83] |
| Analysis 1.1 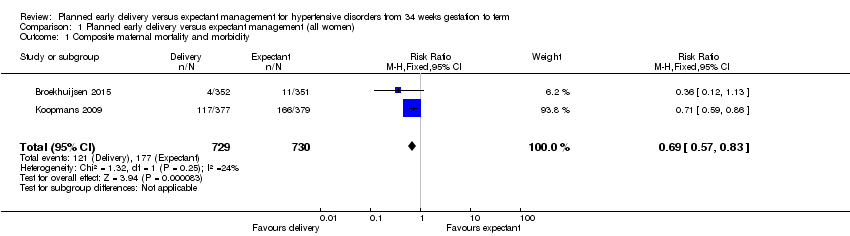 Comparison 1 Planned early delivery versus expectant management (all women), Outcome 1 Composite maternal mortality and morbidity. | ||||
| 2 Composite infant mortality and morbidity Show forest plot | 2 | Risk Ratio (M‐H, Random, 95% CI) | Subtotals only | |
| Analysis 1.2  Comparison 1 Planned early delivery versus expectant management (all women), Outcome 2 Composite infant mortality and morbidity. | ||||
| 3 Maternal mortality Show forest plot | 2 | 1457 | Risk Ratio (M‐H, Fixed, 95% CI) | 0.0 [0.0, 0.0] |
| Analysis 1.3  Comparison 1 Planned early delivery versus expectant management (all women), Outcome 3 Maternal mortality. | ||||
| 4 Eclampsia Show forest plot | 2 | 1459 | Risk Ratio (M‐H, Fixed, 95% CI) | 0.20 [0.01, 4.14] |
| Analysis 1.4  Comparison 1 Planned early delivery versus expectant management (all women), Outcome 4 Eclampsia. | ||||
| 5 Pulmonary oedema Show forest plot | 2 | 1459 | Risk Ratio (M‐H, Fixed, 95% CI) | 0.20 [0.01, 4.17] |
| Analysis 1.5  Comparison 1 Planned early delivery versus expectant management (all women), Outcome 5 Pulmonary oedema. | ||||
| 6 Severe renal impairment Show forest plot | 1 | 100 | Risk Ratio (M‐H, Fixed, 95% CI) | 0.36 [0.14, 0.92] |
| Analysis 1.6  Comparison 1 Planned early delivery versus expectant management (all women), Outcome 6 Severe renal impairment. | ||||
| 7 HELLP syndrome Show forest plot | 3 | 1628 | Risk Ratio (M‐H, Fixed, 95% CI) | 0.40 [0.17, 0.93] |
| Analysis 1.7  Comparison 1 Planned early delivery versus expectant management (all women), Outcome 7 HELLP syndrome. | ||||
| 8 Thromboembolic disease Show forest plot | 2 | 1459 | Risk Ratio (M‐H, Fixed, 95% CI) | 1.67 [0.22, 12.58] |
| Analysis 1.8  Comparison 1 Planned early delivery versus expectant management (all women), Outcome 8 Thromboembolic disease. | ||||
| 9 Abruptio placentae Show forest plot | 3 | 1535 | Risk Ratio (M‐H, Fixed, 95% CI) | 0.64 [0.17, 2.34] |
| Analysis 1.9  Comparison 1 Planned early delivery versus expectant management (all women), Outcome 9 Abruptio placentae. | ||||
| 10 Postpartum haemorrhage Show forest plot | 1 | 741 | Risk Ratio (M‐H, Fixed, 95% CI) | 0.88 [0.57, 1.35] |
| Analysis 1.10 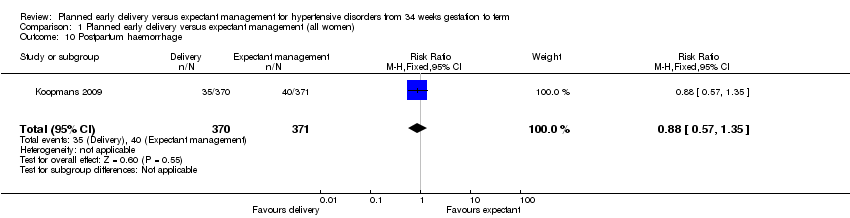 Comparison 1 Planned early delivery versus expectant management (all women), Outcome 10 Postpartum haemorrhage. | ||||
| 11 Severe hypertension Show forest plot | 3 | Risk Ratio (M‐H, Random, 95% CI) | Subtotals only | |
| Analysis 1.11  Comparison 1 Planned early delivery versus expectant management (all women), Outcome 11 Severe hypertension. | ||||
| 12 Caesarean section Show forest plot | 4 | 1728 | Risk Ratio (M‐H, Fixed, 95% CI) | 0.91 [0.78, 1.07] |
| Analysis 1.12  Comparison 1 Planned early delivery versus expectant management (all women), Outcome 12 Caesarean section. | ||||
| 13 Assisted delivery (ventouse/forceps) Show forest plot | 2 | 1459 | Risk Ratio (M‐H, Fixed, 95% CI) | 0.93 [0.70, 1.24] |
| Analysis 1.13  Comparison 1 Planned early delivery versus expectant management (all women), Outcome 13 Assisted delivery (ventouse/forceps). | ||||
| 14 Maternal morbidity of caesarean section Show forest plot | 1 | 756 | Risk Ratio (M‐H, Fixed, 95% CI) | 0.75 [0.17, 3.35] |
| Analysis 1.14  Comparison 1 Planned early delivery versus expectant management (all women), Outcome 14 Maternal morbidity of caesarean section. | ||||
| 14.1 Endometritis | 1 | 756 | Risk Ratio (M‐H, Fixed, 95% CI) | 0.75 [0.17, 3.35] |
| 15 Maternal morbidity related to induction of labour Show forest plot | 1 | 756 | Risk Ratio (M‐H, Fixed, 95% CI) | 0.0 [0.0, 0.0] |
| Analysis 1.15 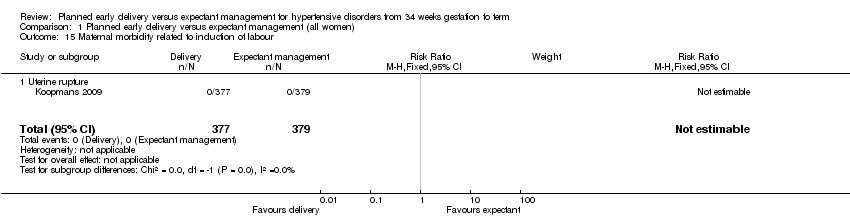 Comparison 1 Planned early delivery versus expectant management (all women), Outcome 15 Maternal morbidity related to induction of labour. | ||||
| 15.1 Uterine rupture | 1 | 756 | Risk Ratio (M‐H, Fixed, 95% CI) | 0.0 [0.0, 0.0] |
| 16 Admission to a high care or intensive care unit Show forest plot | 1 | 708 | Risk Ratio (M‐H, Fixed, 95% CI) | 0.41 [0.16, 1.07] |
| Analysis 1.16  Comparison 1 Planned early delivery versus expectant management (all women), Outcome 16 Admission to a high care or intensive care unit. | ||||
| 17 Fetal death Show forest plot | 1 | 756 | Risk Ratio (M‐H, Fixed, 95% CI) | 0.0 [0.0, 0.0] |
| Analysis 1.17  Comparison 1 Planned early delivery versus expectant management (all women), Outcome 17 Fetal death. | ||||
| 18 Neonatal death Show forest plot | 3 | 1535 | Risk Ratio (M‐H, Fixed, 95% CI) | 2.0 [0.19, 21.14] |
| Analysis 1.18 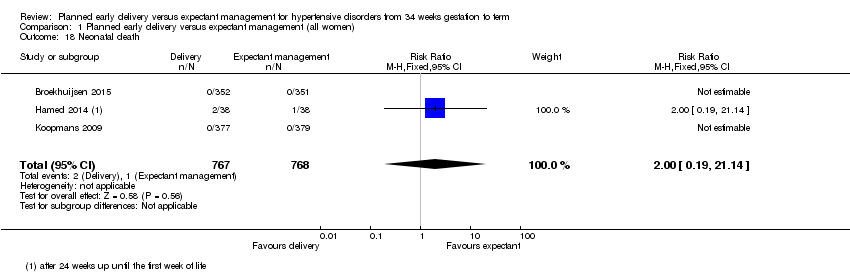 Comparison 1 Planned early delivery versus expectant management (all women), Outcome 18 Neonatal death. | ||||
| 19 Grade III or IV intraventricular or intracerebral haemorrhage Show forest plot | 1 | 674 | Risk Ratio (M‐H, Fixed, 95% CI) | 6.92 [0.36, 133.41] |
| Analysis 1.19  Comparison 1 Planned early delivery versus expectant management (all women), Outcome 19 Grade III or IV intraventricular or intracerebral haemorrhage. | ||||
| 20 Nectrotising enterocolitis Show forest plot | 2 | 1338 | Risk Ratio (M‐H, Fixed, 95% CI) | 0.98 [0.14, 6.89] |
| Analysis 1.20  Comparison 1 Planned early delivery versus expectant management (all women), Outcome 20 Nectrotising enterocolitis. | ||||
| 21 Respiratory distress syndrome Show forest plot | 3 | 1511 | Risk Ratio (M‐H, Fixed, 95% CI) | 2.24 [1.20, 4.18] |
| Analysis 1.21  Comparison 1 Planned early delivery versus expectant management (all women), Outcome 21 Respiratory distress syndrome. | ||||
| 22 Small‐for‐gestational age Show forest plot | 3 | 1001 | Risk Ratio (M‐H, Fixed, 95% CI) | 1.58 [0.89, 2.79] |
| Analysis 1.22  Comparison 1 Planned early delivery versus expectant management (all women), Outcome 22 Small‐for‐gestational age. | ||||
| 23 Neonatal seizures Show forest plot | 1 | 699 | Risk Ratio (M‐H, Fixed, 95% CI) | 3.97 [0.45, 35.30] |
| Analysis 1.23  Comparison 1 Planned early delivery versus expectant management (all women), Outcome 23 Neonatal seizures. | ||||
| 24 Apgar score less than seven at five minutes Show forest plot | 2 | 1454 | Risk Ratio (M‐H, Fixed, 95% CI) | 1.11 [0.60, 2.05] |
| Analysis 1.24 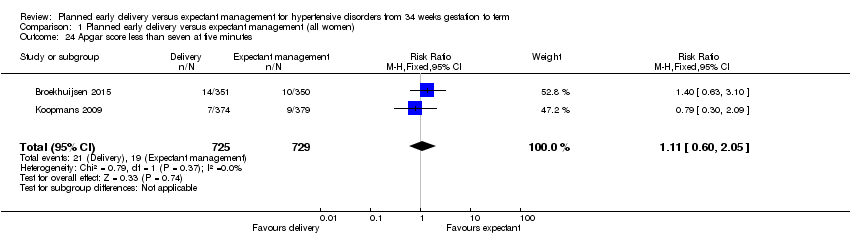 Comparison 1 Planned early delivery versus expectant management (all women), Outcome 24 Apgar score less than seven at five minutes. | ||||
| 25 Cord blood pH less than 7.1 or as defined by trial authors Show forest plot | 2 | 1145 | Risk Ratio (M‐H, Fixed, 95% CI) | 0.58 [0.31, 1.09] |
| Analysis 1.25  Comparison 1 Planned early delivery versus expectant management (all women), Outcome 25 Cord blood pH less than 7.1 or as defined by trial authors. | ||||
| 26 Surfactant use Show forest plot | 1 | 639 | Risk Ratio (M‐H, Fixed, 95% CI) | 0.0 [0.0, 0.0] |
| Analysis 1.26 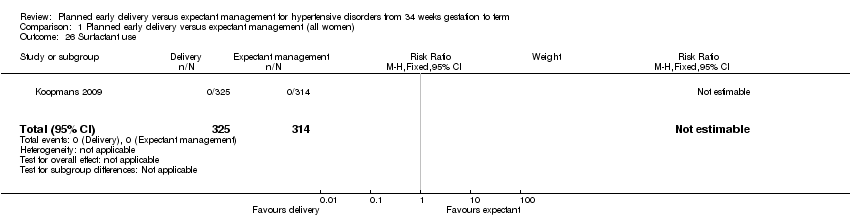 Comparison 1 Planned early delivery versus expectant management (all women), Outcome 26 Surfactant use. | ||||
| 27 Neonatal intensive care unit or high care unit admission Show forest plot | 4 | 1585 | Risk Ratio (M‐H, Fixed, 95% CI) | 1.65 [1.13, 2.40] |
| Analysis 1.27  Comparison 1 Planned early delivery versus expectant management (all women), Outcome 27 Neonatal intensive care unit or high care unit admission. | ||||
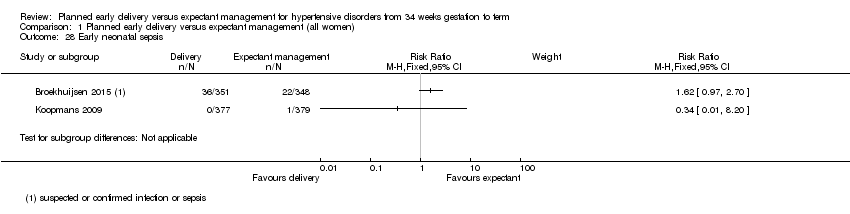
| 28 Early neonatal sepsis Show forest plot | 2 | Risk Ratio (M‐H, Fixed, 95% CI) | Subtotals only | |
| Analysis 1.28  Comparison 1 Planned early delivery versus expectant management (all women), Outcome 28 Early neonatal sepsis. | ||||
| 29 Duration of hospital stay after delivery for mother (days) Show forest plot | 2 | 925 | Mean Difference (IV, Fixed, 95% CI) | ‐0.16 [‐0.46, 0.15] |
| Analysis 1.29  Comparison 1 Planned early delivery versus expectant management (all women), Outcome 29 Duration of hospital stay after delivery for mother (days). | ||||
| 30 Duration of hospital stay after delivery for baby (days) Show forest plot | 1 | 756 | Mean Difference (IV, Fixed, 95% CI) | ‐0.20 [‐0.57, 0.17] |
| Analysis 1.30  Comparison 1 Planned early delivery versus expectant management (all women), Outcome 30 Duration of hospital stay after delivery for baby (days). | ||||
| Outcome or subgroup title | No. of studies | No. of participants | Statistical method | Effect size |
| 1 Composite maternal mortality and morbidity Show forest plot | 2 | 1459 | Risk Ratio (M‐H, Fixed, 95% CI) | 0.68 [0.57, 0.83] |
| Analysis 2.1  Comparison 2 Planned early delivery versus expectant management (by gestational age), Outcome 1 Composite maternal mortality and morbidity. | ||||
| 1.1 34 + 0 to 36 + 6 weeks GA at randomisation | 2 | 778 | Risk Ratio (M‐H, Fixed, 95% CI) | 0.77 [0.48, 1.24] |
| 1.2 37 + 0 to 38 + 6 weeks GA at randomisation | 1 | 380 | Risk Ratio (M‐H, Fixed, 95% CI) | 0.69 [0.53, 0.90] |
| 1.3 39 + 0 to 41 + 0 weeks GA at randomisation | 1 | 301 | Risk Ratio (M‐H, Fixed, 95% CI) | 0.64 [0.47, 0.88] |
| 2 Respiratory distress syndrome Show forest plot | 2 | 1459 | Risk Ratio (M‐H, Fixed, 95% CI) | 2.53 [1.16, 5.55] |
| Analysis 2.2  Comparison 2 Planned early delivery versus expectant management (by gestational age), Outcome 2 Respiratory distress syndrome. | ||||
| 2.1 34 + 0 to 36 + 6 weeks GA at randomisation | 2 | 778 | Risk Ratio (M‐H, Fixed, 95% CI) | 3.32 [1.35, 8.18] |
| 2.2 37 + 0 to 38 + 6 weeks GA at randomisation | 1 | 380 | Risk Ratio (M‐H, Fixed, 95% CI) | 0.32 [0.01, 7.72] |
| 2.3 39 + 0 to 41 + 0 weeks GA at randomisation | 1 | 301 | Risk Ratio (M‐H, Fixed, 95% CI) | 1.12 [0.07, 17.74] |
| 3 Composite infant mortality and morbidity Show forest plot | 1 | 756 | Risk Ratio (M‐H, Fixed, 95% CI) | 0.77 [0.46, 1.28] |
| Analysis 2.3  Comparison 2 Planned early delivery versus expectant management (by gestational age), Outcome 3 Composite infant mortality and morbidity. | ||||
| 3.1 36 + 0 to 36 + 6 weeks GA at randomisation | 1 | 75 | Risk Ratio (M‐H, Fixed, 95% CI) | 2.63 [0.29, 24.10] |
| 3.2 37 + 0 to 38 + 6 weeks GA at randomisation | 1 | 380 | Risk Ratio (M‐H, Fixed, 95% CI) | 0.68 [0.31, 1.49] |
| 3.3 39 + 0 to 41 + 0 weeks GA at randomisation | 1 | 301 | Risk Ratio (M‐H, Fixed, 95% CI) | 0.72 [0.35, 1.49] |
| Outcome or subgroup title | No. of studies | No. of participants | Statistical method | Effect size |
| 1 Composite maternal mortality and morbidity Show forest plot | 2 | 1459 | Risk Ratio (M‐H, Fixed, 95% CI) | 0.69 [0.57, 0.83] |
| Analysis 3.1  Comparison 3 Planned early delivery versus expectant management (by each gestational week), Outcome 1 Composite maternal mortality and morbidity. | ||||
| 1.1 34 + 0 to 34 + 6 weeks GA at randomisation | 1 | 154 | Risk Ratio (M‐H, Fixed, 95% CI) | 4.75 [0.23, 97.34] |
| 1.2 35 + 0 to 35 + 6 weeks GA at randomisation | 1 | 236 | Risk Ratio (M‐H, Fixed, 95% CI) | 0.14 [0.02, 1.10] |
| 1.3 36 + 0 to 36 + 6 weeks GA at randomisation | 2 | 388 | Risk Ratio (M‐H, Fixed, 95% CI) | 0.98 [0.59, 1.62] |
| 1.4 37 + 0 to 37 + 6 weeks GA at randomisation | 1 | 188 | Risk Ratio (M‐H, Fixed, 95% CI) | 0.75 [0.52, 1.08] |
| 1.5 38 + 0 to 38 + 6 weeks GA at randomisation | 1 | 192 | Risk Ratio (M‐H, Fixed, 95% CI) | 0.63 [0.43, 0.94] |
| 1.6 39 + 0 to 39 + 6 weeks GA at randomisation | 1 | 186 | Risk Ratio (M‐H, Fixed, 95% CI) | 0.78 [0.53, 1.14] |
| 1.7 40 + 0 to 41 + 0 weeks GA at randomisation | 1 | 115 | Risk Ratio (M‐H, Fixed, 95% CI) | 0.46 [0.26, 0.79] |
| 2 Respiratory distress syndrome Show forest plot | 1 | 703 | Risk Ratio (M‐H, Fixed, 95% CI) | 3.32 [1.38, 8.01] |
| Analysis 3.2  Comparison 3 Planned early delivery versus expectant management (by each gestational week), Outcome 2 Respiratory distress syndrome. | ||||
| 2.1 34 + 0 to 34 + 6 weeks GA at randomisation | 1 | 154 | Risk Ratio (M‐H, Fixed, 95% CI) | 2.37 [0.78, 7.24] |
| 2.2 35 + 0 to 35 + 6 weeks GA at randomisation | 1 | 236 | Risk Ratio (M‐H, Fixed, 95% CI) | 7.62 [0.93, 62.27] |
| 2.3 36 + 0 to 36 + 6 weeks GA at randomisation | 1 | 313 | Risk Ratio (M‐H, Fixed, 95% CI) | 3.41 [0.39, 30.15] |
| 3 Composite infant mortality and morbidity Show forest plot | 1 | 756 | Risk Ratio (M‐H, Fixed, 95% CI) | 0.77 [0.46, 1.29] |
| Analysis 3.3  Comparison 3 Planned early delivery versus expectant management (by each gestational week), Outcome 3 Composite infant mortality and morbidity. | ||||
| 3.1 36 + 0 to 36 + 6 weeks GA at randomisation | 1 | 75 | Risk Ratio (M‐H, Fixed, 95% CI) | 2.63 [0.29, 24.10] |
| 3.2 37 + 0 to 37 + 6 weeks GA at randomisation | 1 | 188 | Risk Ratio (M‐H, Fixed, 95% CI) | 0.48 [0.17, 1.35] |
| 3.3 38 + 0 to 38 + 6 weeks GA at randomisation | 1 | 192 | Risk Ratio (M‐H, Fixed, 95% CI) | 1.17 [0.33, 4.24] |
| 3.4 39 + 0 to 39 + 6 weeks GA at randomisation | 1 | 186 | Risk Ratio (M‐H, Fixed, 95% CI) | 0.79 [0.32, 1.95] |
| 3.5 40 + 0 to 41 + 0 weeks GA at randomisation | 1 | 115 | Risk Ratio (M‐H, Fixed, 95% CI) | 0.63 [0.19, 2.12] |
| Outcome or subgroup title | No. of studies | No. of participants | Statistical method | Effect size |
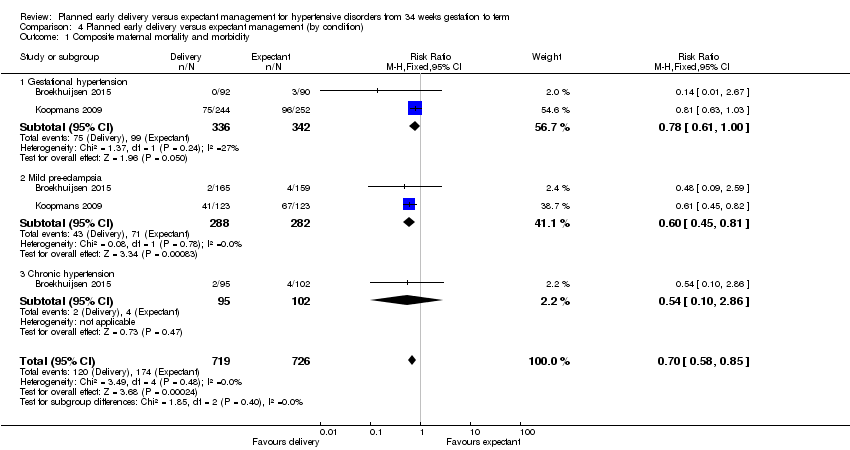
| 1 Composite maternal mortality and morbidity Show forest plot | 2 | 1445 | Risk Ratio (M‐H, Fixed, 95% CI) | 0.70 [0.58, 0.85] |
| Analysis 4.1  Comparison 4 Planned early delivery versus expectant management (by condition), Outcome 1 Composite maternal mortality and morbidity. | ||||
| 1.1 Gestational hypertension | 2 | 678 | Risk Ratio (M‐H, Fixed, 95% CI) | 0.78 [0.61, 1.00] |
| 1.2 Mild pre‐eclampsia | 2 | 570 | Risk Ratio (M‐H, Fixed, 95% CI) | 0.60 [0.45, 0.81] |
| 1.3 Chronic hypertension | 1 | 197 | Risk Ratio (M‐H, Fixed, 95% CI) | 0.54 [0.10, 2.86] |
| 2 Respiratory distress syndrome Show forest plot | 1 | 703 | Risk Ratio (M‐H, Fixed, 95% CI) | 3.36 [1.36, 8.31] |
| Analysis 4.2  Comparison 4 Planned early delivery versus expectant management (by condition), Outcome 2 Respiratory distress syndrome. | ||||
| 2.1 Gestational hypertension | 1 | 182 | Risk Ratio (M‐H, Fixed, 95% CI) | 3.91 [0.45, 34.34] |
| 2.2 Mild pre‐eclampsia | 1 | 324 | Risk Ratio (M‐H, Fixed, 95% CI) | 4.82 [1.07, 21.65] |
| 2.3 Chronic hypertension | 1 | 197 | Risk Ratio (M‐H, Fixed, 95% CI) | 2.15 [0.55, 8.35] |

Study flow diagram.

Risk of bias graph: review authors' judgements about each risk of bias item presented as percentages across all included studies.

Risk of bias summary: review authors' judgements about each risk of bias item for each included study.

Comparison 1 Planned early delivery versus expectant management (all women), Outcome 1 Composite maternal mortality and morbidity.

Comparison 1 Planned early delivery versus expectant management (all women), Outcome 2 Composite infant mortality and morbidity.

Comparison 1 Planned early delivery versus expectant management (all women), Outcome 3 Maternal mortality.

Comparison 1 Planned early delivery versus expectant management (all women), Outcome 4 Eclampsia.

Comparison 1 Planned early delivery versus expectant management (all women), Outcome 5 Pulmonary oedema.
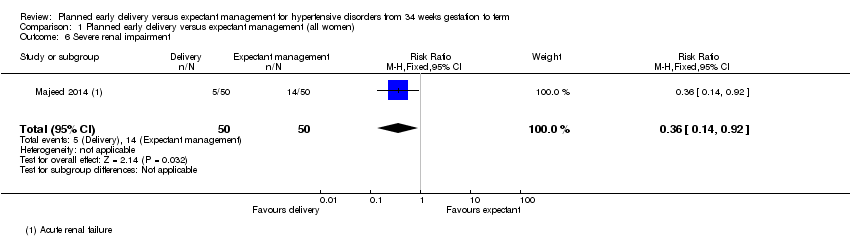
Comparison 1 Planned early delivery versus expectant management (all women), Outcome 6 Severe renal impairment.

Comparison 1 Planned early delivery versus expectant management (all women), Outcome 7 HELLP syndrome.
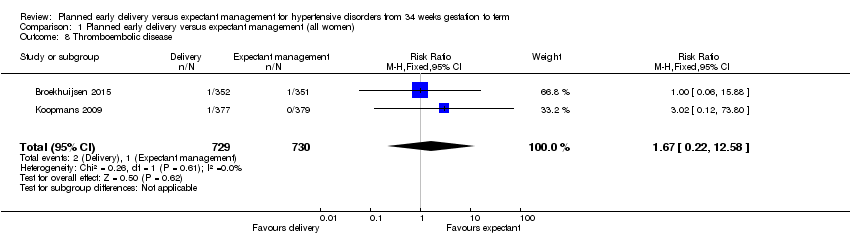
Comparison 1 Planned early delivery versus expectant management (all women), Outcome 8 Thromboembolic disease.

Comparison 1 Planned early delivery versus expectant management (all women), Outcome 9 Abruptio placentae.

Comparison 1 Planned early delivery versus expectant management (all women), Outcome 10 Postpartum haemorrhage.

Comparison 1 Planned early delivery versus expectant management (all women), Outcome 11 Severe hypertension.

Comparison 1 Planned early delivery versus expectant management (all women), Outcome 12 Caesarean section.

Comparison 1 Planned early delivery versus expectant management (all women), Outcome 13 Assisted delivery (ventouse/forceps).

Comparison 1 Planned early delivery versus expectant management (all women), Outcome 14 Maternal morbidity of caesarean section.

Comparison 1 Planned early delivery versus expectant management (all women), Outcome 15 Maternal morbidity related to induction of labour.

Comparison 1 Planned early delivery versus expectant management (all women), Outcome 16 Admission to a high care or intensive care unit.

Comparison 1 Planned early delivery versus expectant management (all women), Outcome 17 Fetal death.

Comparison 1 Planned early delivery versus expectant management (all women), Outcome 18 Neonatal death.

Comparison 1 Planned early delivery versus expectant management (all women), Outcome 19 Grade III or IV intraventricular or intracerebral haemorrhage.

Comparison 1 Planned early delivery versus expectant management (all women), Outcome 20 Nectrotising enterocolitis.

Comparison 1 Planned early delivery versus expectant management (all women), Outcome 21 Respiratory distress syndrome.

Comparison 1 Planned early delivery versus expectant management (all women), Outcome 22 Small‐for‐gestational age.

Comparison 1 Planned early delivery versus expectant management (all women), Outcome 23 Neonatal seizures.

Comparison 1 Planned early delivery versus expectant management (all women), Outcome 24 Apgar score less than seven at five minutes.

Comparison 1 Planned early delivery versus expectant management (all women), Outcome 25 Cord blood pH less than 7.1 or as defined by trial authors.

Comparison 1 Planned early delivery versus expectant management (all women), Outcome 26 Surfactant use.

Comparison 1 Planned early delivery versus expectant management (all women), Outcome 27 Neonatal intensive care unit or high care unit admission.
Comparison 1 Planned early delivery versus expectant management (all women), Outcome 28 Early neonatal sepsis.

Comparison 1 Planned early delivery versus expectant management (all women), Outcome 29 Duration of hospital stay after delivery for mother (days).

Comparison 1 Planned early delivery versus expectant management (all women), Outcome 30 Duration of hospital stay after delivery for baby (days).

Comparison 2 Planned early delivery versus expectant management (by gestational age), Outcome 1 Composite maternal mortality and morbidity.

Comparison 2 Planned early delivery versus expectant management (by gestational age), Outcome 2 Respiratory distress syndrome.

Comparison 2 Planned early delivery versus expectant management (by gestational age), Outcome 3 Composite infant mortality and morbidity.

Comparison 3 Planned early delivery versus expectant management (by each gestational week), Outcome 1 Composite maternal mortality and morbidity.

Comparison 3 Planned early delivery versus expectant management (by each gestational week), Outcome 2 Respiratory distress syndrome.

Comparison 3 Planned early delivery versus expectant management (by each gestational week), Outcome 3 Composite infant mortality and morbidity.
Comparison 4 Planned early delivery versus expectant management (by condition), Outcome 1 Composite maternal mortality and morbidity.

Comparison 4 Planned early delivery versus expectant management (by condition), Outcome 2 Respiratory distress syndrome.
| Planned early delivery versus expectant management for hypertensive disorders from 34 weeks' gestation to term | ||||||
| Patient or population: pregnant women with hypertensive disorders from 34 weeks' gestation to term | ||||||
| Outcomes | Anticipated absolute effects* (95% CI) | Relative effect | № of participants | Quality of the evidence | Comments | |
| Risk with placebo | Risk with GRADE | |||||
| Composite maternal mortality and morbidity | Study population | RR 0.69 | 1459 | ⊕⊕⊕⊕ | ||
| 242 per 1000 | 167 per 1000 | |||||
| Moderate | ||||||
| 235 per 1000 | 162 per 1000 | |||||
| Composite infant mortality and morbidity | not pooled | 1459 | This outcome was not pooled, due to substantial statistical heterogeneity (I2 = 87%, Tau2 = 0.98) | |||
| Caesarean section | Study population | RR 0.91 | 1728 | ⊕⊕⊕⊝ | ||
| 267 per 1000 | 243 per 1000 | |||||
| Moderate | ||||||
| 302 per 1000 | 275 per 1000 | |||||
| Duration of hospital stay after delivery for mother (days) | The mean duration of hospital stay after delivery for mother (days) was 0 | The mean duration of hospital stay after delivery for mother (days) in the intervention group was 0.16 fewer (0.46 fewer to 0.15 more) | ‐ | 925 | ⊕⊕⊕⊝ | |
| Duration of hospital stay after delivery for baby (days) | The mean duration of hospital stay after delivery for baby (days) was 0 | The mean duration of hospital stay after delivery for baby (days) in the intervention group was 0.2 days fewer (0.57 fewer to 0.17 more) | ‐ | 756 | ⊕⊕⊕⊝ | |
| *The risk in the intervention group (and its 95% confidence interval) is based on the assumed risk in the comparison group and the relative effect of the intervention (and its 95% CI). | ||||||
| GRADE Working Group grades of evidence | ||||||
| 1Wide confidence interval crossing the line of no effect. | ||||||
| Outcome or subgroup title | No. of studies | No. of participants | Statistical method | Effect size |
| 1 Composite maternal mortality and morbidity Show forest plot | 2 | 1459 | Risk Ratio (M‐H, Fixed, 95% CI) | 0.69 [0.57, 0.83] |
| 2 Composite infant mortality and morbidity Show forest plot | 2 | Risk Ratio (M‐H, Random, 95% CI) | Subtotals only | |
| 3 Maternal mortality Show forest plot | 2 | 1457 | Risk Ratio (M‐H, Fixed, 95% CI) | 0.0 [0.0, 0.0] |
| 4 Eclampsia Show forest plot | 2 | 1459 | Risk Ratio (M‐H, Fixed, 95% CI) | 0.20 [0.01, 4.14] |
| 5 Pulmonary oedema Show forest plot | 2 | 1459 | Risk Ratio (M‐H, Fixed, 95% CI) | 0.20 [0.01, 4.17] |
| 6 Severe renal impairment Show forest plot | 1 | 100 | Risk Ratio (M‐H, Fixed, 95% CI) | 0.36 [0.14, 0.92] |
| 7 HELLP syndrome Show forest plot | 3 | 1628 | Risk Ratio (M‐H, Fixed, 95% CI) | 0.40 [0.17, 0.93] |
| 8 Thromboembolic disease Show forest plot | 2 | 1459 | Risk Ratio (M‐H, Fixed, 95% CI) | 1.67 [0.22, 12.58] |
| 9 Abruptio placentae Show forest plot | 3 | 1535 | Risk Ratio (M‐H, Fixed, 95% CI) | 0.64 [0.17, 2.34] |
| 10 Postpartum haemorrhage Show forest plot | 1 | 741 | Risk Ratio (M‐H, Fixed, 95% CI) | 0.88 [0.57, 1.35] |
| 11 Severe hypertension Show forest plot | 3 | Risk Ratio (M‐H, Random, 95% CI) | Subtotals only | |
| 12 Caesarean section Show forest plot | 4 | 1728 | Risk Ratio (M‐H, Fixed, 95% CI) | 0.91 [0.78, 1.07] |
| 13 Assisted delivery (ventouse/forceps) Show forest plot | 2 | 1459 | Risk Ratio (M‐H, Fixed, 95% CI) | 0.93 [0.70, 1.24] |
| 14 Maternal morbidity of caesarean section Show forest plot | 1 | 756 | Risk Ratio (M‐H, Fixed, 95% CI) | 0.75 [0.17, 3.35] |
| 14.1 Endometritis | 1 | 756 | Risk Ratio (M‐H, Fixed, 95% CI) | 0.75 [0.17, 3.35] |
| 15 Maternal morbidity related to induction of labour Show forest plot | 1 | 756 | Risk Ratio (M‐H, Fixed, 95% CI) | 0.0 [0.0, 0.0] |
| 15.1 Uterine rupture | 1 | 756 | Risk Ratio (M‐H, Fixed, 95% CI) | 0.0 [0.0, 0.0] |
| 16 Admission to a high care or intensive care unit Show forest plot | 1 | 708 | Risk Ratio (M‐H, Fixed, 95% CI) | 0.41 [0.16, 1.07] |
| 17 Fetal death Show forest plot | 1 | 756 | Risk Ratio (M‐H, Fixed, 95% CI) | 0.0 [0.0, 0.0] |
| 18 Neonatal death Show forest plot | 3 | 1535 | Risk Ratio (M‐H, Fixed, 95% CI) | 2.0 [0.19, 21.14] |
| 19 Grade III or IV intraventricular or intracerebral haemorrhage Show forest plot | 1 | 674 | Risk Ratio (M‐H, Fixed, 95% CI) | 6.92 [0.36, 133.41] |
| 20 Nectrotising enterocolitis Show forest plot | 2 | 1338 | Risk Ratio (M‐H, Fixed, 95% CI) | 0.98 [0.14, 6.89] |
| 21 Respiratory distress syndrome Show forest plot | 3 | 1511 | Risk Ratio (M‐H, Fixed, 95% CI) | 2.24 [1.20, 4.18] |
| 22 Small‐for‐gestational age Show forest plot | 3 | 1001 | Risk Ratio (M‐H, Fixed, 95% CI) | 1.58 [0.89, 2.79] |
| 23 Neonatal seizures Show forest plot | 1 | 699 | Risk Ratio (M‐H, Fixed, 95% CI) | 3.97 [0.45, 35.30] |
| 24 Apgar score less than seven at five minutes Show forest plot | 2 | 1454 | Risk Ratio (M‐H, Fixed, 95% CI) | 1.11 [0.60, 2.05] |
| 25 Cord blood pH less than 7.1 or as defined by trial authors Show forest plot | 2 | 1145 | Risk Ratio (M‐H, Fixed, 95% CI) | 0.58 [0.31, 1.09] |
| 26 Surfactant use Show forest plot | 1 | 639 | Risk Ratio (M‐H, Fixed, 95% CI) | 0.0 [0.0, 0.0] |
| 27 Neonatal intensive care unit or high care unit admission Show forest plot | 4 | 1585 | Risk Ratio (M‐H, Fixed, 95% CI) | 1.65 [1.13, 2.40] |
| 28 Early neonatal sepsis Show forest plot | 2 | Risk Ratio (M‐H, Fixed, 95% CI) | Subtotals only | |
| 29 Duration of hospital stay after delivery for mother (days) Show forest plot | 2 | 925 | Mean Difference (IV, Fixed, 95% CI) | ‐0.16 [‐0.46, 0.15] |
| 30 Duration of hospital stay after delivery for baby (days) Show forest plot | 1 | 756 | Mean Difference (IV, Fixed, 95% CI) | ‐0.20 [‐0.57, 0.17] |
| Outcome or subgroup title | No. of studies | No. of participants | Statistical method | Effect size |
| 1 Composite maternal mortality and morbidity Show forest plot | 2 | 1459 | Risk Ratio (M‐H, Fixed, 95% CI) | 0.68 [0.57, 0.83] |
| 1.1 34 + 0 to 36 + 6 weeks GA at randomisation | 2 | 778 | Risk Ratio (M‐H, Fixed, 95% CI) | 0.77 [0.48, 1.24] |
| 1.2 37 + 0 to 38 + 6 weeks GA at randomisation | 1 | 380 | Risk Ratio (M‐H, Fixed, 95% CI) | 0.69 [0.53, 0.90] |
| 1.3 39 + 0 to 41 + 0 weeks GA at randomisation | 1 | 301 | Risk Ratio (M‐H, Fixed, 95% CI) | 0.64 [0.47, 0.88] |
| 2 Respiratory distress syndrome Show forest plot | 2 | 1459 | Risk Ratio (M‐H, Fixed, 95% CI) | 2.53 [1.16, 5.55] |
| 2.1 34 + 0 to 36 + 6 weeks GA at randomisation | 2 | 778 | Risk Ratio (M‐H, Fixed, 95% CI) | 3.32 [1.35, 8.18] |
| 2.2 37 + 0 to 38 + 6 weeks GA at randomisation | 1 | 380 | Risk Ratio (M‐H, Fixed, 95% CI) | 0.32 [0.01, 7.72] |
| 2.3 39 + 0 to 41 + 0 weeks GA at randomisation | 1 | 301 | Risk Ratio (M‐H, Fixed, 95% CI) | 1.12 [0.07, 17.74] |
| 3 Composite infant mortality and morbidity Show forest plot | 1 | 756 | Risk Ratio (M‐H, Fixed, 95% CI) | 0.77 [0.46, 1.28] |
| 3.1 36 + 0 to 36 + 6 weeks GA at randomisation | 1 | 75 | Risk Ratio (M‐H, Fixed, 95% CI) | 2.63 [0.29, 24.10] |
| 3.2 37 + 0 to 38 + 6 weeks GA at randomisation | 1 | 380 | Risk Ratio (M‐H, Fixed, 95% CI) | 0.68 [0.31, 1.49] |
| 3.3 39 + 0 to 41 + 0 weeks GA at randomisation | 1 | 301 | Risk Ratio (M‐H, Fixed, 95% CI) | 0.72 [0.35, 1.49] |
| Outcome or subgroup title | No. of studies | No. of participants | Statistical method | Effect size |
| 1 Composite maternal mortality and morbidity Show forest plot | 2 | 1459 | Risk Ratio (M‐H, Fixed, 95% CI) | 0.69 [0.57, 0.83] |
| 1.1 34 + 0 to 34 + 6 weeks GA at randomisation | 1 | 154 | Risk Ratio (M‐H, Fixed, 95% CI) | 4.75 [0.23, 97.34] |
| 1.2 35 + 0 to 35 + 6 weeks GA at randomisation | 1 | 236 | Risk Ratio (M‐H, Fixed, 95% CI) | 0.14 [0.02, 1.10] |
| 1.3 36 + 0 to 36 + 6 weeks GA at randomisation | 2 | 388 | Risk Ratio (M‐H, Fixed, 95% CI) | 0.98 [0.59, 1.62] |
| 1.4 37 + 0 to 37 + 6 weeks GA at randomisation | 1 | 188 | Risk Ratio (M‐H, Fixed, 95% CI) | 0.75 [0.52, 1.08] |
| 1.5 38 + 0 to 38 + 6 weeks GA at randomisation | 1 | 192 | Risk Ratio (M‐H, Fixed, 95% CI) | 0.63 [0.43, 0.94] |
| 1.6 39 + 0 to 39 + 6 weeks GA at randomisation | 1 | 186 | Risk Ratio (M‐H, Fixed, 95% CI) | 0.78 [0.53, 1.14] |
| 1.7 40 + 0 to 41 + 0 weeks GA at randomisation | 1 | 115 | Risk Ratio (M‐H, Fixed, 95% CI) | 0.46 [0.26, 0.79] |
| 2 Respiratory distress syndrome Show forest plot | 1 | 703 | Risk Ratio (M‐H, Fixed, 95% CI) | 3.32 [1.38, 8.01] |
| 2.1 34 + 0 to 34 + 6 weeks GA at randomisation | 1 | 154 | Risk Ratio (M‐H, Fixed, 95% CI) | 2.37 [0.78, 7.24] |
| 2.2 35 + 0 to 35 + 6 weeks GA at randomisation | 1 | 236 | Risk Ratio (M‐H, Fixed, 95% CI) | 7.62 [0.93, 62.27] |
| 2.3 36 + 0 to 36 + 6 weeks GA at randomisation | 1 | 313 | Risk Ratio (M‐H, Fixed, 95% CI) | 3.41 [0.39, 30.15] |
| 3 Composite infant mortality and morbidity Show forest plot | 1 | 756 | Risk Ratio (M‐H, Fixed, 95% CI) | 0.77 [0.46, 1.29] |
| 3.1 36 + 0 to 36 + 6 weeks GA at randomisation | 1 | 75 | Risk Ratio (M‐H, Fixed, 95% CI) | 2.63 [0.29, 24.10] |
| 3.2 37 + 0 to 37 + 6 weeks GA at randomisation | 1 | 188 | Risk Ratio (M‐H, Fixed, 95% CI) | 0.48 [0.17, 1.35] |
| 3.3 38 + 0 to 38 + 6 weeks GA at randomisation | 1 | 192 | Risk Ratio (M‐H, Fixed, 95% CI) | 1.17 [0.33, 4.24] |
| 3.4 39 + 0 to 39 + 6 weeks GA at randomisation | 1 | 186 | Risk Ratio (M‐H, Fixed, 95% CI) | 0.79 [0.32, 1.95] |
| 3.5 40 + 0 to 41 + 0 weeks GA at randomisation | 1 | 115 | Risk Ratio (M‐H, Fixed, 95% CI) | 0.63 [0.19, 2.12] |
| Outcome or subgroup title | No. of studies | No. of participants | Statistical method | Effect size |
| 1 Composite maternal mortality and morbidity Show forest plot | 2 | 1445 | Risk Ratio (M‐H, Fixed, 95% CI) | 0.70 [0.58, 0.85] |
| 1.1 Gestational hypertension | 2 | 678 | Risk Ratio (M‐H, Fixed, 95% CI) | 0.78 [0.61, 1.00] |
| 1.2 Mild pre‐eclampsia | 2 | 570 | Risk Ratio (M‐H, Fixed, 95% CI) | 0.60 [0.45, 0.81] |
| 1.3 Chronic hypertension | 1 | 197 | Risk Ratio (M‐H, Fixed, 95% CI) | 0.54 [0.10, 2.86] |
| 2 Respiratory distress syndrome Show forest plot | 1 | 703 | Risk Ratio (M‐H, Fixed, 95% CI) | 3.36 [1.36, 8.31] |
| 2.1 Gestational hypertension | 1 | 182 | Risk Ratio (M‐H, Fixed, 95% CI) | 3.91 [0.45, 34.34] |
| 2.2 Mild pre‐eclampsia | 1 | 324 | Risk Ratio (M‐H, Fixed, 95% CI) | 4.82 [1.07, 21.65] |
| 2.3 Chronic hypertension | 1 | 197 | Risk Ratio (M‐H, Fixed, 95% CI) | 2.15 [0.55, 8.35] |