Interventions psychosociales pour réduire la consommation d'alcool chez les usagers de drogues ayant également un problème d'alcool
Referencias
References to studies included in this review
References to studies excluded from this review
Additional references
References to other published versions of this review
Characteristics of studies
Characteristics of included studies [ordered by study ID]
Ir a:
| Methods | Study design: RCT, single blind. Recruitment modality of participants: individuals seeking treatment at the outpatient treatment unit of the APT Foundation, or respondents to newspaper advertisements or public service announcements. | |
| Participants | Number of participants: 122 (41 in 2 arms selected for this review). Gender: 27% female. Age: mean age 30.8 years (SD 5.5 years). Condition: "All subjects met current DSM‐III‐R criteria for cocaine dependence, and for concurrent alcohol dependence (85%) or alcohol abuse (15%)". Other relevant information: TSF arm: Baseline substance use:
CBT arm: Baseline substance use:
| |
| Interventions | Description of the experimental and control interventions The trial included 5 treatment arms: CBT plus disulphiram; TSF plus disulphiram; CM plus disulphiram; CBT plus no medication; TSF plus no medication. We considered only the latter 2 psychosocial therapy arms. CBT was based on Marlatt's relapse prevention model and TSF was adapted from that used in Project MATCH and was grounded in the concept of substance dependence as a spiritual and medical disease. Route of delivery: treatments were manual‐guided; 4 doctoral‐level psychologists conducted CBT; 2 masters‐level clinicians conducted TSF. Number of participants allocated to each group: 25 in CBT plus no medication; 19 in TSF plus no medication. Duration of the intervention: 12 weeks, 16 individual sessions. Duration of follow up: 12 weekly assessments within‐treatment, and at 1, 3, 6, 12 months. Country of origin, setting: a non‐profit substance abuse treatment centre (APT Foundation) affiliated with Yale University in New Haven, Connecticut, USA. | |
| Outcomes | 1.1.1 Alcohol abstinence as maximum number of weeks of consecutive alcohol abstinence during treatment 1.1.2 Illicit drug abstinence as maximum number of weeks of consecutive abstinence from cocaine during treatment 1.2.1 Alcohol abstinence as number achieving 3 or more weeks of consecutive alcohol abstinence during treatment 1.2.2 Illicit drug abstinence as number achieving 3 or more weeks of consecutive abstinence from cocaine during treatment 1.2.3 Alcohol abstinence during follow‐up year 1.2.4 Illicit drug abstinence as abstinence from cocaine during follow‐up year | |
| Notes | All sessions were recorded and checked and rated for accuracy and fidelity of the intervention. "Subjects also met weekly with an independent clinical evaluator who collected urine specimens, assessed cocaine and alcohol use and monitored other clinical symptoms". "Patients were paid $25 for each follow‐up interview, with a $10 increase for each consecutive interview they attended, to encourage more complete data collection. In addition, patients were paid a $5 bonus for attending an interview within 28 days of the target interview date".
| |
| Risk of bias | ||
| Bias | Authors' judgement | Support for judgement |
| Random sequence generation (selection bias) | Unclear risk | Not enough information provided; e.g. "Of the 122 randomised subjects, 117 initiated the treatment". |
| Allocation concealment (selection bias) | Unclear risk | Not stated. |
| Blinding of outcome assessment (detection bias) | Unclear risk | Not available. Objective measures used rather as an accuracy check than an outcome (urine specimens and breathalyser tests conducted by a blinded evaluator). |
| Blinding of outcome assessment (detection bias) | Low risk | Within‐study assessments: |
| Incomplete outcome data (attrition bias) | High risk | Within‐treatment assessments (1998): "Assignment to disulphiram was associated with significantly better retention in treatment". The psychotherapy groups had significantly lower retention rates than the medication groups: Retention rates:
"However, such analyses, ..., are confounded by differences among the treatments in retention". Only 30% completed treatment, however: Comments: |
| Incomplete outcome data (attrition bias) | High risk | All groups had a comparable number of follow‐up data points. However, number of drop‐outs was not reported for each group separately. "It is possible that poorer‐functioning subjects who dropped out of treatment early were under‐represented in the follow‐up data, inflating outcomes in all groups". "Participants who completed more sessions had better outcomes during follow‐up".
Percentage of treatment days abstinent from cocaine, percentage of treatment days abstinent from alcohol, percentage of cocaine‐negative urine screens, medication compliance during treatment. Number of drop‐outs and reasons: Number randomised: 122 (25 TSF, 19 CBT); Number initiated: 117 (23 TSF, 18 CBT) ‐ no other reason provided; Number removed from the trial: 8 (1 did not comply with medication, 1 medication side effects. 4 clinical deterioration, 2 administrative discharge); Number drop‐outs: 70 (no group breakdowns ‐ no other reasons); Number completed treatment: 39; Number followed up at least once: 96, i.e.:
|
| Methods | Study design: RCT. Recruitment modality of participants: for 1 year, participation in the study was proposed systematically to each adult outpatient who was treated for opioid or cocaine dependence. | |
| Participants | Number of participants: 110. Gender: 72.3% male. Age (mean ± SD): 35 ± 7.8 years. Condition: problem alcohol use based on questions from the AUDIT questionnaire, i.e. excessive drinking (7 ≤ AUDIT score < 13 for men and 6 ≤ AUDIT score < 13 for women); and alcohol dependence (score > 13); 43.8% were classified as excessive drinkers and 56.2% as alcohol dependents. Other relevant information: opiate dependence treatment with methadone substitution (56.2%) or diacetyl morphine (heroin treatment; 12%); no opioid substitution and treatment for opiate or cocaine dependence (31.7%). | |
| Interventions | Description of the experimental and control interventions: the intervention group was BI and the control group was TAU. (1) BI: BI was delivered in 1 session, based on WHO guidelines, delivered by a trained staff (4 hours' training). The intervention group received the same TAU as controls. The outpatient staff consisted of a psychiatrist, general practitioner, psychologist, nurse, and social worker. (2) TAU: "The control group received TAU in addition to AUDIT and score feedback. TAU refers to outpatient pharmacological and psychosocial treatment. Maintenance treatment with methadone or heroin included medical and psychiatric follow‐up, primary health care, psychosocial interventions, and administration of opiate treatments in a clinical setting. Psychosocial treatment included medical and psychiatric follow‐up, primary health care, psychosocial interventions, and, if necessary, administration of pharmacotherapy in a clinical setting". Number of participants allocated to each group: 60 in BI, 52 in TAU. Duration of the intervention (mean ± SD): 16 ± 4.7 minutes. Duration of follow up: 3 and 9 months. Country of origin, setting: specialised outpatient clinic in the Division of Substance Abuse of the University Hospitals of Geneva, Switzerland. | |
| Outcomes | 2.1.1 Alcohol use as AUDIT scores at 3 months 2.1.2 Alcohol use as AUDIT scores at 9 months 2.1.3 Alcohol use as number of drinks per week at 3 months (number of glasses of alcohol per week, 1 glass: 10 g of alcohol; wine = 100 mL; beer = 250 mL; spirits = 25 mL) 2.1.4 Alcohol use as number of drinks per week at 9 months 2.2.1 Alcohol use as decreased alcohol use at 3 months 2.2.2 Alcohol use as decreased alcohol use at 9 months 2.2.3 and 2.2.4 Increased or unchanged alcohol use at 3 and 9 months (i.e. reverse of the above) | |
| Notes | The participants in both groups were already in treatment for opioid or cocaine dependence before study inclusion. Participants allocated to BI received this intervention 2 or 3 weeks after AUDIT screening. The WHO Manual recommends the referral of individuals with alcohol dependence to specialist treatment without providing BI. All screened participants received feedback that explained the meaning of their AUDIT score. Almost 40% of the sample was lost to follow up. | |
| Risk of bias | ||
| Bias | Authors' judgement | Support for judgement |
| Random sequence generation (selection bias) | Low risk | Quote: "The randomisation scheme was drawn by a statistician, who used the Web site [http://www.randomizer.org/]. A random permuted block method was used, with blocks of 4 patients". |
| Allocation concealment (selection bias) | Low risk | Quote: "The sequence was concealed from all investigators with numbered opaque sealed envelopes prepared by the statistician and handed over to the physician in charge of the study". |
| Blinding of outcome assessment (detection bias) | Unclear risk | Not available, objective measures not used. |
| Blinding of outcome assessment (detection bias) | High risk | Not stated. Unpublished information: "There is no blinding assessment". |
| Incomplete outcome data (attrition bias) | Unclear risk | Not available. The study did not assess outcomes at the time of the study end. |
| Incomplete outcome data (attrition bias) | Low risk | Modified ITT analysis (multiple imputation, random assumption). Number of drop‐outs and reasons: "Of the BI group, 59.3% completed the last observation and of the control group, 58.8% completed it"
No reasons provided for drop‐outs, but regression showed no differences: Comment: dichotomous outcomes: 40% of participants dropped out, but the observed event risk was 10% to 20% (control), and 60% to 80% (intervention). |
| Methods | Study design: RCT open label, 3 arms. Recruitment modality of participants: flyers displayed in 5 methadone treatment sites. | |
| Participants | Number of participants: 256. Gender: 59.2% male. Age (mean ± SD): 51.2 ± 8.4 years. Condition: reported moderate‐to‐heavy alcohol use based on questions from the ASI. Methadone maintenance treatment was an inclusion criterion (minimum 3 months). Other relevant information: fair/poor health: 60.4%. Ethnicity: African‐American: 45.1%; white: 18.8, Latino: 26.7, Other: 9.4. Education: high school graduate 58%. Social support: primarily from drug users 12.6%; primarily non‐drug users 48.6%, both: 34.9%. | |
| Interventions | Description of the experimental and control interventions: (1) nurse‐led HHP group sessions; (2) MI delivered in group sessions (MI‐group), and (3) MI delivered in 1‐on‐1 sessions (MI‐single). (1) HHP: didactic style, also interactive as the group raised questions. Delivered by a nurse and hepatitis‐trained research assistant. Sessions based on "The comprehensive health seeking and coping paradigm (CHSCP; Nyamathi 1989), originally adapted from Lazarus and Folkman's (1984) stress and coping paradigm and Schlotfeldt's (1981) health seeking paradigm". Staff trained on the integration of the CHSCP into their education delivery. Focus: progression of HCV infection and the culturally sensitive strategies that infected individuals can adopt to prevent or reduce accumulated damage to liver functioning. Strategies included: discussing the dangers of alcohol use on hepatitis (cognitive factors), discussing ways to avoid alcohol and other drugs, eating a balanced diet, dangers of reinfection of HCV by IDU, receiving unsafe tattoos and piercing, having unprotected sexual behaviour, and being consistent in engaging in other health‐related behaviours. Additional health promoting activities: enhancing coping, such as seeking positive social support, getting (2) MI‐group: focus: alcohol, risky behaviours, MI spirit; by trained MI specialists, i.e. a PhD‐prepared psychologist conducted primarily the MI‐group sessions. Content of the individual and group sessions was identical, guided by a detailed protocol and biweekly meetings with the investigator and therapists. The average number of participants was 6 (range 5 to 7). (3) MI‐single: focus: alcohol, risky behaviours, MI spirit; a MSW‐prepared researcher conducted primarily the individual MI sessions. Number of participants allocated to each group: HHP: N = 87; MI group: N = 79; MI single: N = 90. Duration of the intervention: 3 x 60‐minute sessions, spaced 2 weeks apart. Duration of follow‐up: 6 months. Country of origin, setting: 5 methadone treatment sites in Los Angeles and Santa Monica, USA. | |
| Outcomes | 3.1.1 Alcohol use (unpublished) as number of standard drinks consumed per day over the last 30 days 3.1.2 Illicit drug use (unpublished) as frequency of drug use (as measured by ASI drug) 3.1.3 Illicit drug use (unpublished) as a composite drug score (frequency*severity for all drugs taken) 3.2.1 Alcohol use as > 50% reduction in number of standard drinks consumed per day over the last 30 days 3.2.2 Alcohol abstinence as abstinence from alcohol over the last 30 days Outcomes 4.1.1 to 4.2.2 refer to the individual (single) format of MI. | |
| Notes | 6 participants reported no alcohol use at baseline. A total of 86.7% of participants completed all 3 sessions and 91.3% completed the 6‐month follow up. The sessions were open; i.e. participants who had not completed their 3 sessions with their original cohort could complete with a later cohort. The original protocol describes HHP as a control intervention (UCG). Means (SD) of outcomes measures (ASI, TLFB) are not provided for any of the outcomes; baseline scores are also not provided. | |
| Risk of bias | ||
| Bias | Authors' judgement | Support for judgement |
| Random sequence generation (selection bias) | Low risk | Quote: "This study was a randomised controlled trial" Unpublished information: "As participants were enrolled, they were systematically assigned to each of the three arms. In terms of randomisation, we used random assignment using a random number table". |
| Allocation concealment (selection bias) | High risk | Masking: open label. |
| Blinding of outcome assessment (detection bias) | Unclear risk | Not available, objective measures not used. |
| Blinding of outcome assessment (detection bias) | High risk | Masking: open label. |
| Incomplete outcome data (attrition bias) | Unclear risk | Not available. The study did not assess outcomes at the time of the study end. |
| Incomplete outcome data (attrition bias) | Low risk | Comment: Number of drop‐outs and reasons:
Unpublished information: "The 6 reported abstainers were distributed as follows: 2 in MI‐Single, 3 in MI‐Group and 1 in HHP. |
| Methods | Study design: RCT. Recruitment modality of participants: study was advertised at 3 NEP sites using posters and NEP volunteers offered all clients referral cards. NEP clients called a study telephone to be screened by a research assistant at a separate research site in hospital. During the initial study visit, all NEP clients presented their study cards (received at NEP). Between February 1998 and October 1999. | |
| Participants | Number of participants: 187. Gender: 119 male (63.6%). Age: mean 36.2 years. Condition: problem alcohol use, i.e. AUDIT‐positive (> 8) active IDUs. "Current alcohol abuse or dependence diagnosis was ascertained using the SCID interview. 159 (85.0%) met DSM‐IV criteria for current alcohol abuse or dependence (80% for abuse, 70% for dependence)". Other relevant information:
| |
| Interventions | Description of the experimental and control interventions: (1) brief MI and (2) control group. (1) MI: focus on alcohol use and HIV risk‐taking Goals: to assess the degree to which the participant engages in hazardous drinking; to identify relationships between alcohol consumption and alcohol‐related negative consequences including HIV risk behaviour; to identify goals for behaviour change and any barriers to change.
(2) Control: assessment‐only, approximately 3 hours Number of participants allocated to each group: 95 in MI, 92 in control group. Duration of the intervention: 2 therapist sessions, 1 month apart; 1st session: 60 minutes, 2nd session: 30 to 45 minutes. Duration of follow‐up: 1 and 6 months. Country of origin, setting: NEP clients, study site: Rhode Island Hospital in Providence, USA. | |
| Outcomes | 5.1.1 Alcohol use as number of days in the past 30 days with alcohol use at 1 month 5.1.2 Alcohol use as number of days in the past 30 days with alcohol use at 6 months 5.2.1 Alcohol use as 25% reduction of drinking days in the past 30 days 5.2.2 Alcohol use as 50% reduction of drinking days in the past 30 days 5.2.3 Alcohol use as 75% reduction of drinking days in the past 30 days 5.2.4 Alcohol use as 1 or more drinking days' reduction in the past 30 days 5.2.5 Alcohol use as 7 or more drinking days' reduction in the past 30 days Secondary outcome: number of days in the past 30 days with IRRB ‐ defined as answer to 1 question: have you used needles etc. after someone else? (reported only for a subset of 109 participants in the 2002b paper). | |
| Notes | Study retention: 96.8% at 6 months. Control and MI subjects received identical research assessments at baseline, 1 and 6 months:
The paper reporting IRRB outcomes (Stein 2002b) was included in another Cochrane review (Meader 2010), therefore it was not considered for this review. | |
| Risk of bias | ||
| Bias | Authors' judgement | Support for judgement |
| Random sequence generation (selection bias) | Unclear risk | Not enough information provided: "Following the baseline interview subjects were assigned to treatment conditions using a randomisation schedule created with permuted blocks of eight assignments." "After randomisation, the research interventionist saw participants assigned to MI...". |
| Allocation concealment (selection bias) | Unclear risk | Not stated how the randomisation schedule was prepared: "This method ensured that the treatment groups were balanced in number to within four patients throughout the trial. The data manager prepared the randomisation schedule before the first patient enrolled". |
| Blinding of outcome assessment (detection bias) | Unclear risk | Not available. Objective measures used rather as an accuracy check than an outcome: "During the initial study visit, all NEP subjects presented their study cards (received at NEP), underwent blood alcohol level testing (to ensure subjects were not inebriated, BAL < 0.04)". |
| Blinding of outcome assessment (detection bias) | Low risk | "At each follow‐up assessment, research assistants were blinded to the treatment condition of the subject; the interventionist did not perform research assessments". |
| Incomplete outcome data (attrition bias) | Unclear risk | Not available. The study did not assess outcomes at the time of the study end. |
| Incomplete outcome data (attrition bias) | Low risk | "We conducted an intent‐to‐treat analysis using a conservative 'worst case scenario' strategy in which observations with missing follow‐up data were assigned the maximum value of 30 drinking days, a data imputation approach which tends to minimize observed reductions in mean drinking days across time. To ensure that our substantive results were not sensitive to missing observations (there were no condition differences in missing data) we replicated our analyses using observations with complete data (n = 181), and using other imputation strategies (e.g. mean substitution, regression estimation and 'best case scenario'). All imputation strategies resulted in substantively consistent findings. To evaluate the adequacy of random assignment, we used t‐ and x2‐tests to compare treatment groups with respect to background characteristics and baseline measures of drinking behaviours and alcohol problems". Number of drop‐outs and reasons: |
ASI: Addiction Severity Index; ASP: antisocial personality disorder; BAL: blood alcohol level; BI: brief intervention; CBT: cognitive‐behavioural coping skills training; CM: clinical management; DSM‐III‐R: Diagnostic and Statistical Manual of Mental Disorders, Third Edition ‐ Revised; DSM‐IV: Diagnostic and Statistical Manual of Mental Disorders, Fourth Edition; HCV: hepatitis C virus; HIV: human immunodeficiency virus; HHP: hepatitis health promotion; ICD‐10: International Classification of Diseases ‐ Tenth Revision; IDU: injection drug use; ITT: intention to treat; IRRB: injection‐related HIV risk behaviour; MI: motivational intervention; MSW: master in social work; NEP: needle exchange programme; PhD: doctor of philosophy; RCT: randomised controlled trial; SD: standard deviation; TAU: treatment as usual; TLFB: timeline follow‐back; TSF: 12‐step facilitation; UCG: usual care group; WHO: World Health Organization.
Characteristics of excluded studies [ordered by study ID]
Ir a:
| Study | Reason for exclusion |
| Participants not in the inclusion criteria: concurrent problem alcohol and drug use not an inclusion criterion | |
| Participants not in the inclusion criteria: concurrent problem alcohol and drug use not an inclusion criterion | |
| Participants not in the inclusion criteria: participants had alcohol dependence only | |
| Participants not in the inclusion criteria: participants were not problem drug users and concurrent problem alcohol use not an inclusion criterion | |
| Participants not in the inclusion criteria: participants were not problem drug users and concurrent problem alcohol use not an inclusion criterion | |
| Participants not in the inclusion criteria: concurrent problem alcohol use not an inclusion criterion | |
| Participants not in the inclusion criteria: concurrent problem alcohol use not an inclusion criterion | |
| Participants not in the inclusion criteria: concurrent problem alcohol use not an inclusion criterion | |
| Study design not in the inclusion criteria: not an RCT | |
| Outcome not in the inclusion criteria: alcohol use was not measured, because the intervention focused on drug use and the participants were not reported to have problem alcohol use at randomisation | |
| Participants not in the inclusion criteria: concurrent problem alcohol and drug use not an inclusion criterion | |
| Study design not in the inclusion criteria: not an RCT | |
| Participants not in the inclusion criteria: concurrent problem alcohol use not an inclusion criterion | |
| Participants not in the inclusion criteria: the MST (multi‐component smoking treatment) condition had a continuous drug and alcohol abstinence rate | |
| Study design not in the inclusion criteria: not an RCT | |
| Participants not in the inclusion criteria: concurrent problem alcohol use not an inclusion criterion for all subjects randomised into trial. Quote: "Approximately one‐third of all the active alcoholics [n=105] were assigned to each of the three study groups (1983, p864; 1982, p360)." Comment: it is highly probable that non‐alcoholics were randomised into trial. Operative alcoholics (N = 105) versus all subjects randomised into trial (N = 127) | |
| Participants not in the inclusion criteria: concurrent problem drug use not an inclusion criterion. Only 10% to 11% participants smoked cannabis once per week | |
| Study design not in the inclusion criteria: not an RCT | |
| Study design not in the inclusion criteria: not an RCT | |
| Participants not in the inclusion criteria: concurrent problem alcohol use not an inclusion criterion | |
| Study design not in the inclusion criteria: not an RCT. A secondary analysis of 2 RCTs that did not have concurrent problem alcohol use not an inclusion criterion | |
| Participants not in the inclusion criteria: concurrent problem alcohol use not an inclusion criterion | |
| Participants not in the inclusion criteria: concurrent problem alcohol use not an inclusion criterion | |
| Study design not in the inclusion criteria: not an RCT | |
| Participants not in the inclusion criteria: concurrent problem alcohol use not an inclusion criterion | |
| Participants not in the inclusion criteria: participants were eligible if they had alcohol dependence diagnosis with or without comorbid | |
| Participants not in the inclusion criteria: concurrent problem alcohol use not an inclusion criterion | |
| Study design not in the inclusion criteria: not an RCT | |
| Participants not in the inclusion criteria: concurrent problem alcohol use not an inclusion criterion. Alcohol was used only by 149 of the 166 participants in the 90 days prior to initial presentation | |
| Participants not in the inclusion criteria: concurrent problem alcohol and drug use not an inclusion criterion | |
| Participants not in the inclusion criteria: concurrent problem alcohol use not an inclusion criterion. Additionally, 46.6% reported alcohol as their primary drug (review exclusion criterion) | |
| Participants not in the inclusion criteria: concurrent problem alcohol use not an inclusion criterion | |
| Participants not in the inclusion criteria: concurrent problem alcohol use not an inclusion criterion |
RCT: randomised controlled trial.
Data and analyses
| Outcome or subgroup title | No. of studies | No. of participants | Statistical method | Effect size |
| 1 Continuous outcomes Show forest plot | 1 | Mean Difference (IV, Fixed, 95% CI) | Subtotals only | |
| Analysis 1.1  Comparison 1 Cognitive‐behavioural coping skills training (CBT) versus 12‐step facilitation (TSF), Outcome 1 Continuous outcomes. | ||||
| 1.1 Alcohol abstinence as maximum number of weeks of consecutive alcohol abstinence during treatment | 1 | 41 | Mean Difference (IV, Fixed, 95% CI) | 0.40 [‐1.14, 1.94] |
| 1.2 Illicit drug abstinence as maximum number of weeks of consecutive abstinence from cocaine during treatment | 1 | 41 | Mean Difference (IV, Fixed, 95% CI) | 0.8 [‐0.70, 2.30] |
| 2 Dichotomous outcomes Show forest plot | 1 | Risk Ratio (M‐H, Fixed, 95% CI) | Subtotals only | |
| Analysis 1.2  Comparison 1 Cognitive‐behavioural coping skills training (CBT) versus 12‐step facilitation (TSF), Outcome 2 Dichotomous outcomes. | ||||
| 2.1 Alcohol abstinence as number achieving 3 or more weeks of consecutive alcohol abstinence during treatment | 1 | 41 | Risk Ratio (M‐H, Fixed, 95% CI) | 1.96 [0.43, 8.94] |
| 2.2 Illicit drug abstinence as number achieving 3 or more weeks of consecutive abstinence from cocaine during treatment | 1 | 41 | Risk Ratio (M‐H, Fixed, 95% CI) | 1.10 [0.42, 2.88] |
| 2.3 Alcohol abstinence during follow‐up year | 1 | 41 | Risk Ratio (M‐H, Fixed, 95% CI) | 2.38 [0.10, 55.06] |
| 2.4 Illicit drug abstinence as abstinence from cocaine during follow‐up year | 1 | 41 | Risk Ratio (M‐H, Fixed, 95% CI) | 0.39 [0.04, 3.98] |
| Outcome or subgroup title | No. of studies | No. of participants | Statistical method | Effect size |
| 1 Continuous outcomes Show forest plot | 1 | Mean Difference (IV, Fixed, 95% CI) | Subtotals only | |
| Analysis 2.1  Comparison 2 Brief intervention (BI) versus treatment as usual, Outcome 1 Continuous outcomes. | ||||
| 1.1 Alcohol use as AUDIT scores at 3 months | 1 | 110 | Mean Difference (IV, Fixed, 95% CI) | 0.80 [‐1.80, 3.40] |
| 1.2 Alcohol use as AUDIT Scores at 9 months | 1 | 110 | Mean Difference (IV, Fixed, 95% CI) | 2.30 [‐0.58, 5.18] |
| 1.3 Alcohol use as number of drinks per week at 3 months | 1 | 110 | Mean Difference (IV, Fixed, 95% CI) | 0.70 [‐3.85, 5.25] |
| 1.4 Alcohol use as number of drinks per week at 9 months | 1 | 110 | Mean Difference (IV, Fixed, 95% CI) | ‐0.30 [‐4.79, 4.19] |
| 2 Dichotomous outcomes Show forest plot | 1 | Risk Ratio (M‐H, Fixed, 95% CI) | Subtotals only | |
| Analysis 2.2 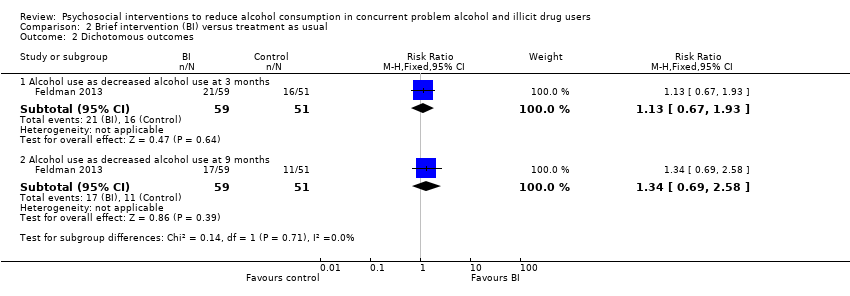 Comparison 2 Brief intervention (BI) versus treatment as usual, Outcome 2 Dichotomous outcomes. | ||||
| 2.1 Alcohol use as decreased alcohol use at 3 months | 1 | 110 | Risk Ratio (M‐H, Fixed, 95% CI) | 1.13 [0.67, 1.93] |
| 2.2 Alcohol use as decreased alcohol use at 9 months | 1 | 110 | Risk Ratio (M‐H, Fixed, 95% CI) | 1.34 [0.69, 2.58] |
| Outcome or subgroup title | No. of studies | No. of participants | Statistical method | Effect size |
| 1 Continuous outcomes Show forest plot | 1 | Mean Difference (IV, Fixed, 95% CI) | Subtotals only | |
| Analysis 3.1 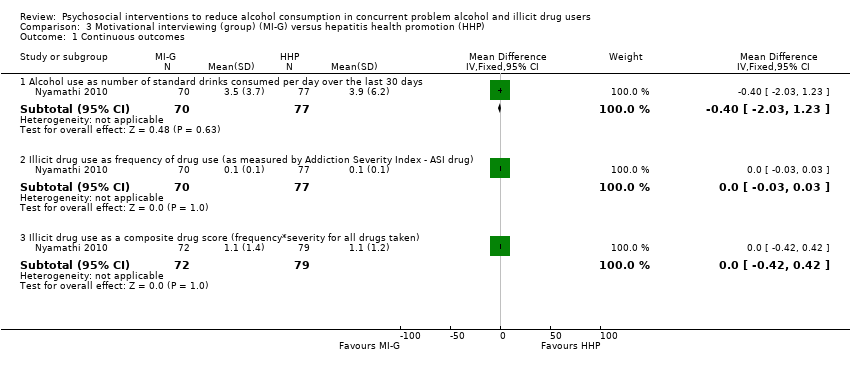 Comparison 3 Motivational interviewing (group) (MI‐G) versus hepatitis health promotion (HHP), Outcome 1 Continuous outcomes. | ||||
| 1.1 Alcohol use as number of standard drinks consumed per day over the last 30 days | 1 | 147 | Mean Difference (IV, Fixed, 95% CI) | ‐0.40 [‐2.03, 1.23] |
| 1.2 Illicit drug use as frequency of drug use (as measured by Addiction Severity Index ‐ ASI drug) | 1 | 147 | Mean Difference (IV, Fixed, 95% CI) | 0.0 [‐0.03, 0.03] |
| 1.3 Illicit drug use as a composite drug score (frequency*severity for all drugs taken) | 1 | 151 | Mean Difference (IV, Fixed, 95% CI) | 0.0 [‐0.42, 0.42] |
| 2 Dichotomous outcomes Show forest plot | 1 | Risk Ratio (M‐H, Fixed, 95% CI) | Subtotals only | |
| Analysis 3.2  Comparison 3 Motivational interviewing (group) (MI‐G) versus hepatitis health promotion (HHP), Outcome 2 Dichotomous outcomes. | ||||
| 2.1 Alcohol use as greater than 50% reduction in number of standard drinks consumed per day over the last 30 days | 1 | 166 | Risk Ratio (M‐H, Fixed, 95% CI) | 1.10 [0.82, 1.48] |
| 2.2 Alcohol abstinence as abstinence from alcohol over the last 30 days | 1 | 166 | Risk Ratio (M‐H, Fixed, 95% CI) | 0.88 [0.49, 1.58] |
| Outcome or subgroup title | No. of studies | No. of participants | Statistical method | Effect size |
| 1 Continuous outcomes Show forest plot | 1 | Mean Difference (IV, Fixed, 95% CI) | Subtotals only | |
| Analysis 4.1 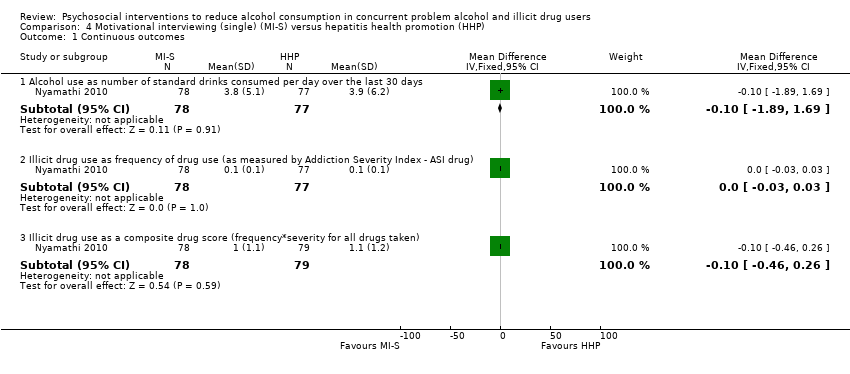 Comparison 4 Motivational interviewing (single) (MI‐S) versus hepatitis health promotion (HHP), Outcome 1 Continuous outcomes. | ||||
| 1.1 Alcohol use as number of standard drinks consumed per day over the last 30 days | 1 | 155 | Mean Difference (IV, Fixed, 95% CI) | ‐0.10 [‐1.89, 1.69] |
| 1.2 Illicit drug use as frequency of drug use (as measured by Addiction Severity Index ‐ ASI drug) | 1 | 155 | Mean Difference (IV, Fixed, 95% CI) | 0.0 [‐0.03, 0.03] |
| 1.3 Illicit drug use as a composite drug score (frequency*severity for all drugs taken) | 1 | 157 | Mean Difference (IV, Fixed, 95% CI) | ‐0.10 [‐0.46, 0.26] |
| 2 Dichotomous outcomes Show forest plot | 1 | Risk Ratio (M‐H, Fixed, 95% CI) | Subtotals only | |
| Analysis 4.2  Comparison 4 Motivational interviewing (single) (MI‐S) versus hepatitis health promotion (HHP), Outcome 2 Dichotomous outcomes. | ||||
| 2.1 Alcohol use as greater than 50% reduction in number of standard drinks consumed per day over the last 30 days | 1 | 177 | Risk Ratio (M‐H, Fixed, 95% CI) | 0.92 [0.68, 1.26] |
| 2.2 Alcohol abstinence as abstinence from alcohol over the last 30 days | 1 | 177 | Risk Ratio (M‐H, Fixed, 95% CI) | 0.97 [0.56, 1.67] |
| Outcome or subgroup title | No. of studies | No. of participants | Statistical method | Effect size |
| 1 Continuous outcomes Show forest plot | 1 | Mean Difference (IV, Fixed, 95% CI) | Subtotals only | |
| Analysis 5.1 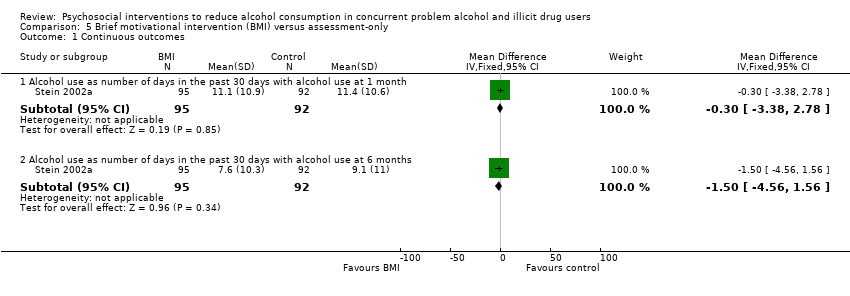 Comparison 5 Brief motivational intervention (BMI) versus assessment‐only, Outcome 1 Continuous outcomes. | ||||
| 1.1 Alcohol use as number of days in the past 30 days with alcohol use at 1 month | 1 | 187 | Mean Difference (IV, Fixed, 95% CI) | ‐0.30 [‐3.38, 2.78] |
| 1.2 Alcohol use as number of days in the past 30 days with alcohol use at 6 months | 1 | 187 | Mean Difference (IV, Fixed, 95% CI) | ‐1.5 [‐4.56, 1.56] |
| 2 Dichotomous outcomes Show forest plot | 1 | Risk Ratio (M‐H, Fixed, 95% CI) | Subtotals only | |
| Analysis 5.2  Comparison 5 Brief motivational intervention (BMI) versus assessment‐only, Outcome 2 Dichotomous outcomes. | ||||
| 2.1 Alcohol use as 25% reduction of drinking days in the past 30 days | 1 | 187 | Risk Ratio (M‐H, Fixed, 95% CI) | 1.23 [0.96, 1.57] |
| 2.2 Alcohol use as 50% reduction of drinking days in the past 30 days | 1 | 187 | Risk Ratio (M‐H, Fixed, 95% CI) | 1.27 [0.96, 1.68] |
| 2.3 Alcohol use as 75% reduction of drinking days in the past 30 days | 1 | 187 | Risk Ratio (M‐H, Fixed, 95% CI) | 1.21 [0.84, 1.75] |
| 2.4 Alcohol use as 1 or more drinking days' reduction in the past 30 days | 1 | 187 | Risk Ratio (M‐H, Fixed, 95% CI) | 1.12 [0.91, 1.38] |
| 2.5 Alcohol use as 7 or more drinking days' reduction in the past 30 days | 1 | 187 | Risk Ratio (M‐H, Fixed, 95% CI) | 1.67 [1.08, 2.60] |

Study flow diagram from first publication of this review in 2012.

Study flow diagram for a review update: previous studies incorporated into results of new literature search
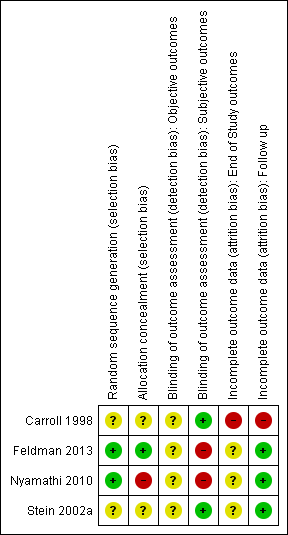
Risk of bias summary: review authors' judgements about each risk of bias item for each included study.
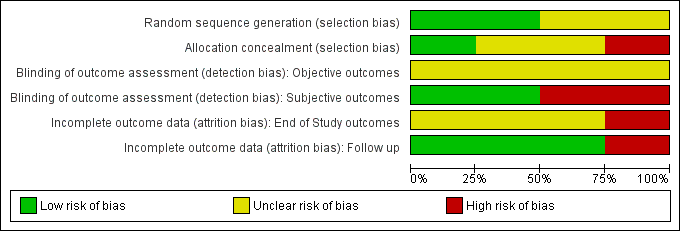
Risk of bias graph: review authors' judgements about each risk of bias item presented as percentages across all included studies.

Comparison 1 Cognitive‐behavioural coping skills training (CBT) versus 12‐step facilitation (TSF), Outcome 1 Continuous outcomes.

Comparison 1 Cognitive‐behavioural coping skills training (CBT) versus 12‐step facilitation (TSF), Outcome 2 Dichotomous outcomes.
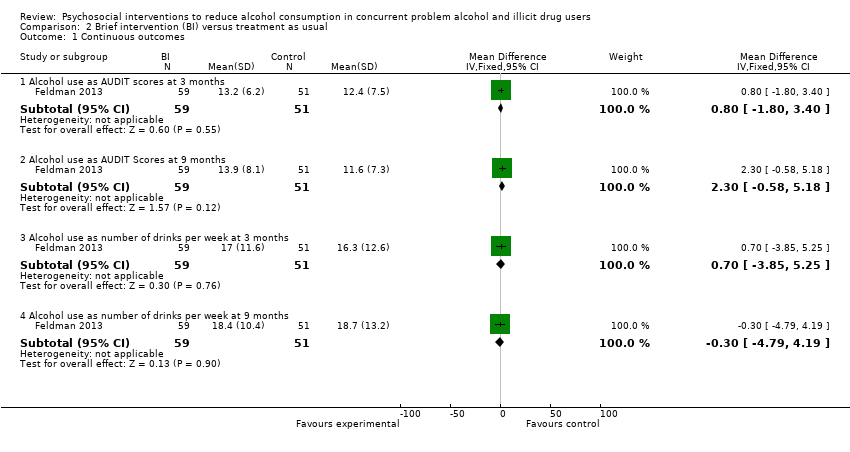
Comparison 2 Brief intervention (BI) versus treatment as usual, Outcome 1 Continuous outcomes.

Comparison 2 Brief intervention (BI) versus treatment as usual, Outcome 2 Dichotomous outcomes.

Comparison 3 Motivational interviewing (group) (MI‐G) versus hepatitis health promotion (HHP), Outcome 1 Continuous outcomes.
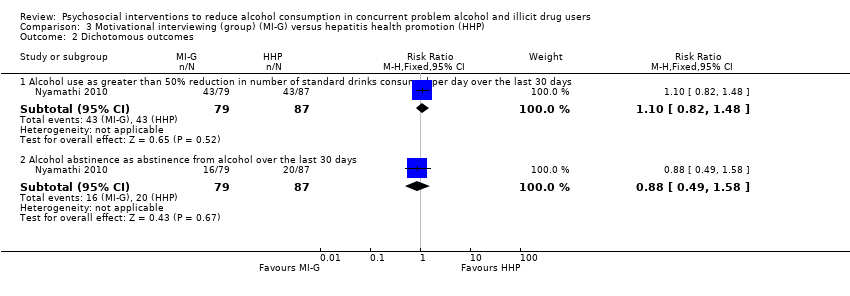
Comparison 3 Motivational interviewing (group) (MI‐G) versus hepatitis health promotion (HHP), Outcome 2 Dichotomous outcomes.

Comparison 4 Motivational interviewing (single) (MI‐S) versus hepatitis health promotion (HHP), Outcome 1 Continuous outcomes.

Comparison 4 Motivational interviewing (single) (MI‐S) versus hepatitis health promotion (HHP), Outcome 2 Dichotomous outcomes.

Comparison 5 Brief motivational intervention (BMI) versus assessment‐only, Outcome 1 Continuous outcomes.

Comparison 5 Brief motivational intervention (BMI) versus assessment‐only, Outcome 2 Dichotomous outcomes.
| Population: participants with alcohol use in concurrent problem alcohol and illicit drug users | ||||||
| Outcomes | Illustrative comparative risks* (95% CI) | Relative effect | No. of participants | Quality of the evidence | Comments | |
| Assumed risk | Corresponding risk | |||||
| Control | CBT versus TSF | |||||
| Maximum number of weeks of consecutive alcohol abstinence during treatment | The mean maximum number of weeks of consecutive alcohol abstinence during treatment in the control groups was | The mean maximum number of weeks of consecutive alcohol abstinence during treatment in the intervention group was | ‐ | 41 | ⊕⊕⊝⊝ | ‐ |
| Maximum number of weeks of consecutive abstinence from cocaine during treatment | The mean maximum number of weeks of consecutive abstinence from cocaine during treatment in the control groups was | The mean maximum number of weeks of consecutive abstinence from cocaine during treatment in the intervention group was | ‐ | 41 | ⊕⊕⊝⊝ | ‐ |
| Number of people achieving 3 or more weeks of consecutive alcohol abstinence during treatment | Study population | RR 1.96 | 41 | ⊕⊕⊝⊝ | ‐ | |
| 111 per 1000 | 218 per 1000 | |||||
| Moderate | ||||||
| 111 per 1000 | 218 per 1000 | |||||
| Alcohol abstinence | Study population | RR 2.38 | 41 | ⊕⊕⊝⊝ | ‐ | |
| 0 per 1000 | 0 per 1000 | |||||
| Moderate | ||||||
| 0 per 1000 | 0 per 1000 | |||||
| *The basis for the assumed risk (e.g. the median control group risk across studies) is provided in footnotes. The corresponding risk (and its 95% CI) is based on the assumed risk in the comparison group and the relative effect of the intervention (and its 95% CI). | ||||||
| GRADE Working Group grades of evidence | ||||||
| 1 Incomplete outcome data | ||||||
| Population: participants with alcohol use in concurrent problem alcohol and illicit drug users | ||||||
| Outcomes | Illustrative comparative risks* (95% CI) | Relative effect | No. of participants | Quality of the evidence | Comments | |
| Assumed risk | Corresponding risk | |||||
| Control | BI versus treatment as usual | |||||
| Number of standard drinks per week | The mean number of standard drinks per week in the control groups was | The mean number of standard drinks per week in the intervention groups was | ‐ | 110 | ⊕⊕⊝⊝ | ‐ |
| Number of standard drinks per week | The mean number of standard drinks per week in the control groups was | The mean number of standard drinks per week in the intervention groups was | ‐ | 110 | ⊕⊕⊝⊝ | ‐ |
| Decreased alcohol use | Study population | RR 1.13 | 110 | ⊕⊕⊝⊝ | ‐ | |
| 314 per 1000 | 355 per 1000 | |||||
| Moderate | ||||||
| 314 per 1000 | 355 per 1000 | |||||
| Decreased alcohol use | Study population | RR 1.34 | 110 | ⊕⊕⊝⊝ | ‐ | |
| 216 per 1000 | 289 per 1000 | |||||
| Moderate | ||||||
| 216 per 1000 | 289 per 1000 | |||||
| *The basis for the assumed risk (e.g. the median control group risk across studies) is provided in footnotes. The corresponding risk (and its 95% CI) is based on the assumed risk in the comparison group and the relative effect of the intervention (and its 95% CI). | ||||||
| GRADE Working Group grades of evidence | ||||||
| 1 Allocation and assessment of outcomes weren't blinded | ||||||
| Population: participants with alcohol use in concurrent problem alcohol and illicit drug users | ||||||
| Outcomes | Illustrative comparative risks* (95% CI) | Relative effect | No. of participants | Quality of the evidence | Comments | |
| Assumed risk | Corresponding risk | |||||
| Control | MI‐G versus HHP | |||||
| Number of standard drinks per day | The mean number of standard drinks per day in the control groups was | The mean number of standard drinks per day in the intervention groups was | ‐ | 147 | ⊕⊕⊝⊝ | ‐ |
| Over 50% less standard drinks per day | Study population | RR 1.1 | 166 | ⊕⊕⊝⊝ | ‐ | |
| 494 per 1000 | 544 per 1000 | |||||
| Moderate | ||||||
| 494 per 1000 | 543 per 1000 | |||||
| Alcohol abstinence | Study population | RR 0.88 | 166 | ⊕⊕⊝⊝ | ‐ | |
| 230 per 1000 | 202 per 1000 | |||||
| Moderate | ||||||
| 230 per 1000 | 202 per 1000 | |||||
| *The basis for the assumed risk (e.g. the median control group risk across studies) is provided in footnotes. The corresponding risk (and its 95% CI) is based on the assumed risk in the comparison group and the relative effect of the intervention (and its 95% CI). | ||||||
| GRADE Working Group grades of evidence | ||||||
| 1 Masking: open label. Allocation and assessment of outcomes weren't blinded | ||||||
| Population: participants with alcohol use in concurrent problem alcohol and illicit drug users | ||||||
| Outcomes | Illustrative comparative risks* (95% CI) | Relative effect | No. of participants | Quality of the evidence | Comments | |
| Assumed risk | Corresponding risk | |||||
| Control | MI‐S versus hepatitis HHP | |||||
| Number of standard drinks consumed per day | The mean number of standard drinks consumed per day in the control groups was | The mean number of standard drinks consumed per day in the intervention groups was | ‐ | 155 | ⊕⊕⊝⊝ | ‐ |
| Over 50% less standard drinks per day | Study population | RR 0.92 | 177 | ⊕⊕⊝⊝ | ‐ | |
| 494 per 1000 | 455 per 1000 | |||||
| Moderate | ||||||
| 494 per 1000 | 454 per 1000 | |||||
| Alcohol abstinence | Study population | RR 0.97 | 177 | ⊕⊕⊝⊝ | ‐ | |
| 230 per 1000 | 223 per 1000 | |||||
| Moderate | ||||||
| 230 per 1000 | 223 per 1000 | |||||
| *The basis for the assumed risk (e.g. the median control group risk across studies) is provided in footnotes. The corresponding risk (and its 95% CI) is based on the assumed risk in the comparison group and the relative effect of the intervention (and its 95% CI). | ||||||
| GRADE Working Group grades of evidence | ||||||
| 1 Masking: open label. Allocation and assessment of outcomes weren't blinded | ||||||
| Population: participants with alcohol use in concurrent problem alcohol and illicit drug users | ||||||
| Outcomes | Illustrative comparative risks* (95% CI) | Relative effect | No. of participants | Quality of the evidence | Comments | |
| Assumed risk | Corresponding risk | |||||
| Control | BMI) versus assessment‐only | |||||
| Number of days with alcohol use at 6 months | The mean number of days with alcohol use at 6 months in the control groups was | The mean number of days with alcohol use at 6 months in the intervention groups was | ‐ | 187 | ⊕⊕⊕⊝ | ‐ |
| 25% reduction of drinking days in the past 30 days | Study population | RR 1.23 | 187 | ⊕⊕⊕⊝ | ‐ | |
| 522 per 1000 | 642 per 1000 | |||||
| Moderate | ||||||
| 522 per 1000 | 642 per 1000 | |||||
| 50% reduction of drinking days in the past 30 days | Study population | RR 1.27 | 187 | ⊕⊕⊕⊝ | ‐ | |
| 457 per 1000 | 580 per 1000 | |||||
| Moderate | ||||||
| 457 per 1000 | 580 per 1000 | |||||
| Seven or more drinking days' reduction in the past 30 days | Study population | RR 1.67 | 187 | ⊕⊕⊕⊝ | ‐ | |
| 239 per 1000 | 399 per 1000 | |||||
| Moderate | ||||||
| 239 per 1000 | 399 per 1000 | |||||
| *The basis for the assumed risk (e.g. the median control group risk across studies) is provided in footnotes. The corresponding risk (and its 95% CI) is based on the assumed risk in the comparison group and the relative effect of the intervention (and its 95% CI). | ||||||
| GRADE Working Group grades of evidence | ||||||
| 1 Sparse data: only 1 study with relatively few participants included in comparison | ||||||
| Outcome or subgroup title | No. of studies | No. of participants | Statistical method | Effect size |
| 1 Continuous outcomes Show forest plot | 1 | Mean Difference (IV, Fixed, 95% CI) | Subtotals only | |
| 1.1 Alcohol abstinence as maximum number of weeks of consecutive alcohol abstinence during treatment | 1 | 41 | Mean Difference (IV, Fixed, 95% CI) | 0.40 [‐1.14, 1.94] |
| 1.2 Illicit drug abstinence as maximum number of weeks of consecutive abstinence from cocaine during treatment | 1 | 41 | Mean Difference (IV, Fixed, 95% CI) | 0.8 [‐0.70, 2.30] |
| 2 Dichotomous outcomes Show forest plot | 1 | Risk Ratio (M‐H, Fixed, 95% CI) | Subtotals only | |
| 2.1 Alcohol abstinence as number achieving 3 or more weeks of consecutive alcohol abstinence during treatment | 1 | 41 | Risk Ratio (M‐H, Fixed, 95% CI) | 1.96 [0.43, 8.94] |
| 2.2 Illicit drug abstinence as number achieving 3 or more weeks of consecutive abstinence from cocaine during treatment | 1 | 41 | Risk Ratio (M‐H, Fixed, 95% CI) | 1.10 [0.42, 2.88] |
| 2.3 Alcohol abstinence during follow‐up year | 1 | 41 | Risk Ratio (M‐H, Fixed, 95% CI) | 2.38 [0.10, 55.06] |
| 2.4 Illicit drug abstinence as abstinence from cocaine during follow‐up year | 1 | 41 | Risk Ratio (M‐H, Fixed, 95% CI) | 0.39 [0.04, 3.98] |
| Outcome or subgroup title | No. of studies | No. of participants | Statistical method | Effect size |
| 1 Continuous outcomes Show forest plot | 1 | Mean Difference (IV, Fixed, 95% CI) | Subtotals only | |
| 1.1 Alcohol use as AUDIT scores at 3 months | 1 | 110 | Mean Difference (IV, Fixed, 95% CI) | 0.80 [‐1.80, 3.40] |
| 1.2 Alcohol use as AUDIT Scores at 9 months | 1 | 110 | Mean Difference (IV, Fixed, 95% CI) | 2.30 [‐0.58, 5.18] |
| 1.3 Alcohol use as number of drinks per week at 3 months | 1 | 110 | Mean Difference (IV, Fixed, 95% CI) | 0.70 [‐3.85, 5.25] |
| 1.4 Alcohol use as number of drinks per week at 9 months | 1 | 110 | Mean Difference (IV, Fixed, 95% CI) | ‐0.30 [‐4.79, 4.19] |
| 2 Dichotomous outcomes Show forest plot | 1 | Risk Ratio (M‐H, Fixed, 95% CI) | Subtotals only | |
| 2.1 Alcohol use as decreased alcohol use at 3 months | 1 | 110 | Risk Ratio (M‐H, Fixed, 95% CI) | 1.13 [0.67, 1.93] |
| 2.2 Alcohol use as decreased alcohol use at 9 months | 1 | 110 | Risk Ratio (M‐H, Fixed, 95% CI) | 1.34 [0.69, 2.58] |
| Outcome or subgroup title | No. of studies | No. of participants | Statistical method | Effect size |
| 1 Continuous outcomes Show forest plot | 1 | Mean Difference (IV, Fixed, 95% CI) | Subtotals only | |
| 1.1 Alcohol use as number of standard drinks consumed per day over the last 30 days | 1 | 147 | Mean Difference (IV, Fixed, 95% CI) | ‐0.40 [‐2.03, 1.23] |
| 1.2 Illicit drug use as frequency of drug use (as measured by Addiction Severity Index ‐ ASI drug) | 1 | 147 | Mean Difference (IV, Fixed, 95% CI) | 0.0 [‐0.03, 0.03] |
| 1.3 Illicit drug use as a composite drug score (frequency*severity for all drugs taken) | 1 | 151 | Mean Difference (IV, Fixed, 95% CI) | 0.0 [‐0.42, 0.42] |
| 2 Dichotomous outcomes Show forest plot | 1 | Risk Ratio (M‐H, Fixed, 95% CI) | Subtotals only | |
| 2.1 Alcohol use as greater than 50% reduction in number of standard drinks consumed per day over the last 30 days | 1 | 166 | Risk Ratio (M‐H, Fixed, 95% CI) | 1.10 [0.82, 1.48] |
| 2.2 Alcohol abstinence as abstinence from alcohol over the last 30 days | 1 | 166 | Risk Ratio (M‐H, Fixed, 95% CI) | 0.88 [0.49, 1.58] |
| Outcome or subgroup title | No. of studies | No. of participants | Statistical method | Effect size |
| 1 Continuous outcomes Show forest plot | 1 | Mean Difference (IV, Fixed, 95% CI) | Subtotals only | |
| 1.1 Alcohol use as number of standard drinks consumed per day over the last 30 days | 1 | 155 | Mean Difference (IV, Fixed, 95% CI) | ‐0.10 [‐1.89, 1.69] |
| 1.2 Illicit drug use as frequency of drug use (as measured by Addiction Severity Index ‐ ASI drug) | 1 | 155 | Mean Difference (IV, Fixed, 95% CI) | 0.0 [‐0.03, 0.03] |
| 1.3 Illicit drug use as a composite drug score (frequency*severity for all drugs taken) | 1 | 157 | Mean Difference (IV, Fixed, 95% CI) | ‐0.10 [‐0.46, 0.26] |
| 2 Dichotomous outcomes Show forest plot | 1 | Risk Ratio (M‐H, Fixed, 95% CI) | Subtotals only | |
| 2.1 Alcohol use as greater than 50% reduction in number of standard drinks consumed per day over the last 30 days | 1 | 177 | Risk Ratio (M‐H, Fixed, 95% CI) | 0.92 [0.68, 1.26] |
| 2.2 Alcohol abstinence as abstinence from alcohol over the last 30 days | 1 | 177 | Risk Ratio (M‐H, Fixed, 95% CI) | 0.97 [0.56, 1.67] |
| Outcome or subgroup title | No. of studies | No. of participants | Statistical method | Effect size |
| 1 Continuous outcomes Show forest plot | 1 | Mean Difference (IV, Fixed, 95% CI) | Subtotals only | |
| 1.1 Alcohol use as number of days in the past 30 days with alcohol use at 1 month | 1 | 187 | Mean Difference (IV, Fixed, 95% CI) | ‐0.30 [‐3.38, 2.78] |
| 1.2 Alcohol use as number of days in the past 30 days with alcohol use at 6 months | 1 | 187 | Mean Difference (IV, Fixed, 95% CI) | ‐1.5 [‐4.56, 1.56] |
| 2 Dichotomous outcomes Show forest plot | 1 | Risk Ratio (M‐H, Fixed, 95% CI) | Subtotals only | |
| 2.1 Alcohol use as 25% reduction of drinking days in the past 30 days | 1 | 187 | Risk Ratio (M‐H, Fixed, 95% CI) | 1.23 [0.96, 1.57] |
| 2.2 Alcohol use as 50% reduction of drinking days in the past 30 days | 1 | 187 | Risk Ratio (M‐H, Fixed, 95% CI) | 1.27 [0.96, 1.68] |
| 2.3 Alcohol use as 75% reduction of drinking days in the past 30 days | 1 | 187 | Risk Ratio (M‐H, Fixed, 95% CI) | 1.21 [0.84, 1.75] |
| 2.4 Alcohol use as 1 or more drinking days' reduction in the past 30 days | 1 | 187 | Risk Ratio (M‐H, Fixed, 95% CI) | 1.12 [0.91, 1.38] |
| 2.5 Alcohol use as 7 or more drinking days' reduction in the past 30 days | 1 | 187 | Risk Ratio (M‐H, Fixed, 95% CI) | 1.67 [1.08, 2.60] |