نقش مداخله اولیه شدید رفتاری (EIBI) برای کودکان جوان مبتلا به اختلالات طیف اوتیسم (ASD)
Referencias
منابع مطالعات واردشده در این مرور
منابع مطالعات خارجشده از این مرور
منابع اضافی
منابع دیگر نسخههای منتشرشده این مرور
Characteristics of studies
Characteristics of included studies [ordered by study ID]
Ir a:
| Methods | Clinical controlled trial | |
| Participants | Location: USA Sample size: 42 children (EIBI = 21, TAU = 21) Diagnosis: autistic disorder = 35, PDD‐NOS = 7 Sex: 35 males (EIBI = 18, TAU = 17), 7 females (EIBI = 3, TAU = 4) Age range: under 48 months old at treatment onset Mean age at intake: EIBI = 30.2 (SD = 5.8) months, TAU = 33.2 (SD = 3.7) months. EIBI group was younger, on average, by 3.2 months (g = 0.61, 95% CI −0.002 to 1.21) | |
| Interventions | Intervention: EIBI — included 35 to 40 hours per week, 47 weeks per year, for 3 years Control: TAU — included eclectic treatment provided by public schools | |
| Outcomes | Primary outcome: IQ Secondary outcomes: nonverbal IQ; language; adaptive behavior; quality of life measured at post‐treatment through classroom placement | |
| Notes | Assignment to groups based on parent preferences. Children had to have IQ greater than 35. Mean pre‐treatment IQ 61.6 (SD = 16.4) for EIBI and 59.4 (SD = 14.7) for TAU; g = 0.14 (95% CI −0.46 to 0.73). Effect sizes for differences between groups for adaptive behavior and language were g = 0.09 (95% CI ‐0.51 to 0.68) and g = 0.45 (95% CI −0.15 to 1.05), respectively. | |
| Risk of bias | ||
| Bias | Authors' judgement | Support for judgement |
| Random sequence generation (selection bias) | High risk | Did not use random assignment |
| Allocation concealment (selection bias) | Unclear risk | Provided insufficient information as regards concealment |
| Blinding of participants and personnel (performance bias) | High risk | Due to nature of intervention, likely that participants and key personnel were not blinded to treatment status |
| Blinding of outcome assessment (detection bias) | High risk | Parents not blinded to treatment status and were respondents for primary outcome measure; other outcome assessors blinded to treatment status |
| Incomplete outcome data (attrition bias) | Low risk | Outcome data missing for 5/42 participants (3 EIBI and 2 TAU) |
| Selective reporting (reporting bias) | Low risk | All collected data appear to be reported |
| Protection against contamination | Low risk | No evidence reported that the comparison group received EIBI |
| Baseline measurement | High risk | EIBI group was over 3 months younger than TAU |
| Other bias | Low risk | No other sources of bias detected |
| Methods | Clinical controlled trial | |
| Participants | Location: USA Sample size: 61 children (EIBI = 29, TAU = 32) Diagnosis: autistic disorder = 45, PDD‐NOS = 16 Sex: 54 males (EIBI = 25, TAU = 29), 7 females (EIBI = 4, TAU = 3) Age range: not reported Mean age at intake: EIBI = 30.9 (SD = 5.2) months, TAU = 36 (SD = 6.1) months. EIBI group was, on average, 5.1 months younger (g = 0.90, 95% CI 0.37 to 1.42). | |
| Interventions | Intervention: EIBI — consisted of 25 to 30 hours per week Control: TAU — autism‐specific programming provided by public schools | |
| Outcomes | Primary outcome: IQ Secondary outcomes: non‐verbal IQ; language; adaptive behavior | |
| Notes | Assignment to groups made by the child's IFSP or IEP teams and based heavily on parent preferences. Mean pre‐treatment IQ 70.5 (SD = 11.9) for EIBI and 70.7 (SD = 10.5) for TAU; g = 0.11 (95% CI −0.39 to 0.61). Effect sizes for differences between groups for adaptive behavior and language were g = 0.02 (95% CI −0.48 to 0.63) and g = 0.13 (95% CI −0.37 to 0.63), respectively. | |
| Risk of bias | ||
| Bias | Authors' judgement | Support for judgement |
| Random sequence generation (selection bias) | High risk | Did not use random assignment |
| Allocation concealment (selection bias) | Unclear risk | Provided insufficient information as regards concealment |
| Blinding of participants and personnel (performance bias) | High risk | Due to nature of intervention, likely that participants and key personnel were not blinded to treatment status |
| Blinding of outcome assessment (detection bias) | High risk | Parents not blinded to treatment status and were respondents for primary outcome measure; other outcome assessors blinded to treatment status |
| Incomplete outcome data (attrition bias) | Unclear risk | Attrition not clearly reported, with some final outcome data reporting smaller sample sizes than initial assessment sample sizes |
| Selective reporting (reporting bias) | Low risk | All collected data appear to be reported |
| Protection against contamination | Low risk | No evidence reported that the comparison group received EIBI |
| Baseline measurement | High risk | EIBI group was over 5 months younger at baseline compared to TAU |
| Other bias | Low risk | No other sources of bias detected |
| Methods | Clinical controlled trial | |
| Participants | Location: UK Sample size: 44 children (EIBI = 28, TAU = 16) Diagnosis: autistic disorder = 44 Sex: 39 males (EIBI = 27, TAU = 12), 5 females (EIBI = 1, TAU = 4) Age range: 22 to 54 months old Mean age at intake: EIBI = 38.0 (SD = 7.2) months, TAU = 42.5 (SD = 7.8) months. EIBI group was, on average, 4.5 months younger (g = 0.60, 95% CI −0.02 to 1.21) | |
| Interventions | Intervention: EIBI — consisted of more than 30 hours per week Control: TAU — autism‐specific preschool programming | |
| Outcomes | Primary outcome: IQ Secondary outcomes: play; adaptive behavior; receptive and expressive language | |
| Notes | Assignment to groups based on parent preferences. Mean pre‐treatment IQ 83.0 (SD = 27.9) for EIBI and 65.2 (SD = 26.9) for TAU; d = 0.64 (95% CI 0.02 to 1.25). Effect sizes for differences between groups for adaptive behavior and language were g = 0.69 (95% CI 0.04 to 1.35) and g = 0.57 (95% CI −0.78 to 1.22), respectively. | |
| Risk of bias | ||
| Bias | Authors' judgement | Support for judgement |
| Random sequence generation (selection bias) | High risk | Did not use random assignment |
| Allocation concealment (selection bias) | Unclear risk | Provided insufficient information as regards the concealment |
| Blinding of participants and personnel (performance bias) | High risk | Due to nature of intervention, likely that participants and key personnel were not blinded to treatment status |
| Blinding of outcome assessment (detection bias) | High risk | Parents not blinded to treatment status and were respondents for primary outcome measure; other outcome assessors not blinded to treatment status |
| Incomplete outcome data (attrition bias) | Low risk | 0% attrition reported |
| Selective reporting (reporting bias) | Low risk | All collected data appear to be reported |
| Protection against contamination | Low risk | No evidence reported that the comparison group received EIBI |
| Baseline measurement | High risk | EIBI group was over 4 months younger compared to TAU group and EIBI group had higher IQ, Vineland Adaptive Behavior Scales composite, and Vineland communication scores at baseline compared to TAU |
| Other bias | Low risk | No other sources of bias detected |
| Methods | Clinical controlled trial | |
| Participants | Location: UK Sample size: 44 children (EIBI = 23, TAU = 21) Diagnosis: autistic disorder = 44 Sex: not reported Age range: 30 to 42 months old Mean age at intake: EIBI = 35.7 (SD = 4.0) months, TAU = 38.4 (SD = 4.4) months. EIBI group was, on average, 2.7 months younger (d = 0.63, 95% CI 0.04 to 1.23) | |
| Interventions | Intervention: EIBI — consisted of more than 25 hours per week Control: TAU — autism‐specific programming provided by public schools | |
| Outcomes | Primary outcome: IQ Secondary outcomes: language; adaptive behavior; joint attention; psychopathology; quality of life through parent well‐being questionnaires | |
| Notes | Assignment to groups based on parent preferences. Mean IQ at pre‐treatment 61.4 (SD = 16.4) for EIBI and 62.3 (SD = 16.6) for TAU; d = 0.05 (95% CI −0.53 to 0.64). Effect sizes for differences between groups for adaptive behavior and language were g = 0.04 (95% CI −0.54 to 0.63) and g = 0.17 (95% CI −41 to 1.02), respectively. | |
| Risk of bias | ||
| Bias | Authors' judgement | Support for judgement |
| Random sequence generation (selection bias) | High risk | Did not use random assignment |
| Allocation concealment (selection bias) | Unclear risk | Provided insufficient information as regard the concealment |
| Blinding of participants and personnel (performance bias) | High risk | Due to nature of intervention, likely that participants and key personnel were not blinded to treatment status |
| Blinding of outcome assessment (detection bias) | High risk | Parents not blinded to treatment status and were respondents for primary outcome measure; other outcome assessors blinded to treatment status |
| Incomplete outcome data (attrition bias) | Low risk | 0% attrition reported |
| Selective reporting (reporting bias) | Low risk | All collected data appear to be reported |
| Protection against contamination | Low risk | No evidence reported that the comparison group received EIBI |
| Baseline measurement | Low risk | No large differences between groups at baseline |
| Other bias | Low risk | No other sources of bias detected |
| Methods | Randomized control trial | |
| Participants | Location: USA Sample size: 28 children (EIBI = 15, TAU = 13) Diagnosis: autistic disorder = 14, PDD‐NOS = 14 Sex: 25 males (EIBI = 12, Tau = 13), 5 females (EIBI = 3, TAU = 2) Age range: 18 to 42 months old at study referral Mean age at intake: EIBI = 36.1 (SD = 6.0) months, TAU = 35.8 (SD = 5.4) months. EIBI group was, on average, 0.3 months older (d = 0.05, 95% CI −0.67 to 0.77). | |
| Interventions | Intervention: EIBI — consisted of more than 24 hours per week Control: TAU — parent training | |
| Outcomes | Primary outcome: IQ Secondary outcomes: non‐verbal IQ; language; adaptive behavior; psychopathology; quality of life measured by class placement | |
| Notes | Random assignment to groups. Children had to have IQ greater than 35 and less than 75. Mean pre‐treatment IQ was 50.5 (SD = 9.1) for EIBI and 50.7 (SD = 13.9) for TAU; d = 0.01 (95% CI ‐0.71 to 0.73). Effect sizes for differences between groups for adaptive behavior and language were g = 0.18 (95% CI −0.54 to 0.90) and g = 0.26 (95% CI −0.47 to 0.98), respectively. | |
| Risk of bias | ||
| Bias | Authors' judgement | Support for judgement |
| Random sequence generation (selection bias) | Low risk | Used a matched‐pair, random assignment procedure, based on date of intake assessment |
| Allocation concealment (selection bias) | Unclear risk | Provided insufficient information as regards the concealment |
| Blinding of participants and personnel (performance bias) | High risk | Due to nature of intervention, likely that participants and key personnel were not blinded to treatment status |
| Blinding of outcome assessment (detection bias) | High risk | Parents not blinded to treatment status and were respondents for primary outcome measure; other outcome assessors blinded to treatment status |
| Incomplete outcome data (attrition bias) | Low risk | 0% attrition reported |
| Selective reporting (reporting bias) | Low risk | All collected data appear to be reported |
| Protection against contamination | Low risk | Although the parents of the comparison group were trained in behavioral methods, there was no evidence that the control group received intensive intervention |
| Baseline measurement | Low risk | No large differences between groups at baseline |
| Other bias | Low risk | No other sources of bias detected |
CI: confidence interval
EIBI: early intensive behavioral intervention
IEP: individualized education program
IFSP: individualized family service plan
IQ: intelligence quotient
PDD‐NOS: pervasive developmental disorder, not otherwise specified
SD: standard deviation
TAU: treatment as usual
Characteristics of excluded studies [ordered by study ID]
Ir a:
| Study | Reason for exclusion |
| Not all participants began treatment before their sixth birthday | |
| Review article, not primary study | |
| Comparison group was less intensive EIBI (not TAU) | |
| Comparison group was parent‐managed EIBI in which the parents oversaw the delivery of similar intensity (hours per week of EIBI) of treatment using the same curricula, which was delivered by therapists that were hired from the same agency as clinic‐managed EIBI; hence there was no TAU comparison group. Specifically, the article states, "All children received treatment based on the UCLA [EIBI] model" (p 420) and "direct treatment staff, referred to as therapists, were hired by Wisconsin Early Autism Project staff members for both the clinic‐ and parent‐directed groups" (p 421). | |
| Review article, not primary study |
EIBI: Early intensive behavioral intervention
TAU: treatment as usual
Data and analyses
| Outcome or subgroup title | No. of studies | No. of participants | Statistical method | Effect size | ||||||||||||||||||||||||||||
| 1 Adaptive behavior Show forest plot | 5 | 202 | Mean Difference (IV, Random, 95% CI) | 9.58 [5.57, 13.60] | ||||||||||||||||||||||||||||
| Analysis 1.1  Comparison 1 Early intensive behavioral intervention (EIBI) compared to for young children with autism spectrum disorders (ASD), Outcome 1 Adaptive behavior. | ||||||||||||||||||||||||||||||||
| 2 Autism symptom severity Show forest plot | 2 | 81 | Std. Mean Difference (IV, Random, 95% CI) | ‐0.34 [‐0.79, 0.11] | ||||||||||||||||||||||||||||
| Analysis 1.2 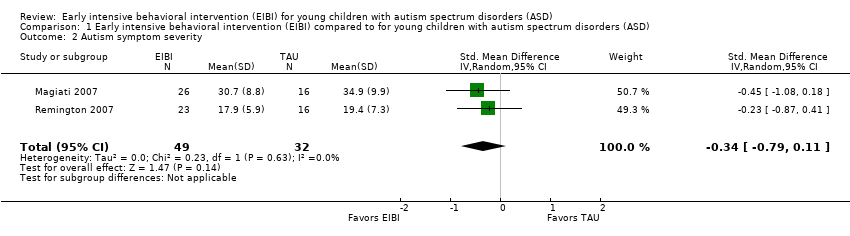 Comparison 1 Early intensive behavioral intervention (EIBI) compared to for young children with autism spectrum disorders (ASD), Outcome 2 Autism symptom severity. | ||||||||||||||||||||||||||||||||
| 3 Intelligence Show forest plot | 5 | 202 | Mean Difference (IV, Random, 95% CI) | 15.44 [9.29, 21.59] | ||||||||||||||||||||||||||||
| Analysis 1.3  Comparison 1 Early intensive behavioral intervention (EIBI) compared to for young children with autism spectrum disorders (ASD), Outcome 3 Intelligence. | ||||||||||||||||||||||||||||||||
| 4 Communication skills Show forest plot | 5 | 201 | Mean Difference (IV, Random, 95% CI) | 11.22 [5.39, 17.04] | ||||||||||||||||||||||||||||
| Analysis 1.4  Comparison 1 Early intensive behavioral intervention (EIBI) compared to for young children with autism spectrum disorders (ASD), Outcome 4 Communication skills. | ||||||||||||||||||||||||||||||||
| 5 Language skills Show forest plot | 4 | Std. Mean Difference (IV, Random, 95% CI) | Subtotals only | |||||||||||||||||||||||||||||
| Analysis 1.5  Comparison 1 Early intensive behavioral intervention (EIBI) compared to for young children with autism spectrum disorders (ASD), Outcome 5 Language skills. | ||||||||||||||||||||||||||||||||
| 5.1 Expressive language | 4 | 165 | Std. Mean Difference (IV, Random, 95% CI) | 0.51 [0.12, 0.90] | ||||||||||||||||||||||||||||
| 5.2 Receptive language | 4 | 164 | Std. Mean Difference (IV, Random, 95% CI) | 0.55 [0.23, 0.87] | ||||||||||||||||||||||||||||
| 6 Social competence Show forest plot | 5 | 201 | Mean Difference (IV, Random, 95% CI) | 6.56 [1.52, 11.61] | ||||||||||||||||||||||||||||
| Analysis 1.6  Comparison 1 Early intensive behavioral intervention (EIBI) compared to for young children with autism spectrum disorders (ASD), Outcome 6 Social competence. | ||||||||||||||||||||||||||||||||
| 7 Daily living skills Show forest plot | 5 | 201 | Mean Difference (IV, Random, 95% CI) | 7.77 [3.75, 11.79] | ||||||||||||||||||||||||||||
| Analysis 1.7 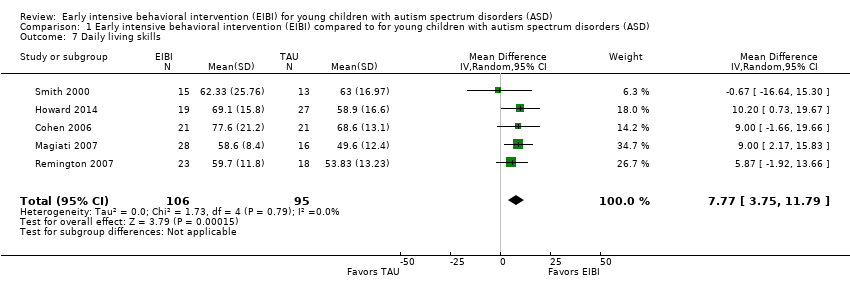 Comparison 1 Early intensive behavioral intervention (EIBI) compared to for young children with autism spectrum disorders (ASD), Outcome 7 Daily living skills. | ||||||||||||||||||||||||||||||||
| 8 Problem behavior Show forest plot | 2 | 67 | Std. Mean Difference (IV, Random, 95% CI) | ‐0.58 [‐1.24, 0.07] | ||||||||||||||||||||||||||||
| Analysis 1.8 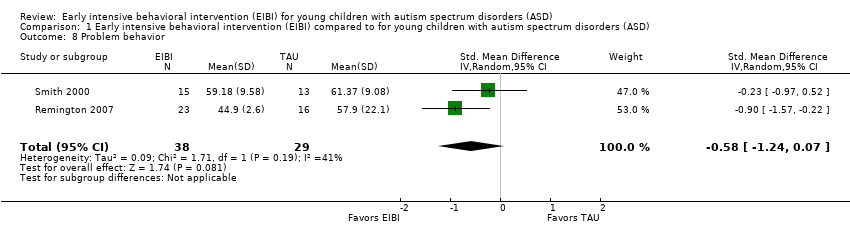 Comparison 1 Early intensive behavioral intervention (EIBI) compared to for young children with autism spectrum disorders (ASD), Outcome 8 Problem behavior. | ||||||||||||||||||||||||||||||||
| 9 Academic placement Show forest plot | Other data | No numeric data | ||||||||||||||||||||||||||||||
| Analysis 1.9
Comparison 1 Early intensive behavioral intervention (EIBI) compared to for young children with autism spectrum disorders (ASD), Outcome 9 Academic placement. | ||||||||||||||||||||||||||||||||
| 10 Parent stress Show forest plot | 1 | Std. Mean Difference (IV, Random, 95% CI) | Totals not selected | |||||||||||||||||||||||||||||
| Analysis 1.10  Comparison 1 Early intensive behavioral intervention (EIBI) compared to for young children with autism spectrum disorders (ASD), Outcome 10 Parent stress. | ||||||||||||||||||||||||||||||||

Study flow diagram.
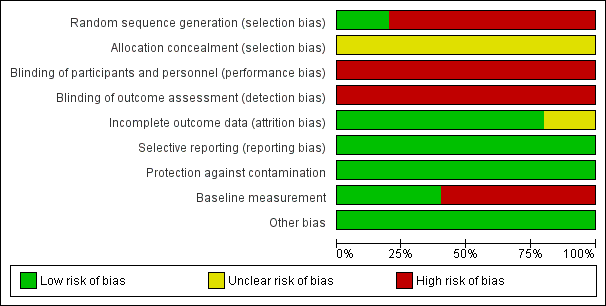
Risk of bias graph: review authors' judgements about each risk of bias item presented as percentages across all included studies.
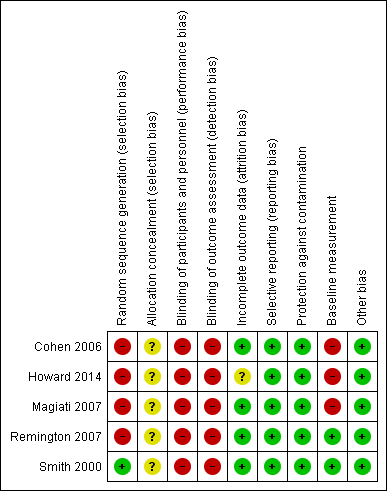
Risk of bias summary: review authors' judgements about each risk of bias item for each included study.

Forest plot of comparison: 1 Adaptive behavior, outcome: 1.1 Vineland Adaptive Behavior Scales Composite

Comparison 1 Early intensive behavioral intervention (EIBI) compared to for young children with autism spectrum disorders (ASD), Outcome 1 Adaptive behavior.

Comparison 1 Early intensive behavioral intervention (EIBI) compared to for young children with autism spectrum disorders (ASD), Outcome 2 Autism symptom severity.

Comparison 1 Early intensive behavioral intervention (EIBI) compared to for young children with autism spectrum disorders (ASD), Outcome 3 Intelligence.
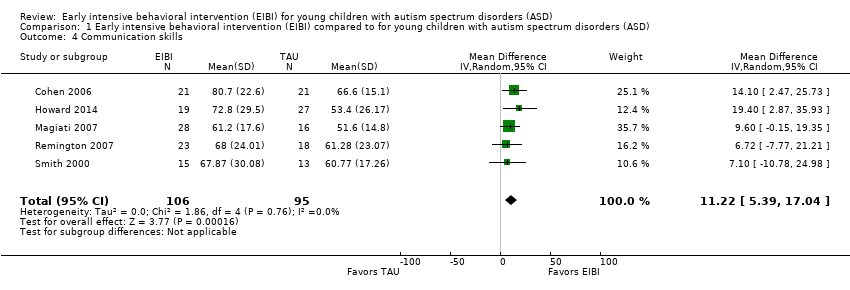
Comparison 1 Early intensive behavioral intervention (EIBI) compared to for young children with autism spectrum disorders (ASD), Outcome 4 Communication skills.

Comparison 1 Early intensive behavioral intervention (EIBI) compared to for young children with autism spectrum disorders (ASD), Outcome 5 Language skills.

Comparison 1 Early intensive behavioral intervention (EIBI) compared to for young children with autism spectrum disorders (ASD), Outcome 6 Social competence.

Comparison 1 Early intensive behavioral intervention (EIBI) compared to for young children with autism spectrum disorders (ASD), Outcome 7 Daily living skills.

Comparison 1 Early intensive behavioral intervention (EIBI) compared to for young children with autism spectrum disorders (ASD), Outcome 8 Problem behavior.
| Study | EIBI N | EIBI N for general education with no extra support | EIBI N for general education with support | TAU N | TAU N for general education with no extra support | TAU N for general education with support |
| Cohen 2006 | 21 | 6 | 11 | 21 | 0 | 1 |
| Smith 2000 | 15 | 4 | 2 | 13 | 0 | 3 |
Comparison 1 Early intensive behavioral intervention (EIBI) compared to for young children with autism spectrum disorders (ASD), Outcome 9 Academic placement.
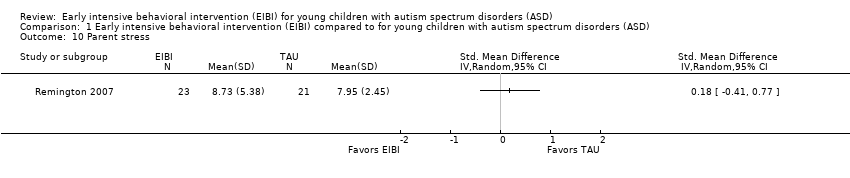
Comparison 1 Early intensive behavioral intervention (EIBI) compared to for young children with autism spectrum disorders (ASD), Outcome 10 Parent stress.
| Early intensive behavioral intervention (EIBI) for young children with autism spectrum disorders (ASD) | ||||||
| Patient or population: patients with young children (less than six years old) with autism spectrum disorders (ASD) | ||||||
| Outcomes | Illustrative comparative risks* (95% CI) | Relative effect | Number of participants | Quality of the evidence | Comments | |
| Assumed risk | Corresponding risk | |||||
| TAU | EIBI | |||||
| Adaptive behavior | The mean adaptive behavior score ranged across control groups from 48.60 points to 67.10 points | The mean adaptive behavior score in the intervention groups was, on average, 9.58 points higher (5.57 points higher to 13.6 points higher) | ‐ | 202 | ⊕⊕⊝⊝ | ‐ |
| Autism symptom severity | ‐ | The mean autism symptom severity score in the intervention groups was 0.34 standard deviations lower | ‐ | 81 | ⊕⊝⊝⊝ | General guidelines for the magnitude of an effect suggest that effect sizes of 0.20 to 0.50 are considered to have a small effect, effect sizes of 0.50 to 0.80 are considered to have a medium effect, and effect sizes greater than 0.80 are considered to have a large effect (Cohen 1988) |
| Adverse effects Measured by: worsening of adaptive behavior or autism symptom severity Follow‐up: 2 to 3 years | No adverse events were reported in any study | |||||
| Intelligence | The mean IQ score ranged across control groups from 49.67 points to 73.20 points | The mean IQ score in the intervention groups was, on average, 15.44 higher (9.29 points higher to 21.59 points higher) | ‐ | 202 | ⊕⊕⊝⊝ | ‐ |
| Communication and language skills: expressive language | ‐ | The mean expressive language score in the intervention groups was 0.51 standard deviations higher | ‐ | 165 | ⊕⊕⊝⊝ | General guidelines for the magnitude of an effect suggest that effect sizes of 0.20 to 0.50 are considered to have a small effect, effect sizes of 0.50 to 0.80 are considered to have a medium effect, and effect sizes greater than 0.80 are considered to have a large effect (Cohen 1988) |
| Communication and language skills: receptive language | ‐ | The mean receptive language score in the intervention groups was 0.55 standard deviations higher (0.23 standard deviations higher to 0.87 standard deviations higher) | ‐ | 164 | ⊕⊕⊝⊝ | General guidelines for the magnitude of an effect suggest that effect sizes of 0.20 to 0.50 are considered to have a small effect, effect sizes of 0.50 to 0.80 are considered to have a medium effect, and effect sizes greater than 0.80 are considered to have a large effect (Cohen 1988) |
| Problem behavior | ‐ | The mean problem behavior score in the intervention groups was 0.58 standard deviations lower (1.24 standard deviations lower to 0.07 standard deviations higher) | ‐ | 67 | ⊕⊝⊝⊝ | General guidelines for the magnitude of an effect suggest that effect sizes of 0.20 to 0.50 are considered to have a small effect, effect sizes of 0.50 to 0.80 are considered to have a medium effect, and effect sizes greater than 0.80 are considered to have a large effect (Cohen 1988) |
| *The basis for the assumed risk (e.g. the median control group risk across studies) is provided in footnotes. The corresponding risk (and its 95% CI) is based on the assumed risk in the comparison group and the relative effect of the intervention (and its 95% CI). ASD: autism spectrum disorders; CCT: clinical controlled trial; CI: Confidence interval; EIBI: early intensive behavioral intervention; IQ: intelligence quotient; RCT: randomized controlled trial | ||||||
| GRADE Working Group grades of evidence | ||||||
| 1One study was conducted using an RCT design (Smith 2000) and four studies were conducted using a CCT design (Cohen 2006; Howard 2014; Magiati 2007; Remington 2007). Quality of evidence rating downgraded two levels due to inclusion of non‐randomized studies and associated risks of bias. | ||||||
|
| Treatment Groups | Comparison Groups | ||||
| Study | Outcomes | Pre‐Treatment | Post‐Treatment | Pre‐Treatment | Post‐Treatment | |
| Primary | Adaptive behavior | VABS composite | VABS composite | VABS composite | VABS composite | |
| Autism severity | NA | NA | NA | NA | ||
| Secondary | IQ | BSID‐II; WPPSI‐R | BSID‐II; WPPSI‐R | BSID; WPPSI‐R | BSID‐II; WPPSI‐R | |
| Non‐verbal IQ | MPS | MPS | MPS | MPS | ||
| Non‐verbal social communication | NA | NA | NA | NA | ||
| Expressive communication | RDLS | RDLS | RDLS | RDLS | ||
| Receptive communication | RDLS | RDLS | RDLS | RDLS | ||
| Play | NA | NA | NA | NA | ||
| Social competence | VABS socialization domain | VABS socialization domain | VABS socialization domain | VABS socialization domain | ||
| Daily living skills | VABS daily living skills domain | VABS daily living skills domain | VABS daily living skills domain | VABS daily living skills domain | ||
| Academic achievement | NA | NA | NA | NA | ||
| Problem behavior | NA | NA | NA | NA | ||
| Parent stress | NA | NA | NA | NA | ||
| Academic placement | NA | Class placement | NA | Class placement | ||
| Quality of life | NA | NA | NA | NA | ||
| Primary | Adaptive behavior | VABS composite; Denver; DP‐II; RIDES | VABS composite; Denver; DP‐II; RIDES | VABS composite | VABS composite | |
| Autism severity | # of DSM‐IV criteria (APA 1994) | NA | # of DSM‐IV criteria | NA | ||
| Secondary | IQ | WPPSI‐R; BSID‐II; S‐B; DAYC; PEP‐R; DAS; DP‐II | WPPSI‐R, BSID‐II, S‐B; DAYC, PEP‐R, DAS | WPPSI‐R, BSID‐II, S‐B; DAS | WPPSI‐R, BSID‐II, S‐B; DAS | |
| Non‐verbal IQ | MPS; S‐B | MPS; S‐B; Leiter‐R | MPS; S‐B | MPS; S‐B; Leiter‐R | ||
| Non‐verbal social communication | NA | NA | NA | NA | ||
| Expressive communication | RDLS; ITLS; REEL‐R; PLS‐3; ITDA; EVT; DP‐II | RDLS; ITLS; REEL‐R; PLS‐3; ITDA; EVT; EOWPVT | RDLS; ITLS; REEL‐R; PLS‐3; ITDA; EVT; DP‐II | RDLS; ITLS; REEL‐R; PLS‐3; ITDA; EVT; EOWPVT | ||
| Receptive communication | RDLS; ITLS; REEL‐R; PLS‐3; ITDA; PPVT‐III; DP‐II | RDLS; ITLS; REEL‐R; PLS‐3; PPVT‐III; ROWPVT; ITDA‐1 | RDLS; ITLS; REEL‐R; PLS‐3; PPVT‐III; DP‐II; ITDA‐1 | RDLS; ITLS; REEL‐R; PLS‐3; PPVT‐III, ROWPVT; ITDA‐1 | ||
| Play | NA | NA | NA | NA | ||
| Social competence | VABS socialization domain | VABS socialization domain | VABS socialization domain | VABS socialization domain | ||
| Daily living skills | VABS daily living skills domain | VABS daily living skills domain | VABS daily living skills domain | VABS daily living skills domain | ||
| Academic achievement | NA | NA | NA | NA | ||
| Problem behavior | NA | NA | NA | NA | ||
| Parent stress | NA | NA | NA | NA | ||
| Academic placement | NA | NA | NA | NA | ||
| Quality of life | NA | NA | NA | NA | ||
| Primary | Adaptive behavior | VABS composite | VABS composite | VABS composite | VABS composite | |
| Autism severity | ADI‐R | ADI‐R | ADI‐R | ADI‐R | ||
| Secondary | IQ | WPPSI‐R; BSID‐R; MPS | WPPSI‐R; BSID‐R; MPS | WPPSI‐R; BSID‐R; MPS | WPPSI‐R; BSID‐R; MPS | |
| Non‐verbal IQ | NA | NA | NA | NA | ||
| Non‐verbal social communication | NA | NA | NA | NA | ||
| Expressive communication | EOWPVT‐R | EOWPVT‐R | EOWPVT‐R | EOWPVT‐R | ||
| Receptive communication | BPVS‐II | BPVS‐II | BPVS‐II | BPVS‐II | ||
| Play | SPT‐II | SPT‐II | SPT‐II | SPT‐II | ||
| Social competence | VABS socialization domain | VABS socialization domain | VABS socialization domain | VABS socialization domain | ||
| Daily living skills | VABS daily living skills domain | VABS daily living skills domain | VABS daily living skills domain | VABS daily living skills domain | ||
| Academic achievement | NA | NA | NA | NA | ||
| Problem behavior | NA | NA | NA | NA | ||
| Parent stress | NA | NA | NA | NA | ||
| Academic placement | NA | NA | NA | NA | ||
| Quality of life | NA | NA | NA | NA | ||
| Primary | Adaptive behavior | VABS composite | VABS composite | VABS composite | VABS composite | |
| Autism severity | ASQ | ASQ | ASQ | ASQ | ||
| Secondary | IQ | BSID‐R; S‐B | BSID‐R; S‐B | BSID‐R; S‐B | BSID‐R; S‐B | |
| Non‐verbal IQ | NA | NA | NA | NA | ||
| Non‐verbal social communication | ESCS | ESCS | ESCS | ESCS | ||
| Expressive communication | RDLS | RDLS | RDLS | RDLS | ||
| Receptive communication | RDLS | RDLS | RDLS | RDLS | ||
| Play | NA | NA | NA | NA | ||
| Social competence | VABS socialization domain | VABS socialization domain | VABS socialization domain | VABS socialization domain | ||
| Daily living skills | VABS daily living skills domain | VABS daily living skills domain | VABS daily living skills domain | VABS daily living skills domain | ||
| Academic achievement | NA | NA | NA | NA | ||
| Problem behavior | DCBC | DCBC | DCBD | DCBD | ||
| Parent stress | QRS‐F parent and family problems subscale | QRS‐F parent and family problems subscale | QRS‐F parent and family problems subscale | QRS‐F parent and family problems subscale | ||
| Academic placement | NA | NA | NA | NA | ||
| Quality of life | NA | NA | NA | NA | ||
| Primary | Adaptive behavior | VABS composite | VABS composite | VABS composite | VABS composite | |
| Autism severity | NA | NA | NA | NA | ||
| Secondary | IQ | BSID‐R; S‐B | BSID‐R; S‐B | BSID‐R; S‐B | BSID‐R; S‐B | |
| Non‐verbal IQ | MPS | MPS | MPS | MPS | ||
| Non‐verbal social communication | NA | NA | NA | NA | ||
| Expressive communication | RDLS | RDLS | RDLS | RDLS | ||
| Receptive communication | RDLS | RDLS | RDLS | RDLS | ||
| Play | NA | NA | NA | NA | ||
| Social competence | VABS socialization domain | VABS socialization domain | VABS socialization domain | VABS socialization domain | ||
| Daily living skills | VABS daily living skills domain | VABS daily living skills domain | VABS daily living skills domain | VABS daily living skills domain | ||
| Academic achievement | WIAT; ELM | WIAT | WIAT | WIAT | ||
| Problem behavior | CBCL | CBCL | CBCL | CBCL | ||
| Parent stress | NA | NA | NA | NA | ||
| Academic placement | Class placement | Class placement | Class placement | Class placement | ||
| Quality of life | NA | NA | NA | NA | ||
| ADI‐R: Autism Diagnostic Interview ‐ Revised (Lord 1994) | ||||||
| 'Risk of bias' item | Question | How risk of bias was assessed |
| Sequence generation | Was the sequence generation method used adequate? | We judged the risk of bias as follows:
|
| Allocation concealment | Was allocation adequately concealed? | We judged the risk of bias as follows:
|
| Blinding of participants and personnel | Were participants and personnel blind to which participants were in the treatment group? | We judged the risk of bias as follows:
|
| Blinding of outcome assessment | Were outcome assessors blind to which participants were in the treatment group? | We judged the risk of bias as follows:
|
| Incomplete outcome data | Did the trial authors deal adequately with missing data? | We judged the risk of bias as follows:
|
| Selective outcome reporting | Did the authors of the trial omit to report on any of their outcomes? | We judged the risk of bias as follows:
|
| Protection against contamination | Could the control group also have received the intervention? | We judged the risk of bias as follows:
|
| Baseline measurements | Were the intervention and control groups similar at baseline for chronological age, IQ, adaptive behavior skills, and communication skills? | We judged the risk of bias as follows:
|
| Other potential sources of bias | Through assessment, we determined whether any other source of bias was present in the trial, such as changing methods during the trial, or other anomalies. | We judged the risk of bias as follows:
|
| IQ: intelligence quotient | ||
| Analysis | Description of method | Reason not used |
| Measurement of treatment effect | Continuous data If outcomes are measured on a consistent scale across studies, we will calculate the effect of each study using the mean difference effect size. | As we needed to use the standardized mean difference (SMD) across most outcomes, we decided to report all effect sizes using the SMD effect size. |
| Dichotomous data If we locate dichotomous data, we will calculate a risk ratio with a 95% confidence interval for each outcome in each trial (Deeks 2017). | We did not locate dichotomous data. | |
| Unit of analysis issues | Cluster‐randomized trials If we locate cluster‐randomized trials, we will analyze them in accordance with the methods outlined in the Cochrane Handbook for Systematic Reviews of Interventions (Higgins 2011, 16.3). | We did not find cluster‐randomized trials. |
| Multiple treatment groups If we locate data from studies with multiple treatment groups, we will analyze each intervention group separately by dividing the sample size for the common comparator groups proportionately across each comparison (Higgins 2011, 16.5.5). | ||
| Assessment of reporting bias | If we identify 10 or more studies, we will draw funnel plots (estimated differences in treatment effects against their standard error). Asymmetry could be due to publication bias, but could also be due to a real relation between trial and effect size, such as when larger trials have lower compliance and compliance is positively related to effect size (Sterne 2011). If we find such a relation, we will examine clinical variation between the studies (Sterne 2011, 10.4). As a direct test for publication bias, we will conduct sensitivity analyses to compare the results from published data with data from other sources. We will do a funnel plot in an update of the review if enough additional trials are located. | We did not locate enough studies to assess reporting bias. |
| Subgroup analyses | If we locate enough trials, we will examine possible clinical and methodological heterogeneity using subgroup analyses. The possible subgroups that we will examine, if present, are: intervention density (intensity) and duration; type of comparison group (for example, home‐based TAU, school‐based TAU, no treatment control), and pre‐treatment participant characteristics (for example, chronological age, symptom severity, IQ, communicative ability, and level of adaptive behavior). | We did not conduct subgroup analyses due to the small number of included trials. |
| Sensitivity analyses | If we locate enough trials, we will explore the impact of studies with high risk of bias on the robustness of the results of the review in sensitivity analyses by removing studies with a high risk of bias on baseline measurements and blinding of outcome assessment, and reanalyzing the remaining studies to determine whether these factors affected the results. | We did not conduct sensitivity analyses due to the small number of included trials. |
| CCTs: controlled clinical trials | ||
| Outcome or subgroup title | No. of studies | No. of participants | Statistical method | Effect size |
| 1 Adaptive behavior Show forest plot | 5 | 202 | Mean Difference (IV, Random, 95% CI) | 9.58 [5.57, 13.60] |
| 2 Autism symptom severity Show forest plot | 2 | 81 | Std. Mean Difference (IV, Random, 95% CI) | ‐0.34 [‐0.79, 0.11] |
| 3 Intelligence Show forest plot | 5 | 202 | Mean Difference (IV, Random, 95% CI) | 15.44 [9.29, 21.59] |
| 4 Communication skills Show forest plot | 5 | 201 | Mean Difference (IV, Random, 95% CI) | 11.22 [5.39, 17.04] |
| 5 Language skills Show forest plot | 4 | Std. Mean Difference (IV, Random, 95% CI) | Subtotals only | |
| 5.1 Expressive language | 4 | 165 | Std. Mean Difference (IV, Random, 95% CI) | 0.51 [0.12, 0.90] |
| 5.2 Receptive language | 4 | 164 | Std. Mean Difference (IV, Random, 95% CI) | 0.55 [0.23, 0.87] |
| 6 Social competence Show forest plot | 5 | 201 | Mean Difference (IV, Random, 95% CI) | 6.56 [1.52, 11.61] |
| 7 Daily living skills Show forest plot | 5 | 201 | Mean Difference (IV, Random, 95% CI) | 7.77 [3.75, 11.79] |
| 8 Problem behavior Show forest plot | 2 | 67 | Std. Mean Difference (IV, Random, 95% CI) | ‐0.58 [‐1.24, 0.07] |
| 9 Academic placement Show forest plot | Other data | No numeric data | ||
| 10 Parent stress Show forest plot | 1 | Std. Mean Difference (IV, Random, 95% CI) | Totals not selected | |