| 1 Step frequency (16 months): Risk of developmental delay (% alternate steps) Show forest plot | 1 | | Mean Difference (IV, Random, 95% CI) | Totals not selected |
|
| 2 Step quality (11 months): Risk of developmental delay (% toe contact) Show forest plot | 1 | | Mean Difference (IV, Random, 95% CI) | Totals not selected |
|
| 3 Step quality (16 months): Risk of developmental delay [% toe contact] Show forest plot | 1 | | Mean Difference (IV, Random, 95% CI) | Totals not selected |
|
| 4 Age of onset of independent walking Show forest plot | 2 | 58 | Mean Difference (IV, Random, 95% CI) | ‐2.08 [‐5.38, 1.22] |
|
| 4.1 Risk of developmental delay | 1 | 28 | Mean Difference (IV, Random, 95% CI) | ‐0.60 [‐2.34, 1.14] |
| 4.2 Down syndrome | 1 | 30 | Mean Difference (IV, Random, 95% CI) | ‐4.0 [‐6.96, ‐1.04] |
| 5 Age of onset of walking with assistance (days in study) Show forest plot | 2 | 58 | Mean Difference (IV, Random, 95% CI) | ‐38.54 [‐106.13, 29.05] |
|
| 5.1 Down syndrome | 1 | 30 | Mean Difference (IV, Random, 95% CI) | ‐74.0 [‐135.40, ‐12.60] |
| 5.2 Risk of developmental delay | 1 | 28 | Mean Difference (IV, Random, 95% CI) | ‐5.0 [‐62.11, 52.11] |
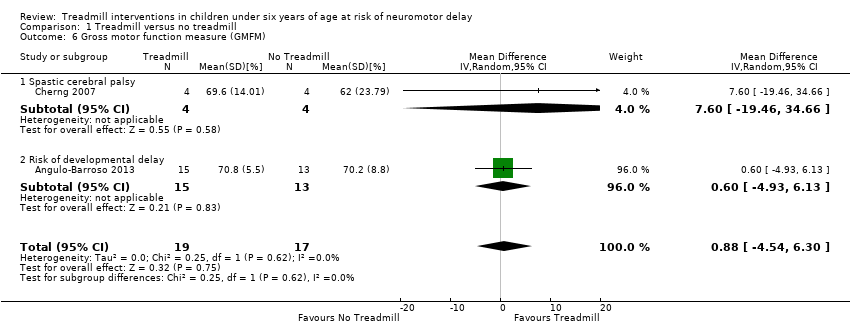
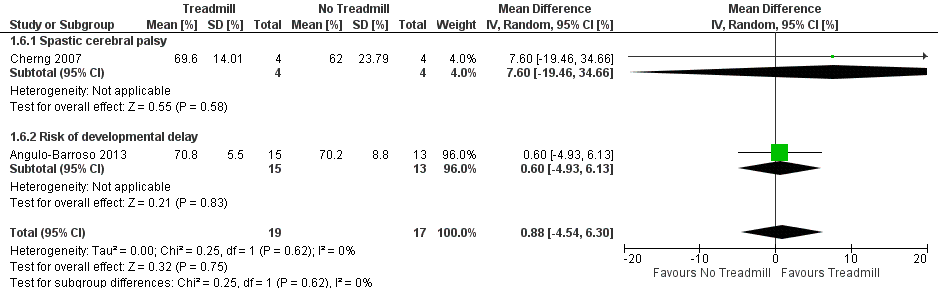
| 6 Gross motor function measure (GMFM) Show forest plot | 2 | 36 | Mean Difference (IV, Random, 95% CI) | 0.88 [‐4.54, 6.30] |
|
| 6.1 Spastic cerebral palsy | 1 | 8 | Mean Difference (IV, Random, 95% CI) | 7.60 [‐19.46, 34.66] |
| 6.2 Risk of developmental delay | 1 | 28 | Mean Difference (IV, Random, 95% CI) | 0.60 [‐4.93, 6.13] |
| 7 Gross motor function related to standing (GMFM) ‐ Dimension D Show forest plot | 2 | 32 | Mean Difference (IV, Random, 95% CI) | 5.41 [‐1.61, 12.43] |
|
| 7.1 Spastic cerebral palsy | 1 | 12 | Mean Difference (IV, Random, 95% CI) | 11.57 [0.05, 23.09] |
| 7.2 Developmental delay | 1 | 20 | Mean Difference (IV, Random, 95% CI) | 3.33 [1.43, 5.23] |
| 8 Gross motor function related to walking, running and jumping (GMFM) ‐ Dimension E Show forest plot | 2 | 32 | Mean Difference (IV, Random, 95% CI) | 4.51 [0.29, 8.73] |
|
| 8.1 Spastic cerebral palsy | 1 | 12 | Mean Difference (IV, Random, 95% CI) | 3.01 [‐1.11, 7.13] |
| 8.2 Developmental delay | 1 | 20 | Mean Difference (IV, Random, 95% CI) | 7.60 [0.88, 14.32] |
| 9 Peabody Developmental Motor Scales ‐ 2: Spastic cerebral palsy Show forest plot | 1 | | Mean Difference (IV, Random, 95% CI) | Totals not selected |
|
| 10 Pediatric Evaluation of Disability Inventory ‐ Mobility Scale scores: Spastic cerebral palsy Show forest plot | 1 | | Mean Difference (IV, Random, 95% CI) | Totals not selected |
|
| 11 Other gait parameters ‐ velocity Show forest plot | 2 | 32 | Mean Difference (IV, Random, 95% CI) | 0.23 [0.08, 0.37] |
|
| 11.1 Spastic cerebral palsy | 1 | 12 | Mean Difference (IV, Random, 95% CI) | 0.18 [‐0.09, 0.45] |
| 11.2 Developmental delay | 1 | 20 | Mean Difference (IV, Random, 95% CI) | 0.25 [0.08, 0.42] |
| 12 Other gait parameters ‐ velocity (follow‐up when walking independently): Risk of developmental delay Show forest plot | 1 | | Mean Difference (IV, Random, 95% CI) | Totals not selected |
|
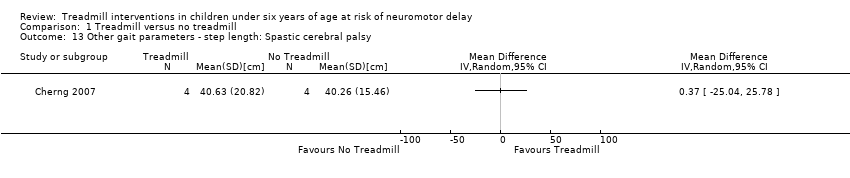
| 13 Other gait parameters ‐ step length: Spastic cerebral palsy Show forest plot | 1 | | Mean Difference (IV, Random, 95% CI) | Totals not selected |
|
| 14 Other gait parameters ‐ step length (follow‐up when walking independently): Risk of developmental delay Show forest plot | 1 | | Mean Difference (IV, Random, 95% CI) | Totals not selected |
|
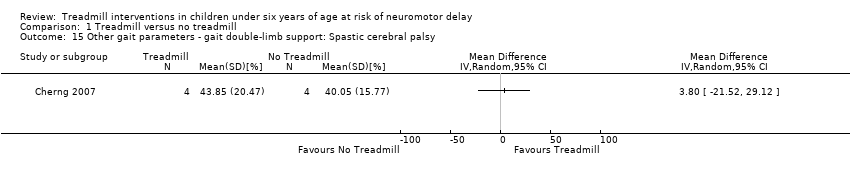
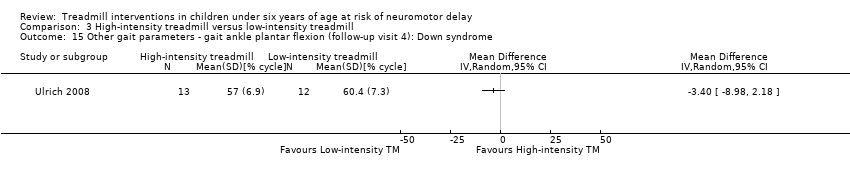
| 15 Other gait parameters ‐ gait double‐limb support: Spastic cerebral palsy Show forest plot | 1 | | Mean Difference (IV, Random, 95% CI) | Totals not selected |
|
| 16 Other gait parameters ‐ gait double‐limb support (follow‐up when walking independently): Risk of developmental delay Show forest plot | 1 | | Mean Difference (IV, Random, 95% CI) | Totals not selected |
|


![Forest plot of comparison: 1 Treadmill vs No Treadmill, outcome: 1.20 Age of onset of walking with assistance [days in study].](/es/cdsr/doi/10.1002/14651858.CD009242.pub3/media/CDSR/CD009242/image_n/nCD009242-AFig-FIG05.png)


![Comparison 1 Treadmill versus no treadmill, Outcome 3 Step quality (16 months): Risk of developmental delay [% toe contact].](/es/cdsr/doi/10.1002/14651858.CD009242.pub3/media/CDSR/CD009242/image_n/nCD009242-CMP-001-03.png)