Intervenciones con cintas de correr en niños menores de seis años de edad con riesgo de retraso neuromotor
Referencias
References to studies included in this review
References to studies excluded from this review
References to ongoing studies
Additional references
References to other published versions of this review
Characteristics of studies
Characteristics of included studies [ordered by study ID]
| Methods | Randomised controlled trial | |
| Participants | Number randomised: 41 infants with moderate risk for neuromotor disabilities were initially randomised (25 intervention, 16 control). Number analysed: 28 were analysed (13 control: 9 male, 4 female; 15 intervention: 9 male, 6 female). Dropouts/withdrawals: 10 intervention (6 did not follow protocol, 3 voluntarily withdrew, 1 diagnosed with genetic disorder), 3 control (1 unable to schedule data collection, 1 diagnosed with genetic disorder, 1 received Botox injections on multiple occasions). All participants entered the study when they were able to take 10 steps on the treadmill in 1 minute (minimum age: 6 months; maximum age: 13 months, to guarantee minimum length of TM training). Of the included infants, 18 were low‐birth‐weight (< 1500 g), 21 had low gestational age (< 32 weeks), 22 had a brain insult, 15 received prolonged ventilator use, 11 were from multiple births. Mean age (SD): control 9.0 (1.4) months; intervention 9.7 (1.3) months. Ethnicity: no information available. | |
| Interventions | Control:
Intervention:
| |
| Outcomes |
From unpublished data obtained from Chen 2008:
| |
| Notes | Country: USA. Funding source: This work was funded by a research grant from the U.S. Office of Special Education & Rehabilitative Services (H324C040016) awarded to the first author. Comment: This study was initially recorded as Chen 2008 since, at the time of the original review, data were unpublished but obtained from the author. For the update, the trial was published and, at this point, for Angulo‐Barroso 2013, we included unpublished data from Chen and published data on the actual paper. | |
| Risk of bias | ||
| Bias | Authors' judgement | Support for judgement |
| Random sequence generation (selection bias) | Low risk | Comment: Eligible participants were randomised to either treadmill training group or the control group by a statistician using a computer programme for group allocation, considering 3 stratification factors: age, gender, and birth weight. All participants were assigned an ID, which was entered into the computer by a statistician to conduct the participant's allocation. |
| Allocation concealment (selection bias) | Low risk | Comment: The information (see support for judgement above) was provided to the project coordinator and home assessment personnel but maintained the laboratory assessors blind to group allocation. |
| Blinding of participants and personnel (performance bias) | High risk | Comment: No blinding. |
| Blinding of outcome assessment (detection bias) | Low risk | Comment: The laboratory assessors were blind to group allocation. |
| Incomplete outcome data (attrition bias) | Unclear risk | Treadmill training:
Control:
|
| Selective reporting (reporting bias) | Low risk | Comment: No evidence of reporting bias. |
| Other bias | Unclear risk | Comment: None noted. |
| Methods | Randomised controlled trial (cross‐over design: AAB, ABA). | |
| Participants | Number randomised: 20 children were screened and 12 children met the inclusion criteria, but only 8 children joined the study program; they were control and crossed over to intervention. They all had a diagnosis of spastic cerebral palsy (two females and six males). Number analysed: 8 children (2 female, 6 male). Dropouts/withdrawals: none. Mean age (SD): not reported; age range from 3.5 to 6.3 years. Ethnicity: not reported. | |
| Interventions | Control (A):
Intervention (B):
| |
| Outcomes |
| |
| Notes | Country: Taiwan. Funding source: This study was supported by NSC 92‐2218‐E‐006‐003 and through a collaboration of National Cheng Kung University and Chi Mei Medical Center. | |
| Risk of bias | ||
| Bias | Authors' judgement | Support for judgement |
| Random sequence generation (selection bias) | Unclear risk | Comment: The children were divided equally into 2 groups and randomly assigned to the schedules. |
| Allocation concealment (selection bias) | High risk | Comment: Cross‐sectional trial. |
| Blinding of participants and personnel (performance bias) | High risk | Comment: No blinding. |
| Blinding of outcome assessment (detection bias) | Low risk | Comment: One independent therapist, who was not aware of any child's grouping or stage within the study, took all the measurements on gait parameters. |
| Incomplete outcome data (attrition bias) | Low risk | Regular therapeutic treatment
Treadmill training
|
| Selective reporting (reporting bias) | High risk | Quote: "Outcomes measures included muscle tone..." Comment: no data about muscle tone provided. |
| Other bias | Unclear risk | Comment: We did not have enough information to make a judgement. |
| Methods | Quasi‐randomised controlled trial. | |
| Participants | Number randomised: 22 infants with Down syndrome randomised (10 intervention; 12 control). Number of males and females not reported. Number analysed: 22 infants. Dropouts/withdrawals: five infants discontinued the intervention in the control group. Mean age (SD): 21.4 (4.0) months. Ethnicity: not reported. | |
| Interventions | Control group:
Intervention:
| |
| Outcomes |
| |
| Notes | Country: USA. Funding source: Funds provided by the Foundation for Physical Therapy PODS II awards to Dr Looper, a grant from the Michigan Physical Therapy Association, and a grant from the Rackham Graduate School, University of Michigan. | |
| Risk of bias | ||
| Bias | Authors' judgement | Support for judgement |
| Random sequence generation (selection bias) | Unclear risk | Comment: The participants were randomly assigned to groups based on a random list of 1 (treadmill) and 2 (treadmill plus orthoses) from random.org. The first participant who entered the study (convenience sample) was assigned to the first number on the list, the second participant to the second number, the third to the third, etc. |
| Allocation concealment (selection bias) | Unclear risk | Comment: No information provided as regards how the allocation process took place. |
| Blinding of participants and personnel (performance bias) | High risk | Comment: Neither personnel nor participants were blinded. |
| Blinding of outcome assessment (detection bias) | High risk | Comment: No blinding. |
| Incomplete outcome data (attrition bias) | High risk | Orthosis and treadmill training:
Treadmill training alone:
|
| Selective reporting (reporting bias) | High risk | Comment: Anthropometric measurements were taken at each monthly visit, and treadmill training was videotaped. No information on either measurement or video assessment was reported. Also, age of onset of independent walking was not directly reported and the authors provided information about study duration only. |
| Other bias | Unclear risk | Comment: We did not have enough information to make a judgement. |
| Methods | Randomised controlled trial. | |
| Participants | Number randomised: 24 infants with developmental delay met the inclusion criteria and were randomised (12 intervention; 12 control). Number of males and females not reported at this point. Number analysed: 21 infants (12 intervention, 9 males and 3 females; 9 control, 8 males, 1 female). Dropouts/withdrawals: three infants discontinued the intervention in the control group. Mean age (SD): not reported; age ranged from 2 to 5 years (participants were aged 26 to 51 months in intervention group; participants were aged 27 to 48 months in control group). Ethnicity: intervention group: 58.33% white, 25% black, 16.67% other; Control group: 90% white, 0% black, 10% other. | |
| Interventions | Control:
Intervention:
| |
| Outcomes |
| |
| Notes | Country: USA. Funding source: Grant support: NIGMS IDEA Program award P30 GM110702. | |
| Risk of bias | ||
| Bias | Authors' judgement | Support for judgement |
| Random sequence generation (selection bias) | Low risk | Comment: Participants were randomised to the control or treatment group using a computer‐generated randomisation chart. |
| Allocation concealment (selection bias) | Unclear risk | Comment: No information provided. |
| Blinding of participants and personnel (performance bias) | High risk | Comment: No blinding. |
| Blinding of outcome assessment (detection bias) | Low risk | Comment: The testers established inter‐rater reliability: ICC more than 0.90 for each test. |
| Incomplete outcome data (attrition bias) | Low risk | Treadmill training:
Control:
|
| Selective reporting (reporting bias) | Low risk | Comment: no evidence of reporting bias. |
| Other bias | Unclear risk | Comment: none noted. |
| Methods | Controlled clinical trial. | |
| Participants | Number randomised: 15 children with diagnosis of cerebral palsy (GMFCS levels I and II), who were able to sit for at least 30 seconds unsupported and demonstrated the ability to take 10 consecutive steps when held on hands or torso, were included. 12 children completed the study. Number analysed: 12 children were quasi‐randomised and matched by GMFCS levels and age. 6 intervention (3 boys, 3 girls), 6 control (5 boys, 1 girl). Dropouts/withdrawals: 3 (1 child became ill and had to be hospitalised, 1 child dropped out because family reasons, 1 child received genetic diagnosis therefore had to be excluded). Mean age (SD): intervention 21.7 (6.5, range 15.5 to 32) months, control 21.3 (6.07, range 13.5 to 30.5) months. Ethnicity: 2 African‐American, 2 Asian, 2 Hispanic, 6 white. | |
| Interventions | Control:
Intervention
| |
| Outcomes |
| |
| Notes | Country: USA. Funding source: Supported by a paediatric section research grant of the American Physical Therapy Association (grant number: 527109). | |
| Risk of bias | ||
| Bias | Authors' judgement | Support for judgement |
| Random sequence generation (selection bias) | Unclear risk | Comment: Explained in CONSORT diagram, but no information in the text as regards how the randomisation took place. |
| Allocation concealment (selection bias) | Unclear risk | Comment: The children were quasi‐randomised by the principal investigators and matched by GMFCS levels and age. |
| Blinding of participants and personnel (performance bias) | High risk | Comment: No blinding. All participants aware of group allocation. No blinding of personnel, but blinding for some outcome measures. |
| Blinding of outcome assessment (detection bias) | Low risk | Comment: Blinding for the GMFM‐66 and PDMS‐2 was achieved by videotaping the children's gross motor skills in their homes. The videotapes were subsequently reviewed by a physical therapist who was blinded to group allocation. |
| Incomplete outcome data (attrition bias) | Low risk | Comment: All outcomes were reported. |
| Selective reporting (reporting bias) | Low risk | Comment: No evidence of reporting bias. |
| Other bias | Unclear risk | Comment: None noted. |
| Methods | Randomised controlled trial. | |
| Participants | Number randomised: 32 infants with Down syndrome, randomised into 2 groups (16 intervention; 16 control); total number of males and females was not provided. Enrolled when able to sit for 30 seconds. Number analysed: 30 (15 intervention (no breakdown by sex was provided for this group), 15 control (8 male, 7 female)). Dropouts/withdrawals: 2 infants discontinued the intervention (one in each group) and 2 more were lost to gait follow‐up (one in each group), as reported in Wu 2007. Any discrepancies in the paper were resolved through oral discussion between MV and RA who was one of the authors involved in both this study and in Ulrich 2008, and who was also a review author. Average age at entry: mean 10.1 months (SD 1.94). Mean age (SD): control 10.2 (2.2) months, intervention 9.9 (1.7) months. Ethnicity: 2 mixed race; remaining participants were white. | |
| Interventions | Control:
Intervention:
| |
| Outcomes |
| |
| Notes | Country: USA (Indiana, Tennesse, Ohio). Funding sources: Grants from the National Institute for Disability and Rehabilitation Research and from the March of Dimes Birth Defects Foundation. Other comments: The control group from this study was also used in another paper (Wu 2007) that relates to Ulrich 2008. | |
| Risk of bias | ||
| Bias | Authors' judgement | Support for judgement |
| Random sequence generation (selection bias) | Low risk | Comment: Infants were randomised into two groups. In addition, Wu 2007 reported on the use of a table of random numbers |
| Allocation concealment (selection bias) | Unclear risk | Comment: We obtained the following information from another publication of the same study (Wu 2007): Quote: "The randomisation procedure was conducted by the fourth investigator for the two cohorts separately via a table of random numbers". Comment: This means that each randomisation was conducted separately with the involvement of only the 4th author and with the use of a table of random numbers. This does not give us enough information to make a judgement |
| Blinding of participants and personnel (performance bias) | High risk | Comment: Neither participants nor personnel were blinded. Infants in the treadmill intervention group had treadmills placed in their homes. Parents were trained to implement the training. A team of researchers visited all participants bi‐weekly throughout the study. Infants were videoed on the treadmill and their growth was assessed and parents maintained a log book that was read by a research staff member during each visit. Parents were asked to include information regarding the dates and length of their paediatric physical therapy sessions, the general activities that the therapist prescribed for parent implementation, and an estimate of the amount of time the parent spent implementing physical therapy activities at home. |
| Blinding of outcome assessment (detection bias) | High risk | Comment: Assessors were aware of infant's group assignment. |
| Incomplete outcome data (attrition bias) | Low risk | Comment: Treadmill training. One dropout was not reported in this paper but was reported in Wu 2007 (the same control group was used for this paper). |
| Selective reporting (reporting bias) | High risk | Comment: Not all outcomes were reported. |
| Other bias | Unclear risk | Comment: All parents were asked to keep a log book, including information regarding treadmill training (for those in the experimental group) and any other relevant information regarding the infant's health state and daily activities, including any therapeutic session administered other than treadmill training. Quote: "Given that there were no group differences on the 11 anthropometric measures at entry, it appears that randomisation process resulted in producing comparable treatment groups". |
| Methods | Randomised controlled trial. | |
| Participants | Number randomised: 36 infants with Down syndrome were randomised into two groups: low‐intensity (15 children) and high‐intensity (19 children). There were another two infants with unknown initial group allocation who withdrew from the study for emerging medical conditions. All participants were included when they were able to take 6 steps per minute on a treadmill while being supported. Number analysed: 30 children were analysed in the final sample (16 high‐intensity training (12 males, 4 females), 14 low‐intensity training (6 males, 8 females); (28 with trisomy 21; two with mosaic type). Dropouts/withdrawals: 6 infants discontinued the intervention (4 low‐intensity, 2 high‐intensity). An additional 5 infants were lost to gait follow‐up (2 low‐intensity, 3 high‐intensity). Any discrepancies in the paper were resolved through oral discussion between MV and RA who was one of the authors involved in both Ulrich 2001 and this study, and who was also a review author. Corrected age at entry; mean (SD): higher‐intensity group 9.65 (1.61) months, lower‐intensity group 10.40 (2.14) months. Ethnicity: 2 African American, 2 bi‐racial, and remaining infants were white. | |
| Interventions | Control group (low‐intensity treadmill training):
Experimental group (high‐intensity treadmill training):
Four additional publications (Wu 2007; Angulo‐Barroso 2008; Wu 2008; Wu 2010) dealt with the follow‐up from this intervention including assessments from 1 to 15 months postwalking onset (i.e. after termination of the intervention). | |
| Outcomes | The study reported frequency of alternating treadmill steps and onset of assisted and independent walking. The follow‐up publications reported on spatio‐temporal variables, joint kinematics, and gait adaptation parameters. In addition, Wu 2007 presented follow‐up on spatio‐temporal gait variables, including a historical control group from Ulrich 2001 (we did not use these data as the study was not randomised). Publication Wu 2007
Publication Angulo‐Barroso 2008
Publication Wu 2008
Publication Wu 2010
| |
| Notes | Country: USA (Michigan, Ohio, Indiana). Funding sources: Research grant from the US Office of Special Education and Rehabilitative Services (H324C010067), a US Office of Special Education Programs Leadership Training Grant (H325D020028), and the Steelcase Foundation in Michigan. | |
| Risk of bias | ||
| Bias | Authors' judgement | Support for judgement |
| Random sequence generation (selection bias) | Low risk | Comment: Used a random numbers table to assign to either low‐intensity training group or high‐intensity training group (described in Wu 2007). |
| Allocation concealment (selection bias) | Unclear risk | Comment: We obtained the following information from another publication of the same study (Wu 2007): Quote: "The randomisation procedure was conducted by the fourth investigator for the two cohorts separately via a table of random numbers." Comment: This means that each randomisation was conducted separately with the involvement of only the 4th author and with the use of a table of random numbers. This did not give us enough information to make a judgement. |
| Blinding of participants and personnel (performance bias) | High risk | Comment: No blinding of participants or personnel. |
| Blinding of outcome assessment (detection bias) | High risk | Comment: No blinding of outcome assessment. |
| Incomplete outcome data (attrition bias) | Low risk | High‐intensity treadmill training:
Low‐intensity treadmill training:
|
| Selective reporting (reporting bias) | Unclear risk | Comment: It is not clear if all data are reported. |
| Other bias | Unclear risk | Comment: We did not have enough information to make a judgement. |
BWSTT: Body weight supported treadmill training.
CONSORT: Consolidated Standards of Reporting Trials.
FMS: Functional Mobility Scale.
Gait‐Keeper: Light treadmill used for gait training.
GMFCS: Gross Motor Function Classification System.
GMFM: Gross Motor Function Measure.
GMFM‐66: 66‐item Gross Motor Function Measure.
ICC: Interclass coefficient.
LiteGait: Gait training device that simultaneously controls weight bearing, posture, and balance over a treadmill.
NDT: Neurodevelopmental Treatment.
PDMS‐2: Peabody Developmental Motor Scales, Second Edition.
PEDI: Pediatric Evaluation of Disability Inventory.
SD: Standard deviation.
SMO: Supra malleolar orthosis.
Characteristics of excluded studies [ordered by study ID]
| Study | Reason for exclusion |
| The participants were older children. | |
| The participants were older children. There was no control group. | |
| Treadmill used simultaneously with kicking exercises in the experimental group. Outcome measures were motor development only, none included the outcome measures that are the focus of this review. | |
| Case report. | |
| The participants were older children. | |
| None of the included outcome measures were the focus of this review. In addition, most children were older. | |
| The participants were older children. | |
| None of the outcome measures were the same as in this review. This report assessed only functional balance. Most of the participants were older. | |
| Outcome measures were not relevant to the review. They evaluated stabilometry. | |
| Most of the participants were older (mean age 6 to 6.8 years old). | |
| The participants were older children. | |
| The participants were older children. | |
| Treadmill not used for training but to describe biomechanics of walking and compare parameters to overground walking. | |
| The participants were older children. | |
| Case series (part of a dissertation). | |
| The participants were older children. | |
| The participants were older children. | |
| The participants were older children. | |
| No training with the treadmill, it was used for investigation purposes. | |
| No training with the treadmill, it was used for investigation purposes. | |
| No control group. | |
| The participants were older children. | |
| The participants were older children. | |
| They did not use an outcome measure to look for motor skills other than balance. The parameters tested were not exactly in line with our main outcomes: age of independent walking and gross motor function. These authors really asked an equipment question, not a developmental/functional question. | |
| The participants were older children. | |
| Allocation to groups not random nor quasi‐random. | |
| The participants were older children. | |
| Observational study. No control group. | |
| The participants were older children. | |
| Report where all infants were placed on the treadmill. | |
| The participants were older children. | |
| The participants were older children. | |
| No training with the treadmill, it was used for investigation purposes. | |
| No control group. |
Characteristics of ongoing studies [ordered by study ID]
| Trial name or title | NCT02424526 Official title: Intensive Home‐based Treadmill Training and Walking Attainment in Young Children With Cerebral Palsy |
| Methods | Randomised controlled trial |
| Participants | Number to recruit: 24 infants (12 per group) aged between 1 and 3 years old, who show signs of walking readiness as demonstrated by the ability to sit for 30 seconds when placed and to take 5 to 7 steps when supported at the trunk or arms; and who show bilateral impairment (i.e. diplegia and quadriplegia, but not hemiplegia), who demonstrate upper motor neuron signs (i.e. spasticity and/or hyperreflexia), and who have been identified as high‐risk for a motor disability by a physician. |
| Interventions | Control group (low‐intensity treadmill training): Home‐based treadmill training
Experimental group (high‐intensity treadmill training): Home‐based treadmill training
The children will be assessed before, immediately after, at 1‐month and at 4‐months following the intervention via standardized outcome measures. |
| Outcomes |
|
| Starting date | Start date: July 2015 Estimated end date: June 2018 |
| Contact information | Contact 1 Name: Katrin Mattern‐Baxter, PT, DPT, PCS Telephone: 916‐278‐5766. Email:[email protected] Contact 2 Name: Leah Vargas Email: [email protected] |
| Notes | Country: USA |
Data and analyses
| Outcome or subgroup title | No. of studies | No. of participants | Statistical method | Effect size |
| 1 Step frequency (16 months): Risk of developmental delay (% alternate steps) Show forest plot | 1 | Mean Difference (IV, Random, 95% CI) | Totals not selected | |
| Analysis 1.1  Comparison 1 Treadmill versus no treadmill, Outcome 1 Step frequency (16 months): Risk of developmental delay (% alternate steps). | ||||
| 2 Step quality (11 months): Risk of developmental delay (% toe contact) Show forest plot | 1 | Mean Difference (IV, Random, 95% CI) | Totals not selected | |
| Analysis 1.2  Comparison 1 Treadmill versus no treadmill, Outcome 2 Step quality (11 months): Risk of developmental delay (% toe contact). | ||||
| 3 Step quality (16 months): Risk of developmental delay [% toe contact] Show forest plot | 1 | Mean Difference (IV, Random, 95% CI) | Totals not selected | |
| Analysis 1.3 ![Comparison 1 Treadmill versus no treadmill, Outcome 3 Step quality (16 months): Risk of developmental delay [% toe contact].](/cdsr/doi/10.1002/14651858.CD009242.pub3/media/CDSR/CD009242/image_n/nCD009242-CMP-001-03.png) Comparison 1 Treadmill versus no treadmill, Outcome 3 Step quality (16 months): Risk of developmental delay [% toe contact]. | ||||
| 4 Age of onset of independent walking Show forest plot | 2 | 58 | Mean Difference (IV, Random, 95% CI) | ‐2.08 [‐5.38, 1.22] |
| Analysis 1.4  Comparison 1 Treadmill versus no treadmill, Outcome 4 Age of onset of independent walking. | ||||
| 4.1 Risk of developmental delay | 1 | 28 | Mean Difference (IV, Random, 95% CI) | ‐0.60 [‐2.34, 1.14] |
| 4.2 Down syndrome | 1 | 30 | Mean Difference (IV, Random, 95% CI) | ‐4.0 [‐6.96, ‐1.04] |
| 5 Age of onset of walking with assistance (days in study) Show forest plot | 2 | 58 | Mean Difference (IV, Random, 95% CI) | ‐38.54 [‐106.13, 29.05] |
| Analysis 1.5 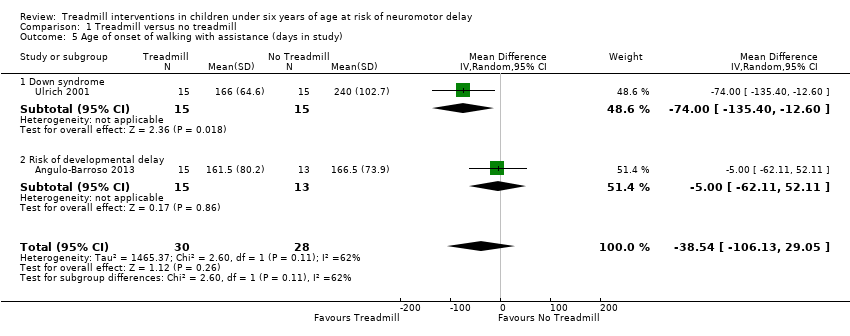 Comparison 1 Treadmill versus no treadmill, Outcome 5 Age of onset of walking with assistance (days in study). | ||||
| 5.1 Down syndrome | 1 | 30 | Mean Difference (IV, Random, 95% CI) | ‐74.0 [‐135.40, ‐12.60] |
| 5.2 Risk of developmental delay | 1 | 28 | Mean Difference (IV, Random, 95% CI) | ‐5.0 [‐62.11, 52.11] |
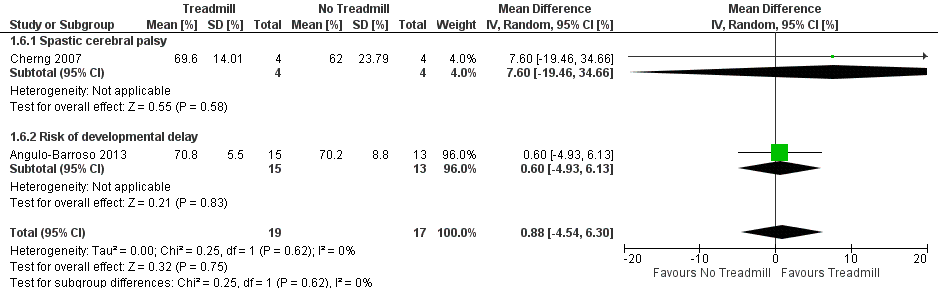
| 6 Gross motor function measure (GMFM) Show forest plot | 2 | 36 | Mean Difference (IV, Random, 95% CI) | 0.88 [‐4.54, 6.30] |
| Analysis 1.6  Comparison 1 Treadmill versus no treadmill, Outcome 6 Gross motor function measure (GMFM). | ||||
| 6.1 Spastic cerebral palsy | 1 | 8 | Mean Difference (IV, Random, 95% CI) | 7.60 [‐19.46, 34.66] |
| 6.2 Risk of developmental delay | 1 | 28 | Mean Difference (IV, Random, 95% CI) | 0.60 [‐4.93, 6.13] |
| 7 Gross motor function related to standing (GMFM) ‐ Dimension D Show forest plot | 2 | 32 | Mean Difference (IV, Random, 95% CI) | 5.41 [‐1.61, 12.43] |
| Analysis 1.7  Comparison 1 Treadmill versus no treadmill, Outcome 7 Gross motor function related to standing (GMFM) ‐ Dimension D. | ||||
| 7.1 Spastic cerebral palsy | 1 | 12 | Mean Difference (IV, Random, 95% CI) | 11.57 [0.05, 23.09] |
| 7.2 Developmental delay | 1 | 20 | Mean Difference (IV, Random, 95% CI) | 3.33 [1.43, 5.23] |
| 8 Gross motor function related to walking, running and jumping (GMFM) ‐ Dimension E Show forest plot | 2 | 32 | Mean Difference (IV, Random, 95% CI) | 4.51 [0.29, 8.73] |
| Analysis 1.8  Comparison 1 Treadmill versus no treadmill, Outcome 8 Gross motor function related to walking, running and jumping (GMFM) ‐ Dimension E. | ||||
| 8.1 Spastic cerebral palsy | 1 | 12 | Mean Difference (IV, Random, 95% CI) | 3.01 [‐1.11, 7.13] |
| 8.2 Developmental delay | 1 | 20 | Mean Difference (IV, Random, 95% CI) | 7.60 [0.88, 14.32] |
| 9 Peabody Developmental Motor Scales ‐ 2: Spastic cerebral palsy Show forest plot | 1 | Mean Difference (IV, Random, 95% CI) | Totals not selected | |
| Analysis 1.9  Comparison 1 Treadmill versus no treadmill, Outcome 9 Peabody Developmental Motor Scales ‐ 2: Spastic cerebral palsy. | ||||
| 10 Pediatric Evaluation of Disability Inventory ‐ Mobility Scale scores: Spastic cerebral palsy Show forest plot | 1 | Mean Difference (IV, Random, 95% CI) | Totals not selected | |
| Analysis 1.10  Comparison 1 Treadmill versus no treadmill, Outcome 10 Pediatric Evaluation of Disability Inventory ‐ Mobility Scale scores: Spastic cerebral palsy. | ||||
| 11 Other gait parameters ‐ velocity Show forest plot | 2 | 32 | Mean Difference (IV, Random, 95% CI) | 0.23 [0.08, 0.37] |
| Analysis 1.11 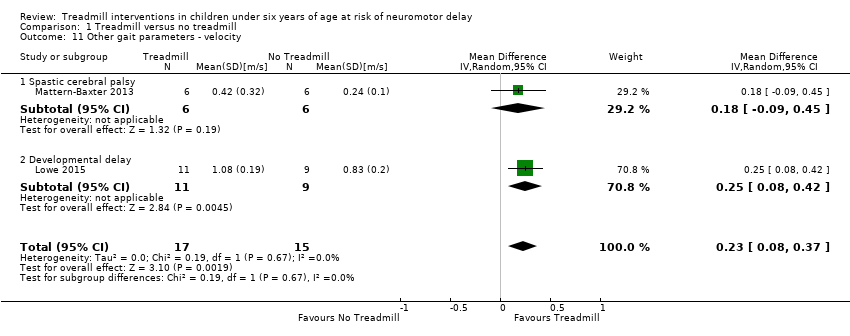 Comparison 1 Treadmill versus no treadmill, Outcome 11 Other gait parameters ‐ velocity. | ||||
| 11.1 Spastic cerebral palsy | 1 | 12 | Mean Difference (IV, Random, 95% CI) | 0.18 [‐0.09, 0.45] |
| 11.2 Developmental delay | 1 | 20 | Mean Difference (IV, Random, 95% CI) | 0.25 [0.08, 0.42] |
| 12 Other gait parameters ‐ velocity (follow‐up when walking independently): Risk of developmental delay Show forest plot | 1 | Mean Difference (IV, Random, 95% CI) | Totals not selected | |
| Analysis 1.12  Comparison 1 Treadmill versus no treadmill, Outcome 12 Other gait parameters ‐ velocity (follow‐up when walking independently): Risk of developmental delay. | ||||
| 13 Other gait parameters ‐ step length: Spastic cerebral palsy Show forest plot | 1 | Mean Difference (IV, Random, 95% CI) | Totals not selected | |
| Analysis 1.13  Comparison 1 Treadmill versus no treadmill, Outcome 13 Other gait parameters ‐ step length: Spastic cerebral palsy. | ||||
| 14 Other gait parameters ‐ step length (follow‐up when walking independently): Risk of developmental delay Show forest plot | 1 | Mean Difference (IV, Random, 95% CI) | Totals not selected | |
| Analysis 1.14  Comparison 1 Treadmill versus no treadmill, Outcome 14 Other gait parameters ‐ step length (follow‐up when walking independently): Risk of developmental delay. | ||||
| 15 Other gait parameters ‐ gait double‐limb support: Spastic cerebral palsy Show forest plot | 1 | Mean Difference (IV, Random, 95% CI) | Totals not selected | |
| Analysis 1.15 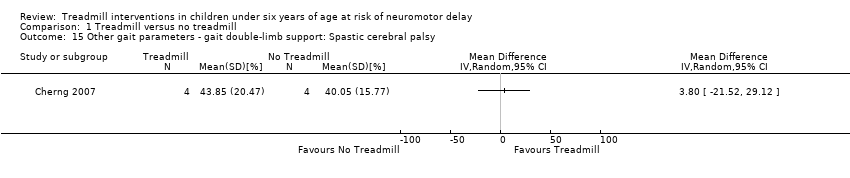 Comparison 1 Treadmill versus no treadmill, Outcome 15 Other gait parameters ‐ gait double‐limb support: Spastic cerebral palsy. | ||||
| 16 Other gait parameters ‐ gait double‐limb support (follow‐up when walking independently): Risk of developmental delay Show forest plot | 1 | Mean Difference (IV, Random, 95% CI) | Totals not selected | |
| Analysis 1.16 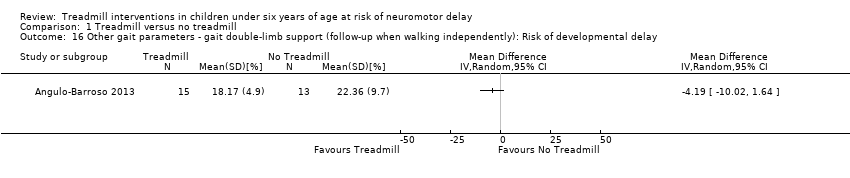 Comparison 1 Treadmill versus no treadmill, Outcome 16 Other gait parameters ‐ gait double‐limb support (follow‐up when walking independently): Risk of developmental delay. | ||||
| Outcome or subgroup title | No. of studies | No. of participants | Statistical method | Effect size |
| 1 Walking independently (1‐month follow‐up): Down syndrome Show forest plot | 1 | Mean Difference (IV, Random, 95% CI) | Totals not selected | |
| Analysis 2.1  Comparison 2 Treadmill without orthoses versus treadmill with orthoses, Outcome 1 Walking independently (1‐month follow‐up): Down syndrome. | ||||
| 2 Gross motor function (GMFM 1‐month follow‐up): Down syndrome Show forest plot | 1 | Mean Difference (IV, Random, 95% CI) | Totals not selected | |
| Analysis 2.2  Comparison 2 Treadmill without orthoses versus treadmill with orthoses, Outcome 2 Gross motor function (GMFM 1‐month follow‐up): Down syndrome. | ||||
| Outcome or subgroup title | No. of studies | No. of participants | Statistical method | Effect size |
| 1 Step frequency: Down syndrome Show forest plot | 1 | Mean Difference (IV, Random, 95% CI) | Totals not selected | |
| Analysis 3.1  Comparison 3 High‐intensity treadmill versus low‐intensity treadmill, Outcome 1 Step frequency: Down syndrome. | ||||
| 2 Age of onset of independent walking: Down syndrome Show forest plot | 1 | Mean Difference (IV, Random, 95% CI) | Totals not selected | |
| Analysis 3.2  Comparison 3 High‐intensity treadmill versus low‐intensity treadmill, Outcome 2 Age of onset of independent walking: Down syndrome. | ||||
| 3 Age of onset of walking with assistance: Down syndrome Show forest plot | 1 | Mean Difference (IV, Random, 95% CI) | Totals not selected | |
| Analysis 3.3  Comparison 3 High‐intensity treadmill versus low‐intensity treadmill, Outcome 3 Age of onset of walking with assistance: Down syndrome. | ||||
| 4 Other gait parameters ‐ velocity (follow‐up visit 1): Down syndrome Show forest plot | 1 | Mean Difference (IV, Random, 95% CI) | Totals not selected | |
| Analysis 3.4 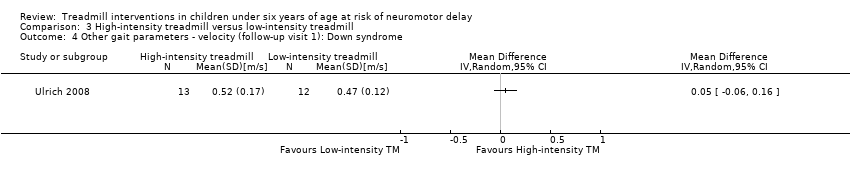 Comparison 3 High‐intensity treadmill versus low‐intensity treadmill, Outcome 4 Other gait parameters ‐ velocity (follow‐up visit 1): Down syndrome. | ||||
| 5 Other gait parameters ‐ velocity (follow‐up visit 2): Down syndrome Show forest plot | 1 | Mean Difference (IV, Random, 95% CI) | Totals not selected | |
| Analysis 3.5  Comparison 3 High‐intensity treadmill versus low‐intensity treadmill, Outcome 5 Other gait parameters ‐ velocity (follow‐up visit 2): Down syndrome. | ||||
| 6 Other gait parameters ‐ velocity (follow‐up visit 3): Down syndrome Show forest plot | 1 | Mean Difference (IV, Random, 95% CI) | Totals not selected | |
| Analysis 3.6  Comparison 3 High‐intensity treadmill versus low‐intensity treadmill, Outcome 6 Other gait parameters ‐ velocity (follow‐up visit 3): Down syndrome. | ||||
| 7 Other gait parameters ‐ velocity (follow‐up visit 4): Down syndrome Show forest plot | 1 | Mean Difference (IV, Random, 95% CI) | Totals not selected | |
| Analysis 3.7  Comparison 3 High‐intensity treadmill versus low‐intensity treadmill, Outcome 7 Other gait parameters ‐ velocity (follow‐up visit 4): Down syndrome. | ||||
| 8 Other gait parameters ‐ gait double‐limb support (follow‐up visit 1): Down syndrome Show forest plot | 1 | Mean Difference (IV, Random, 95% CI) | Totals not selected | |
| Analysis 3.8 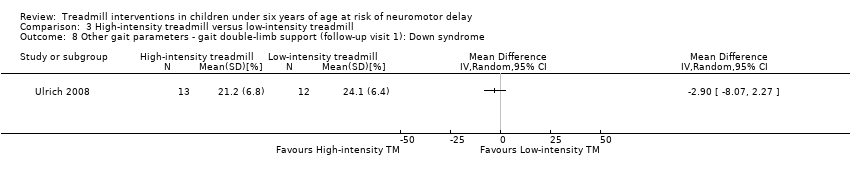 Comparison 3 High‐intensity treadmill versus low‐intensity treadmill, Outcome 8 Other gait parameters ‐ gait double‐limb support (follow‐up visit 1): Down syndrome. | ||||
| 9 Other gait parameters ‐ gait double‐limb support (follow‐up visit 2): Down syndrome Show forest plot | 1 | Mean Difference (IV, Random, 95% CI) | Totals not selected | |
| Analysis 3.9  Comparison 3 High‐intensity treadmill versus low‐intensity treadmill, Outcome 9 Other gait parameters ‐ gait double‐limb support (follow‐up visit 2): Down syndrome. | ||||
| 10 Other gait parameters ‐ gait double‐limb support (follow‐up visit 3): Down syndrome Show forest plot | 1 | Mean Difference (IV, Random, 95% CI) | Totals not selected | |
| Analysis 3.10  Comparison 3 High‐intensity treadmill versus low‐intensity treadmill, Outcome 10 Other gait parameters ‐ gait double‐limb support (follow‐up visit 3): Down syndrome. | ||||
| 11 Other gait parameters ‐ gait double‐limb support (follow‐up visit 4): Down syndrome Show forest plot | 1 | Mean Difference (IV, Random, 95% CI) | Totals not selected | |
| Analysis 3.11  Comparison 3 High‐intensity treadmill versus low‐intensity treadmill, Outcome 11 Other gait parameters ‐ gait double‐limb support (follow‐up visit 4): Down syndrome. | ||||
| 12 Other gait parameters ‐ gait ankle plantar flexion (follow‐up visit 1): Down syndrome Show forest plot | 1 | Mean Difference (IV, Random, 95% CI) | Totals not selected | |
| Analysis 3.12  Comparison 3 High‐intensity treadmill versus low‐intensity treadmill, Outcome 12 Other gait parameters ‐ gait ankle plantar flexion (follow‐up visit 1): Down syndrome. | ||||
| 13 Other gait parameters ‐ gait ankle plantar flexion (follow‐up visit 2): Down syndrome Show forest plot | 1 | Mean Difference (IV, Random, 95% CI) | Totals not selected | |
| Analysis 3.13  Comparison 3 High‐intensity treadmill versus low‐intensity treadmill, Outcome 13 Other gait parameters ‐ gait ankle plantar flexion (follow‐up visit 2): Down syndrome. | ||||
| 14 Other gait parameters ‐ gait ankle plantar flexion (follow‐up visit 3): Down syndrome Show forest plot | 1 | Mean Difference (IV, Random, 95% CI) | Totals not selected | |
| Analysis 3.14  Comparison 3 High‐intensity treadmill versus low‐intensity treadmill, Outcome 14 Other gait parameters ‐ gait ankle plantar flexion (follow‐up visit 3): Down syndrome. | ||||
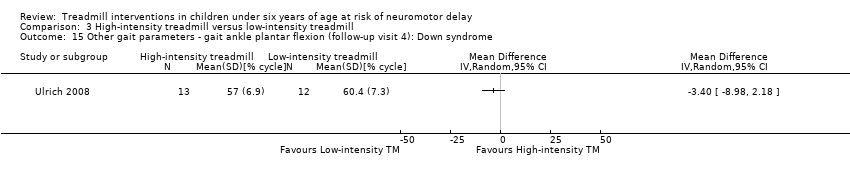
| 15 Other gait parameters ‐ gait ankle plantar flexion (follow‐up visit 4): Down syndrome Show forest plot | 1 | Mean Difference (IV, Random, 95% CI) | Totals not selected | |
| Analysis 3.15  Comparison 3 High‐intensity treadmill versus low‐intensity treadmill, Outcome 15 Other gait parameters ‐ gait ankle plantar flexion (follow‐up visit 4): Down syndrome. | ||||
| 16 Other gait parameters ‐ step width (follow‐up): Down syndrome Show forest plot | 1 | Mean Difference (IV, Random, 95% CI) | Totals not selected | |
| Analysis 3.16  Comparison 3 High‐intensity treadmill versus low‐intensity treadmill, Outcome 16 Other gait parameters ‐ step width (follow‐up): Down syndrome. | ||||
| 17 Other gait parameters ‐ step length (follow‐up): Down syndrome Show forest plot | 1 | Mean Difference (IV, Random, 95% CI) | Totals not selected | |
| Analysis 3.17  Comparison 3 High‐intensity treadmill versus low‐intensity treadmill, Outcome 17 Other gait parameters ‐ step length (follow‐up): Down syndrome. | ||||
| 18 Other gait parameters ‐ toe‐off (follow‐up): Down syndrome Show forest plot | 1 | Mean Difference (IV, Random, 95% CI) | Totals not selected | |
| Analysis 3.18  Comparison 3 High‐intensity treadmill versus low‐intensity treadmill, Outcome 18 Other gait parameters ‐ toe‐off (follow‐up): Down syndrome. | ||||
| 19 Other gait parameters ‐ gait ankle dorsiflexion (follow‐up): Down syndrome Show forest plot | 1 | Mean Difference (IV, Random, 95% CI) | Totals not selected | |
| Analysis 3.19  Comparison 3 High‐intensity treadmill versus low‐intensity treadmill, Outcome 19 Other gait parameters ‐ gait ankle dorsiflexion (follow‐up): Down syndrome. | ||||

Study flow diagram.

Risk of bias graph: review authors' judgements about each risk of bias item presented as percentages across all included studies.

Risk of bias summary: review authors' judgements about each risk of bias item for each included study. + = low risk, ‐ = high risk, ? = unclear risk

Forest plot of comparison: 1 No Treadmill vs Treadmill: Walking independently (months).
![Forest plot of comparison: 1 Treadmill vs No Treadmill, outcome: 1.20 Age of onset of walking with assistance [days in study].](/es/cdsr/doi/10.1002/14651858.CD009242.pub3/media/CDSR/CD009242/image_n/nCD009242-AFig-FIG05.png)
Forest plot of comparison: 1 Treadmill vs No Treadmill, outcome: 1.20 Age of onset of walking with assistance [days in study].
Forest plot of comparison: 1 No Treadmill vs Treadmill: Gross motor function (GMFM as %).

Comparison 1 Treadmill versus no treadmill, Outcome 1 Step frequency (16 months): Risk of developmental delay (% alternate steps).

Comparison 1 Treadmill versus no treadmill, Outcome 2 Step quality (11 months): Risk of developmental delay (% toe contact).
![Comparison 1 Treadmill versus no treadmill, Outcome 3 Step quality (16 months): Risk of developmental delay [% toe contact].](/es/cdsr/doi/10.1002/14651858.CD009242.pub3/media/CDSR/CD009242/image_n/nCD009242-CMP-001-03.png)
Comparison 1 Treadmill versus no treadmill, Outcome 3 Step quality (16 months): Risk of developmental delay [% toe contact].

Comparison 1 Treadmill versus no treadmill, Outcome 4 Age of onset of independent walking.

Comparison 1 Treadmill versus no treadmill, Outcome 5 Age of onset of walking with assistance (days in study).
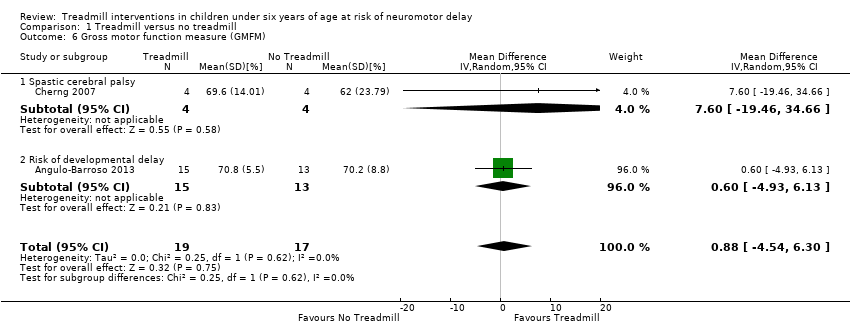
Comparison 1 Treadmill versus no treadmill, Outcome 6 Gross motor function measure (GMFM).

Comparison 1 Treadmill versus no treadmill, Outcome 7 Gross motor function related to standing (GMFM) ‐ Dimension D.

Comparison 1 Treadmill versus no treadmill, Outcome 8 Gross motor function related to walking, running and jumping (GMFM) ‐ Dimension E.

Comparison 1 Treadmill versus no treadmill, Outcome 9 Peabody Developmental Motor Scales ‐ 2: Spastic cerebral palsy.

Comparison 1 Treadmill versus no treadmill, Outcome 10 Pediatric Evaluation of Disability Inventory ‐ Mobility Scale scores: Spastic cerebral palsy.

Comparison 1 Treadmill versus no treadmill, Outcome 11 Other gait parameters ‐ velocity.

Comparison 1 Treadmill versus no treadmill, Outcome 12 Other gait parameters ‐ velocity (follow‐up when walking independently): Risk of developmental delay.
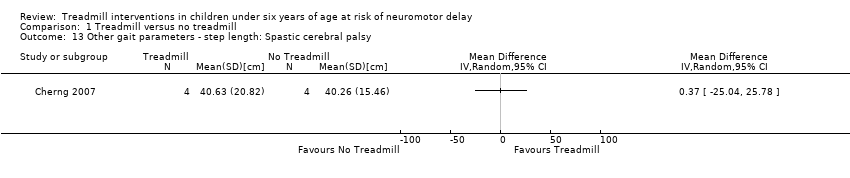
Comparison 1 Treadmill versus no treadmill, Outcome 13 Other gait parameters ‐ step length: Spastic cerebral palsy.

Comparison 1 Treadmill versus no treadmill, Outcome 14 Other gait parameters ‐ step length (follow‐up when walking independently): Risk of developmental delay.

Comparison 1 Treadmill versus no treadmill, Outcome 15 Other gait parameters ‐ gait double‐limb support: Spastic cerebral palsy.

Comparison 1 Treadmill versus no treadmill, Outcome 16 Other gait parameters ‐ gait double‐limb support (follow‐up when walking independently): Risk of developmental delay.

Comparison 2 Treadmill without orthoses versus treadmill with orthoses, Outcome 1 Walking independently (1‐month follow‐up): Down syndrome.

Comparison 2 Treadmill without orthoses versus treadmill with orthoses, Outcome 2 Gross motor function (GMFM 1‐month follow‐up): Down syndrome.

Comparison 3 High‐intensity treadmill versus low‐intensity treadmill, Outcome 1 Step frequency: Down syndrome.

Comparison 3 High‐intensity treadmill versus low‐intensity treadmill, Outcome 2 Age of onset of independent walking: Down syndrome.

Comparison 3 High‐intensity treadmill versus low‐intensity treadmill, Outcome 3 Age of onset of walking with assistance: Down syndrome.

Comparison 3 High‐intensity treadmill versus low‐intensity treadmill, Outcome 4 Other gait parameters ‐ velocity (follow‐up visit 1): Down syndrome.

Comparison 3 High‐intensity treadmill versus low‐intensity treadmill, Outcome 5 Other gait parameters ‐ velocity (follow‐up visit 2): Down syndrome.

Comparison 3 High‐intensity treadmill versus low‐intensity treadmill, Outcome 6 Other gait parameters ‐ velocity (follow‐up visit 3): Down syndrome.

Comparison 3 High‐intensity treadmill versus low‐intensity treadmill, Outcome 7 Other gait parameters ‐ velocity (follow‐up visit 4): Down syndrome.

Comparison 3 High‐intensity treadmill versus low‐intensity treadmill, Outcome 8 Other gait parameters ‐ gait double‐limb support (follow‐up visit 1): Down syndrome.

Comparison 3 High‐intensity treadmill versus low‐intensity treadmill, Outcome 9 Other gait parameters ‐ gait double‐limb support (follow‐up visit 2): Down syndrome.

Comparison 3 High‐intensity treadmill versus low‐intensity treadmill, Outcome 10 Other gait parameters ‐ gait double‐limb support (follow‐up visit 3): Down syndrome.

Comparison 3 High‐intensity treadmill versus low‐intensity treadmill, Outcome 11 Other gait parameters ‐ gait double‐limb support (follow‐up visit 4): Down syndrome.

Comparison 3 High‐intensity treadmill versus low‐intensity treadmill, Outcome 12 Other gait parameters ‐ gait ankle plantar flexion (follow‐up visit 1): Down syndrome.

Comparison 3 High‐intensity treadmill versus low‐intensity treadmill, Outcome 13 Other gait parameters ‐ gait ankle plantar flexion (follow‐up visit 2): Down syndrome.

Comparison 3 High‐intensity treadmill versus low‐intensity treadmill, Outcome 14 Other gait parameters ‐ gait ankle plantar flexion (follow‐up visit 3): Down syndrome.
Comparison 3 High‐intensity treadmill versus low‐intensity treadmill, Outcome 15 Other gait parameters ‐ gait ankle plantar flexion (follow‐up visit 4): Down syndrome.

Comparison 3 High‐intensity treadmill versus low‐intensity treadmill, Outcome 16 Other gait parameters ‐ step width (follow‐up): Down syndrome.

Comparison 3 High‐intensity treadmill versus low‐intensity treadmill, Outcome 17 Other gait parameters ‐ step length (follow‐up): Down syndrome.

Comparison 3 High‐intensity treadmill versus low‐intensity treadmill, Outcome 18 Other gait parameters ‐ toe‐off (follow‐up): Down syndrome.

Comparison 3 High‐intensity treadmill versus low‐intensity treadmill, Outcome 19 Other gait parameters ‐ gait ankle dorsiflexion (follow‐up): Down syndrome.
| Treadmill compared with no treadmill for children under six years of age at risk of neuromotor delay | |||
| Patient or population: children under six years with cerebral palsy or Down syndrome or at risk of neuromotor delay Intervention: treadmill Comparison: no treadmill | |||
| Outcomes | Absolute effects Mean difference (95% CI)* | Number of participants | Quality of the evidence |
| Age of onset of independent walking (months) | MD ‐2.08 (‐5.38 to 1.22) | 58 (2 RCTs) | ⊕⊕⊕⊝ 1,2,3,4,5 |
| Age of onset of walking with assistance (days in study) | MD ‐38.54 (‐106.13 to 29.05) | 58 | ⊕⊝⊝⊝ 2,3,5,6,7,8 |
| Gross motor function (GMFM) (%) | MD 0.88 (‐4.54 to 6.30) | 36 | ⊕⊕⊕⊝ 2,5,6,8,9 |
| Gross motor function related to standing (GMFM) ‐ Dimension D (%) | MD 5.41 (‐1.64 to 12.43) | 32 | ⊕⊕⊝⊝ Low 2,5 |
| Gross motor function related to walking, running and jumping (GMFM) ‐ Dimension E (%) | MD 4.51 (0.29 to 8.73) | 32 | ⊕⊕⊝⊝ Low 2,5,10 |
| Velocity (m/s) | MD 0.23 (0.08 to 0.37) | 32 | ⊕⊕⊕⊕ High 2 |
| *treadmill versus no treadmill CI: Confidence interval; MD: Mean difference; RCT: Randomised controlled trial | |||
| GRADE Working Group grades of evidence | |||
| 1. Randomization took place through ID numbers provided by a computer program that a statistician assigned to participants after considering the three stratification factors of age, sex and birth weight. | |||
| Outcome or Subgroup | Disorder | Studies | Comparsion groups (G1 versus G2) | Sample size (G1/G2) | Result of comparison | |
| Nº | ID | |||||
| 1.1. Step frequency (16 months) | Risk | 1 | NTM versus TM | 15/13 | G1 = G2 | |
| 1.2. Step quality (11 months) | Risk | 1 | NTM versus TM | 15/13 | G1 < G2 | |
| 1.3. Step quality (16 months) | Risk | 1 | NTM versus TM | 15/13 | G1 < G2 | |
| 1.4. Age of onset of independent walking [months] | DS and Risk | 2 | NTM versus TM | 30/28 | G1 < G2 | |
| 1.5. Age of onset of walking with assistance [days in study] | DS and Risk | 2 | NTM versus TM | 30/28 | G1 = G2 | |
| 1.6. Gross motor function measure (GMFM) [%] | CP and Risk | 2 | NTM versus TM | 19/17 | G1 = G2 | |
| 1.7. GMFM related to standing, Dimension D [%] | Risk and CP | 2 | NTM versus TM | 14/18 | G1 = G2 | |
| 1.8. GMFM related to walking, running and jumping, Dimension E [%] | Risk and CP | 2 | NTM versus TM | 14/18 | G1 = G2 | |
| 1.9. Peabody Developmental Motor Scales ‐ 2 [raw scores] | CP | 1 | NTM versus TM | 6/6 | G1 < G2 | |
| 1.10. Pediatric Evaluation of Disability Inventory ‐ Mobility Scale scores | CP | 1 | NTM versus TM | 6/6 | G1 < G2 | |
| 1.11. Other gait parameters: velocity [m/s] | CP and Risk | 1 | NTM versus TM | 4/4 | G1 < G2 | |
| 1.12. Other gait parameters: velocity (follow‐up when walking independent) | Risk | 1 | NTM versus TM | 15/13 | G1 = G2 | |
| 1.13. Other gait parameters: step length [cm] | CP | 1 | NTM versus TM | 4/4 | G1 = G2 | |
| 1.14. Other gait parameters: step length (follow‐up when walking independently) | Risk | 1 | NTM versus TM | 15/13 | G1 = G2 | |
| 1.15. Other gait parameters: gait double‐limb support [%] | CP | 1 | NTM versus TM | 4/4 | G1 = G2 | |
| 1.16. Other gait parameters: gait double‐limb support (follow‐up when walking independently) [%] | Risk | 1 | NTM versus TM | 15/13 | G1 = G2 | |
| 2.1. Walking independent (1‐month follow‐up) [months] | DS | 1 | TM&O versus TM | 10/7 | G1 = G2 | |
| 2.2. GMFM (1‐month follow‐up) [%] | DS | 1 | TM&O versus TM | 10/7 | G1 > G2 | |
| 3.1. Step frequency [steps/min] | DS | 1 | HI TM versus LG TM | 16/14 | G1 > G2 | |
| 3.2. Age of onset of independent walking [months] | DS | 1 | HI TM versus LG TM | 16/14 | G1 = G2 | |
| 3.3. Age of onset of walking with assistance [months] | DS | 1 | HI TM versus LG TM | 16/14 | G1 = G2 | |
| 3.4. Other gait parameters: velocity (follow‐up visit 1) [m/s] | DS | 1 | HI TM versus LG TM | 13/12 | G1 = G2 | |
| 3.5. Other gait parameters: velocity (follow‐up visit 2) [m/s] | DS | 1 | HI TM versus LG TM | 13/12 | G1 < G2 | |
| 3.6. Other gait parameters: velocity (follow‐up visit 3) [m/s] | DS | 1 | HI TM versus LG TM | 13/12 | G1 = G2 | |
| 3.7. Other gait parameters: velocity (follow‐up visit 4) [m/s] | DS | 1 | HI TM versus LG TM | 13/12 | G1 = G2 | |
| 3.8. Other gait parameters: gait double‐limb support (follow‐up visit 1) [%] | DS | 1 | HI TM versus LG TM | 13/12 | G1 = G2 | |
| 3.9. Other gait parameters: gait double‐limb support (follow‐up visit 2) [%] | DS | 1 | HI TM versus LG TM | 13/12 | G1 > G2 | |
| 3.10. Other gait parameters: gait double‐limb support (follow‐up visit 3) [%] | DS | 1 | HI TM versus LG TM | 13/12 | G1 = G2 | |
| 3.11. Other gait parameters: gait double‐limb support (follow‐up visit 4) [%] | DS | 1 | HI TM versus LG TM | 13/12 | G1 = G2 | |
| 3.12. Other gait parameters: gait ankle plantar flexion (follow‐up visit 1) [%] | DS | 1 | HI TM versus LG TM | 13/12 | G1 = G2 | |
| 3.13. Other gait parameters: gait ankle plantar flexion (follow‐up visit 2) [%] | DS | 1 | HI TM versus LG TM | 13/12 | G1 > G2 | |
| 3.14. Other gait parameters: gait ankle plantar flexion (follow‐up visit 3) [%] | DS | 1 | HI TM versus LG TM | 13/12 | G1 = G2 | |
| 3.15. Other gait parameters: gait ankle plantar flexion (follow‐up visit 4) [%] | DS | 1 | HI TM versus LG TM | 13/12 | G1 = G2 | |
| 3.16. Other gait parameters: step length (follow‐up) [cm] | DS | 1 | HI TM versus LG TM | 13/12 | G1 = G2 | |
| 3.17. Other gait parameters: step width (follow‐up) [cm] | DS | 1 | HI TM versus LG TM | 13/12 | G1 = G2 | |
| 3.18. Other gait parameters: gait ankle dorsiflexion (follow‐up) [%] | DS | 1 | HI TM versus LG TM | 13/12 | G1 = G2 | |
| 3.19. Other gait parameters: toe‐off (follow‐up) [%] | DS | 1 | HI TM versus LG TM | 13/12 | G1 = G2 | |
| CP = Cerebral palsy; DS = Down syndrome; G1 = Group 1; G2 = Group 2; HI TM = high‐intensity treadmill; LG TM = low‐intensity treadmill; Na = total participants, number of analysed participants; Nº = number of studies included; NTM = no treadmill; TM = treadmill; TM&O = treadmill and orthoses; Risk = risk of developmental delay. | ||||||
| Outcome or subgroup title | No. of studies | No. of participants | Statistical method | Effect size |
| 1 Step frequency (16 months): Risk of developmental delay (% alternate steps) Show forest plot | 1 | Mean Difference (IV, Random, 95% CI) | Totals not selected | |
| 2 Step quality (11 months): Risk of developmental delay (% toe contact) Show forest plot | 1 | Mean Difference (IV, Random, 95% CI) | Totals not selected | |
| 3 Step quality (16 months): Risk of developmental delay [% toe contact] Show forest plot | 1 | Mean Difference (IV, Random, 95% CI) | Totals not selected | |
| 4 Age of onset of independent walking Show forest plot | 2 | 58 | Mean Difference (IV, Random, 95% CI) | ‐2.08 [‐5.38, 1.22] |
| 4.1 Risk of developmental delay | 1 | 28 | Mean Difference (IV, Random, 95% CI) | ‐0.60 [‐2.34, 1.14] |
| 4.2 Down syndrome | 1 | 30 | Mean Difference (IV, Random, 95% CI) | ‐4.0 [‐6.96, ‐1.04] |
| 5 Age of onset of walking with assistance (days in study) Show forest plot | 2 | 58 | Mean Difference (IV, Random, 95% CI) | ‐38.54 [‐106.13, 29.05] |
| 5.1 Down syndrome | 1 | 30 | Mean Difference (IV, Random, 95% CI) | ‐74.0 [‐135.40, ‐12.60] |
| 5.2 Risk of developmental delay | 1 | 28 | Mean Difference (IV, Random, 95% CI) | ‐5.0 [‐62.11, 52.11] |
| 6 Gross motor function measure (GMFM) Show forest plot | 2 | 36 | Mean Difference (IV, Random, 95% CI) | 0.88 [‐4.54, 6.30] |
| 6.1 Spastic cerebral palsy | 1 | 8 | Mean Difference (IV, Random, 95% CI) | 7.60 [‐19.46, 34.66] |
| 6.2 Risk of developmental delay | 1 | 28 | Mean Difference (IV, Random, 95% CI) | 0.60 [‐4.93, 6.13] |
| 7 Gross motor function related to standing (GMFM) ‐ Dimension D Show forest plot | 2 | 32 | Mean Difference (IV, Random, 95% CI) | 5.41 [‐1.61, 12.43] |
| 7.1 Spastic cerebral palsy | 1 | 12 | Mean Difference (IV, Random, 95% CI) | 11.57 [0.05, 23.09] |
| 7.2 Developmental delay | 1 | 20 | Mean Difference (IV, Random, 95% CI) | 3.33 [1.43, 5.23] |
| 8 Gross motor function related to walking, running and jumping (GMFM) ‐ Dimension E Show forest plot | 2 | 32 | Mean Difference (IV, Random, 95% CI) | 4.51 [0.29, 8.73] |
| 8.1 Spastic cerebral palsy | 1 | 12 | Mean Difference (IV, Random, 95% CI) | 3.01 [‐1.11, 7.13] |
| 8.2 Developmental delay | 1 | 20 | Mean Difference (IV, Random, 95% CI) | 7.60 [0.88, 14.32] |
| 9 Peabody Developmental Motor Scales ‐ 2: Spastic cerebral palsy Show forest plot | 1 | Mean Difference (IV, Random, 95% CI) | Totals not selected | |
| 10 Pediatric Evaluation of Disability Inventory ‐ Mobility Scale scores: Spastic cerebral palsy Show forest plot | 1 | Mean Difference (IV, Random, 95% CI) | Totals not selected | |
| 11 Other gait parameters ‐ velocity Show forest plot | 2 | 32 | Mean Difference (IV, Random, 95% CI) | 0.23 [0.08, 0.37] |
| 11.1 Spastic cerebral palsy | 1 | 12 | Mean Difference (IV, Random, 95% CI) | 0.18 [‐0.09, 0.45] |
| 11.2 Developmental delay | 1 | 20 | Mean Difference (IV, Random, 95% CI) | 0.25 [0.08, 0.42] |
| 12 Other gait parameters ‐ velocity (follow‐up when walking independently): Risk of developmental delay Show forest plot | 1 | Mean Difference (IV, Random, 95% CI) | Totals not selected | |
| 13 Other gait parameters ‐ step length: Spastic cerebral palsy Show forest plot | 1 | Mean Difference (IV, Random, 95% CI) | Totals not selected | |
| 14 Other gait parameters ‐ step length (follow‐up when walking independently): Risk of developmental delay Show forest plot | 1 | Mean Difference (IV, Random, 95% CI) | Totals not selected | |
| 15 Other gait parameters ‐ gait double‐limb support: Spastic cerebral palsy Show forest plot | 1 | Mean Difference (IV, Random, 95% CI) | Totals not selected | |
| 16 Other gait parameters ‐ gait double‐limb support (follow‐up when walking independently): Risk of developmental delay Show forest plot | 1 | Mean Difference (IV, Random, 95% CI) | Totals not selected | |
| Outcome or subgroup title | No. of studies | No. of participants | Statistical method | Effect size |
| 1 Walking independently (1‐month follow‐up): Down syndrome Show forest plot | 1 | Mean Difference (IV, Random, 95% CI) | Totals not selected | |
| 2 Gross motor function (GMFM 1‐month follow‐up): Down syndrome Show forest plot | 1 | Mean Difference (IV, Random, 95% CI) | Totals not selected | |
| Outcome or subgroup title | No. of studies | No. of participants | Statistical method | Effect size |
| 1 Step frequency: Down syndrome Show forest plot | 1 | Mean Difference (IV, Random, 95% CI) | Totals not selected | |
| 2 Age of onset of independent walking: Down syndrome Show forest plot | 1 | Mean Difference (IV, Random, 95% CI) | Totals not selected | |
| 3 Age of onset of walking with assistance: Down syndrome Show forest plot | 1 | Mean Difference (IV, Random, 95% CI) | Totals not selected | |
| 4 Other gait parameters ‐ velocity (follow‐up visit 1): Down syndrome Show forest plot | 1 | Mean Difference (IV, Random, 95% CI) | Totals not selected | |
| 5 Other gait parameters ‐ velocity (follow‐up visit 2): Down syndrome Show forest plot | 1 | Mean Difference (IV, Random, 95% CI) | Totals not selected | |
| 6 Other gait parameters ‐ velocity (follow‐up visit 3): Down syndrome Show forest plot | 1 | Mean Difference (IV, Random, 95% CI) | Totals not selected | |
| 7 Other gait parameters ‐ velocity (follow‐up visit 4): Down syndrome Show forest plot | 1 | Mean Difference (IV, Random, 95% CI) | Totals not selected | |
| 8 Other gait parameters ‐ gait double‐limb support (follow‐up visit 1): Down syndrome Show forest plot | 1 | Mean Difference (IV, Random, 95% CI) | Totals not selected | |
| 9 Other gait parameters ‐ gait double‐limb support (follow‐up visit 2): Down syndrome Show forest plot | 1 | Mean Difference (IV, Random, 95% CI) | Totals not selected | |
| 10 Other gait parameters ‐ gait double‐limb support (follow‐up visit 3): Down syndrome Show forest plot | 1 | Mean Difference (IV, Random, 95% CI) | Totals not selected | |
| 11 Other gait parameters ‐ gait double‐limb support (follow‐up visit 4): Down syndrome Show forest plot | 1 | Mean Difference (IV, Random, 95% CI) | Totals not selected | |
| 12 Other gait parameters ‐ gait ankle plantar flexion (follow‐up visit 1): Down syndrome Show forest plot | 1 | Mean Difference (IV, Random, 95% CI) | Totals not selected | |
| 13 Other gait parameters ‐ gait ankle plantar flexion (follow‐up visit 2): Down syndrome Show forest plot | 1 | Mean Difference (IV, Random, 95% CI) | Totals not selected | |
| 14 Other gait parameters ‐ gait ankle plantar flexion (follow‐up visit 3): Down syndrome Show forest plot | 1 | Mean Difference (IV, Random, 95% CI) | Totals not selected | |
| 15 Other gait parameters ‐ gait ankle plantar flexion (follow‐up visit 4): Down syndrome Show forest plot | 1 | Mean Difference (IV, Random, 95% CI) | Totals not selected | |
| 16 Other gait parameters ‐ step width (follow‐up): Down syndrome Show forest plot | 1 | Mean Difference (IV, Random, 95% CI) | Totals not selected | |
| 17 Other gait parameters ‐ step length (follow‐up): Down syndrome Show forest plot | 1 | Mean Difference (IV, Random, 95% CI) | Totals not selected | |
| 18 Other gait parameters ‐ toe‐off (follow‐up): Down syndrome Show forest plot | 1 | Mean Difference (IV, Random, 95% CI) | Totals not selected | |
| 19 Other gait parameters ‐ gait ankle dorsiflexion (follow‐up): Down syndrome Show forest plot | 1 | Mean Difference (IV, Random, 95% CI) | Totals not selected | |