Avoidance versus use of neuromuscular blocking agents for improving conditions during tracheal intubation or direct laryngoscopy in adults and adolescents
Abstract
Background
Tracheal intubation during induction of general anaesthesia is a vital procedure performed to secure a patient's airway. Several studies have identified difficult tracheal intubation (DTI) or failed tracheal intubation as one of the major contributors to anaesthesia‐related mortality and morbidity. Use of neuromuscular blocking agents (NMBA) to facilitate tracheal intubation is a widely accepted practice. However, because of adverse effects, NMBA may be undesirable. Cohort studies have indicated that avoiding NMBA is an independent risk factor for difficult and failed tracheal intubation. However, no systematic review of randomized trials has evaluated conditions for tracheal intubation, possible adverse effects, and postoperative discomfort.
Objectives
To evaluate the effects of avoiding neuromuscular blocking agents (NMBA) versus using NMBA on difficult tracheal intubation (DTI) for adults and adolescents allocated to tracheal intubation with direct laryngoscopy. To look at various outcomes, conduct subgroup and sensitivity analyses, examine the role of bias, and apply trial sequential analysis (TSA) to examine the level of available evidence for this intervention.
Search methods
We searched CENTRAL, MEDLINE, Embase, BIOSIS, International Web of Science, LILACS, advanced Google, CINAHL, and the following trial registries: Current Controlled Trials; ClinicalTrials.gov; and www.centerwatch.com, up to January 2017. We checked the reference lists of included trials and reviews to look for unidentified trials.
Selection criteria
We included randomized controlled trials (RCTs) that compared the effects of avoiding versus using NMBA in participants 14 years of age or older.
Data collection and analysis
Two review authors extracted data independently. We conducted random‐effects and fixed‐effect meta‐analyses and calculated risk ratios (RRs) and their 95% confidence intervals (CIs). We used published data and data obtained by contacting trial authors. To minimize the risk of systematic error, we assessed the risk of bias of included trials. To reduce the risk of random errors caused by sparse data and repetitive updating of cumulative meta‐analyses, we applied TSA.
Main results
We identified 34 RCTs with 3565 participants that met our inclusion criteria. All trials reported on conditions for tracheal intubation; seven trials with 846 participants described ‘events of upper airway discomfort or injury’, and 13 trials with 1308 participants reported on direct laryngoscopy. All trials used a parallel design. We identified 18 dose‐finding studies that included more interventions or control groups or both. All trials except three included only American Society of Anesthesiologists (ASA) class I and II participants, 25 trials excluded participants with anticipated DTI, and obesity or overweight was an excluding factor in 13 studies. Eighteen trials used suxamethonium, and 18 trials used non‐depolarizing NMBA.
Trials with an overall low risk of bias reported significantly increased risk of DTI with no use of NMBA (random‐effects model) (RR 13.27, 95% CI 8.19 to 21.49; P < 0.00001; 508 participants; four trials; number needed to treat for an additional harmful outcome (NNTH) = 1.9, I2 = 0%, D2 = 0%, GRADE = moderate). The TSA‐adjusted CI for the RR was 1.85 to 95.04. Inclusion of all trials resulted in confirmation of results and of significantly increased risk of DTI when an NMBA was avoided (random‐effects model) (RR 5.00, 95% CI 3.49 to 7.15; P < 0.00001; 3565 participants; 34 trials; NNTH = 6.3, I2 = 70%, D2 = 82%, GRADE = low). Again the cumulative z‐curve crossed the TSA monitoring boundary, demonstrating harmful effects of avoiding NMBA on the proportion of DTI with minimal risk of random error. We categorized only one trial reporting on upper airway discomfort or injury as having overall low risk of bias. Inclusion of all trials revealed significant risk of upper airway discomfort or injury when an NMBA was avoided (random‐effects model) (RR 1.37, 95% CI 1.09 to 1.74; P = 0.008; 846 participants; seven trials; NNTH = 9.1, I2 = 13%, GRADE = moderate). The TSA‐adjusted CI for the RR was 1.00 to 1.85. None of these trials reported mortality. In terms of our secondary outcome 'difficult laryngoscopy', we categorized only one trial as having overall low risk of bias. All trials avoiding NMBA were significantly associated with difficult laryngoscopy (random‐effects model) (RR 2.54, 95% CI 1.53 to 4.21; P = 0.0003; 1308 participants; 13 trials; NNTH = 25.6, I2 = 0%, D2= 0%, GRADE = low); however, TSA showed that only 6% of the information size required to detect or reject a 20% relative risk reduction (RRR) was accrued, and the trial sequential monitoring boundary was not crossed.
Authors' conclusions
This review supports that use of an NMBA may create the best conditions for tracheal intubation and may reduce the risk of upper airway discomfort or injury following tracheal intubation. Study results were characterized by indirectness, heterogeneity, and high or uncertain risk of bias concerning our primary outcome describing difficult tracheal intubation. Therefore, we categorized the GRADE classification of quality of evidence as moderate to low. In light of defined outcomes of individual included trials, our primary outcomes may not reflect a situation that many clinicians consider to be an actual difficult tracheal intubation by which the patient's life or health may be threatened.
PICO
Plain language summary
The effect of avoiding neuromuscular blocking agents on conditions for placing a tube in the windpipe of patients undergoing general anaesthesia
Background
General anaesthesia abolishes spontaneous respiration. Use of general anaesthesia is frequently unavoidable during surgical procedures. The ability to maintain breathing by placing a tube in the windpipe of patients undergoing general anaesthesia is therefore crucial. A neuromuscular blocking agent (NMBA) is used for relaxation of muscles of the throat and is traditionally used to ease correct placement of the tube. However, use of an NMBA may cause unwanted side effects. On the other hand, large observational studies have indicated that avoiding NMBA may cause difficulties when the tube is placed during anaesthesia.
Objective
In the present systematic review, we assessed the effect of avoiding NMBA instead of using NMBA on difficulties associated with placing a tube in the windpipe of patients undergoing general anaesthesia. Further, we evaluated the consequences of using or avoiding NMBA on events of pain or injury in the upper part of the throat following placement of a tube in the windpipe.
Study characteristics
We identified 34 randomized controlled trials that met our inclusion criteria. These trials included 3565 patients who were undergoing various surgical procedures in hospital departments. Most trials were conducted in high‐income countries, and most patients were undergoing elective surgery. Trials included patients of both sexes; most were healthy and non‐obese, and staff members did not expect difficulty when placing the tube in the windpipe.
Key results
This review supports that use of NMBA may ensure the best conditions for placing a tube in the windpipe during general anaesthesia. When an NMBA is avoided, risk for pain or injury in the throat is increased following placement of a tube in the windpipe.
Quality of the evidence
Conditions for which a tube is placed in the windpipe are defined in individual trials and may not reflect a situation that many clinicians would consider to be clinically serious. Regarding events of injury and sore throat, only sparse data are available from trials with low risk of bias, although among all included trials, avoiding NMBA increased the risk of pain or injury. We therefore consider our overall findings to reflect evidence of moderate quality.
Authors' conclusions
Summary of findings
| Avoidance vs use of neuromuscular blocking agent for improving conditions during tracheal intubation in adults and adolescents | ||||||
| Patient or population: improving conditions during tracheal intubation or direct laryngoscopy in adults and adolescents | ||||||
| Outcomes | Anticipated absolute effects* (95% CI) | Relative effect of avoidance vs use of NMBA | Number of participants | Quality of the evidence | Comments | |
| Assumed risk Risk with use of NMBA | Corresponding risk Risk with avoidance of NMBA | |||||
| Primary outcomes | ||||||
| Difficult tracheal intubation: low risk of bias trials | Study population | RR 13.27 | 508 | ⊕⊕⊕⊝ Moderatea | TSA shows that the required information size of 8195 for a 20% RRR has not been achieved, but the trial sequential monitoring boundary has been crossed and the TSA‐adjusted CI for the RR is 1.85 to 95.04 | |
| 47 per 1000 | 620 per 1000 | |||||
| Difficult tracheal intubation: all trials | Study population | RR 5.00 | 3565 | ⊕⊕⊝⊝ Lowb | TSA shows that the required information size of 44,661 for a 20% RRR has not been achieved, but the trial sequential monitoring boundary has been crossed and the TSA‐adjusted CI for the RR is 1.20 to 20.77. | |
| 81 per 1000 | 406 per 1000 | |||||
| One or more events of upper airway discomfort or injury: low risk of bias trials | Study population | RR 2.74 | 73 | See comments | Because only 1 low risk of bias trial was identified, no quality of evidence assessment was performed | |
| 162 per 1000 | 444 per 1000 | |||||
| One or more events of upper airway discomfort or injury: all trials | Study population | RR 1.37 | 846 | ⊕⊕⊕⊝ Moderatec | TSA shows that the required information size of 1981 for a 20% RRR has not been achieved, but the trial sequential monitoring boundary has been crossed and the TSA‐adjusted CI for the RR is 1.00 to 1.86. | |
| 273 per 1000 | 374 per 1000 | |||||
| Mortality | Not estimated | Not estimated | Not estimated | 0 (34 studies) | Not estimated | |
| Secondary outcomes | ||||||
| Difficult laryngoscopy: low risk of bias trials | Study population | RR 4.00 | 78 | See comments | Because only 1 low risk of bias trial was identified, no quality of evidence assessment was performed | |
| 26 per 1000 | 103 per 1000 | |||||
| Difficult laryngoscopy: all trials | Study population | RR 2.54 | 1308 | ⊕⊕⊝⊝ Lowd | TSA shows that the required information size of 22,911 for a 20% RRR was not achieved, and in no trials were sequential monitoring boundaries crossed. The TSA‐adjusted CI for the RR is 0.27 to 21.75. | |
| 33 per 1000 | 85 per 1000 | |||||
| *The risk in the intervention group (and its 95% confidence interval) is based on assumed risk in the comparison group and the relative effect of the intervention (and its 95% CI) | ||||||
| GRADE Working Group grades of evidence | ||||||
| aDowngraded one level because of indirectness bDowngraded two levels because of indirectness, heterogeneity, and high or uncertain risk of bias cDowngraded one level because of high or uncertain risk of bias dDowngraded two levels because of imprecision and high or uncertain risk of bias | ||||||
Background
Patients undergoing general anaesthesia lose consciousness and the ability to control breathing and protect their airway. Tracheal intubation is considered a vital procedure that secures the airway and provides the possibility of continued oxygenation. Several studies have identified difficult or failed tracheal intubation as one of the major reasons for anaesthesia‐related mortality and morbidity. Types of morbidity range from sore throat, hoarseness, vocal cord lesion, pharyngeal oedema, and pharyngeal necrosis (Domino 1999), to more severe damage such as rupture or perforation of the pharynx and the oesophagus, aspiration pneumonia, and brain and heart injuries caused by anoxia (Rosenstock 2001). These severe complications may even be fatal (Cooper 2008; Hove 2007; Peterson 2005; Rosenstock 2001). Several studies have focused on one or more patient‐related risk factors associated with difficult intubation (Adnet 1997; el‐Ganzouri 1996; L'Hermite 2009; Lundstrom 2009a; Shiga 2005). Successful tracheal intubation is determined by the anaesthetist's technical and non‐technical skills, as well as by available facilities and the local environment (Rosenstock 2004; Rosenstock 2006).
Use of neuromuscular blocking agents (NMBA) to facilitate tracheal intubation is a widely accepted procedure. Owing to adverse effects, the use of NMBA may be undesirable. Cohort studies (Baillard 2005; Lundstrom 2009a; Lundstrom 2009b; Lundstrom 2009c) have demonstrated that avoidance of neuromuscular blocking drugs may be an independent risk factor for difficult and failed tracheal intubation. Randomized trials have evaluated the conditions for tracheal intubation, possible side effects, and postoperative discomfort by comparing different regimens of anaesthesia induction and avoidance versus use of NMBA (Alcock 1993; Alexander 1999; Bouvet 2008; Combes 2007; Harsten 1997; Lieutaud 2003; McNeil 2000; Mencke 2003; Naguib 2006; Scheller 1992; Stevens 1997).
Description of the condition
A successful tracheal intubation is considered to provide a safe airway. The tube is placed directly and is cuffed within the patient's trachea, thereby ensuring a direct connection to the lower airway. The risk of aspiration of gastric contents into the lungs may be reduced by an appropriately placed tracheal tube. Difficulties with tracheal intubation by direct laryngoscopy can cause serious soft tissue damage (Domino 1999) and are the principal causes of hypoxaemic anaesthetic death and brain damage (Henderson 2004). A review identified difficult airway management, including difficult or failed tracheal intubation, as the main cause of death and severe morbidity related to anaesthesia (Braz 2009). The literature presents various definitions of difficult tracheal intubation (DTI). Performance and graduation of tracheal intubation are described by various parameters such as the number of attempts made for intubation; the span of time needed for intubation; the experience and number of anaesthetists performing the intubation; the type and number of alternative techniques used other than direct laryngoscopy; the lifting force required during the laryngoscopy; whether laryngeal pressure was needed and information on vocal cord mobility (Adnet 1997; ASA guideline 1993; Lundstrom 2009a; Viby‐Mogensen 1996).
Difficult laryngoscopy, which is often used as a surrogate outcome measure for a DTI, is traditionally defined by the (modified) Cormack and Lehane classification (Cormack 1984; Yentis 1998) (Appendix 1).
Description of the intervention
Induction of general anaesthesia can include or exclude the use of a neuromuscular blocking agent. A combination of adjuvant drugs such as hypnotics, opioids, and occasionally local anaesthetic agents is traditionally used for the induction.
The NMBA used for induction may be a depolarizing or a non‐depolarizing drug. Hypnotics may include propofol, thiopental, or etomidate, and opioids may consist of fentanyl, alfentanil, or remifentanil. A local anaesthetic such as lidocaine (Tanaka 2015) may be used intravenously or topically to facilitate tracheal intubation (Woods 2005). After induction has been completed, the patient will undergo tracheal intubation or attempted tracheal intubation with a standard direct laryngoscope.
How the intervention might work
Neuromuscular blocking agents obstruct the nerve impulse at the neuromuscular junction propagated by acetylcholine, causing paralysis of the skeletal muscles. Direct laryngoscopy normally stimulates the oropharynx and activates oropharyngeal reflexes. Use of an NMBA inhibits muscular contractions and improves the conditions for tracheal intubation (Bowman 2006). Both depolarizing and non‐depolarizing NMBA may produce side effects, such as anaphylaxis, cardiovascular effects related to histamine release or direct vagolytic or sympathomimetic properties, bronchospasm, and prolonged paralysis. Depolarizing NMBA may specifically cause muscle pain, increased serum potassium, malignant hyperthermia, and increased intraocular pressure (Appiah‐Ankam 2004).
Why it is important to do this review
Difficult airway management, including a difficult or failed tracheal intubation, remains a major cause of death and severe morbidity related to anaesthesia (Braz 2009). The risk of DTI may be reduced by the choice of an induction strategy including, or avoiding, NMBA for facilitating tracheal intubation by direct laryngoscopy. Use of NMBA may be associated with serious adverse events.
Objectives
To evaluate the effects of avoiding neuromuscular blocking agents (NMBA) versus using NMBA on difficult tracheal intubation (DTI) for adults and adolescents allocated to tracheal intubation with direct laryngoscopy. To look at various outcomes, conduct subgroup and sensitivity analyses, examine the role of bias, and apply trial sequential analysis (TSA) (Brok 2008; Brok 2009; Thorlund 2009; Wetterslev 2008) to examine the level of available evidence for this intervention.
Methods
Criteria for considering studies for this review
Types of studies
We included randomized controlled trials (RCTs).
We included unpublished trials only if trial data and methodological descriptions were provided in written form or through direct contact with study authors.
We excluded trials using quasi‐randomization as well as observational studies.
Types of participants
We included participants 14 years of age or older who underwent (attempt of) tracheal intubation by direct laryngoscopy regardless of acute or elective surgical status or investigational procedures.
Types of interventions
Avoidance of neuromuscular blocking agents (= intervention) versus use of neuromuscular blocking agents (= control) to facilitate tracheal intubation. We defined use of NMBA as the control intervention, as it is considered usual standard for airway management, and we defined avoidance of NMBA as the experimental intervention.
Types of outcome measures
Primary outcomes
-
Difficult tracheal intubation: As no international consensus has been reached on defining an intubation score, we accepted the definitions of DTI presented in the individual articles. If study authors defined a difficult laryngoscopy by the Cormack and Lehane score (Cormack 1984) or by the modified Cormack and Lehane score (Yentis 1998) as a difficult intubation, we included and reported the Cormack and Lehane score as the outcome measure. Difficult laryngoscopy is a surrogate outcome for a DTI. Therefore, if a trial reported both an intubation score and the Cormack and Lehane score based on the same population in the same assessment, we extracted only the intubation score for outcome assessment
-
Overall mortality: We used maximal follow‐up data from each trial
-
One or more events of upper airway discomfort or injury (e.g. sore throat, hoarseness, vocal cord lesion, minor pharyngeal injury)
Secondary outcomes
-
One or more major serious events: pulmonary aspiration, brain and heart injuries (e.g. caused by anoxia, hypotension, bradycardia or tachycardia during tracheal intubation)
-
Difficult laryngoscopy, as defined by the Cormack and Lehane score (Cormack 1984) or the modified Cormack and Lehane score (Yentis 1998)
Search methods for identification of studies
Electronic searches
We searched the Cochrane Central Register of Controlled Trials (CENTRAL; 2017, Issue 1) (the Cochrane Library); MEDLINE (Ovid) (1950 to January 2017); Embase (Ovid) (1980 to January 2017); BIOSIS (Ovid) (1993 to January 2017); International Web of Science (1964 to January 2017); Latin American Caribbean Health Sciences Literature (LILACS) via BIREME (1982 to January 2017); the Chinese Biomedical Literature Database; advanced Google; and the Cumulative Index to Nursing and Allied Health Literature (CINAHL) via EBSCO host (1980 to January 2017).
We utilized a systematic and sensitive search strategy to identify relevant RCTs with no language or date restrictions. We conducted the search within six months of the date the draft review was emailed to the editorial office. For specific information regarding our search strategies, please see the Appendices (Appendix 2, CENTRAL; Appendix 3, MEDLINE; Appendix 4, Embase; Appendix 5, BIOSIS; Appendix 6, CINAHL; Appendix 7, LILACS).
Searching other resources
We searched for ongoing clinical trials and unpublished studies on the following Internet sites (11 January 2017).
We handsearched the reference lists of reviews, randomized and non‐randomized studies, and editorials for additional studies.
Data collection and analysis
Selection of studies
In the process of selecting trials for inclusion in the review, two review authors (LHL and AN or CD) independently screened titles and abstracts to identify eligible trials and remove obviously irrelevant reports. After retrieving the full texts of potentially eligible reports, the review authors (LHL and one of the following: AN, CD, CVR, JT) examined the full‐text reports. We contacted the main authors of studies and experts in this field and asked about missed, unreported, and ongoing trials. Finally, two review authors (LHL and one of the following: AN, CD, CVR, JT) decided which trials would be included and proceeded to data collection. We resolved disagreements by discussion, and a third review author (JW) resolved residual disagreements.
Data extraction and management
LHL and AN, CD, CVR, or JT independently extracted and collected data on a standardized paper form (Appendix 8). We were not blinded to study author, institution, or source of trial publication. We resolved disagreements by discussion, and a third review author (JW) resolved residual disagreements. If necessary, we approached all corresponding authors of included trials for additional information on the review's outcome measures and risk of bias components. For more information, please see the section titled Contributions of authors.
Investigators in some trials randomized participants to multiple intervention and control groups or both (more than two groups, as in dose‐finding studies). We combined all relevant experimental intervention groups into a single intervention group and combined all relevant control intervention groups into a single control group (Higgins 2011).
Assessment of risk of bias in included studies
We evaluated the validity and design characteristics of each trial. To draw conclusions about the overall risk of bias for an outcome, we found it necessary to evaluate trials for major sources of bias, also defined as domains (random sequential generation, allocation concealment, blinding, incomplete outcome data, selective reporting, and other bias). Assessment of overall risk of bias involved consideration of the relative importance of the different domains (Higgins 2011).
Even the most realistic assessment of the validity of a trial may involve subjectivity because it was impossible to know the extent of bias (or even the true risk of bias) of a given trial. Some domains affected risk of bias across trial outcomes (e.g. sequential generation, allocation sequential concealment), and others, such as blinding and incomplete outcome data, may have had different risks of bias for different outcomes within a trial. Thus, risk of bias was not the same for all outcomes in a trial. We performed separate sensitivity analyses for patient‐reported outcomes (subjective outcomes; e.g. upper airway discomfort) and for mortality (Higgins 2011).
We defined trials as having low risk of bias only if they adequately fulfilled the criteria listed in the Cochrane Handbook for Systematic Reviews of Interventions, and we performed summary assessments of risk of bias for each important outcome (across domains) within and across studies. We applied a 'risk of bias graph' and a 'risk of bias summary figure' (Higgins 2011).
We presented results for all outcomes including adverse events in a 'Summary of findings' table (Higgins 2011).
As no sufficiently well‐designed formal statistical method is available to combine the results of trials with high and low risk of bias, Cochrane review authors usually incorporate risk of bias assessments by comparing meta‐analyses of trials with low risk and high or uncertain risk of bias (Higgins 2011). We used the risk of bias table described in the Cochrane Handbook for Systematic Reviews of Interventions (Section 8.5) (Higgins 2011) as a tool for assessing risk of bias in included studies. We assessed risk of bias for different domains as described below.
Random sequence generation
Low risk of bias: The method used generates random sequences (e.g. random number generation, toss of coin).
Unclear: No information on random sequence generation is available.
High risk of bias: Alternate medical record numbers or other non‐random sequence generation was used.
Allocation concealment
Low risk of bias: Allocation method prevents investigators or participants from knowing the next allocation (e.g. central allocation; sealed opaque envelopes; serially numbered, sequentially numbered but otherwise identical vehicles, including their contents; other descriptions of convincing concealment of allocation).
Unclear: No information on allocation method is available, or the description provided did not allow a clear distinction.
High risk of bias: Allocation method allowed investigators or participants to know the next allocation (e.g. alternate medical record numbers; reference to case record numbers or date of birth; open allocation sequence, unsealed envelopes).
Blinding
Low risk of bias: We considered blinding as adequate if participants and personnel were kept unaware of intervention allocations after participants were enrolled into the study, and if the method of blinding involved placebo.
Unclear: Blinding was not described.
High risk of bias: Study was not double‐blinded; was categorized as an open‐label study; or was conducted without use of placebo.
Incomplete outcome data
Low risk of bias: Numbers and reasons for dropouts and withdrawals in the intervention groups were described, or it was specified that no dropouts or withdrawals occurred.
Unclear: The report gave the impression that no dropouts or withdrawals had occurred, but this was not specifically stated.
High risk of bias: Numbers and reasons for dropouts and withdrawals were not described.
Selective reporting
Low risk of bias: Report includes predefined or clinically relevant and reasonably expected outcomes.
Unclear: Study did not report or did not report fully all predefined or clinically relevant and reasonably expected outcomes, or it is unclear whether data on these outcomes were recorded.
High risk of bias: Report did not include one or more clinically relevant and reasonably expected outcomes; data on these outcomes were likely to have been recorded.
Baseline imbalance
Low risk of bias: We noted no baseline imbalance in important characteristics.
Unclear: Baseline characteristics were not reported.
High risk of bias: Baseline imbalance was due to chance or to imbalanced exclusion after randomization.
Measures of treatment effect
Most often, a dichotomous outcome measure is used to assess whether an intubation is difficult or not. We reported all dichotomous outcomes as risk ratios (RR) with 95% confidence intervals (CI). For mortality, which we expected to be a rare outcome, we calculated the Peto odds ratio.
Unit of analysis issues
We planned to include studies with a non‐standard design, such as cluster‐randomized trials and studies with more than two intervention groups. We considered ‘cross‐over trials’, ‘repeated observations on participants’, and ‘multiple treatment attempts’ as unlikely designs for evaluating the current intervention. We included all studies with a non‐standard design and analysed them as described in the Cochrane Handbook for Systematic Reviews of Interventions (Higgins 2011).
Dealing with missing data
We contacted all first authors and contact persons of trials with missing data to retrieve relevant data. We performed a modified intention‐to‐treat (ITT) analysis while including, if possible, all randomized participants who underwent tracheal intubation or did not withdraw their consent before surgery.
ITT analysis is recommended to minimize bias in design, follow‐up, and analysis of the efficacy of RCTs. It yields a pragmatic estimate of the benefit of a change in treatment policy rather than of potential benefit for patients who received treatment exactly as planned (Hollis 1999). Full application of ITT is possible only when complete outcome data are available for all randomized participants. Although about half of all published reports of RCTs state that ITT was used, handling of deviations from randomized allocation varies widely, and many trials have missing data for the primary outcome variable; methods used to deal with this are generally inadequate, potentially leading to bias (Hollis 1999).
Performing an ITT analysis in a systematic review is not straightforward in practice, in that review authors must decide how to handle missing outcome data from contributing trials (Gamble 2005). No consensus exists about how missing data should be handled in ITT analyses, and different approaches may be appropriate in different situations (Higgins 2011; Hollis 1999).
In the case of missing data, we used a 'complete‐case analysis' for our primary outcomes, which simply excluded all participants for whom outcome data were missing from the analysis. Additionally, we performed sensitivity analyses covering best‐ and worst‐case scenarios (with 'best' and 'worst' defined with respect to effect on the chosen outcome with use of NMBA).
Assessment of heterogeneity
We quantified the degree of heterogeneity observed in the results using diversity (D2) (Wetterslev 2009) and inconsistency factor (I2) statistics, which we interpreted as the proportion of total variation observed between trials that was attributable to differences between trials rather than to sampling error (chance) (Higgins 2002). A finding of P ≤ 0.10 indicated significant heterogeneity, and the I2 statistic has suggested thresholds for low (25% to 49%), moderate (50% to 74%), and high (≥ 75%) heterogeneity (Higgins 2003). If I2 = 0%, we reported only results from the fixed‐effect model. In the case of I2 > 0%, we reported results from both random‐effects and fixed‐effect models. However, we believe that use of a fixed‐effect model provided little value in cases of substantial heterogeneity, which we suspected would be the case in this review owing to inclusion of various patient types, adjuvant medicines, and outcome reporting. So we emphasized results from the random‐effects model unless a few trials dominated the meta‐analysis (e.g. > 50% of the accumulated fixed weight percentage). In cases of I2 > 0% (for mortality and difficult intubation outcomes), we explored possible causes of heterogeneity by performing meta‐regression analyses and relevant subgroup and sensitivity analyses. We aimed to meta‐analyse trial results only in cases of low to moderate clinical heterogeneity.
Assessment of reporting biases
Publication bias occurs when publication of research results depends on their nature and direction (Dickersin 1990). We examined this by creating funnel plots to detect publication bias or a difference between small and large studies ('small study effects') expressed by asymmetry (Egger 1997). In cases of asymmetry, we applied the Arcsine‐Thompsen test, as proposed by Rücker (Rücker 2008). We defined funding bias as bias in the design, outcome, and reporting of industry‐sponsored research to show that a drug has a favourable outcome (Bekelman 2003). Relationships between industry, scientific investigators, and academic institutions are widespread and often result in conflicts of interest (Bekelman 2003). We conducted a sensitivity analysis to examine the role of funding bias.
Data synthesis
We used Review Manager Software (RevMan 5.3). We calculated the RR with 95% CIs for dichotomous variables (binary outcomes) as well as the risk difference (Keus 2009), but if results were similar, we reported only the RR. We used D2 (Wetterslev 2009) and the I2 statistic (Higgins 2002) to describe heterogeneity among included trials. We planned to explore causes of substantial heterogeneity by performing meta‐regression using Comprehensive Meta‐Analysis (CMA), version one, and Stata, version nine. We used the Chi2 test to provide an indication of heterogeneity between studies, with P ≤ 0.10 considered significant.
Adverse effects may be rare but serious and hence important (Sutton 2002) when meta‐analysis is applied in combining results from several trials with binary outcomes (i.e. event or no event). Most meta‐analytical software packages do not include options for analyses that include trials with 'zero event' in both arms (intervention vs control) for calculating RR. Exempting these trials from calculation of RR and CI may lead to overestimation of a treatment effect, as the control event proportion may be overestimated. Thus we performed a sensitivity analysis by applying empirical continuity corrections to our zero event trials, as proposed by Sweeting et al (Keus 2009; Sweeting 2004), and by applying imaginary small numbers in both arms.
Meta‐analyses may result in type I errors due to systematic errors (bias) or may produce random errors due to repeated significance testing when meta‐analyses are updated with new trials (Brok 2008; Brok 2009; Thorlund 2009; Wetterslev 2008; Wetterslev 2009). Bias from trials with high risk of bias, outcome reporting bias, publication bias, early stopping for benefit, and small trial bias may result in spurious P values.
In a single trial, interim analysis increases the risk of type I errors. To avoid type I errors, we applied group sequential monitoring boundaries (Lan 1983) to decide whether a trial could be terminated early because of a sufficiently small P value, that is, when the cumulative z‐curve crosses the monitoring boundary. Sequential monitoring boundaries can be applied to meta‐analyses; these are called trial sequential monitoring boundaries. In trial sequential analysis (TSA), the addition of each trial to a cumulative meta‐analysis is regarded as an interim meta‐analysis and helps to show whether additional trials are needed (Wetterslev 2008). So far, several meta‐analyses and reviews have been published, and these have included increasing trial results as new trials have been published (Al‐Niaimi 2009; Chura 2007; Qadan 2009). Therefore, it seems appropriate to adjust new meta‐analyses for multiple testing on accumulating data to control the overall type 1 error risk in cumulative meta‐analysis (Pogue 1997; Pogue 1998; Thorlund 2009; Wetterslev 2008).
The idea in TSA is that if the cumulative z‐curve crosses a boundary, a sufficient level of evidence is reached and no further trials may be needed. However, evidence is insufficient to permit a conclusion if the z‐curve does not cross a boundary or does not surpass the required information size. To construct trial sequential monitoring boundaries (TSMB), the required information size is needed and will be calculated as the least number of participants needed to conduct a well‐powered single trial (Brok 2008; Pogue 1998; Wetterslev 2008). We adjusted the required information size for heterogeneity by applying a D2 adjustment factor (Wetterslev 2009). We will apply TSA because it prevents an increase in the risk of type I error (< 5%) caused by potential multiple updating and testing on accumulating data whenever new trial results are included in a cumulative meta‐analysis (Pogue 1997; Pogue 1998) and provides important information needed to estimate the level of evidence for the experimental intervention (Pogue 1997; Pogue 1998; Thorlund 2009). Additionally, TSA provides important information regarding the need for additional trials and required information size (Wetterslev 2008; Wetterslev 2009). We applied TSMB according to an information size suggested by trials with low risk of bias (Wetterslev 2008; Wetterslev 2009), an a priori 20% relative risk reduction (RRR) of difficult or failed intubation, and an intervention effect suggested by the 95% confidence limit closest to 1 in the traditional random‐effects meta‐analysis. As mortality seems low or even absent in the trials conducted so far, and hence the ability to detect small intervention effects is low, we also planned to perform a TSA with an information size estimated on the basis of an a priori 50% RRR of mortality (Wetterslev 2008; Wetterslev 2009).
Subgroup analysis and investigation of heterogeneity
We performed the following subgroup analyses of our primary outcomes.
-
Avoidance of NMBA versus use of NMBA (comparisons of subgroups of depolarizing vs non‐depolarizing NMBA).
-
Avoidance of NMBA versus use of NMBA in combination with or without remifentanil or alfentanil.
-
Avoidance of NMBA versus use of NMBA in combination with or without local anaesthetic drug.
-
Avoidance of NMBA versus use of NMBA (comparisons of subgroups of trials using anticipation of a difficult airway as an inclusion criterion vs those not using anticipation of a difficult airway as an inclusion criterion).
When analyses of various subgroups with a binary outcome were significant, we performed a test of interaction (Altman 2003). We considered P < 0.05 to be indicative of significant interaction between the effect of no use of NMBA on DTI and the subgroup category (Higgins 2011; Chapters 9.6.1 and 9.7).
We planned to explore causes of moderate to high heterogeneity using meta‐regression including the covariates listed below. We ranked these covariates according to their importance and included them in the meta‐regression according to the number of relevant trials included in this review.
-
Mean age of trial population at baseline.
-
Fraction of gender of trial population at baseline.
-
Fraction of a Mallampati score grade I to IV.
-
Thyromental distance (dichotomous or continuous measurement).
-
Mouth opening or interincisor gap (dichotomous or continuous measurement).
-
Neck extension (dichotomous or continuous measurement).
-
Mandible subluxation (dichotomous or continuous measurement).
-
Mean body mass index (BMI) of trial population at baseline.
-
Time from induction to start of intubation (seconds).
Sensitivity analysis
We performed a sensitivity analysis to evaluate the impact of trials with high or uncertain risk of bias versus trials with low risk of bias.
'Summary of findings' tables
We used the principles of the GRADE system (Guyatt 2013; Guyatt 2011) to assess the quality of the body of evidence associated with specific outcomes.
-
DTI.
-
All‐cause mortality (maximal follow‐up data from each trial).
-
One or more events of upper airway discomfort or injury (e.g. sore throat, hoarseness, vocal cord lesion, minor pharyngeal injury).
-
One or more major serious events (defined by pulmonary aspiration, brain and heart injuries (caused by e.g. anoxia, hypotension, bradycardia, or tachycardia during tracheal intubation)).
-
Difficult laryngoscopy, defined by the Cormack and Lehane score (Cormack 1984) or the modified Cormack Lehane score (Yentis 1998).
The GRADE approach appraises the quality of a body of evidence according to the extent to which one can be confident that an estimate of effect or association reflects the item being assessed. Quality considers:
-
within‐study risk of bias (methodological quality);
-
directness of the evidence;
-
heterogeneity of the data;
-
precision of effect estimates; and
-
risk of publication bias.
Results
Description of studies
See Characteristics of included studies and Characteristics of excluded studies.
Results of the search
We identified 4400 references through electronic and manual searches (Figure 1). We updated the search on 11 January 2017. After excluding duplicate reports, we screened the abstracts of 2822 references. We obtained 37 publications for full‐text review. Thirty‐four publications were RCTs and met our inclusion criteria for the comparison of avoiding NMBA or using NMBA to facilitate tracheal intubation.
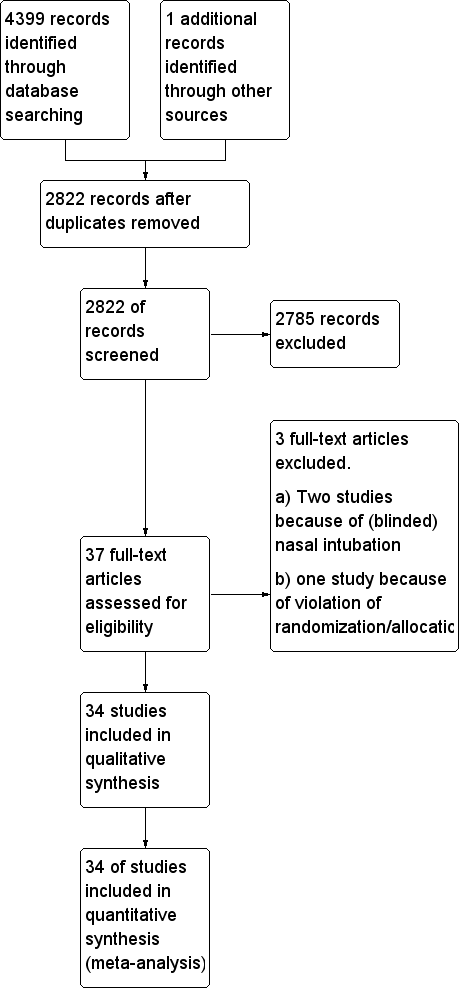
Study flow diagram.
Included studies
Most of the trials identified for this comparison were published in English. Two trials were published in French (Dominici 1990; Rousseau 1995), one in German (Striebel 1995), and one in Spanish (González Obregón 2010). Included trials enrolled 3565 participants, 1507 of whom were randomized to no use of NMBA, and 2058 to use of NMBA. Table 1 shows characteristics of the 34 included trials, and Table 2 shows characteristics of the interventions. The number of randomized participants included in individual trials ranged from 40 to 300.
| Study ID | NMBA | Country | Language | Randomized | Sex | Age, years | Weight, kg | BMI | ASA class included | Expected difficult airway excluded | Overweight excluded |
| C1: suxamethonium 1 mg/kg | UK | English | 60 | C: 12F/8M I1: 11F/9M I2: 11F/9M | C: 41.7 (17.4) I1: 40.3 (10.6) I2: 44.2 (15.0) | C: 76.3 (15.0) I1: 75.5 (15.1) I2: 76.6 (16.8) | ns | I‐II | yes | ||
| C1: rocuronium 0.1 mg/kg C2: rocuronium 0.13 mg/kg | UK | English | 60 | ns | C1: 30 C2: 29 I1: 27 | C1: 74 C2: 72 I1: 64 | ns | ns | yes | yes | |
| C1: suxamethonium 1 mg/kg | USA | English | 64 | C1: 22F/11M I1: 21F/10M | C1: 34 (11) I1: 35 (11) | C1: 69 (14) I1: 65 (13) | I‐II | ||||
| C1: cisatracurium 0.15 mg/kg | France | English | 130 | C1: 65F I1: 65F | C1: 41.5 (12.9) I1: 40.7 (15.2) | ns | C1: 24.6 (5.4) I1: 23.0 (3.5) | I‐II | yes | ||
| C1: rocuronium 0.6 mg/kg | France | English | 300 | C1: 73F/77M I1: 69F/81M | C1: 41 (18‐70) I1: 43 (18‐66) | C1: 73 (13) I1: 70 (13) | ns | I‐II | yes | yes | |
| C1: suxamethonium 1.5 mg/kg | France | French | 60 | C1: 9F/21M I1: 9F/21M | C1: 48.4 (3.4) I1: 50.1 (2.9) | C1: 62.8 (2.5) I1: 61.6 (2.1) | ns | I‐III | |||
| C1: rocuronium 0.6 mg/kg | Columbia | Spanish | 100 | C1: 33F/17M I1: 33F/17M | C1: 34.7 (11.0) I1: 32.8 (12.3) | ns | ns | I‐II | yes | ||
| C1: succinylcholine 1 mg/kg | Turkey | English | 80 | C1: 19F/21M I1: 22F/18M | C1: 49.6 (8.4) I1: 47.9 (8.7) | C1: 77.3 (13.1) I1: 73.2 (14.4) | ns | I‐II | |||
| C1: rocuronium 0.06 mg/kg + succinylcholine 1.5 mg/kg | USA | English | 50 | C1: 15F/9M I1: 5F/18M | C1: 39.0 (13.3) I1: 43.0 (14.5) | C1: 75.0 (15.0) I1: 81.0 (13.0) | C1: 25.9 (4.6) I1: 26.5 (2.9) | I‐II | yes | ||
| C1: suxamethonium 1 mg/kg | Sweden | English | 80 | C1: 26F/13M I1: 23F/14M | C1: 41.8 (13) I1: 39.5 (14) | ns | ns | I‐II | |||
| C1: suxamethonium 1.5 mg/kg | Thailand | English | 120 | C1: 54F/6M I1: 54F/6M | C1: 40.6 (9.1) I1: 39.7 (9.2) | C1: 55.8 (10.8) I1: 55.1 (9.1) | ns | I‐II | yes | yes | |
| C1: suxamethonium 1.5 mg/kg | Nigeria | English | 96 | C1: 12F/32M I1: 21F/23M | C1: 30.8 (9.0) I1: 32.6 (8.0) | C1. 69.0 (7.4) I1: 68.3 (6.6) | I‐II | yes | |||
| C1: suxamethonium 0.6 mg/kg | China | English | 55 | C1: 27F/0M I1: 28F/0M | C1: 38.4 (10.9) I2: 36.3 (9.9) | C1: 58.1 (7.0) I2: 58.2 (7.9) | ns | I‐II | yes | ||
| C1: ORG 9487 (rapacuronium) 0.5 mg/kg C2: ORG 9487 (rapacuronium) 1.0 mg/kg C3: ORG 9487 (rapacuronium) 1.5 mg/kg C4: ORG 9487 (rapacuronium) 2.0 mg/kg C5: ORG 9487 (rapacuronium) 2.5 mg/kg | USA | English | 181 | C1: 20F/10M C2: 18F/9M C3: 17F/15M C4: 15F/13M C5: 22F/9M I1: 19F/11M | C1: 51.3 C2: 49.6 C3: 52.0 C4: 50.6 C5: 50.2 I1: 52.6 | C1: 67.3 C2: 70.5 C3: 68.6 C4: 71.3 C5: 75.9 I1: 69.7 | ns | I‐III | yes | ||
| C1: rocuronium 0.4 mg/kg C2: rocuronium 0.8 mg/kg C3: rocuronium 1.2 mg/kg | USA | English | 80 | C1: 2F/18M C2: 6F/14M C3: 10F/10M I1: 5F/15M | C1: 39.7 (7.5) C2: 39.5 (14.3) C3: 39.2 (10.5) I1: 39.3 (11.8) | C1: 75.0 (16.9) C2: 78.6 (15.8) C3: 67.4 (14.8) I1: 73.4 (16.6) | ns | I‐II | yes | ||
| C1: rapacuronium 1.0 mg/kg C2: rapacuronium 1.2 mg/kg C3: rocuronium 0.50 mg/kg | USA | English | 100 | ns | range: 18‐65 | ns | range: 17.5‐27.5 | I‐II | yes | ||
| C1: atracurium 0.5 mg/kg C2: atracurium 0.5 mg/kg C3: atracurium 0.5 mg/kg | France | English | 170 | C1: 3F/42M C2: 7F/41M C3: 8F/39M I1: 2F/18M | C1: 52.9 (11.8) C2: 51.3 (12.6) C3: 56.3 (11.9) I1: 50.4 (10.7) | ns | C1: 23.7 (3.2) C2: 23.1 (3.2) C3: 23.6 (3.4) I1: 23.3 (3.9) | I‐II | yes | ||
| C1: rocuronium 0.3 mg/kg C2: rocuronium 0.45 mg/kg C3: rocuronium 0.6 mg/kg C4: rocuronium 0.3 mg/kg C5: rocuronium 0.45 mg/kg C6: rocuronium 0.6 mg/kg | UK | English | 140 | C1: 4F/16M I1: 2F/8M I2: 4F/6M | C1: 29 (11) I1: 29 (11) I2: 30 (9) | C1: 77(16) I1: 72 (12) I2: 73 (15) | ns | I‐II | yes | yes | |
| C1: succinylcholine 1 mg/kg | UK | English | 60 | ns | C1: 44 (15) I1: 39 (11) I2: 40 (13) | C1: 75 (10) I1: 76 (15) I2: 71 (12) | ns | I‐II | yes | yes | |
| C1: atracurium 0.5 mg/kg | Germany | English | 80 | C1: 19F/18M I1: 18F/18M | C1: 47.2 (13.2) I1: 47.7 (14.3) | C1: 77.7 (16) I1: 74.2 (15) | I‐II | yes | yes | ||
| I1: rocuronium 0.45 mg·kg‐1 | Germany | English | 83 | C1: 16F/24M I1: 16F/23M | C1: 50 (16) I1: 48 (17) | C1: 83.8 (16) I1: 79.6 (15) | C1: 28.2 (4.3) I1: 26.5 (3.7) | I‐III | yes | yes | |
| C1: succinylcholine 0.3 mg/kg C2: succinylcholine 0.5 mg/kg C3: succinylcholine 1.0 mg/kg | Saudi Arabia | English | 200 | C1: 25F/25M C2: 23F/27M C3: 28F/22M I1: 23F/27M | C1: 30.9 (28‐34) | C1: 66.6 (64‐70) | ns | I | yes | ||
| C1: succinylcholine 0.3 mg/kg C2: succinylcholine 0.5 mg/kg C3: succinylcholine 1.0 mg/kg C4: succinylcholine 1.5 mg/kg C5: succinylcholine 2.0 mg/kg | Saudi Arabia | English | 180 | C1: 17F13M I1: 19F/11M | C1: 33.5 (8.7) | C1: 67.8 (10.3) | C1: 25.6 (2.8) | I | yes | ||
| C1: suxamethonium 0.25 mg/kg C2: suxamethonium 0.5 mg/kg | USA | English | 60 | C1: 12F/8M C2: 12F/8M I1: 14F/6M | C1: 28.6 (17‐55) C2: 29.0 (16‐53) I1: 27.0 (18‐53) | C1: 66.2 (13.6) C2: 64.4 (11.2) I1: 68.1 (13.6) | ns | I‐II | |||
| C1: cisatracurium 0.1 mg/kg | China | English | 40 | C1: 14F/6M I1: 9F/11M | C1: 45.2 (7.4) I1: 43.3 (6.7) | C1: 63.8 (9.5) I1: 64.6 (7.9) | C1: 23.7 (2.8) I1: 23.3 (3.1) | I‐II | yes | yes | |
| C1: mivacurium 0.25 mg/kg C2: rocuronium 0.45 mg/kg C3: rocuronium 0.6 mg/kg C4: rocuronium 0.9 mg/kg C5: rocuronium 1.2 mg/kg | USA | English | 100 | ns | ns | ns | ns | I‐II | yes | yes | |
| C1: vecuronium 0.08 mg/kg | France | French | 152 | ns | C1: 23 (5) I1: 25 (8) | C1: 71 (10) I1: 71 (11) | ns | I | yes | ||
| C1: d‐tubocurarine 3 mg and succinylcholine 1 mg/kg | USA | English | 75 | C1: 8F/7M I1: 10F/5M I2: 11F/4M I3: 13F/2M I4: 10F/5M | C1: 37 (10) I1: 33 (9) I2: 30 (10) I3: 35 (11) I4: 36 (16) | C1: 77 (20) I1: 65 (11) I2: 66 (15) I3: 66 (12) I4: 68 (16) | ns | I | yes | ||
| C1: rocuronium 0.6 mg/kg C2: rocuronium 0.45 mg/kg C3: rocuronium 0.3 mg/kg | Germany | English | 120 | C1: 13F/17M C2: 13F/17M C3: 14F/16M I1: 14F/16M | C1: 37 (11) C2: 35 (11) C3: 36 (12) I1: 37 (11) | C1: 72 (14) C2: 75 (13) C3: 75 (12) I1: 70 (14) | ns | I‐II | yes | ||
| C1: suxamethonium 1 mg/kg | New Zealand | English | 100 | C1: 7F/18M I1: 9F/16M I2: 8F/17M I3: 10F/15M | C1: 34.3 (14.0) I1: 36.8 (12.6) I2: 29.6 (9.7) I3: 37.7 (12) | C1: 66 (10) I1: 62 (11) I2: 63 (15) I3: 61 (11) | ns | I‐II | yes | ||
| C1: d‐tubocurarine 3 mg and succinylcholine 1 mg/kg | USA | English | 140 | C1: 12F/8M I1: 12F/8M I2: 15F/5M I3: 17F/3M I4: 17F/3M I5: 15F/5M I6: 14F/6M | C1: 35 (9) I1: 38 (12) I2: 34 (11) I3: 37 (10) I4: 34 (9) I5: 33 (11) I6: 37 (14) | C1: 70 (8) I1: 72 (17) I2: 70 (14) I3: 72 (10) I4: 72 (13) I5: 72 (18) I6: 70 (13) | ns | I‐II | yes | yes | |
| C1: vecuronium 1 mg + succinylcholine 1 mg/kg C2: vecuronium 1 mg + succinylcholine 1 mg/kg | Germany | German | 100 | C1: 25F C2: 25F I1: 25F I2: 25F | C1: 47.8 (11.7) C2: 43.8 (9.5) I1: 46.5 (12.7) I2: 46.0 (12.4) | C1: 62.6 (9.4) C2: 68.2 (14) I1: 64.9 (10.1) I2: 70.8 (14.6) | ns | I‐II | |||
| C1: succinylcholine 1 mg/kg | Malaysia | English | 120 | C1: 16F/14M I1: 13F/17M I2: 18F/12M I3: 12F/17M | C1: 35.7 (16) I1: 35.5 (12) I2: 35.4 (13) I3: 35.7 (11) | C1: 60.2 (8.9) I1: 66.0 (13.1) I2: 63.4 (12.9) I3: 60.1 (10.8) | ns | I‐II | yes | ||
| C1: atracurium 0.5 mg/kg | Iran | English | 66 | 69.7% M | 31.6 (13) | ns | ns | I‐II | yes |
ns = not specified; The values in parentheses are standard deviation or range
| Study ID | NMBA | Randomized/ Analysed | Hypnotic | Opioid | Local anaesthetic | Difficult intubation events/ | Difficult laryngos‐ copy events/ | Upper airway discomfort or injury events/total |
| C1: suxamethonium 1 mg/kg | 60/60 | C1: propofol 2 mg/kg I1: propofol 2 mg/kg I2: propofol 2 mg/kg | C1: none I1: alfentanil 50 μg/kg I2: remifentanil 2 μg/kg | None | C1: 0/20 I1: 3/20 I2: 13/20 | ns | ns | |
| C1: rocuronium 0.1 mg/kg C2: rocuronium 0.3 mg/kg | 60/60 | C1: propofol 2.5 mg/kg C2: propofol 2.5 mg/kg I1: propofol 2.5 mg/kg | C1: alfentanil 10 μg/kg C2: alfentanil 10 μg/kg I1: alfentanil 10 μg/kg | Lidocaine 10 mg IV | C1: 14/20 C2: 2/20 I1: 19/20 | ns | ns | |
| C1: suxamethonium 1 mg/kg | 64/64 | C1: thiopenthal 5 mg/kg I1: propofol 2 mg/mL | C1: none I1: alfentanil 50 μg/kg | None | C1: 0/33 I1: 1/31 | C1: 0/33 I1: 1/31 | ns | |
| C1: cisatracurium 0.15 mg/kg | 130/129 | C1: propofol 2.5 mg/kg I1: propofol 2.5 mg/kg | C1: remifentanil 2 μg/kg I1: remifentanil 2 μg/kg | None | C1: 0/64 I1: 3/65 | C1: 1/64 I1: 1/65 | C1: 17/64 I1: 14/65 | |
| C1: rocuronium 0.6 mg/kg | 300/300 | C1: propofol 2.5 mg/kg I1: propofol 2.5 mg/kg | C1: alfentanil 15 µg/kg I1: alfentanil 40 µg/kg | None | C1: 1/150 I1: 18/150 | C1: 5/150 I1: 18/150 | C1: 64/150 I1: 86/150 | |
| C1: suxamethonium 1.5 mg/kg | 60 | C1: propofol 3 mg/mL I1: propofol 3 mg/mL | C1: alfentanil 7‐10 µg/kg I1: alfentanil 7‐10 µg/kg | Lidocaine (2%): IV + topical Lidocaine 5% | C1: 10/30 I1: 11/30 | C1: 5/30 I1: 15/30 | ns | |
| C1: rocuronium 0.6 mg/kg | 100/100 | C1: propofol 1‐2 mg/kg I1: Sevoflurane 3% + propofol 2 mg/kg | C1: remifentanil 1‐2 μg/kg in 1 min + 0.15 µ/kg/min in1 min I1: remifentanil 0.6 µ/kg/min for 5 min | None | C1: 4/50 I1: 1/50 | C1: 4/50 I1: 1/50 | C1: 0/50 I1: 0/50 | |
| C1: succinylcholine 1 mg/kg | 80/80 | C1: propofol 2 mg/kg I1: propofol 2 mg/kg | C1: remifentanil 1 μg/kg I1: remifentanil 4 μg/kg | None | C1: 5/40 I1: 0/40 | ns | C1: 2/40 I1: 4/40 | |
| C1: rocuronium 0.06 mg/kg + succinylcholine 1.5 mg/kg | 50/47 | C1: propofol 2 mg/kg I1: propofol 2 mg/kg | C1: none I1: remifentanil 4 μg/kg | Lidocaine 0.5 mg/kg IV | C1: 2/24 I1: 3/23 | ns | ns | |
| C1: suxamethonium 1 mg/kg | 80/79 | C1: thiopental 5 mg/kg I1: propofol 2.5 mg/kg | C1: alfentanil 10 μg/kg I1: alfentanil 10 μg/kg | None | C1: 0/40 I1: 6/39 | C1: 0/40 I1: 2/39 | ns | |
| C1: suxamentonium 1.5 mg/kg | 120/120 | C1: thiopenthal 5 mg/kg + (N2O) I1: sevoflurane 8% | C1: fentanyl 1.5 μg/kg I1: fentanyl 1.5 μg/kg | None | C1: 0/60 I1: 4/60 | ns | ns | |
| C1: suxamethonium 1.5 mg/kg | 96/88 | C1: propofol 2.0 mg/kg I1: propofol 2.0 mg/kg | None | C1: none I1: lidocaine IV 1.5 mg/kg | C1: 0/44 I1: 18/44 | ns | ns | |
| C1: suxamethonium 0.6 mg/kg | 55/55 | C1: propofol 2 mg/kg I1: propofol 2 mg/kg | C1: remifentanil 1 μg/kg I1: remifentanil 1.5 μg/kg | None | C1: 1/27 I2: 13/28 | ns | ns | |
| C1: ORG 9487 (rapacuronium) 0.5 mg/kg C2: ORG 9487 (rapacuronium) 1.0 mg/kg C3: ORG 9487 (rapacuronium) 1.5 mg/kg C4: ORG 9487 (rapacuronium) 2.0 mg/kg C5: ORG 9487 (rapacuronium) 2.5 mg/kg | 181/176 | C1: thiopental 3‐6 mg/kg I1: thiopental 3‐6 mg/kg | C1: fentanyl 0.5‐3 μm/kg I1: fentanyl 0.5‐3 μm/kg | None | C1: 9/30 I1: 18/30 | ns | ns | |
| C1: rocuronium 0.4 mg/kg C2: rocuronium 0.8 mg/kg C3: rocuronium 1.2 mg/kg | 80/80 | C1: propofol 2 mg/kg C2: propofol 2 mg/kg C3: propofol 2 mg/kg I1: propofol 2 mg/kg | C1: fentanyl 2 μm/kg C2: fentanyl 2 μm/kg C3: fentanyl 2 μm/kg I1: fentanyl 2 μm/kg | None | C1: 9/20 C2: 2/20 C3: 1/20 I1: 13/20 | ns | ns | |
| C1: rapacuronium 1.0 mg/kg C2: rapacuronium 1.2 mg/kg C3: rocuronium 0.50 mg/kg | 100/100 | C1: propofol 2.0 mg/kg IV C2: propofol 2.0 mg/kg IV C3: propofol 2.0 mg/kg IV I1: propofol 2.0 mg/kg IV | C1: alfentanil 12.5 μg/kg C2: alfentanil 12.5 μg/kg C3: alfentanil 12.5 μg/kg I1: alfentanil 12.5 μg/kg | None | C1: 2/30 C2: 0/30 C3: 0/30 I1: 7/10 | |||
| C1: atracurium 0.5 mg/kg C2: atracurium 0.5 mg/kg C3: atracurium 0.5 mg/kg | 170/160 | C1: propofol 1.5 mg/kg C2: propofol 2.0 mg/kg C3: propofol 2.5 mg/kg I1: propofol 2.5 mg/kg | C1: fentanyl 3 μm/kg C2: fentanyl 3 μm/kg C3: fentanyl 3 μm/kg I1: fentanyl 3 μm/kg | None | C1: 7/47 C2: 1/48 C3: 2/45 I1: 13/20 | ns | ns | |
| C1: rocuronium 0.3 mg/kg C2: rocuronium 0.45 mg/kg C3: rocuronium 0.6 mg/kg C4: rocuronium 0.3 mg/kg C5: rocuronium 0.45 mg/kg C6: rocuronium 0.6 mg/kg | 140/140 | C1: propofol 2‐3 mg/kg C2: propofol 2‐3 mg/kg C3: propofol 2‐3 mg/kg C4: sevoflurane 8% C5: sevoflurane 8% C6: sevoflurane 8% I1: propofol 2‐3 mg/kg I2: sevoflurane 8% | C1: fentanyl 1 μm/kg C2: fentanyl 1 μm/kg C3: fentanyl 1 μm/kg C4: fentanyl 1 μm/kg C5: fentanyl 1 μm/kg C6: fentanyl 1 μm/kg I1: fentanyl 1 μm/kg I2: fentanyl 1 μm/kg | None | C1: 11/20 C2: 4/20 C3: 2/20 C4:14/20 C5: 9/20 C6: 2/20 I1:10/10 I2: 9/10 | ns | ns | |
| C1: succinylcholine 1 mg/kg | 60/60 | C1: propofol 2 mg/kg I1: propofol 2 mg/kg I2: propofol 2 mg/kg | C1: none I1: remifentanil 2 μg/kg I2: remifentanil 4 μg/kg | None | C1: 0/17 I1: 2/23 I2: 2/20 | C1: 0/17 I1: 0/23 I2: 0/20 | ns | |
| C1: atracurium 0.5 mg/kg | 80/73 | C1: propofol 2.5‐3 mg/kg I1: propofol 2.5‐3 mg/kg | C1: fentanyl 2‐3 μg/kg I1: fentanyl 2‐3 μg/kg | None | C1: 2/37 I1: 12/36 | C1: 1/39 I1: 4/39 | C1: 6/37 I1: 16/36 | |
| C1: rocuronium 0.45 mg·kg/kg | 83/83 | C1: propofol 1.5 mg·kg‐1 + sevoflurane 3.0‐3.5 Vol%,8 l·min‐1 in 2‐3 minutes I1: propofol 1.5 mg/kg | C1: remifentanil 0.30 μg/kg/min for 3 minutes I1: remifentanil 0.30 μg/kg/min for 3 minutes | None | C1: 1/40 I1: 11/43 | C1: 0/40 I1: 2/43 | C1: 12/33 I1: 17/31 | |
| C1: succinylcholine 0.3 mg/kg C2: succinylcholine 0.5 mg/kg C3: succinylcholine 1.0 mg/kg | 200/200 | C1: propofol 2 mg/kg C2: propofol 2 mg/kg C3: propofol 2 mg/kg I1: propofol 2 mg/kg | C1: fentanyl 2 μg/kg C2: fentanyl 2 μg/kg C3: fentanyl 2 μg/kg I1: fentanyl 2 μg/kg | None | C1: 4/50 C2: 3/50 C3: 1/50 I1: 15/50 | ns | ns | |
| C1: succinylcholine 0.3 mg/kg C2: succinylcholine 0.5 mg/kg C3: succinylcholine 1.0 mg/kg C4: succinylcholine 1.5 mg/kg C5: succinylcholine 2.0 mg/kg | 180/180 | C1: propofol 2 mg/kg C2: propofol 2 mg/kg C3: propofol 2 mg/kg C4: propofol 2 mg/kg C5: propofol 2 mg/kg I1: propofol 2 mg/kg | C1: fentanyl 2 μm/kg C2: fentanyl 2 μm/kg C3: fentanyl 2 μm/kg C4: fentanyl 2 μm/kg C5: fentanyl 2 μm/kg I1: fentanyl 2 μm/kg | None | C1: 2/30 C2: 2/30 C3: 1/30 C4: 1/30 C5: 0/30 I1: 21/30 | ns | ns | |
| C1: suxamethonium 0.25 mg/kg C2: suxamethonium 0.5 mg/kg | 60/60 | C1: propofol 2.5 mg/kg C2: propofol 2.5 mg/kg I1: Propofol 2.5 mg/kg | C1: alfentanil 15 μg/kg C2: alfentanil 15 μg/kg I1: alfentanil 15 μg/kg | None | C1: 0/20 C2: 1/20 I1: 9/20 | ns | ns | |
| C1: cisatracurium 0.1 mg/kg | 20/20 | C1: propofol target control I1: propofol target control | C1: remifentanil target control I1: remifentanil target control | C1: tetracaine 10 mg/mL I1: tetracaine 10 mg/mL | C1: 0/20 I1: 0/20 | C1: 0/20 I1: 0/20 | ns | |
| C1: mivacurium 0.25 mg/kg C2: rocuronium 0.45 mg/kg C3: rocuronium 0.6 mg/kg C4: rocuronium 0.9 mg/kg C5: rocuronium 1.2 mg/kg | 100/98 | C1: propofol 2 mg/kg C2: propofol 2 mg/kg C3: propofol 2 mg/kg C4: propofol 2 mg/kg C5: propofol 2 mg/kg I1: propofol 2 mg/kg | C1: fentanyl 2 μm/kg C2: fentanyl 2 μm/kg C3: fentanyl 2 μm/kg C4: fentanyl 2 μm/kg C5: fentanyl 2 μm/kg I1: fentanyl 2 μm/kg | None | C1: 2/30 IC2: 9/15 C3: 4/14 C4: 1/14 C5: 0/15 I1: 10/10 | ns | ns | |
| C1: vecuronium 0.08 mg/kg | 152/152 | C1: propofol 2.5 mg/kg I1: propofol 2.5 mg/kg | C1: alfentanil 0.03 mg/kg I1: alfentanil 0.03 mg/kg | C1: none I1: lidocaine 1.5 mg/kg | C1: 2/77 I1: 4/75 | ns | ns | |
| C1: d‐tubocurarine 3 mg and succinylcholine 1 mg/kg | 75/75 | C1: thiamylal 4 mg/kg I1: propofol 2 mg/kg I2: propofol 2 mg/kg I3: propofol 2 mg/kg I4: propofol 2 mg/kg | C1: none I1: alfentanil 30 µg/kg I2: alfentanil 40 µg/kg I3: alfentanil 50 µg/kg I4: alfentanil 60 µg/kg | None | C1: 0/15 I1: 1/15 I2: 1/15 I3: 1/15 I4: 1/15 | C1: 0/15 I1: 1/15 I2: 1/15 I3: 1/15 I4: 1/15 | ns | |
| C1: rocuronium 0.6 mg/kg C2: rocuronium 0.45 mg/kg C3: rocuronium 0.3 mg/kg | 120/120 | C1: propofol 2‐2.5 mg/kg C2: propofol 2‐2.5 mg/kg C3: propofol 2‐2.5 mg/kg I1: propofol 2‐2.5 mg/kg | C1: remifentanil 0.5 µg/kg/min C2: remifentanil 0.5 µg/kg/min IC3: remifentanil 0.5 µg/kg/min I1: remifentanil 0.5 µg/kg/min | None | C1: 0/30 C2: 1/30 C3: 0/30 I1: 12/30 | ns | ns | |
| C1: suxamethonium 1 mg/kg | 100/100 | C1: Sevoflu 7% + N2O60% I1: Sevoflu 7% + N2O60% I2: Sevoflu 7% + N2O60% I3: Sevoflu 7% + N2O60% | C1: alfentanil 10 µg/kg I1: alfentanil 20 µg/kg I2: alfentanil 25 µg/kg I3: alfentanil 30 µg/kg | None | C1: 1/25 I1: 4/25 I2: 5/25 I3: 2/25 | ns | C1: 8/25 I1: 12/25 I2: 13/25 I3: 9/25 | |
| C1: d‐tubocurarine 3 mg and succinylcholine 1 mg/kg | 140/140 | C1: thiopental 4 mg/kg I1: etomidate 0.3 mg/kg I2: etomidate 0.3 mg/kg I3: propofol 2 mg/kg I4: propofol 2 mg/kg I5: thiopental 4 mg/kg I6: thiopental 4 mg/kg | C1: none I1: alfentanil 40 µg/kg I2: alfentanil 40 µg/kg I3: alfentanil 40 µg/kg I4: alfentanil 40 µg/kg I5: alfentanil 40 µg/kg I6: alfentanil 40 µg/kg | C1: none I1: none I2: lidocaine 1 mg/kg I3: none I4: lidocaine 1 mg/kg I5: none I6: lidocaine1 mg/kg | C1: 1/20 I1: 3/20 I2: 1/20 I3: 3/20 I4: 2/20 I5: 8/20 I6: 3/20 | C1: 0/20 I1: 0/20 I2: 0/20 I3: 0/20 I4: 0/20 I5: 0/20 I6: 0/20 | ns | |
| C1: vecuronium 1 mg + succinylcholine 1 mg/kg C2: vecuronium 1 mg + succinylcholine 1 mg/kg | 100/100 | C1: thiopental 5.5 mg/kg C2: propofol 2.2 mg/kg I1: propofol 2.4 mg/kg I2: propofol 2.2 mg/kg | C1: fentanyl 0.1 mg C2: fentanyl 0.1 mg I1: fentanyl 0.1 mg I2: fentanyl 0.2 mg | 2 mL lidocaine 1% IV | C1: 1/25 C2: 1/25 I1: 3/25 I2: 5/25 | C1: 2/25 C2: 1/25 I1: 1/28 I2: 4/25 | ns | |
| C1: succinylcholine 1 mg/kg | 120/120 | C1: propofol 3.0 mg/kg I1: propofol 2.6 mg/kg I2: propofol 2.6 mg/kg I3: propofol 3.1 mg/kg | C1: none I1: alfentanil 15 μg/kg I2: alfentanil 30 μg/kg I3: none | None | C1: 0/30 I1: 1/30 I2: 0/30 I3: 6/30 | ns | ns | |
| C1: atracurium 0.5 mg/kg | 66/66 | C1: propofol 2.5 mg/kg I1: propofol 2.5 mg/kg | C1: none I1: remifentanil 2 μg/kg | None | C1: 4/31 I1: 14/35 | ns | ns |
ns = not specified
Trial design
All 34 studies were RCTs using parallel design. Eighteen dose‐finding studies comprised more intervention or control groups, or both (Alexander 1999; Barclay 1997; Kahwaji 1997; Kirkegaard‐Nielsen 1999; Kopman 2001; Lieutaud 2003; Lowry 1999; McNeil 2000; Naguib 2003; Naguib 2006; Nimmo 1995; Pino 1998; Scheller 1992; Schlaich 2000; Sivalingam 2001; Stevens 1997; Striebel 1995; Wong 1996) A total of 16 trials included one intervention group and one control group (Beck 1993; Bouvet 2008; Combes 2007; Dominici 1990; González Obregón 2010; Gulhas 2013; Hanna 2010; Harsten 1997; Iamaroon 2001; Isesele 2012; Jiao 2014; Mencke 2003; Mencke 2014; Pang 2014; Rousseau 1995; Yazdi 2016).
Trial participants
All included trials except one (Barclay 1997) enrolled only American Society of Anesthesiologists (ASA) class I and III participants. A total of 25 trials (Alexander 1999; Barclay 1997; Bouvet 2008; Combes 2007; González Obregón 2010; Hanna 2010; Iamaroon 2001; Isesele 2012; Kahwaji 1997; Lieutaud 2003; Lowry 1999; McNeil 2000; Mencke 2003; Mencke 2014; Naguib 2003; Naguib 2006; Pang 2014; Pino 1998; Rousseau 1995; Scheller 1992; Schlaich 2000; Sivalingam 2001; Stevens 1997; Wong 1996; Yazdi 2016) excluded participants with anticipated DTI, and 13 trials excluded obese participants and overweight participants (Barclay 1997; Combes 2007; Iamaroon 2001; Jiao 2014; Kirkegaard‐Nielsen 1999; Kopman 2001; Lowry 1999; McNeil 2000; Mencke 2003; Mencke 2014; Pang 2014; Pino 1998; Stevens 1997). Definitions of 'obese' and 'overweight' varied among trials. We accepted the definitions presented by study authors in the individual articles.
Characteristics of interventions
Investigators in 18 trials used suxamethonium as the depolarization NMBA (Alexander 1999; Beck 1993; Dominici 1990; Gulhas 2013; Hanna 2010; Harsten 1997; Iamaroon 2001; Isesele 2012; Jiao 2014; McNeil 2000; Naguib 2003; Naguib 2006; Nimmo 1995; Scheller 1992; Sivalingam 2001; Stevens 1997; Striebel 1995; Wong 1996), and researchers in 18 trials used one or more non‐depolarizing NMBA (Barclay 1997; Bouvet 2008; Combes 2007; González Obregón 2010; Hanna 2010; Kahwaji 1997; Kirkegaard‐Nielsen 1999; Kopman 2001; Lieutaud 2003; Lowry 1999; Mencke 2003; Mencke 2014; Pang 2014; Pino 1998; Rousseau 1995; Schlaich 2000; Striebel 1995; Yazdi 2016). Thus, two trials (Hanna 2010; Striebel 1995) combined depolarizing and non‐depolarizing NMBA as the intervention. Among trials using one or more non‐depolarizing NMBA, 10 applied rocuronium (Barclay 1997; Combes 2007; González Obregón 2010; Hanna 2010; Kirkegaard‐Nielsen 1999; Kopman 2001; Lowry 1999; Mencke 2014; Pino 1998; Schlaich 2000). Three trials applied atracurium (Lieutaud 2003; Mencke 2003; Yazdi 2016), two trials vecuronium (Rousseau 1995; Striebel 1995), and two trials rapacuronium (Kahwaji 1997; Kopman 2001). Single trials applied both cisatracurium (Bouvet 2008) and mivacurium (Pino 1998), respectively.
Characteristics of outcome measures
In 16 trials, investigators described intubation conditions by the original (Alexander 1999; Bouvet 2008; Combes 2007; Hanna 2010; Jiao 2014; Kirkegaard‐Nielsen 1999; Kopman 2001; Lowry 1999; Mencke 2003; Naguib 2003; Naguib 2006Schlaich 2000) or a modified (Barclay 1997; Harsten 1997; Kahwaji 1997; Mencke 2014) version of "Good clinical research practice (GCRP) in pharmacodynamic studies of neuromuscular blocking agents" (Viby‐Mogensen 1996). Thirteen trials reported laryngoscopy conditions defined by the criteria described by Cormack and Lehane (Cormack 1984) (Beck 1993; Bouvet 2008; Combes 2007; Dominici 1990; González Obregón 2010; Harsten 1997; McNeil 2000; Mencke 2003; Mencke 2014; Pang 2014; Scheller 1992; Stevens 1997; Striebel 1995). Seven studies reported events of upper airway discomfort or injury (Bouvet 2008; Combes 2007; González Obregón 2010; Gulhas 2013; Mencke 2003; Mencke 2014; Sivalingam 2001).
Excluded studies
We excluded three trials. One study intubated an unspecified number of participants blind nasal (Alcock 1993), and another (Ide 2015) intubated participants nasally using a Magill forceps. One trial terminated inclusion of participants exclusively in the intervention group because of unacceptable intubation conditions. Thus, this trial violated randomization and blinding as planned (Baumgarten 1988) (see Characteristics of excluded studies for more information).
Studies awaiting classification
No studies are awaiting classification.
Ongoing studies
We found no ongoing studies.
Risk of bias in included studies
We performed the ’Risk of bias’ assessment of included trials using previously described criteria. For details of judgements made for individual trials, please see Risk of bias in included studies (Figure 2). When we could not judge a 'Risk of bias’ domain as having low risk, we asked study authors for additional information.

Risk of bias graph: review authors' judgements about each risk of bias item presented as percentages across all included studies.
We judged four trials as having low risk of bias in all domains (Jiao 2014; Mencke 2003; Naguib 2003; Naguib 2006), and 13 trials as having high risk of bias in at least one bias domain. We divided trials into trials with overall low risk of bias and those with high or uncertain risk of bias according to assessment of sequence generation, concealment of allocation, blinding of outcome assessment, and blinding of participants and personnel according to the Cochrane Handbook for Systematic Reviews of Interventions 'Risk of bias' tool. When we judged all domains as adequately assessed, we considered the trial as having an overall low risk of bias.
Random sequence generation
Seventeen trials adequately described generation of the allocation sequence (Alexander 1999; Bouvet 2008; Dominici 1990; González Obregón 2010; Gulhas 2013; Harsten 1997; Jiao 2014; Kopman 2001; Lieutaud 2003; Lowry 1999; Mencke 2003; Mencke 2014; Naguib 2003; Naguib 2006; Pang 2014; Pino 1998; Rousseau 1995). The remaining trials were described as randomized, but investigators did not adequately describe the method used for sequence generation.
Allocation
Sixteen trials adequately described the method used to conceal allocation (Bouvet 2008; Combes 2007; González Obregón 2010; Hanna 2010; Harsten 1997; Isesele 2012; Jiao 2014; Kirkegaard‐Nielsen 1999; Lieutaud 2003; McNeil 2000; Mencke 2003; Mencke 2014; Naguib 2003; Naguib 2006; Sivalingam 2001; Stevens 1997). We categorized one trial as having high risk of bias (Kopman 2001) and judged the method used for allocation concealment as unclear for the remaining 16 trials.
Blinding
Ten trials adequately described the method used to blind participants and personnel responsible for treatment (Combes 2007; Gulhas 2013; Jiao 2014; Mencke 2003; Naguib 2003; Naguib 2006; Nimmo 1995; Stevens 1997; Striebel 1995; Wong 1996). We categorized ten trials as having high risk of bias (Bouvet 2008; González Obregón 2010; Harsten 1997; Kopman 2001; Lieutaud 2003; Lowry 1999; McNeil 2000; Mencke 2014; Rousseau 1995; Scheller 1992) and judged the method used to blind participants and personnel responsible for the treatment as unclear for the remaining trials.
All except five trials adequately described the method used to blind the person performing airway management and outcome assessment. We judged four trials as having unclear risk of bias (Isesele 2012; Nimmo 1995; Rousseau 1995; Yazdi 2016) and one trial as having high risk of bias (Scheller 1992).
Incomplete outcome data
All trials adequately addressed incomplete data. Most trials provided complete outcome data for all randomized participants. However, six trials (Bouvet 2008; Combes 2007; Hanna 2010; Isesele 2012; Kahwaji 1997; Pino 1998) excluded a few participants from the ITT because "patients were lost to follow‐up", or because investigators encountered missing data or equipment failure or various clinical reasons for exclusion. In six trials (Harsten 1997; Jiao 2014; Mencke 2003; Mencke 2014; Nimmo 1995; Sivalingam 2001), study authors excluded a few participants from ITT if tracheal intubation failed. We have provided further details in the Characteristics of included studies table.
Selective reporting
All trials adequately addressed selective reporting bias, except one trial for which we judged risk as unclear (Nimmo 1995).
Other potential sources of bias
We did not assess other potential sources of bias.
Assessment of reporting bias
The funnel plots that we have provided for our primary outcomes did not express asymmetry and thereby did not indicate publication bias (Figure 3).
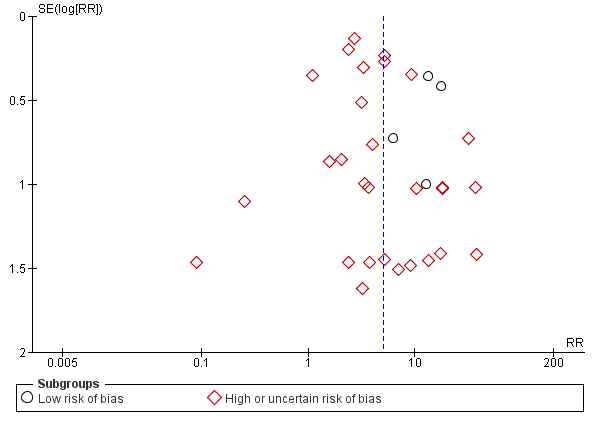
Funnel plot of comparison: 1 Avoidance vs use of NMBA, outcome: 1.1 Difficult tracheal intubation: low risk of bias vs high or uncertain risk of bias.
Effects of interventions
See our main results on all investigated outcomes in the 'Summary of findings' table (summary of findings Table for the main comparison), which presents assessment of the quality of the evidence, including imprecision, according to the GRADE approach (Guyatt 2013; Guyatt 2011).
Primary outcome: difficult tracheal intubation
Difficult tracheal intubation in trials with low risk of bias (Analysis 1.1)
We categorized four trials (Jiao 2014; Mencke 2003; Naguib 2003; Naguib 2006) with 508 participants as trials with low risk of bias. Among 144 participants undergoing tracheal intubation without the use of NMBA, investigators intubated a crude proportion of 56.3% (n = 81; 95% CI 49.3% to 64.4%) with difficulties. The median prevalence of a DTI in the individual studies was 58.2% (range 33% to 70%). Of 364 participants intubated with the use of NMBA, the proportion of DTI was 4.7% (n = 17; 95% CI 2.8% to 6.8%). The median prevalence of a DTI among individual studies was 4.7% (range 3.7% to 5.4%). In a random‐effects model, risk of DTI was increased with no use of NMBA (RR 13.27, 95% CI 8.19 to 21.49; P < 0.00001; number needed to treat for an additional harmful outcome (NNTH) = 1.9, I2 = 0%, D2 = 0%), likewise in a fixed‐effect model (RR 12.50, 95% CI 7.62 to 20.52; P < 0.00001). Comparisons of subgroups in trials with low risk of bias and trials with high or uncertain risk of bias revealed significant subgroup differences (P = 0.0002). Among trials of high or uncertain risk, avoidance of NMBA was associated with DTI in a random‐effects model (RR 4.23, 95% CI 2.93 to 6.09; P < 0.00001; NNTH = 8.7, I2 = 64%). We performed TSA of non‐NMBA versus NMBA using a D2‐adjusted required information size of 8195 participants to detect or reject a 20% relative risk increase with power of 80%, a control event proportion of 8%, and an overall type 1 error of 5%. The cumulative z‐curve crossed the TSMB for harm, and the TSA‐adjusted CI for the RR was 1.85 to 95.04. These findings provide firm evidence of the smallest possible harmful effect on the proportion of DTI in the traditional meta‐analysis of avoiding NMBA compared with using NMBA, even when the significance level was adjusted for repetitive testing and sparse data in a cumulative meta‐analysis. We downgraded the quality of the evidence (GRADE) one level to moderate because of indirectness (Analysis 1.1; Figure 4).

Difficult tracheal intubation in all trials (Analysis 1.1)
A total of 34 trials with 3565 participants provided data on DTI. Among 1507 participants undergoing tracheal intubation without the use of NMBA, a crude proportion of 24.2% (n = 365; 95% CI 22.4% to 26.4%) were intubated with difficulties. The median prevalence of a DTI among individual studies was 29.5% (interquartile range 7.0% to 60.0%). Of 2058 participants intubated with the use of NMBA, the crude proportion of DTI was 8.1% (n = 167; 95% CI 7.1% to 9.3%). The median prevalence of a DTI among individual studies was 3.9% (interquartile range 0.0% to 8.3%). In a random‐effects model, avoidance of NMBA significantly increased the risk of a DTI with direct laryngoscopy (RR 5.00, 95% CI 3.49 to 7.15; P < 0.00001; NNTH = 6.3, I2 = 70%, D2 = 82%). In a fixed‐effect model, RR was 4.79 (95% CI 4.04 to 5.69; P < 0.0001). Our TSA of all included trials did not contradict our findings in trials with low risk of bias. Again, the cumulative z‐curve crossed the TSMB for harm, and the TSA‐adjusted CI for the RR was 1.20 to 20.77. These findings provide evidence of the smallest possible harmful effect on the proportion of DTI in the traditional meta‐analysis of avoiding NMBA compared with using NMBA, even when the significance level was adjusted for repetitive testing and sparse data in a cumulative meta‐analysis. We downgraded the quality of the evidence (GRADE) two levels to low because of indirectness, heterogeneity, and high or uncertain risk of bias (Analysis 1.1; Figure 4).
Subgroup analyses of difficult tracheal intubation
Depolarizing versus non‐depolarizing NMBA (Analysis 1.2)
In the subgroup of trials that used depolarizing NMBA, risk of DTI was increased with no use of NMBA (RR 5.79, 95% CI 2.64 to 12.72; P < 0.0001; NNTH = 5.6, I2 = 69%). Likewise, in the subgroup using non‐depolarizing NMBA, DTI was associated with no use of NMBA (RR 4.72, 95% CI 3.17 to 7.02; P < 0.0001; NNTH = 5.8, I2 = 74%). Results show no significant subgroup differences (P = 0.65) (Analysis 1.2).
Remifentanil versus other opioids (Analysis 1.3)
Investigators in 11 trials (Alexander 1999; Bouvet 2008; González Obregón 2010; Gulhas 2013; Hanna 2010; Jiao 2014; McNeil 2000; Mencke 2014; Pang 2014; Schlaich 2000; Yazdi 2016) used remifentanil as an opioid. However, researchers in four studies (Alexander 1999; Hanna 2010; McNeil 2000; Yazdi 2016) used remifentanil only in the intervention groups and used no opioids in the control group. One (Alexander 1999) of the three trials used remifentanil and alfentanil as opioids in two different intervention groups. Another three trials (González Obregón 2010; Gulhas 2013; Jiao 2014) used an amount of remifentanil in the intervention group that exceeded the amount used in the control group. Among trials using equal amounts of remifentanil in intervention and control groups (Bouvet 2008; Mencke 2014; Pang 2014; Schlaich 2000), results showed significantly increased risk of DTI when NMBA was avoided for tracheal intubation (RR 15.86, 95% CI 4.43 to 56.71; P < 0.0001; NNTH = 6.4, I2 = 0%). In trials in which opioids other than remifentanil were used, avoiding NMBA was significantly associated with DTI (RR 5.20, 95% CI 3.53 to 7.64; P < 0.0001; NNTH = 6.5, I2 = 74%). Results showed no significant subgroup differences (P = 0.10). One trial provided no opioids (Isesele 2012) (Analysis 1.3).
Alfentanil versus other opioids (Analysis 1.4)
Thirteen trials (Alexander 1999; Barclay 1997; Beck 1993; Combes 2007; Dominici 1990; Harsten 1997; Kopman 2001; Nimmo 1995; Rousseau 1995; Scheller 1992; Sivalingam 2001; Stevens 1997; Wong 1996) used alfentanil as the opioid. Five trials (Alexander 1999; Beck 1993; Scheller 1992; Stevens 1997; Wong 1996) used alfentanil only in the intervention group and used no opioids in the control group. One of the five trials used remifentanil and alfentanil as opioids in two different intervention groups (Alexander 1999). In two trials, the amount of alfentanil used in the intervention group exceeded the amount used in the control group (Combes 2007; Sivalingam 2001). The six trials with equal amounts of alfentanil in the intervention and control groups reported significantly increased risk of DTI when NMBA was avoided for tracheal intubation (RR 4.46, 95% CI 1.66 to 11.98; P = 0.0002; I2 = 79%, NNTH = 5.2) (Barclay 1997; Dominici 1990; Harsten 1997; Kopman 2001; Nimmo 1995; Rousseau 1995). In trials using opioids other than alfentanil, risk of DTI was increased when NMBA was avoided (RR 5.10, 95% CI 3.34 to 7.79; P < 0.0001; I2 = 72%, NNTH = 4.8). Results showed no significant subgroup differences (P = 0.81). One trial provided no opioids (Isesele 2012) (Analysis 1.4).
Local anaesthetic versus no use of local anaesthetic (Analysis 1.5)
Eight trials used a local anaesthetic. However, three trials (Isesele 2012; Rousseau 1995; Stevens 1997) used a local anaesthetic only in the intervention group ‐ not in the control group. Thus, we included five trials (Barclay 1997; Dominici 1990; Hanna 2010; Pang 2014; Striebel 1995) that used local anaesthesia for intubation in both control and intervention groups. In comparisons of trials using local anaesthesia versus trials not using local anaesthesia, risk of DTI was increased with no use of NMBA. With use of local anaesthesia, the RR was 1.90 (95% CI 1.14 to 3.18; P = 0.01; NNTH = 9.4, I2 = 35%), and with no use of local anaesthesia, the RR was 6.26 (95% CI 4.15 to 9.44; P < 0.0001; NNTH = 5.7, I2 = 69%), respectively. Results showed significant subgroup differences (P < 0.0001) (Analysis 1.5).
Exclusion of patients with expected DTI versus no exclusion of patients with expected DTI (Analysis 1.6)
In the subgroup in which patients with expected DTI were excluded from the individual trials, risk of DTI was significantly increased when NMBA was avoided (RR 5.32, 95% CI 3.54 to 8.00; P < 0.00001; NNTH = 6.3, I2 = 72%). In the subgroup in which patients with expected DTI were not excluded, risk of DTI was significantly increased when NMBA was avoided (RR 4.40, 95% CI 1.71 to 11.29; P = 0.0002; NNTH = 5.7, I2 = 74%). Results showed no significant subgroup differences (P = 0.72) (Analysis 1.6).
Explorative assessments of difficult tracheal intubation
A best‐case scenario (Analysis 1.7)
A total of 18 trials were dose‐finding studies that included more intervention or control groups, or both (Alexander 1999; Barclay 1997; Kahwaji 1997; Kirkegaard‐Nielsen 1999; Kopman 2001; Lieutaud 2003; Lowry 1999; McNeil 2000; Naguib 2003; Naguib 2006; Nimmo 1995; Pino 1998; Scheller 1992; Schlaich 2000; Sivalingam 2001; Stevens 1997; Striebel 1995; Wong 1996). In attempting to estimate a sufficient level of intervention or adjuvant drugs, or both, these trials may have included intervention or control groups, or both, in which participants were suboptimally anaesthetized. Therefore, we performed a supplementary sensitivity analysis of a best‐case scenario. Here, dose‐finding studies were represented only by control and intervention groups with the lowest prevalence of difficult intubation. Among 1180 participants undergoing tracheal intubation without the use of NMBA, a crude proportion of 25.0% (n = 295; 95% CI 22.9% to 27.5%) were intubated with difficulties. Among 1230 participants intubated with the use of NMBA, the crude proportion of DTI was 3.4% (n = 42; 95% CI 2.5% to 4.4%). Avoidance of NMBA significantly increased the risk of DTI with direct laryngoscopy (RR 5.99, 95% CI 3.46 to 10.38; P < 0.0001; NNTH = 4.4, I2 = 57%) (Analysis 1.7).
Excluding dose‐finding studies (Analysis 1.8)
In our attempt to exclude comparisons of suboptimal anaesthetic dosing regimens, we performed a sensitivity analysis that excluded all dose‐finding trials. Thus we included 16 trials that had one intervention group and one control group (Beck 1993; Bouvet 2008; Combes 2007; Dominici 1990; González Obregón 2010; Gulhas 2013; Hanna 2010; Harsten 1997; Iamaroon 2001; Isesele 2012; Jiao 2014; Mencke 2003; Mencke 2014; Pang 2014; Rousseau 1995; Yazdi 2016). Among 769 participants undergoing tracheal intubation without the use of NMBA, a crude proportion of 15.5% (n = 119; 95% CI 13.3% to 18.0%) were intubated with difficulties. Among 767 participants intubated with the use of NMBA, the crude proportion of DTI was 4.2% (n = 32; 95% CI 3.0% to 5.6%). Avoidance of NMBA significantly increased the risk of DTI (RR 3.40, 95% CI 1.63 to 7.10; P = 0.001; NNTH = 8.8, I2 = 59%).
We wanted to explore possible causes of heterogeneity by performing meta‐regression analyses. However, owing to a low degree of heterogeneity in trials with low risk of bias in terms of DTI, we did not perform these assessments. Regarding our other secondary outcome, we categorized only one trial describing upper airway discomfort and/or injury as having low risk of bias. Among all trials describing upper airway discomfort or injury, or both, we found no heterogeneity; thus we performed no meta‐regression analysis (Analysis 1.8).
Funding from pharmaceutical industry (Analysis 1.9)
We identified 10 trials that reported funding from the pharmaceutical industry (Barclay 1997; Hanna 2010; Harsten 1997; Iamaroon 2001; Kahwaji 1997; Kopman 2001; Lowry 1999; Pino 1998; Scheller 1992; Wong 1996). In attempting to identify any potential bias caused by industrial funding, we performed a sensitivity analysis to compare trials receiving industrial funding versus the remaining trials. We included all trials receiving industrial funding, thus we did not distinguish between the types of funding that studies had received. Among the 10 trials that reported receipt of industrial funding, results showed a significant association between avoidance of NMBA and DTI (RR 4.10, 95% CI 2.67 to 6.31; P = 0.003; I2 = 64%). In the remaining trials, which reported no industrial funding, results showed a significant association between avoidance of NMBA and DTI (RR 5.33, 95% CI 3.16 to 8.98; P < 0.00001; I2 = 68%). Findings showed no significant subgroup differences (P = 0.45) (Analysis 1.9).
Primary outcome: overall mortality
None of the trials provided data on mortality.
Primary outcome: one or more events of upper airway discomfort or injury
One or more events of upper airway discomfort or injury in trials with lower risk of bias (Analysis 1.10)
One trial with low risk of bias described events of upper airway discomfort or injury (Mencke 2003). This trial found a significant association between avoidance of NMBA and upper airway discomfort or injury (RR 2.74, 95% CI 1.21 to 6.21; P = 0.02). A random‐effects model among trials with high or uncertain risk of bias revealed a significant association between no use of NMBA and risk of upper airway discomfort or injury (RR 1.30, 95% CI 1.08 to 1.58; P = 0.006; NNTH = 9.7, I2 = 0%). Because we identified only one low risk of bias trial, we performed no quality of evidence (GRADE) assessment (Analysis 1.10; Figure 5).
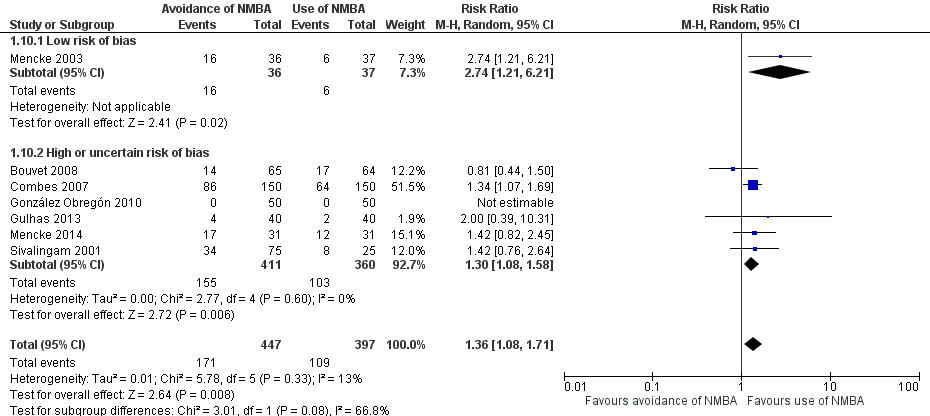
One or more events of upper airway discomfort or injury in all trials (Analysis 1.10)
Seven trials representing 846 participants described events of upper airway discomfort or injury (Bouvet 2008; Combes 2007; González Obregón 2010; Gulhas 2013; Mencke 2003; Mencke 2014; Sivalingam 2001). However, one trial (González Obregón 2010) described no events of upper airway discomfort or injury. The crude prevalence was 33.1% (n = 280; 95% CI 30.4% to 36.3%). Among 447 participants undergoing tracheal intubation without the use of NMBA, a proportion of 38.2% (n = 171; 95% CI 34.4% to 42.8%) with upper airway discomfort or injury were identified. Among 399 participants intubated with the use of NMBA, the proportion of upper airway discomfort or injury was 27.3% (n = 109; 95% CI 23.5% to 31.7%). Risk of upper airway discomfort or injury was significant with avoidance of NMBA (RR 1.37, 95% CI 1.09 to 1.74; P = 0.008; NNTH = 9.1, I2 = 13%). Our TSA of non‐NMBA versus NMBA using a D2‐adjusted required information size of 1981 participants to detect or reject a 20% relative risk reduction with power of 80% and overall type 1 error of 5%. The cumulative z‐curve crossed the TSMB for harm, and the TSA‐adjusted CI for the RR was 1.00 to 1.85. Thus, we provided firm evidence on the proportion of upper airway discomfort or injury for the least possible harmful effect in the traditional meta‐analysis of avoiding NMBA compared with using NMBA, even when the significance level was adjusted for repetitive testing and sparse data in a cumulative meta‐analysis. We downgraded the quality of the evidence (GRADE) one level to moderate because of high or uncertain risk of bias (Analysis 1.10; Figure 5).
Subgroup analyses of one or more events of upper airway discomfort or injury
Depolarizing versus non‐depolarizing NMBA (Analysis 1.11)
The two trials in which investigators used depolarizing NMBA showed no significant association between avoidance of NMBA and upper airway discomfort or injury (RR 1.48, 95% CI 0.83 to 2.65; P = 0.19; I2 = 0%) (Gulhas 2013; Sivalingam 2001). Likewise, in the subgroup of five trials using non‐depolarizing NMBA, results revealed no significant association (RR 1.37, 95% CI 0.97 to 1.94;, P = 0.07; I2 = 15%) (Bouvet 2008; Combes 2007; González Obregón 2010; Mencke 2003; Mencke 2014) and no significant subgroup differences (P = 0.83) (Analysis 1.11) .
Remifentanil versus other opioids (Analysis 1.12)
The two trials (Bouvet 2008; Mencke 2014) that used remifentanil showed no significant association between avoidance of NMBA and upper airway discomfort or injury (RR 1.12, 95% CI 0.61 to 2.08; P = 0.14; I2 = 55%). The five trials using opioids other than remifentanil revealed a significant association between avoidance of NMBA and upper airway discomfort or injury (RR 1.42, 95% CI 1.16 to 1.75; P = 0.0009; NNTH = 7.5, I2 = 0%) (Combes 2007; González Obregón 2010; Gulhas 2013; Mencke 2003; Sivalingam 2001) and no significant subgroup differences (P = 0.47) (Analysis 1.12).
Alfentanil versus other opioids (Analysis 1.13)
In two trials, the amount of alfentanil used in the intervention group exceeded the amount used in the control group; thus we excluded these trials from the meta‐analysis (Combes 2007; Sivalingam 2001). The remaining trials used opioids other than alfentanil (Bouvet 2008; González Obregón 2010; Gulhas 2013; Mencke 2003; Mencke 2014), and results showed no significant association between no use of NMBA and the presence of upper airway discomfort or injury (RR 1.47, 95% CI 0.85 to 2.53; P = 0.17; I2 = 49%) (Analysis 1.13).
Local anaesthetic versus no use of local anaesthetic
None of the trials reporting upper airway discomfort or injury used local anaesthetic.
Exclusion of patients with expected DTI versus no exclusion of patients with expected DTI (Analysis 1.14)
Six of the trials reporting upper airway discomfort or injury excluded patients with anticipated difficult airway management (Bouvet 2008; Combes 2007; González Obregón 2010; Mencke 2003; Mencke 2014; Sivalingam 2001). Results showed significantly increased risk of upper airway discomfort or injury when the patient was not relaxed (RR 1.37, 95% CI 1.05 to 1.79; P = 0.02; NNTH = 8.9, I2 = 29%). One trial included participants with expected difficult airway management (Gulhas 2013). Results showed no significant association between avoidance of NMBA and upper airway discomfort or injury (RR 2.00, 95% CI 0.39 to 10.31; P = 0.41) and no significant subgroup differences (Analysis 1.14).
Secondary outcome: one or more major serious adverse events
One study reported serious adverse events (Kahwaji 1997). A 29‐year‐old man, weighing 100 kg, with ASA physical status of I, experienced two of these events (tachycardia with heart rate from 85 to 150 bpm and bronchospasm) within 30 seconds of administration of 2.0 mg/ kg ORG 9487 (rapacuronium); these events were followed by erythema of the arms, shoulders, and face. Bronchospasm was treated with salbutamol, and all symptoms gradually subsided.
Secondary outcome: difficult laryngoscopy
Difficult laryngoscopy in trials with low risk of bias (Analysis 1.15)
We categorized one trial as having low risk of bias (Mencke 2003). This trial found no significant association between conditions for laryngoscopy and use of NMBA (RR 4.00, 95% CI 0.47 to 34.20; P = 0.21). Comparison with the subgroup of trials with high or uncertain risk of bias revealed significantly increased risk of difficult laryngoscopy in a random‐effects model when NMBA was avoided (RR 2.47, 95% CI 1.47 to 4.16; P = 0.0006; NNTH = 27.9, I2 = 0%) (Analysis 1.15; Figure 6).

Difficult laryngoscopy in all trials (Analysis 1.15)
Thirteen trials representing 1308 participants reported the conditions for laryngoscopy (Beck 1993; Bouvet 2008; Combes 2007; Dominici 1990; González Obregón 2010; Harsten 1997; McNeil 2000; Mencke 2003; Mencke 2014; Pang 2014; Scheller 1992; Stevens 1997; Striebel 1995). Among 740 participants undergoing tracheal intubation without the use of NMBA, a crude proportion of 7.2% (n = 53; 95% CI 5.6% to 9.0%) had a difficult laryngoscopy. Among 568 participants intubated with use of NMBA, the proportion of difficult laryngoscopy was 3.3% (n = 19; 95% CI 2.1% to 4.8%). Avoidance of NMBA significantly increased the risk of a difficult laryngoscopy (RR 2.54, 95% CI 1.53 to 4.21; P = 0.0003; NNTH = 25.6, I2 = 0%, D2 =0%). In a fixed‐effect model, RR was 2.46 (95% CI 1.52 to 3.97; P = 0.0002). Trial sequential analysis of avoiding versus using NMBA, with a D2 ‐adjusted required information size, showed that only 6% of the information size required to detect or reject a 20% relative risk reduction was accrued and the TMSB was not crossed. The TSA‐adjusted 95% CI for the RR was 0.27 to 21.75, meaning that firm evidence could not be established (Analysis 1.15; Figure 6).
Discussion
Summary of main results
Our systematic review reveals several important findings. Analysis of 34 trials reporting on conditions regarding tracheal intubation suggests that avoidance of neuromuscular blocking agents (NMBA) is associated with increased risk of a difficult tracheal intubation (DTI) (summary of findings Table for the main comparison). We confirmed this in our assessment of the four trials categorized as having low risk of bias (Analysis 1.1). Here, avoidance of NMBA was associated with DTI with a risk ratio (RR) of 13.27 (95% confidence interval (CI) 8.19 to 21.49; P < 0.00001; number needed to treat for an additional harmful outcome (NNTH) =1.9, I2 = 0%). Results showed a significant subgroup difference between trials with low and high or uncertain risk of bias, as avoiding NMBA exceeded the risk ratio of a difficult intubation among trials with low risk of bias compared with trials with high or uncertain risk of bias. Fixed‐effect meta‐analyses did not noticeably change the conclusions. Our trial sequential analysis (TSA) provided firm evidence for the least possible harmful effect on the proportion of DTI in the traditional meta‐analysis of avoiding NMBA compared with using NMBA, even when the significance level was adjusted for repetitive testing and sparse data in a cumulative meta‐analysis.
In our subgroup analyses on DTI, use of remifentanil, alfentanil, or local anaesthesia did not change our primary finding, as avoidance of NMBA was significantly associated with a DTI. However, our subgroup analysis suggests that local anaesthetics may have a protective effect, as results showed a statistically significant subgroup difference between trials using and trials avoiding local anaesthesia in relation to tracheal intubation. Likewise, in the subgroup analysis of trials excluding participants with expected difficult intubation, avoiding NMBA increased the risk of a difficult intubation. Fixed‐effect meta‐analyses did not noticeably change results of the subgroup analyses.
Our analysis of seven trials suggests that avoidance of NMBA is associated with increased risk of upper airway discomfort or injury (RR = 1.37, 95% CI 1.09 to 1.74; P = 0.008; NNTH = 9.1, I2 = 13%). Only one trial reporting this outcome had low risk of bias, but results revealed a significant association between avoidance of NMBA and upper airway discomfort or injury (Mencke 2003). Our TSA provided firm evidence for a harmful effect on the proportion of upper airway discomfort and injury in the traditional meta‐analysis when the significance level is adjusted for repetitive testing and sparse data in a cumulative meta‐analysis.
For 13 trials describing conditions for laryngoscopy, our meta‐analysis showed that avoiding NMBA was associated with a difficult laryngoscopy, with RR of 2.54 (95% CI 1.53 to 4.21; P = 0.0003; NNTH = 14.6) (Beck 1993; Bouvet 2008; Combes 2007; Dominici 1990; González Obregón 2010; Harsten 1997; McNeil 2000; Mencke 2003; Mencke 2014; Pang 2014; Scheller 1992; Stevens 1997; Striebel 1995). Only one trial categorized as having low risk of bias reported this outcome (Mencke 2003). Results show no significant association between avoidance of NMBA and difficult laryngoscopy. Because information size was inadequate, our TSA of all 13 trials provided no firm evidence for a harmful effect of avoiding NMBA on upper airway discomfort or injury.
No trials reported mortality, and only one trial reported one episode of a serious adverse event (SAE) related to the use of NMBA (Kahwaji 1997).
Overall completeness and applicability of evidence
The plan to analyse effects of neuromuscular blocking agents for improving conditions during tracheal intubation or direct laryngoscopy in randomized clinical trials in adults followed our published protocol to a great extent. We included all eligible randomized clinical trials up to January 2017. Most of these trials were conducted in high‐income countries, and most participants were undergoing elective surgery. We included participants of both genders, and most participants were American Society of Anesthesiologists (ASA) class I or II and non‐obese, without expected airway management difficulties. Studies showed a high degree of clinical diversity as included combinations of different adjuvant drugs and NMBA were substantial.
About half of the included trials used a (modified) intubation score according to "Good clinical research practice (GCRP) in pharmacodynamic studies of neuromuscular blocking agents" (Fuchs‐Buder 2007; Viby‐Mogensen 1996). Further, a major portion of the remaining trials used intubation scores that incorporated many of the elements described by the GCRP score. Thus, to some extent, included trials showed some agreement on how DTI should be defined. Although trials used a defined outcome in accordance with recommendations for research regarding NMBA, definitions used differ from those traditionally used in research dealing with difficult airway management (Adnet 1997; Lundstrøm 2011b). Although the literature lacks consensus, these definitions often describe multiple (unsuccessful) attempts at intubation and/or shift to more advanced intubation techniques and/or other personnel performing airway management. One must therefore bear in mind that our primary outcome may not reflect a situation that most clinicians consider a truly difficult intubation that threatens the patient's life or health. Thus, one may observe a substantial degree of indirectness concerning our primary outcome describing DTI. Thirteen trials used the difficult laryngoscopy score of Cormack and Lehane (Cormack 1984) as a surrogate measure of a difficult intubation. This outcome measure is often used in studies on difficult airway management; thus it seems reasonable to interpret our findings on difficult laryngoscopy in a traditionally difficult airway management context. Most trials excluded patients expected to have difficult airway management. This may have a significant impact on the applicability of evidence, but subgroup analysis of 'Exclusion of patients with expected DTI versus no exclusion of expected DTI' (Analysis 1.6) showed no significant subgroup differences. Further, several studies have demonstrated that prediction of a DTI is difficult (Lundstrøm 2011b; Nørskov 2015; Nørskov 2016) and involves low sensitivity and specificity; thus the impact of these exclusions is uncertain.
Selected outcome measures varied among trials dealing with sore throat, upper airway discomfort, and injury. Further, by whom, how, or when the outcome measure was evaluated differed or was not clearly defined by some of these trials ‐ a fact that must be taken into account when our results are interpreted in a clinical context.
Of specific notice is the fact that evaluation of the effect on occurrence of serious adverse events (SAE) of avoidance of NMBA compared with use of NMBA is virtually absent, as none of the included trials evaluated effects on mortality (short‐term or long‐term), and only one trial evaluated effects on other types of SAEs, reporting one SAE.
Quality of the evidence
We present our main results on all investigated outcomes in summary of findings Table for the main comparison, which shows grading of the quality of evidence, including imprecision, according to the GRADE approach (Guyatt 2013; Guyatt 2011) and stresses results of meta‐analyses originating from trials with overall low risk of bias. Our review follows the overall plan of a published, peer‐reviewed Cochrane protocol (Lundstrøm 2011a). It represents a comprehensive review of the topic, including meta‐analyses of results from 34 randomized trials with a total of 3565 participants. To our knowledge, no previous meta‐analyses have included trials comparing use or avoidance of NMBA for tracheal intubation. We conducted a thorough review in accordance with methods of the Cochrane Collaboration (Higgins 2011). Between‐trial heterogeneity varied from absent to substantial among the various meta‐analyses in terms of our different outcomes. This may emphasize the diversity of the dose‐finding regimens used in different trials that used substantially different combinations of adjuvant drugs and NMBA. Further, minor differences among definitions of a DTI in some degree may contribute to the heterogeneity. In contrast, we noted no between‐trial heterogeneity regarding our secondary outcome describing conditions needed for direct laryngoscopy, which may be explained by a well‐defined outcome measure (Cormack 1984) that was retrievable from all 13 trials.
We performed trial sequential analyses and calculated TSA‐adjusted confidence intervals reflecting sparse data and multiple testing due to potentially repeated updates of cumulative meta‐analyses to control risk of random errors and to prevent premature statements of superiority of one intervention over another (Brok 2008; Brok 2009; Thorlund 2009;Thorlund 2011; Wetterslev 2008; Wetterslev 2009). TSA revealed that all of our meta‐analyses including the primary outcomes have a very low degree of imprecision, indicating low risk of random error. The finding of an insignificant TSA‐adjusted association between avoidance of NMBA and difficult laryngoscopy may be due to a type II error, that is, a false‐negative finding, exemplified by the cumulative z‐curve not crossing the trial sequential monitoring boundary (TSMB) for futility. However, such an analysis cannot remove risks of bias ‐ detected or undetected. It is worth discussing how much evidence is required when one is dealing with potential benefit or harm. On the other hand, beneficial or harmful effects can occur as the result of random errors; therefore, sufficient information must be assessed to demonstrate benefit or harm beyond reasonable doubt.
Because actual airway management was evaluated just after induction of anaesthesia, no cases were lost to follow‐up. However, cases with upper airway discomfort and/or injury were lost to follow‐up in three trials (Combes 2007; Mencke 2003; Mencke 2014). We therefore performed post hoc "best‐ and worst‐case" sensitivity analyses. We included participants who were lost to follow‐up with or without upper airway discomfort and/or injury. These explorative analyses did not alter our primary findings derived both from all trials and from trials with low risk of bias.
Potential biases in the review process
We strived to reduce bias by identifying all relevant trials through a comprehensive systematic search of the literature. We contacted study authors to retrieve unpublished data, when possible. However, it was difficult to obtain updated contact information for authors of the oldest published trials. This may have introduced bias, as it was generally easier to retrieve additional data from more recently published trials, which also were more likely to be categorized as having low risk of bias. Two review authors assessed trials for inclusion or eligibility and extracted all data in duplicate, thereby reaching a high level of agreement. We did not conduct quality assessments or data extractions while blinded to review authors and bias risks.
Most included trials clearly stated cut‐off values defining a DTI. However, five trials (Beck 1993; Gulhas 2013; McNeil 2000; Scheller 1992; Stevens 1997) used different composite scores without defined cut‐offs. We used underlying references or comparable scores to define cut‐off values, enabling us to include these trials in our meta‐analyses. The Characteristics of included studies section provides detailed explanations. In these cases, some degree of interpretation of outcome measures was necessary, and our assessments may have introduced bias as a consequence. Nevertheless, we believe that this categorization was evident when compared with the existing literature, and we therefore consider risk of introducing bias as low.
The authors of six trials (Harsten 1997; Jiao 2014; Mencke 2003; Mencke 2014; Nimmo 1995; Sivalingam 2001) excluded a few participants from their assessments when tracheal intubation failed. We consider these patients as truly difficult to intubate and thus chose to include them in our meta‐analyses. This may have introduced bias; however, a sensitivity analysis excluding these participants from our meta‐analyses did not change the conclusion.
Agreements and disagreements with other studies or reviews
To our knowledge, no previous systematic review has included meta‐analyses of trials comparing use or avoidance of NMBA for tracheal intubation. However, a narrative review (Woods 2005) concluded that the literature describes successful techniques to intubate the trachea without the use of neuromuscular blocking agents with the patient under general anaesthesia. Further, those review authors concluded that these techniques offer a useful alternative when drugs are contraindicated or undesirable. Another narrative review (Fotopouloua 2012) concluded that induction of anaesthesia without the use of NMBA but in combination with remifentanil provides acceptable conditions for tracheal intubation. Both reviews include several dose‐finding trials in which none of the participants in the different intervention groups were administered NMBA. Thus, it was impossible to compare avoiding versus using NMBA for tracheal intubation. On the basis of findings related to specific drug combinations and concentrations, the review authors concluded that induction without the use of NMBA may offer (almost) perfect or good conditions for intubation.
In large observational studies and reviews on difficult airway management, fractions of DTI range from 2% to 7% (Lundstrøm 2011b; Nørskov 2015; Shiga 2005), which is consistent with our findings on the overall proportion of difficult intubation in patients who are intubated with use of NMBA. The crude proportion was 4.7% in trials with low risk of bias and 8.1% in all trials. However, among participants undergoing tracheal intubation without the use of NMBA, corresponding crude proportions were tremendously higher, at 56.3% in trials with low risk of bias and 24.2% in all trials. These latter proportions are not consistent with those reported in experiences from everyday clinical practice, and several trials may therefore include suboptimal dosing regimens. Thus, we speculate that some of the dose‐finding trials may include control groups with clinically unacceptable dosing regimens that may contribute to an unrealistically increased risk of DTI. As an example, one trial concluded that the optimal remifentanil dose used for intubation with propofol and without NMBA is 4 µg/kg administered in 60 seconds (Bouvet 2009). However in our review, only two of the included trials actually used equivalent or larger doses of remifentanil (Hanna 2010; McNeil 2000). Therefore, we performed a post hoc sensitivity analysis of a best‐case scenario (Analysis 1.7). Dose‐finding trials were represented only by control and intervention groups with the lowest incidence of difficult intubation. Results showed a crude proportion of 25.0% DTI among participants anaesthetized without the use of NMBA, and this again significantly increased the risk of DTI, with a risk ratio of 5.99. Finally, in our attempt to exclude comparisons of suboptimal anaesthetic dosing regimens, we performed a post hoc sensitivity analysis while excluding all dose‐finding trials (Analysis 1.8). We included in our meta‐analysis 16 trials with a single intervention group and a single control group. The crude proportion of DTI among participants anaesthetized without the use of NMBA decreased to 15.4%. However, avoiding NMBA still significantly increased the risk of DTI, with a risk ratio of 3.40. Another possible explanation for the increased crude proportion of DTI among participants induced without NMBA may be that most included trials used a (modified) intubation score according to "Good clinical research practice (GCRP) in pharmacodynamic studies of neuromuscular blocking agents" (Fuchs‐Buder 2007; Viby‐Mogensen 1996). Assessment of intubation conditions included information on jaw mobility and/or reactions to insertion of the tracheal tube and cuff inflation (diaphragmatic movement/coughing). These are reasonable elements for describing ideal conditions for intubation, although they may be affected even when everyday clinical airway management is successful without "true" difficulties. Thus, the GCRP score may be highly sensitive and may be used to enforce the difference between the ideal procedure and a clinically acceptable intubation. Trials reporting conditions for laryngoscopy (described by Cormack 1984) report an outcome measure traditionally used in studies dealing with difficult airway management. In our assessment, the crude proportions of difficult laryngoscopy reported among intervention groups may reflect a more clinically acceptable situation, as 4.2% among all trials and 7.2% in trials with low risk of bias who were intubated without NMBA had a difficult laryngoscopy.
In the literature, one review reported on various causes for postoperative sore throat (El‐Boghdadly 2016). These review authors state that tracheal intubation without the use of NMBA is a potential risk factor for sore throat. Although this study is presented as a systematic review, review authors included only one study (Combes 2007) reporting on upper airway discomfort or injury, review authors performed no bias assessment, and the review included no meta‐analyses. Other conditions such as tube size (Jaensson 2010; Jaensson 2012; Stout 1987; Xu 2012) and use of corticosteroids (Sumathi 2007; Thomas 2007) may play an important role in the postoperative sore throat. In our review, we did not evaluate the impact of these factors in subgroup analyses. The review of EL‐Boghdadly reports postoperative sore throat with a prevalence of up to 62% following general anaesthesia. In a Cochrane review on lidocaine for preventing postoperative sore throat (Tanaka 2015), the crude prevalence of sore throat was 20% to 30% pending the use of lidocaine. In our assessment, the crude prevalence was 33%.

Study flow diagram.
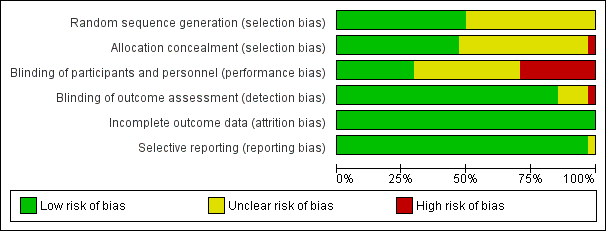
Risk of bias graph: review authors' judgements about each risk of bias item presented as percentages across all included studies.

Funnel plot of comparison: 1 Avoidance vs use of NMBA, outcome: 1.1 Difficult tracheal intubation: low risk of bias vs high or uncertain risk of bias.
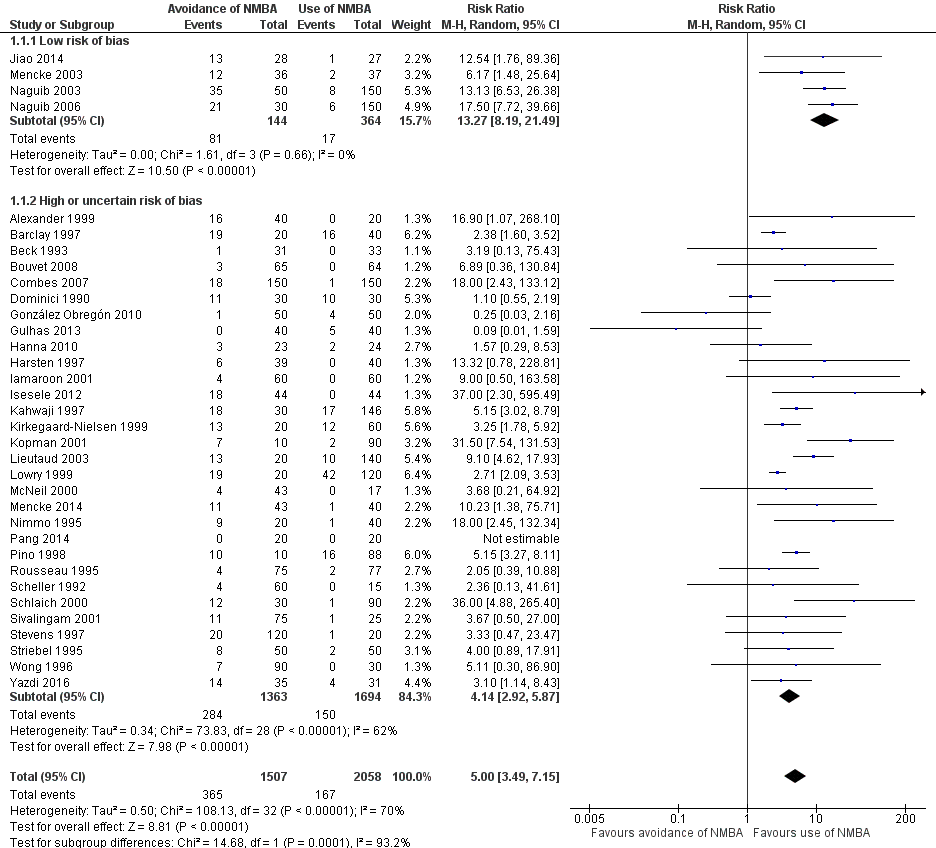

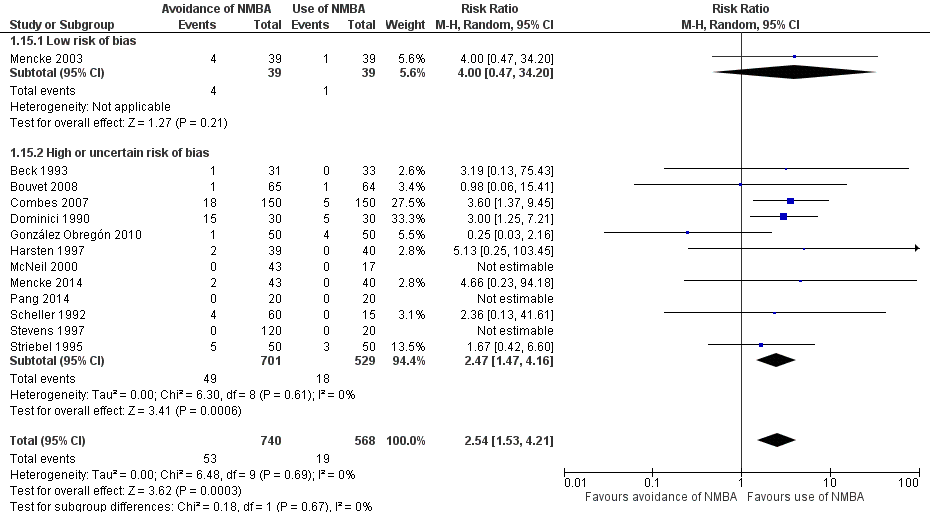
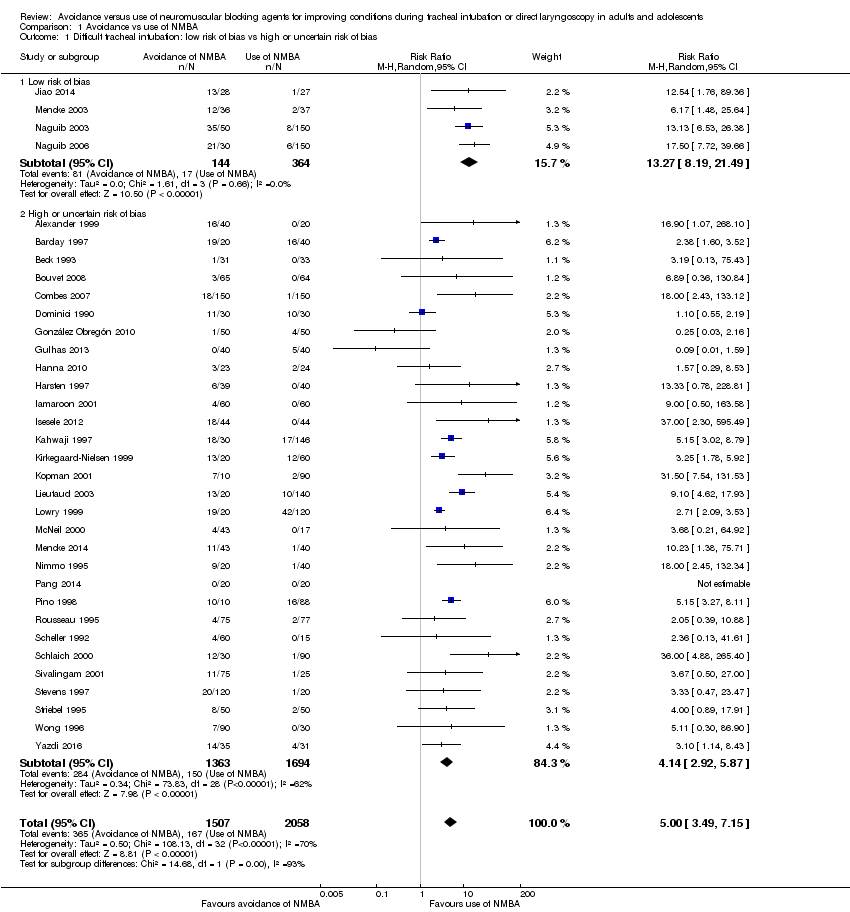
Comparison 1 Avoidance vs use of NMBA, Outcome 1 Difficult tracheal intubation: low risk of bias vs high or uncertain risk of bias.

Comparison 1 Avoidance vs use of NMBA, Outcome 2 Difficult tracheal intubation: depolarizing vs non‐depolarizing NMBA.

Comparison 1 Avoidance vs use of NMBA, Outcome 3 Difficult tracheal intubation: remifentanil vs no remifentanil.
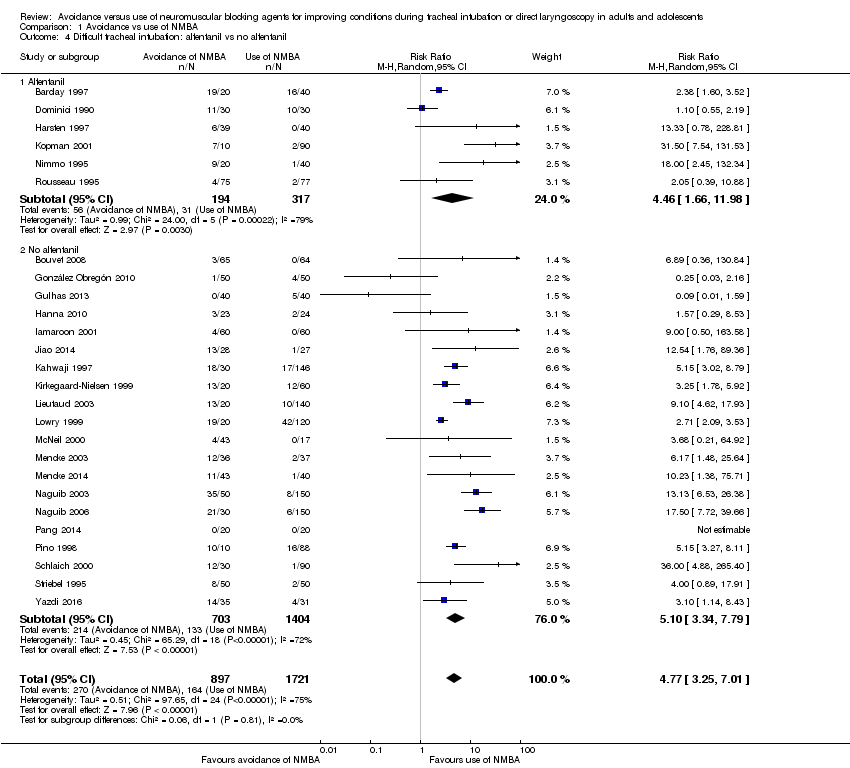
Comparison 1 Avoidance vs use of NMBA, Outcome 4 Difficult tracheal intubation: alfentanil vs no alfentanil.

Comparison 1 Avoidance vs use of NMBA, Outcome 5 Difficult tracheal intubation: local anaesthesia vs no local anaesthesia.

Comparison 1 Avoidance vs use of NMBA, Outcome 6 Difficult tracheal intubation: excluded anticipated DTI vs included anticipated DTI.

Comparison 1 Avoidance vs use of NMBA, Outcome 7 Difficult tracheal intubation: "best‐case scenario".

Comparison 1 Avoidance vs use of NMBA, Outcome 8 Difficult tracheal intubation excluding dose‐finding studies.

Comparison 1 Avoidance vs use of NMBA, Outcome 9 Difficult tracheal intubation: funding from pharmaceutical industry.
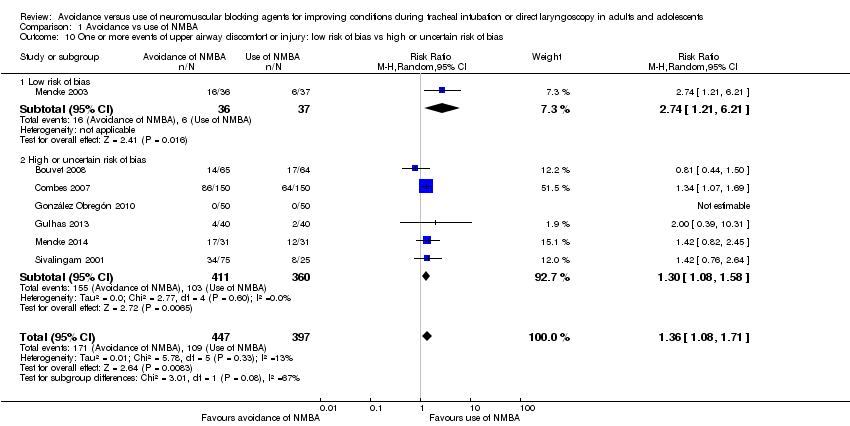
Comparison 1 Avoidance vs use of NMBA, Outcome 10 One or more events of upper airway discomfort or injury: low risk of bias vs high or uncertain risk of bias.
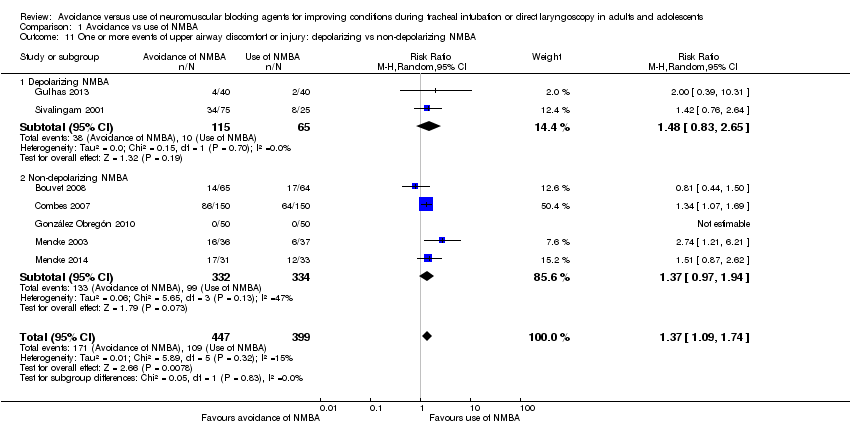
Comparison 1 Avoidance vs use of NMBA, Outcome 11 One or more events of upper airway discomfort or injury: depolarizing vs non‐depolarizing NMBA.
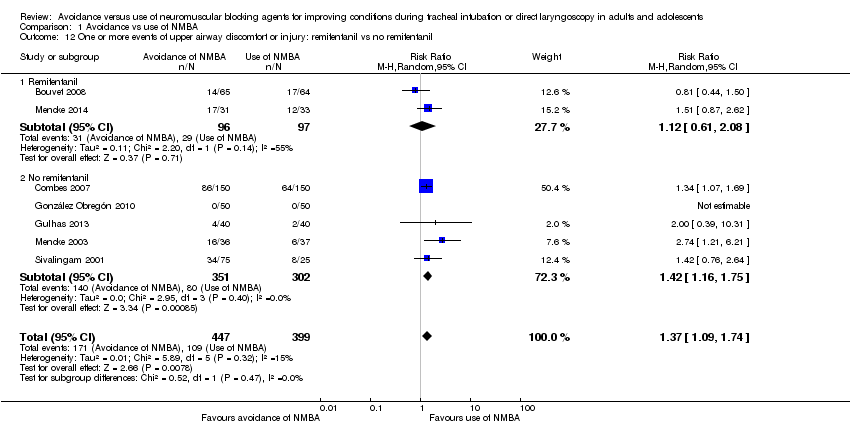
Comparison 1 Avoidance vs use of NMBA, Outcome 12 One or more events of upper airway discomfort or injury: remifentanil vs no remifentanil.
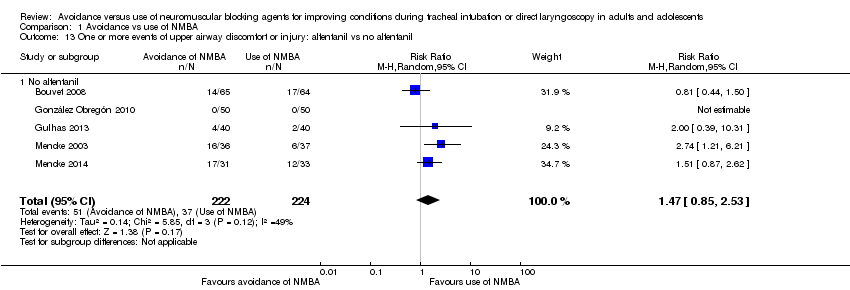
Comparison 1 Avoidance vs use of NMBA, Outcome 13 One or more events of upper airway discomfort or injury: alfentanil vs no alfentanil.
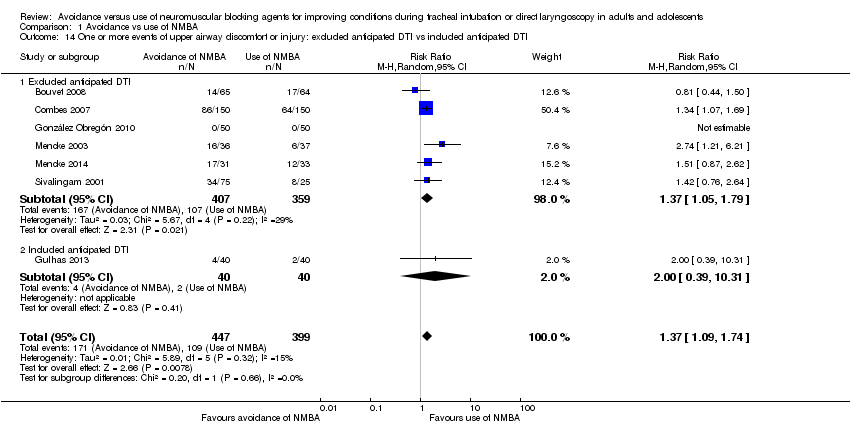
Comparison 1 Avoidance vs use of NMBA, Outcome 14 One or more events of upper airway discomfort or injury: excluded anticipated DTI vs included anticipated DTI.
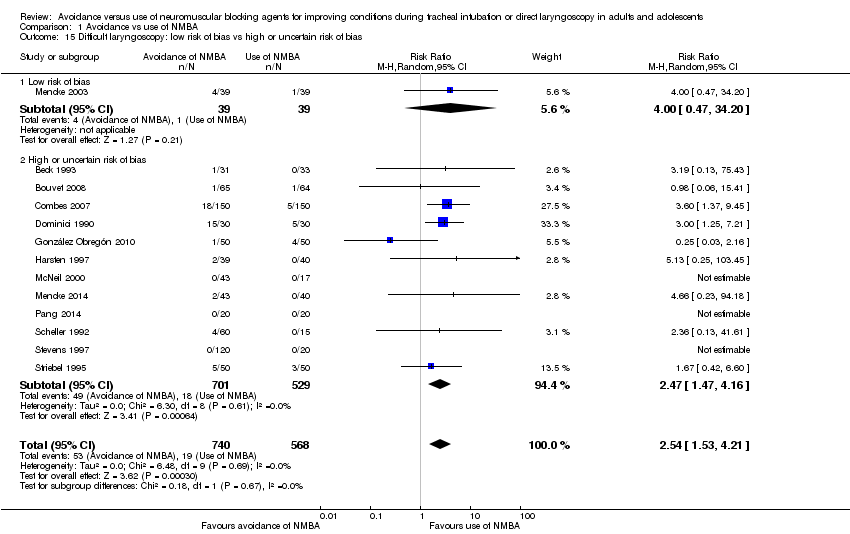
Comparison 1 Avoidance vs use of NMBA, Outcome 15 Difficult laryngoscopy: low risk of bias vs high or uncertain risk of bias.
| Avoidance vs use of neuromuscular blocking agent for improving conditions during tracheal intubation in adults and adolescents | ||||||
| Patient or population: improving conditions during tracheal intubation or direct laryngoscopy in adults and adolescents | ||||||
| Outcomes | Anticipated absolute effects* (95% CI) | Relative effect of avoidance vs use of NMBA | Number of participants | Quality of the evidence | Comments | |
| Assumed risk Risk with use of NMBA | Corresponding risk Risk with avoidance of NMBA | |||||
| Primary outcomes | ||||||
| Difficult tracheal intubation: low risk of bias trials | Study population | RR 13.27 | 508 | ⊕⊕⊕⊝ Moderatea | TSA shows that the required information size of 8195 for a 20% RRR has not been achieved, but the trial sequential monitoring boundary has been crossed and the TSA‐adjusted CI for the RR is 1.85 to 95.04 | |
| 47 per 1000 | 620 per 1000 | |||||
| Difficult tracheal intubation: all trials | Study population | RR 5.00 | 3565 | ⊕⊕⊝⊝ Lowb | TSA shows that the required information size of 44,661 for a 20% RRR has not been achieved, but the trial sequential monitoring boundary has been crossed and the TSA‐adjusted CI for the RR is 1.20 to 20.77. | |
| 81 per 1000 | 406 per 1000 | |||||
| One or more events of upper airway discomfort or injury: low risk of bias trials | Study population | RR 2.74 | 73 | See comments | Because only 1 low risk of bias trial was identified, no quality of evidence assessment was performed | |
| 162 per 1000 | 444 per 1000 | |||||
| One or more events of upper airway discomfort or injury: all trials | Study population | RR 1.37 | 846 | ⊕⊕⊕⊝ Moderatec | TSA shows that the required information size of 1981 for a 20% RRR has not been achieved, but the trial sequential monitoring boundary has been crossed and the TSA‐adjusted CI for the RR is 1.00 to 1.86. | |
| 273 per 1000 | 374 per 1000 | |||||
| Mortality | Not estimated | Not estimated | Not estimated | 0 (34 studies) | Not estimated | |
| Secondary outcomes | ||||||
| Difficult laryngoscopy: low risk of bias trials | Study population | RR 4.00 | 78 | See comments | Because only 1 low risk of bias trial was identified, no quality of evidence assessment was performed | |
| 26 per 1000 | 103 per 1000 | |||||
| Difficult laryngoscopy: all trials | Study population | RR 2.54 | 1308 | ⊕⊕⊝⊝ Lowd | TSA shows that the required information size of 22,911 for a 20% RRR was not achieved, and in no trials were sequential monitoring boundaries crossed. The TSA‐adjusted CI for the RR is 0.27 to 21.75. | |
| 33 per 1000 | 85 per 1000 | |||||
| *The risk in the intervention group (and its 95% confidence interval) is based on assumed risk in the comparison group and the relative effect of the intervention (and its 95% CI) | ||||||
| GRADE Working Group grades of evidence | ||||||
| aDowngraded one level because of indirectness bDowngraded two levels because of indirectness, heterogeneity, and high or uncertain risk of bias cDowngraded one level because of high or uncertain risk of bias dDowngraded two levels because of imprecision and high or uncertain risk of bias | ||||||
| Study ID | NMBA | Country | Language | Randomized | Sex | Age, years | Weight, kg | BMI | ASA class included | Expected difficult airway excluded | Overweight excluded |
| C1: suxamethonium 1 mg/kg | UK | English | 60 | C: 12F/8M I1: 11F/9M I2: 11F/9M | C: 41.7 (17.4) I1: 40.3 (10.6) I2: 44.2 (15.0) | C: 76.3 (15.0) I1: 75.5 (15.1) I2: 76.6 (16.8) | ns | I‐II | yes | ||
| C1: rocuronium 0.1 mg/kg C2: rocuronium 0.13 mg/kg | UK | English | 60 | ns | C1: 30 C2: 29 I1: 27 | C1: 74 C2: 72 I1: 64 | ns | ns | yes | yes | |
| C1: suxamethonium 1 mg/kg | USA | English | 64 | C1: 22F/11M I1: 21F/10M | C1: 34 (11) I1: 35 (11) | C1: 69 (14) I1: 65 (13) | I‐II | ||||
| C1: cisatracurium 0.15 mg/kg | France | English | 130 | C1: 65F I1: 65F | C1: 41.5 (12.9) I1: 40.7 (15.2) | ns | C1: 24.6 (5.4) I1: 23.0 (3.5) | I‐II | yes | ||
| C1: rocuronium 0.6 mg/kg | France | English | 300 | C1: 73F/77M I1: 69F/81M | C1: 41 (18‐70) I1: 43 (18‐66) | C1: 73 (13) I1: 70 (13) | ns | I‐II | yes | yes | |
| C1: suxamethonium 1.5 mg/kg | France | French | 60 | C1: 9F/21M I1: 9F/21M | C1: 48.4 (3.4) I1: 50.1 (2.9) | C1: 62.8 (2.5) I1: 61.6 (2.1) | ns | I‐III | |||
| C1: rocuronium 0.6 mg/kg | Columbia | Spanish | 100 | C1: 33F/17M I1: 33F/17M | C1: 34.7 (11.0) I1: 32.8 (12.3) | ns | ns | I‐II | yes | ||
| C1: succinylcholine 1 mg/kg | Turkey | English | 80 | C1: 19F/21M I1: 22F/18M | C1: 49.6 (8.4) I1: 47.9 (8.7) | C1: 77.3 (13.1) I1: 73.2 (14.4) | ns | I‐II | |||
| C1: rocuronium 0.06 mg/kg + succinylcholine 1.5 mg/kg | USA | English | 50 | C1: 15F/9M I1: 5F/18M | C1: 39.0 (13.3) I1: 43.0 (14.5) | C1: 75.0 (15.0) I1: 81.0 (13.0) | C1: 25.9 (4.6) I1: 26.5 (2.9) | I‐II | yes | ||
| C1: suxamethonium 1 mg/kg | Sweden | English | 80 | C1: 26F/13M I1: 23F/14M | C1: 41.8 (13) I1: 39.5 (14) | ns | ns | I‐II | |||
| C1: suxamethonium 1.5 mg/kg | Thailand | English | 120 | C1: 54F/6M I1: 54F/6M | C1: 40.6 (9.1) I1: 39.7 (9.2) | C1: 55.8 (10.8) I1: 55.1 (9.1) | ns | I‐II | yes | yes | |
| C1: suxamethonium 1.5 mg/kg | Nigeria | English | 96 | C1: 12F/32M I1: 21F/23M | C1: 30.8 (9.0) I1: 32.6 (8.0) | C1. 69.0 (7.4) I1: 68.3 (6.6) | I‐II | yes | |||
| C1: suxamethonium 0.6 mg/kg | China | English | 55 | C1: 27F/0M I1: 28F/0M | C1: 38.4 (10.9) I2: 36.3 (9.9) | C1: 58.1 (7.0) I2: 58.2 (7.9) | ns | I‐II | yes | ||
| C1: ORG 9487 (rapacuronium) 0.5 mg/kg C2: ORG 9487 (rapacuronium) 1.0 mg/kg C3: ORG 9487 (rapacuronium) 1.5 mg/kg C4: ORG 9487 (rapacuronium) 2.0 mg/kg C5: ORG 9487 (rapacuronium) 2.5 mg/kg | USA | English | 181 | C1: 20F/10M C2: 18F/9M C3: 17F/15M C4: 15F/13M C5: 22F/9M I1: 19F/11M | C1: 51.3 C2: 49.6 C3: 52.0 C4: 50.6 C5: 50.2 I1: 52.6 | C1: 67.3 C2: 70.5 C3: 68.6 C4: 71.3 C5: 75.9 I1: 69.7 | ns | I‐III | yes | ||
| C1: rocuronium 0.4 mg/kg C2: rocuronium 0.8 mg/kg C3: rocuronium 1.2 mg/kg | USA | English | 80 | C1: 2F/18M C2: 6F/14M C3: 10F/10M I1: 5F/15M | C1: 39.7 (7.5) C2: 39.5 (14.3) C3: 39.2 (10.5) I1: 39.3 (11.8) | C1: 75.0 (16.9) C2: 78.6 (15.8) C3: 67.4 (14.8) I1: 73.4 (16.6) | ns | I‐II | yes | ||
| C1: rapacuronium 1.0 mg/kg C2: rapacuronium 1.2 mg/kg C3: rocuronium 0.50 mg/kg | USA | English | 100 | ns | range: 18‐65 | ns | range: 17.5‐27.5 | I‐II | yes | ||
| C1: atracurium 0.5 mg/kg C2: atracurium 0.5 mg/kg C3: atracurium 0.5 mg/kg | France | English | 170 | C1: 3F/42M C2: 7F/41M C3: 8F/39M I1: 2F/18M | C1: 52.9 (11.8) C2: 51.3 (12.6) C3: 56.3 (11.9) I1: 50.4 (10.7) | ns | C1: 23.7 (3.2) C2: 23.1 (3.2) C3: 23.6 (3.4) I1: 23.3 (3.9) | I‐II | yes | ||
| C1: rocuronium 0.3 mg/kg C2: rocuronium 0.45 mg/kg C3: rocuronium 0.6 mg/kg C4: rocuronium 0.3 mg/kg C5: rocuronium 0.45 mg/kg C6: rocuronium 0.6 mg/kg | UK | English | 140 | C1: 4F/16M I1: 2F/8M I2: 4F/6M | C1: 29 (11) I1: 29 (11) I2: 30 (9) | C1: 77(16) I1: 72 (12) I2: 73 (15) | ns | I‐II | yes | yes | |
| C1: succinylcholine 1 mg/kg | UK | English | 60 | ns | C1: 44 (15) I1: 39 (11) I2: 40 (13) | C1: 75 (10) I1: 76 (15) I2: 71 (12) | ns | I‐II | yes | yes | |
| C1: atracurium 0.5 mg/kg | Germany | English | 80 | C1: 19F/18M I1: 18F/18M | C1: 47.2 (13.2) I1: 47.7 (14.3) | C1: 77.7 (16) I1: 74.2 (15) | I‐II | yes | yes | ||
| I1: rocuronium 0.45 mg·kg‐1 | Germany | English | 83 | C1: 16F/24M I1: 16F/23M | C1: 50 (16) I1: 48 (17) | C1: 83.8 (16) I1: 79.6 (15) | C1: 28.2 (4.3) I1: 26.5 (3.7) | I‐III | yes | yes | |
| C1: succinylcholine 0.3 mg/kg C2: succinylcholine 0.5 mg/kg C3: succinylcholine 1.0 mg/kg | Saudi Arabia | English | 200 | C1: 25F/25M C2: 23F/27M C3: 28F/22M I1: 23F/27M | C1: 30.9 (28‐34) | C1: 66.6 (64‐70) | ns | I | yes | ||
| C1: succinylcholine 0.3 mg/kg C2: succinylcholine 0.5 mg/kg C3: succinylcholine 1.0 mg/kg C4: succinylcholine 1.5 mg/kg C5: succinylcholine 2.0 mg/kg | Saudi Arabia | English | 180 | C1: 17F13M I1: 19F/11M | C1: 33.5 (8.7) | C1: 67.8 (10.3) | C1: 25.6 (2.8) | I | yes | ||
| C1: suxamethonium 0.25 mg/kg C2: suxamethonium 0.5 mg/kg | USA | English | 60 | C1: 12F/8M C2: 12F/8M I1: 14F/6M | C1: 28.6 (17‐55) C2: 29.0 (16‐53) I1: 27.0 (18‐53) | C1: 66.2 (13.6) C2: 64.4 (11.2) I1: 68.1 (13.6) | ns | I‐II | |||
| C1: cisatracurium 0.1 mg/kg | China | English | 40 | C1: 14F/6M I1: 9F/11M | C1: 45.2 (7.4) I1: 43.3 (6.7) | C1: 63.8 (9.5) I1: 64.6 (7.9) | C1: 23.7 (2.8) I1: 23.3 (3.1) | I‐II | yes | yes | |
| C1: mivacurium 0.25 mg/kg C2: rocuronium 0.45 mg/kg C3: rocuronium 0.6 mg/kg C4: rocuronium 0.9 mg/kg C5: rocuronium 1.2 mg/kg | USA | English | 100 | ns | ns | ns | ns | I‐II | yes | yes | |
| C1: vecuronium 0.08 mg/kg | France | French | 152 | ns | C1: 23 (5) I1: 25 (8) | C1: 71 (10) I1: 71 (11) | ns | I | yes | ||
| C1: d‐tubocurarine 3 mg and succinylcholine 1 mg/kg | USA | English | 75 | C1: 8F/7M I1: 10F/5M I2: 11F/4M I3: 13F/2M I4: 10F/5M | C1: 37 (10) I1: 33 (9) I2: 30 (10) I3: 35 (11) I4: 36 (16) | C1: 77 (20) I1: 65 (11) I2: 66 (15) I3: 66 (12) I4: 68 (16) | ns | I | yes | ||
| C1: rocuronium 0.6 mg/kg C2: rocuronium 0.45 mg/kg C3: rocuronium 0.3 mg/kg | Germany | English | 120 | C1: 13F/17M C2: 13F/17M C3: 14F/16M I1: 14F/16M | C1: 37 (11) C2: 35 (11) C3: 36 (12) I1: 37 (11) | C1: 72 (14) C2: 75 (13) C3: 75 (12) I1: 70 (14) | ns | I‐II | yes | ||
| C1: suxamethonium 1 mg/kg | New Zealand | English | 100 | C1: 7F/18M I1: 9F/16M I2: 8F/17M I3: 10F/15M | C1: 34.3 (14.0) I1: 36.8 (12.6) I2: 29.6 (9.7) I3: 37.7 (12) | C1: 66 (10) I1: 62 (11) I2: 63 (15) I3: 61 (11) | ns | I‐II | yes | ||
| C1: d‐tubocurarine 3 mg and succinylcholine 1 mg/kg | USA | English | 140 | C1: 12F/8M I1: 12F/8M I2: 15F/5M I3: 17F/3M I4: 17F/3M I5: 15F/5M I6: 14F/6M | C1: 35 (9) I1: 38 (12) I2: 34 (11) I3: 37 (10) I4: 34 (9) I5: 33 (11) I6: 37 (14) | C1: 70 (8) I1: 72 (17) I2: 70 (14) I3: 72 (10) I4: 72 (13) I5: 72 (18) I6: 70 (13) | ns | I‐II | yes | yes | |
| C1: vecuronium 1 mg + succinylcholine 1 mg/kg C2: vecuronium 1 mg + succinylcholine 1 mg/kg | Germany | German | 100 | C1: 25F C2: 25F I1: 25F I2: 25F | C1: 47.8 (11.7) C2: 43.8 (9.5) I1: 46.5 (12.7) I2: 46.0 (12.4) | C1: 62.6 (9.4) C2: 68.2 (14) I1: 64.9 (10.1) I2: 70.8 (14.6) | ns | I‐II | |||
| C1: succinylcholine 1 mg/kg | Malaysia | English | 120 | C1: 16F/14M I1: 13F/17M I2: 18F/12M I3: 12F/17M | C1: 35.7 (16) I1: 35.5 (12) I2: 35.4 (13) I3: 35.7 (11) | C1: 60.2 (8.9) I1: 66.0 (13.1) I2: 63.4 (12.9) I3: 60.1 (10.8) | ns | I‐II | yes | ||
| C1: atracurium 0.5 mg/kg | Iran | English | 66 | 69.7% M | 31.6 (13) | ns | ns | I‐II | yes | ||
| ns = not specified; The values in parentheses are standard deviation or range | |||||||||||
| Study ID | NMBA | Randomized/ Analysed | Hypnotic | Opioid | Local anaesthetic | Difficult intubation events/ | Difficult laryngos‐ copy events/ | Upper airway discomfort or injury events/total |
| C1: suxamethonium 1 mg/kg | 60/60 | C1: propofol 2 mg/kg I1: propofol 2 mg/kg I2: propofol 2 mg/kg | C1: none I1: alfentanil 50 μg/kg I2: remifentanil 2 μg/kg | None | C1: 0/20 I1: 3/20 I2: 13/20 | ns | ns | |
| C1: rocuronium 0.1 mg/kg C2: rocuronium 0.3 mg/kg | 60/60 | C1: propofol 2.5 mg/kg C2: propofol 2.5 mg/kg I1: propofol 2.5 mg/kg | C1: alfentanil 10 μg/kg C2: alfentanil 10 μg/kg I1: alfentanil 10 μg/kg | Lidocaine 10 mg IV | C1: 14/20 C2: 2/20 I1: 19/20 | ns | ns | |
| C1: suxamethonium 1 mg/kg | 64/64 | C1: thiopenthal 5 mg/kg I1: propofol 2 mg/mL | C1: none I1: alfentanil 50 μg/kg | None | C1: 0/33 I1: 1/31 | C1: 0/33 I1: 1/31 | ns | |
| C1: cisatracurium 0.15 mg/kg | 130/129 | C1: propofol 2.5 mg/kg I1: propofol 2.5 mg/kg | C1: remifentanil 2 μg/kg I1: remifentanil 2 μg/kg | None | C1: 0/64 I1: 3/65 | C1: 1/64 I1: 1/65 | C1: 17/64 I1: 14/65 | |
| C1: rocuronium 0.6 mg/kg | 300/300 | C1: propofol 2.5 mg/kg I1: propofol 2.5 mg/kg | C1: alfentanil 15 µg/kg I1: alfentanil 40 µg/kg | None | C1: 1/150 I1: 18/150 | C1: 5/150 I1: 18/150 | C1: 64/150 I1: 86/150 | |
| C1: suxamethonium 1.5 mg/kg | 60 | C1: propofol 3 mg/mL I1: propofol 3 mg/mL | C1: alfentanil 7‐10 µg/kg I1: alfentanil 7‐10 µg/kg | Lidocaine (2%): IV + topical Lidocaine 5% | C1: 10/30 I1: 11/30 | C1: 5/30 I1: 15/30 | ns | |
| C1: rocuronium 0.6 mg/kg | 100/100 | C1: propofol 1‐2 mg/kg I1: Sevoflurane 3% + propofol 2 mg/kg | C1: remifentanil 1‐2 μg/kg in 1 min + 0.15 µ/kg/min in1 min I1: remifentanil 0.6 µ/kg/min for 5 min | None | C1: 4/50 I1: 1/50 | C1: 4/50 I1: 1/50 | C1: 0/50 I1: 0/50 | |
| C1: succinylcholine 1 mg/kg | 80/80 | C1: propofol 2 mg/kg I1: propofol 2 mg/kg | C1: remifentanil 1 μg/kg I1: remifentanil 4 μg/kg | None | C1: 5/40 I1: 0/40 | ns | C1: 2/40 I1: 4/40 | |
| C1: rocuronium 0.06 mg/kg + succinylcholine 1.5 mg/kg | 50/47 | C1: propofol 2 mg/kg I1: propofol 2 mg/kg | C1: none I1: remifentanil 4 μg/kg | Lidocaine 0.5 mg/kg IV | C1: 2/24 I1: 3/23 | ns | ns | |
| C1: suxamethonium 1 mg/kg | 80/79 | C1: thiopental 5 mg/kg I1: propofol 2.5 mg/kg | C1: alfentanil 10 μg/kg I1: alfentanil 10 μg/kg | None | C1: 0/40 I1: 6/39 | C1: 0/40 I1: 2/39 | ns | |
| C1: suxamentonium 1.5 mg/kg | 120/120 | C1: thiopenthal 5 mg/kg + (N2O) I1: sevoflurane 8% | C1: fentanyl 1.5 μg/kg I1: fentanyl 1.5 μg/kg | None | C1: 0/60 I1: 4/60 | ns | ns | |
| C1: suxamethonium 1.5 mg/kg | 96/88 | C1: propofol 2.0 mg/kg I1: propofol 2.0 mg/kg | None | C1: none I1: lidocaine IV 1.5 mg/kg | C1: 0/44 I1: 18/44 | ns | ns | |
| C1: suxamethonium 0.6 mg/kg | 55/55 | C1: propofol 2 mg/kg I1: propofol 2 mg/kg | C1: remifentanil 1 μg/kg I1: remifentanil 1.5 μg/kg | None | C1: 1/27 I2: 13/28 | ns | ns | |
| C1: ORG 9487 (rapacuronium) 0.5 mg/kg C2: ORG 9487 (rapacuronium) 1.0 mg/kg C3: ORG 9487 (rapacuronium) 1.5 mg/kg C4: ORG 9487 (rapacuronium) 2.0 mg/kg C5: ORG 9487 (rapacuronium) 2.5 mg/kg | 181/176 | C1: thiopental 3‐6 mg/kg I1: thiopental 3‐6 mg/kg | C1: fentanyl 0.5‐3 μm/kg I1: fentanyl 0.5‐3 μm/kg | None | C1: 9/30 I1: 18/30 | ns | ns | |
| C1: rocuronium 0.4 mg/kg C2: rocuronium 0.8 mg/kg C3: rocuronium 1.2 mg/kg | 80/80 | C1: propofol 2 mg/kg C2: propofol 2 mg/kg C3: propofol 2 mg/kg I1: propofol 2 mg/kg | C1: fentanyl 2 μm/kg C2: fentanyl 2 μm/kg C3: fentanyl 2 μm/kg I1: fentanyl 2 μm/kg | None | C1: 9/20 C2: 2/20 C3: 1/20 I1: 13/20 | ns | ns | |
| C1: rapacuronium 1.0 mg/kg C2: rapacuronium 1.2 mg/kg C3: rocuronium 0.50 mg/kg | 100/100 | C1: propofol 2.0 mg/kg IV C2: propofol 2.0 mg/kg IV C3: propofol 2.0 mg/kg IV I1: propofol 2.0 mg/kg IV | C1: alfentanil 12.5 μg/kg C2: alfentanil 12.5 μg/kg C3: alfentanil 12.5 μg/kg I1: alfentanil 12.5 μg/kg | None | C1: 2/30 C2: 0/30 C3: 0/30 I1: 7/10 | |||
| C1: atracurium 0.5 mg/kg C2: atracurium 0.5 mg/kg C3: atracurium 0.5 mg/kg | 170/160 | C1: propofol 1.5 mg/kg C2: propofol 2.0 mg/kg C3: propofol 2.5 mg/kg I1: propofol 2.5 mg/kg | C1: fentanyl 3 μm/kg C2: fentanyl 3 μm/kg C3: fentanyl 3 μm/kg I1: fentanyl 3 μm/kg | None | C1: 7/47 C2: 1/48 C3: 2/45 I1: 13/20 | ns | ns | |
| C1: rocuronium 0.3 mg/kg C2: rocuronium 0.45 mg/kg C3: rocuronium 0.6 mg/kg C4: rocuronium 0.3 mg/kg C5: rocuronium 0.45 mg/kg C6: rocuronium 0.6 mg/kg | 140/140 | C1: propofol 2‐3 mg/kg C2: propofol 2‐3 mg/kg C3: propofol 2‐3 mg/kg C4: sevoflurane 8% C5: sevoflurane 8% C6: sevoflurane 8% I1: propofol 2‐3 mg/kg I2: sevoflurane 8% | C1: fentanyl 1 μm/kg C2: fentanyl 1 μm/kg C3: fentanyl 1 μm/kg C4: fentanyl 1 μm/kg C5: fentanyl 1 μm/kg C6: fentanyl 1 μm/kg I1: fentanyl 1 μm/kg I2: fentanyl 1 μm/kg | None | C1: 11/20 C2: 4/20 C3: 2/20 C4:14/20 C5: 9/20 C6: 2/20 I1:10/10 I2: 9/10 | ns | ns | |
| C1: succinylcholine 1 mg/kg | 60/60 | C1: propofol 2 mg/kg I1: propofol 2 mg/kg I2: propofol 2 mg/kg | C1: none I1: remifentanil 2 μg/kg I2: remifentanil 4 μg/kg | None | C1: 0/17 I1: 2/23 I2: 2/20 | C1: 0/17 I1: 0/23 I2: 0/20 | ns | |
| C1: atracurium 0.5 mg/kg | 80/73 | C1: propofol 2.5‐3 mg/kg I1: propofol 2.5‐3 mg/kg | C1: fentanyl 2‐3 μg/kg I1: fentanyl 2‐3 μg/kg | None | C1: 2/37 I1: 12/36 | C1: 1/39 I1: 4/39 | C1: 6/37 I1: 16/36 | |
| C1: rocuronium 0.45 mg·kg/kg | 83/83 | C1: propofol 1.5 mg·kg‐1 + sevoflurane 3.0‐3.5 Vol%,8 l·min‐1 in 2‐3 minutes I1: propofol 1.5 mg/kg | C1: remifentanil 0.30 μg/kg/min for 3 minutes I1: remifentanil 0.30 μg/kg/min for 3 minutes | None | C1: 1/40 I1: 11/43 | C1: 0/40 I1: 2/43 | C1: 12/33 I1: 17/31 | |
| C1: succinylcholine 0.3 mg/kg C2: succinylcholine 0.5 mg/kg C3: succinylcholine 1.0 mg/kg | 200/200 | C1: propofol 2 mg/kg C2: propofol 2 mg/kg C3: propofol 2 mg/kg I1: propofol 2 mg/kg | C1: fentanyl 2 μg/kg C2: fentanyl 2 μg/kg C3: fentanyl 2 μg/kg I1: fentanyl 2 μg/kg | None | C1: 4/50 C2: 3/50 C3: 1/50 I1: 15/50 | ns | ns | |
| C1: succinylcholine 0.3 mg/kg C2: succinylcholine 0.5 mg/kg C3: succinylcholine 1.0 mg/kg C4: succinylcholine 1.5 mg/kg C5: succinylcholine 2.0 mg/kg | 180/180 | C1: propofol 2 mg/kg C2: propofol 2 mg/kg C3: propofol 2 mg/kg C4: propofol 2 mg/kg C5: propofol 2 mg/kg I1: propofol 2 mg/kg | C1: fentanyl 2 μm/kg C2: fentanyl 2 μm/kg C3: fentanyl 2 μm/kg C4: fentanyl 2 μm/kg C5: fentanyl 2 μm/kg I1: fentanyl 2 μm/kg | None | C1: 2/30 C2: 2/30 C3: 1/30 C4: 1/30 C5: 0/30 I1: 21/30 | ns | ns | |
| C1: suxamethonium 0.25 mg/kg C2: suxamethonium 0.5 mg/kg | 60/60 | C1: propofol 2.5 mg/kg C2: propofol 2.5 mg/kg I1: Propofol 2.5 mg/kg | C1: alfentanil 15 μg/kg C2: alfentanil 15 μg/kg I1: alfentanil 15 μg/kg | None | C1: 0/20 C2: 1/20 I1: 9/20 | ns | ns | |
| C1: cisatracurium 0.1 mg/kg | 20/20 | C1: propofol target control I1: propofol target control | C1: remifentanil target control I1: remifentanil target control | C1: tetracaine 10 mg/mL I1: tetracaine 10 mg/mL | C1: 0/20 I1: 0/20 | C1: 0/20 I1: 0/20 | ns | |
| C1: mivacurium 0.25 mg/kg C2: rocuronium 0.45 mg/kg C3: rocuronium 0.6 mg/kg C4: rocuronium 0.9 mg/kg C5: rocuronium 1.2 mg/kg | 100/98 | C1: propofol 2 mg/kg C2: propofol 2 mg/kg C3: propofol 2 mg/kg C4: propofol 2 mg/kg C5: propofol 2 mg/kg I1: propofol 2 mg/kg | C1: fentanyl 2 μm/kg C2: fentanyl 2 μm/kg C3: fentanyl 2 μm/kg C4: fentanyl 2 μm/kg C5: fentanyl 2 μm/kg I1: fentanyl 2 μm/kg | None | C1: 2/30 IC2: 9/15 C3: 4/14 C4: 1/14 C5: 0/15 I1: 10/10 | ns | ns | |
| C1: vecuronium 0.08 mg/kg | 152/152 | C1: propofol 2.5 mg/kg I1: propofol 2.5 mg/kg | C1: alfentanil 0.03 mg/kg I1: alfentanil 0.03 mg/kg | C1: none I1: lidocaine 1.5 mg/kg | C1: 2/77 I1: 4/75 | ns | ns | |
| C1: d‐tubocurarine 3 mg and succinylcholine 1 mg/kg | 75/75 | C1: thiamylal 4 mg/kg I1: propofol 2 mg/kg I2: propofol 2 mg/kg I3: propofol 2 mg/kg I4: propofol 2 mg/kg | C1: none I1: alfentanil 30 µg/kg I2: alfentanil 40 µg/kg I3: alfentanil 50 µg/kg I4: alfentanil 60 µg/kg | None | C1: 0/15 I1: 1/15 I2: 1/15 I3: 1/15 I4: 1/15 | C1: 0/15 I1: 1/15 I2: 1/15 I3: 1/15 I4: 1/15 | ns | |
| C1: rocuronium 0.6 mg/kg C2: rocuronium 0.45 mg/kg C3: rocuronium 0.3 mg/kg | 120/120 | C1: propofol 2‐2.5 mg/kg C2: propofol 2‐2.5 mg/kg C3: propofol 2‐2.5 mg/kg I1: propofol 2‐2.5 mg/kg | C1: remifentanil 0.5 µg/kg/min C2: remifentanil 0.5 µg/kg/min IC3: remifentanil 0.5 µg/kg/min I1: remifentanil 0.5 µg/kg/min | None | C1: 0/30 C2: 1/30 C3: 0/30 I1: 12/30 | ns | ns | |
| C1: suxamethonium 1 mg/kg | 100/100 | C1: Sevoflu 7% + N2O60% I1: Sevoflu 7% + N2O60% I2: Sevoflu 7% + N2O60% I3: Sevoflu 7% + N2O60% | C1: alfentanil 10 µg/kg I1: alfentanil 20 µg/kg I2: alfentanil 25 µg/kg I3: alfentanil 30 µg/kg | None | C1: 1/25 I1: 4/25 I2: 5/25 I3: 2/25 | ns | C1: 8/25 I1: 12/25 I2: 13/25 I3: 9/25 | |
| C1: d‐tubocurarine 3 mg and succinylcholine 1 mg/kg | 140/140 | C1: thiopental 4 mg/kg I1: etomidate 0.3 mg/kg I2: etomidate 0.3 mg/kg I3: propofol 2 mg/kg I4: propofol 2 mg/kg I5: thiopental 4 mg/kg I6: thiopental 4 mg/kg | C1: none I1: alfentanil 40 µg/kg I2: alfentanil 40 µg/kg I3: alfentanil 40 µg/kg I4: alfentanil 40 µg/kg I5: alfentanil 40 µg/kg I6: alfentanil 40 µg/kg | C1: none I1: none I2: lidocaine 1 mg/kg I3: none I4: lidocaine 1 mg/kg I5: none I6: lidocaine1 mg/kg | C1: 1/20 I1: 3/20 I2: 1/20 I3: 3/20 I4: 2/20 I5: 8/20 I6: 3/20 | C1: 0/20 I1: 0/20 I2: 0/20 I3: 0/20 I4: 0/20 I5: 0/20 I6: 0/20 | ns | |
| C1: vecuronium 1 mg + succinylcholine 1 mg/kg C2: vecuronium 1 mg + succinylcholine 1 mg/kg | 100/100 | C1: thiopental 5.5 mg/kg C2: propofol 2.2 mg/kg I1: propofol 2.4 mg/kg I2: propofol 2.2 mg/kg | C1: fentanyl 0.1 mg C2: fentanyl 0.1 mg I1: fentanyl 0.1 mg I2: fentanyl 0.2 mg | 2 mL lidocaine 1% IV | C1: 1/25 C2: 1/25 I1: 3/25 I2: 5/25 | C1: 2/25 C2: 1/25 I1: 1/28 I2: 4/25 | ns | |
| C1: succinylcholine 1 mg/kg | 120/120 | C1: propofol 3.0 mg/kg I1: propofol 2.6 mg/kg I2: propofol 2.6 mg/kg I3: propofol 3.1 mg/kg | C1: none I1: alfentanil 15 μg/kg I2: alfentanil 30 μg/kg I3: none | None | C1: 0/30 I1: 1/30 I2: 0/30 I3: 6/30 | ns | ns | |
| C1: atracurium 0.5 mg/kg | 66/66 | C1: propofol 2.5 mg/kg I1: propofol 2.5 mg/kg | C1: none I1: remifentanil 2 μg/kg | None | C1: 4/31 I1: 14/35 | ns | ns | |
| ns = not specified | ||||||||
| Outcome or subgroup title | No. of studies | No. of participants | Statistical method | Effect size |
| 1 Difficult tracheal intubation: low risk of bias vs high or uncertain risk of bias Show forest plot | 34 | 3565 | Risk Ratio (M‐H, Random, 95% CI) | 5.00 [3.49, 7.15] |
| 1.1 Low risk of bias | 4 | 508 | Risk Ratio (M‐H, Random, 95% CI) | 13.27 [8.19, 21.49] |
| 1.2 High or uncertain risk of bias | 30 | 3057 | Risk Ratio (M‐H, Random, 95% CI) | 4.14 [2.92, 5.87] |
| 2 Difficult tracheal intubation: depolarizing vs non‐depolarizing NMBA Show forest plot | 32 | 3413 | Risk Ratio (M‐H, Random, 95% CI) | 5.25 [3.61, 7.63] |
| 2.1 Depolarizing NMBA | 16 | 1540 | Risk Ratio (M‐H, Random, 95% CI) | 5.79 [2.64, 12.72] |
| 2.2 Non‐depolarizing NMBA | 16 | 1873 | Risk Ratio (M‐H, Random, 95% CI) | 4.72 [3.17, 7.02] |
| 3 Difficult tracheal intubation: remifentanil vs no remifentanil Show forest plot | 26 | 3008 | Risk Ratio (M‐H, Random, 95% CI) | 5.64 [3.82, 8.31] |
| 3.1 Remifentanil | 4 | 372 | Risk Ratio (M‐H, Random, 95% CI) | 15.86 [4.43, 56.71] |
| 3.2 No remifentanil | 22 | 2636 | Risk Ratio (M‐H, Random, 95% CI) | 5.23 [3.54, 7.74] |
| 4 Difficult tracheal intubation: alfentanil vs no alfentanil Show forest plot | 26 | 2618 | Risk Ratio (M‐H, Random, 95% CI) | 4.77 [3.25, 7.01] |
| 4.1 Alfentanil | 6 | 511 | Risk Ratio (M‐H, Random, 95% CI) | 4.46 [1.66, 11.98] |
| 4.2 No alfentanil | 20 | 2107 | Risk Ratio (M‐H, Random, 95% CI) | 5.10 [3.34, 7.79] |
| 5 Difficult tracheal intubation: local anaesthesia vs no local anaesthesia Show forest plot | 31 | 3184 | Risk Ratio (M‐H, Random, 95% CI) | 5.04 [3.48, 7.29] |
| 5.1 Local anaesthesia | 5 | 307 | Risk Ratio (M‐H, Random, 95% CI) | 1.90 [1.14, 3.18] |
| 5.2 No local anaesthesia | 26 | 2877 | Risk Ratio (M‐H, Random, 95% CI) | 6.26 [4.15, 9.44] |
| 6 Difficult tracheal intubation: excluded anticipated DTI vs included anticipated DTI Show forest plot | 34 | 3564 | Risk Ratio (M‐H, Random, 95% CI) | 5.00 [3.50, 7.16] |
| 6.1 Exclusion of patients with anticipated difficult intubation | 25 | 2886 | Risk Ratio (M‐H, Random, 95% CI) | 5.32 [3.54, 8.00] |
| 6.2 No exclusion of patients with anticipated difficult intubation | 9 | 678 | Risk Ratio (M‐H, Random, 95% CI) | 4.40 [1.71, 11.29] |
| 7 Difficult tracheal intubation: "best‐case scenario" Show forest plot | 34 | 2410 | Risk Ratio (M‐H, Random, 95% CI) | 5.99 [3.46, 10.38] |
| 8 Difficult tracheal intubation excluding dose‐finding studies Show forest plot | 16 | 1536 | Risk Ratio (M‐H, Random, 95% CI) | 3.40 [1.63, 7.10] |
| 9 Difficult tracheal intubation: funding from pharmaceutical industry Show forest plot | 34 | 3565 | Risk Ratio (M‐H, Random, 95% CI) | 5.00 [3.49, 7.15] |
| 9.1 No funding from pharmaceutical industry | 24 | 2550 | Risk Ratio (M‐H, Random, 95% CI) | 5.33 [3.16, 8.98] |
| 9.2 Funding from pharmaceutical industry | 10 | 1015 | Risk Ratio (M‐H, Random, 95% CI) | 4.10 [2.67, 6.31] |
| 10 One or more events of upper airway discomfort or injury: low risk of bias vs high or uncertain risk of bias Show forest plot | 7 | 844 | Risk Ratio (M‐H, Random, 95% CI) | 1.36 [1.08, 1.71] |
| 10.1 Low risk of bias | 1 | 73 | Risk Ratio (M‐H, Random, 95% CI) | 2.74 [1.21, 6.21] |
| 10.2 High or uncertain risk of bias | 6 | 771 | Risk Ratio (M‐H, Random, 95% CI) | 1.30 [1.08, 1.58] |
| 11 One or more events of upper airway discomfort or injury: depolarizing vs non‐depolarizing NMBA Show forest plot | 7 | 846 | Risk Ratio (M‐H, Random, 95% CI) | 1.37 [1.09, 1.74] |
| 11.1 Depolarizing NMBA | 2 | 180 | Risk Ratio (M‐H, Random, 95% CI) | 1.48 [0.83, 2.65] |
| 11.2 Non‐depolarizing NMBA | 5 | 666 | Risk Ratio (M‐H, Random, 95% CI) | 1.37 [0.97, 1.94] |
| 12 One or more events of upper airway discomfort or injury: remifentanil vs no remifentanil Show forest plot | 7 | 846 | Risk Ratio (M‐H, Random, 95% CI) | 1.37 [1.09, 1.74] |
| 12.1 Remifentanil | 2 | 193 | Risk Ratio (M‐H, Random, 95% CI) | 1.12 [0.61, 2.08] |
| 12.2 No remifentanil | 5 | 653 | Risk Ratio (M‐H, Random, 95% CI) | 1.42 [1.16, 1.75] |
| 13 One or more events of upper airway discomfort or injury: alfentanil vs no alfentanil Show forest plot | 5 | 446 | Risk Ratio (M‐H, Random, 95% CI) | 1.47 [0.85, 2.53] |
| 13.1 No alfentanil | 5 | 446 | Risk Ratio (M‐H, Random, 95% CI) | 1.47 [0.85, 2.53] |
| 14 One or more events of upper airway discomfort or injury: excluded anticipated DTI vs included anticipated DTI Show forest plot | 7 | 846 | Risk Ratio (M‐H, Random, 95% CI) | 1.37 [1.09, 1.74] |
| 14.1 Excluded anticipated DTI | 6 | 766 | Risk Ratio (M‐H, Random, 95% CI) | 1.37 [1.05, 1.79] |
| 14.2 Included anticipated DTI | 1 | 80 | Risk Ratio (M‐H, Random, 95% CI) | 2.0 [0.39, 10.31] |
| 15 Difficult laryngoscopy: low risk of bias vs high or uncertain risk of bias Show forest plot | 13 | 1308 | Risk Ratio (M‐H, Random, 95% CI) | 2.54 [1.53, 4.21] |
| 15.1 Low risk of bias | 1 | 78 | Risk Ratio (M‐H, Random, 95% CI) | 4.0 [0.47, 34.20] |
| 15.2 High or uncertain risk of bias | 12 | 1230 | Risk Ratio (M‐H, Random, 95% CI) | 2.47 [1.47, 4.16] |