재택치료 : 가정에서의 시한부환자간호
Información
- DOI:
- https://doi.org/10.1002/14651858.CD009231.pub2Copiar DOI

- Base de datos:
-
- Cochrane Database of Systematic Reviews
- Versión publicada:
-
- 18 febrero 2016see what's new
- Tipo:
-
- Intervention
- Etapa:
-
- Review
- Grupo Editorial Cochrane:
-
Grupo Cochrane de Práctica y organización sanitaria efectivas
- Copyright:
-
- Copyright © 2016 The Cochrane Collaboration. Published by John Wiley & Sons, Ltd.
Cifras del artículo
Altmetric:
Citado por:
Autores
Contributions of authors
DCGB screened the results from the search strategy for this update, handsearched PDQ‐Evidence, ClinicalTrials.gov, and relevant palliative‐care publications, and updated the Background and Discussion sections. SS, BW, and SES extracted data; SS conducted the analysis and led on writing the systematic review. BW and SES provided advice on the selection criteria and commented on the draft manuscripts.
Sources of support
Internal sources
-
Department of Public Health, University of Oxford, UK.
Part‐funded SS
External sources
-
NIHR Cochrane Programme Grant, UK.
Part‐funded SS
-
Canada Research Chair in Knowledge Translation, Canada.
Funded SES
Declarations of interest
BW is a full‐time salaried employee of the National Health Service in the UK. Her responsibilities include the provision of specialist palliative care services (in the hospice, community, and hospital), service development, education, and research in palliative care. Neither she, nor her organisation, stands to gain or lose from the conclusions of this review, but like other services within the National Health Service, the conclusions of this review may inform future service development or commissioning, or both.
DCGB: none. SS: none. SES: none.
Acknowledgements
Professor Steve Iliffe assisted with data extraction for one of the trials (Hughes 1992). We would like to acknowledge the peer review contribution from Mike Bennett, Luciana Ballini, Camilla Zimmermann, Álvaro Sanz, Andy Oxman, and Craig Ramsay; and Nia Roberts for conducting the electronic searches.
Version history
| Published | Title | Stage | Authors | Version |
| 2021 Mar 15 | Hospital at home: home‐based end‐of‐life care | Review | Sasha Shepperd, Daniela C Gonçalves-Bradley, Sharon E Straus, Bee Wee | |
| 2016 Feb 18 | Hospital at home: home‐based end‐of‐life care | Review | Sasha Shepperd, Daniela C. Gonçalves‐Bradley, Sharon E Straus, Bee Wee | |
| 2011 Jul 06 | Hospital at home: home‐based end of life care | Review | Sasha Shepperd, Bee Wee, Sharon E Straus | |
Differences between protocol and review
This review was originally part of a broader review evaluating the effectiveness of hospital at home services, first published in Issue 1, 1998 of the Cochrane Library (Shepperd 2005). As more data have become available, this broader review has been split into three: Hospital at home admission avoidance, Hospital at home early discharge, and Hospital at home: home‐based end‐of‐life care. The titles have been changed for consistency. Hospital at home admission avoidance, Shepperd 2008, and Hospital at home early discharge, Shepperd 2009, are published in the Cochrane Library.
We made a post‐hoc decision to adjust the data entered into the meta‐analysis using an estimate of the intracorrelation coefficient of 0.02, as the authors reported no confidence intervals (Jordhøy 2000). We included a new outcome (staff views on the provision of services). We updated the methods in this update to align with current Cochrane guidance, including the Methodological standards for the reporting of Cochrane Intervention Reviews (MECIR 2012).
Keywords
MeSH
Medical Subject Headings (MeSH) Keywords
Medical Subject Headings Check Words
Adult; Humans;
PICO

Study flow diagram.

Risk of bias graph: review authors' judgements about each risk of bias item presented as percentages across all included studies.

Risk of bias summary: review authors' judgements about each risk of bias item for each included study.

Comparison 1 Place of death, Outcome 1 Dying at home.
| Study | |
| Grande 2000 | T= 152/186 (82%), C= 34/44 (77%), P = 0.46 |
Comparison 1 Place of death, Outcome 2 Time spent at home in the last 2 weeks of life.

Comparison 1 Place of death, Outcome 3 Dying in hospital.
| Study | |
| Jordhøy 2000 | T= 19/235 (9%), C= 36/199 (21%), P = 0.01 |
Comparison 1 Place of death, Outcome 4 Dying in a nursing home.
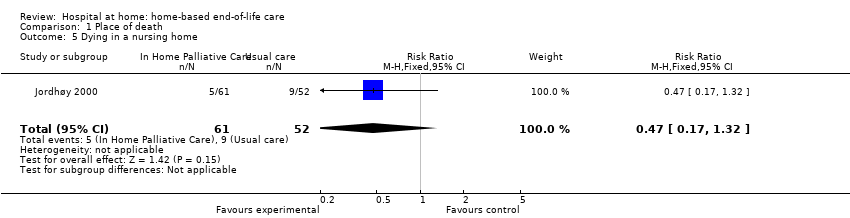
Comparison 1 Place of death, Outcome 5 Dying in a nursing home.

Comparison 2 Unplanned admissions, Outcome 1 Admitted to hospital.
| Study | Outcomes | Notes |
| Grande 2000 | Pain, mean SD T= 2.49 (0.92), C= 3.12 (1.05), P = 0.02 Nausea/vomiting, mean SD T= 1.91 (0.87), C= 2.47 (1.07), P = 0.06 Constipation, mean SD T= 2.32 (1.09), C= 2.50 (0.97), P = 0.51 Diarrhoea, mean SD T= 1.49 (0.88), C= 1.60 (0.98), P = 0.69 Breathlessness, mean SD T= 2.39 (1.17), C= 2.21 (1.19), P = 0.70 Anxiety, mean SD T= 2.45 (1.05), C= 2.50 (1.10), P = 0.10 Depression, mean SD T= 2.08 (0.97), C= 1.93 (1.14), P = 0.65 | 4‐point scale completed by the care giver. Lower score indicates less of a problem. |
Comparison 3 Control of symptoms, Outcome 1 Caregivers' ratings of symptoms.
| Study | Outcomes | Notes |
| Grande 2000 | Pain, mean SD T= 2.03 (0.73), C= 2.35 (0.95), P = 0.09 Nausea/vomiting, mean SD T= 1.78 (0.82), C= 2.00 (1.02), P = 0.28 Constipation, mean SD T= 1.81 (0.78), C= 1.97 (0.94), P = 0.45 Diarrhoea, mean SD T= 1.17 (0.49), C= 1.36 (0.73), P = 0.20 Breathlessness, mean SD T= 1.82 (1.01), C= 1.66 (0.93), P = 0.42 Anxiety, mean SD T= 2.10 (0.95), C= 2.50 (0.97), P = 0.05 Depression, mean SD T= 1.62 (0.76), C= 2.19 (1.08), P = 0.01 | Intention to treat 4‐point scale completed by the GP Lower score indicates less of a problem. No difference was detected for the ratings reported by district nurses and informal care givers |
Comparison 3 Control of symptoms, Outcome 2 GPs' ratings of symptoms.
| Study | Outcomes | Notes |
| Hughes 1992 | At 6 months, mean | High attrition in both groups due to death. The Barthel Self‐Care Index with modified scoring system was used. No P value given, insufficient data to calculate CI |
Comparison 4 Participant health outcomes, Outcome 1 Functional status.
| Study | Outcomes | Notes |
| Hughes 1992 | At 6 months, mean | High attrition in both groups due to death. Philadelphia Geriatric Morale Scale used (shortened version). No P value given, insufficient data to calculate CI |
Comparison 4 Participant health outcomes, Outcome 2 Psychological well‐being.
| Study | Outcomes | Notes |
| Hughes 1992 | At 6 months, mean | High attrition in both groups due to death. Short Portable Mental Status Questionnaire used (10 items). No P value given, insufficient data to calculate CI |
Comparison 4 Participant health outcomes, Outcome 3 Cognitive status.
| Study | Outcomes | Notes |
| Brumley 2007 | At 30 days OR = 3.37, 95% CI = 1.42‐8.10 (n=216) At 60 days OR= 1.79, 95% CI 0.65 to 4.96 (n=168) | Satisfaction measured by the Reid‐Gundlack Satisfaction with Service instrument |
| Hughes 1992 | At one month: P = .02 | 17 item questionnaire derived from the National Hospice Study No P value reported, insufficient data to calculate CI. |
Comparison 4 Participant health outcomes, Outcome 4 Patient satisfaction.
| Study | |
| Hughes 1992 | At 6 month, proportion (percentage) |
Comparison 4 Participant health outcomes, Outcome 5 Mortality.
| Study | |
| Brumley 2007 | Days, mean (SD) T= 196 (164), C= 242 (200), P = 0.03 |
| Grande 2000 | Treatment group (allocated and admitted to hospital at home): median 16 days |
| Jordhøy 2000 | Days, median (95% CI) T= 99 (79 to 119), C= 127 (88 to 166) |
Comparison 4 Participant health outcomes, Outcome 6 Survival time from referral to death.
| Study | Outcomes | Notes |
| Hughes 1992 | At 1 month: Carers in the treatment group reported a greater level of satisfaction | |
Comparison 5 Caregiver‐reported outcomes, Outcome 1 Caregiver satisfaction.
| Study | Outcomes | Notes |
| Brumley 2007 | Controlling for survival, age, severity of illness and primary disease, adjusted mean cost (SD) T= $12,670 ($12,523) C= $20,222 ($30,026) Average cost per day incurred by those on intervention arm ($95.30) was significantly lower than that of comparator group ($212.80) (t = ‐2.417; P = 0.02) | Service costs were calculated using actual costs for contracted medical services in Colorado and proxy cost estimates for all services provided within the HMO as services within the HMO are not billed separately. Costs were based on figures from 2002 Hospitalisation and emergency department cost estimates were calculated using aggregated data from more than 500,000 HMO patient records and include ancillary services such as laboratory and radiology. Costs of physician office visits included nurse and clerk expenses. Home health and palliative care visits were calculated using average time spent on each visit and multiplying that by the cost for each discipline’s reimbursement rate. Proxy costs generated for hospital days and emergency department visits were significantly lower than the actual costs received from contracted providers. Total cost variable was constructed by aggregating costs for physician visits, emergency department visits, hospital days, skilled nursing facility days and home health or palliative days accumulated from the point of study enrolment until the end of the study period or death |
| Hughes 1992 | 1986 prices (average costs) | |
Comparison 6 Resource use and cost, Outcome 1 Cost.
| Study | Outcomes | Notes |
| Grande 2000 | GP workload in penultimate week of life Evening home visits, mean (SD) Evening home visits, mean (SD) | |
| Hughes 1992 | VA services at 6 months | 95% CI not calculated as equal variances can not be assumed |
Comparison 6 Resource use and cost, Outcome 2 Health service use.
| Study | |
| Hughes 1992 | At 6 months T= 5.63 (10), C= 12.06 (15.2), mean difference 6.43 days (95% CI 2.55 to 10.3), P = 0.002 |
| Jordhøy 2000 | Nmber of inpatient days, mean (SD) T= 5.0 (17.3), C= 9.3 (31.4) |
Comparison 6 Resource use and cost, Outcome 3 Inpatient days.
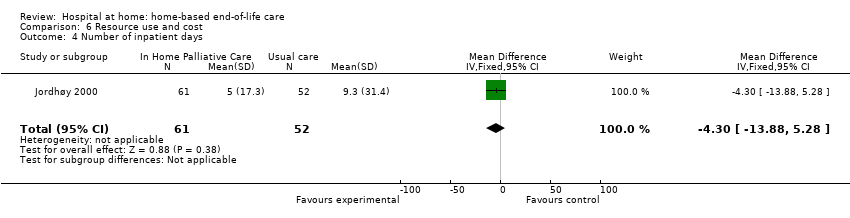
Comparison 6 Resource use and cost, Outcome 4 Number of inpatient days.
| Study | Outcomes | Notes |
| Grande 2000 | District nurse thought there should be additional help for the care giver, mean (SD) T= 1.81 (0.87) (n = 141), C= 1.36 (0.60) (n = 31), P = 0.005 District nurse thought there should be more help with night nursing T= 1.43 (0.64) (n = 143), C= 2.03 (0.84) (n = 33); P < 0.0001 | 3 point scale with lower scores indicating less of a problem A 3 point scale with lower scores indicating less of a problem |
Comparison 7 Staff views, Outcome 1 District nurse views.
| Participant outcomes for home‐based end‐of‐life care | ||||||
| Patient or population: terminally ill people Comparison: a combination of services that could include routine (not specialised) home care, acute inpatient care, primary care services, and hospice care | ||||||
| Outcomes | Illustrative comparative risks* (95% CI) | Relative effect | No of participants | Certainty of the evidence | Comments | |
| Assumed risk | Corresponding risk | |||||
| Control | Home‐based end‐of‐life care | |||||
| Place of death (home) | Study population | RR 1.33 | 652 | ⊕⊕⊕⊕ | In 1 trial, eligible participants were assigned treatment according to the district (cluster) in which they lived | |
| 444 per 1000 | 591 per 1000 | |||||
| Difference: 147 more (62 to 244 more) | ||||||
| Medium‐risk population | ||||||
| 510 per 1000 | 678 per 1000 | |||||
| Difference: 168 more (71 to 280 more) | ||||||
| Admission to hospital Follow‐up: 6 to 24 months | Estimates ranged from a relative increase in risk of admission to hospital of 2.61 to a relative reduction in risk of 0.62 | 823 (4 studies) | ⊕⊕⊕⊝ moderate1 | Data were not pooled due to the high degree of statistical heterogeneity for this outcome | ||
| Patient satisfaction Follow‐up: 1 to 6 months | A small increase in satisfaction for those receiving end‐of‐life care at home reported at 1 month, and reduced at 6 months | 199 (2 studies) | ⊕⊕⊝⊝2 low | Satisfaction measured using questions derived from the US National Hospice Study and the Reid‐Gundlach Satisfaction with Services instrument (minimum low score 1, high score 5) | ||
| Caregiver burden Follow‐up 6 months | One study demonstrated a reduction in psychological well‐being for caregivers of participants who had survived more than 30 days, and a second study reported little or no difference in caregiver response to bereavement | 155 (2 studies) | ⊕⊕⊝⊝2 low | Measured by the Philadelphia Geriatric Center Morale Scale and the Texas Revised Inventory of Grief | ||
| Health service cost | A reduction in total health service cost was reported for those participants receiving end‐of‐life care at home (range from a 18% to 30% reduction) | 2 studies | ⊕⊕⊝⊝3 low | |||
| *The basis for the assumed risk (e.g. the median control group risk across studies) is provided in footnotes. The corresponding risk (and its 95% confidence interval) is based on the assumed risk in the comparison group and the relative effect of the intervention (and its 95% CI). | ||||||
| GRADE Working Group grades of evidence | ||||||
| 1We downgraded the certainty of the evidence due to inconsistency of findings among studies. 2We downgraded the certainty of the evidence as different measures were used, and only two out of the four included studies reported data for these outcomes. 3We downgraded the certainty of evidence due to inconsistency of findings among studies, studies reporting different healthcare resources, and only two out of four included studies reporting data for this outcome. | ||||||
| Outcome or subgroup title | No. of studies | No. of participants | Statistical method | Effect size |
| 1 Dying at home Show forest plot | 3 | 652 | Risk Ratio (M‐H, Fixed, 95% CI) | 1.33 [1.14, 1.55] |
| 2 Time spent at home in the last 2 weeks of life Show forest plot | Other data | No numeric data | ||
| 3 Dying in hospital Show forest plot | 1 | 113 | Risk Ratio (M‐H, Fixed, 95% CI) | 1.12 [0.82, 1.52] |
| 4 Dying in a nursing home Show forest plot | Other data | No numeric data | ||
| 5 Dying in a nursing home Show forest plot | 1 | 113 | Risk Ratio (M‐H, Fixed, 95% CI) | 0.47 [0.17, 1.32] |
| Outcome or subgroup title | No. of studies | No. of participants | Statistical method | Effect size |
| 1 Admitted to hospital Show forest plot | 4 | 823 | Risk Ratio (M‐H, Fixed, 95% CI) | 0.93 [0.82, 1.05] |
| Outcome or subgroup title | No. of studies | No. of participants | Statistical method | Effect size |
| 1 Caregivers' ratings of symptoms Show forest plot | Other data | No numeric data | ||
| 2 GPs' ratings of symptoms Show forest plot | Other data | No numeric data | ||
| Outcome or subgroup title | No. of studies | No. of participants | Statistical method | Effect size |
| 1 Functional status Show forest plot | Other data | No numeric data | ||
| 2 Psychological well‐being Show forest plot | Other data | No numeric data | ||
| 3 Cognitive status Show forest plot | Other data | No numeric data | ||
| 4 Patient satisfaction Show forest plot | Other data | No numeric data | ||
| 5 Mortality Show forest plot | Other data | No numeric data | ||
| 6 Survival time from referral to death Show forest plot | Other data | No numeric data | ||
| Outcome or subgroup title | No. of studies | No. of participants | Statistical method | Effect size |
| 1 Caregiver satisfaction Show forest plot | Other data | No numeric data | ||
| Outcome or subgroup title | No. of studies | No. of participants | Statistical method | Effect size |
| 1 Cost Show forest plot | Other data | No numeric data | ||
| 2 Health service use Show forest plot | Other data | No numeric data | ||
| 3 Inpatient days Show forest plot | Other data | No numeric data | ||
| 4 Number of inpatient days Show forest plot | 1 | 113 | Mean Difference (IV, Fixed, 95% CI) | ‐4.30 [‐13.88, 5.28] |
| Outcome or subgroup title | No. of studies | No. of participants | Statistical method | Effect size |
| 1 District nurse views Show forest plot | Other data | No numeric data | ||