Krankenhaus zu Hause: medizinische Betreuung am Lebensende im eigenen Zuhause
Abstract
Background
The policy in a number of countries is to provide people with a terminal illness the choice of dying at home. This policy is supported by surveys indicating that the general public and people with a terminal illness would prefer to receive end‐of‐life care at home. This is the fourth update of the original review.
Objectives
To determine if providing home‐based end‐of‐life care reduces the likelihood of dying in hospital and what effect this has on patients' symptoms, quality of life, health service costs, and caregivers, compared with inpatient hospital or hospice care.
Search methods
We searched the following databases until April 2015: Cochrane Central Register of Controlled Trials (CENTRAL) (the Cochrane Library), Ovid MEDLINE(R) (from 1950), EMBASE (from 1980), CINAHL (from 1982), and EconLit (from 1969). We checked the reference lists of potentially relevant articles identified and handsearched palliative care publications, clinical trials registries, and a database of systematic reviews for related trials (PDQ‐Evidence 2015).
Selection criteria
Randomised controlled trials, interrupted time series, or controlled before and after studies evaluating the effectiveness of home‐based end‐of‐life care with inpatient hospital or hospice care for people aged 18 years and older.
Data collection and analysis
Two review authors independently extracted data and assessed study quality. We combined the published data for dichotomous outcomes using fixed‐effect Mantel‐Haenszel meta‐analysis. When combining outcome data was not possible, we reported the results from individual studies.
Main results
We included four trials in this review and did not identify new studies from the search in April 2015. Home‐based end‐of‐life care increased the likelihood of dying at home compared with usual care (risk ratio (RR) 1.33, 95% confidence interval (CI) 1.14 to 1.55, P = 0.0002; Chi2 = 1.72, df = 2, P = 0.42, I2 = 0%; 3 trials; N = 652; high quality evidence). Admission to hospital while receiving home‐based end‐of‐life care varied between trials, and this was reflected by a high level of statistical heterogeneity in this analysis (range RR 0.62 to RR 2.61; 4 trials; N = 823; moderate quality evidence). Home‐based end‐of‐life care may slightly improve patient satisfaction at one‐month follow‐up and reduce it at six‐month follow‐up (2 trials; low quality evidence). The effect on caregivers is uncertain (2 trials; low quality evidence). The intervention may slightly reduce healthcare costs (2 trials, low quality evidence). No trial reported costs to patients and caregivers.
Authors' conclusions
The evidence included in this review supports the use of home‐based end‐of‐life care programmes for increasing the number of people who will die at home, although the numbers of people admitted to hospital while receiving end‐of‐life care should be monitored. Future research should systematically assess the impact of home‐based end‐of‐life care on caregivers.
PICO
Laienverständliche Zusammenfassung
Sterbebegleitung zu Hause
Hintergrund
Einige Länder haben in Gesundheitsleistungen investiert, die für Menschen mit unheilbaren Krankheiten, die in ihrem Zuhause sterben möchten, eine medizinische Versorgung zu Hause ermöglichen. Dies scheint von der Allgemeinheit und von unheilbar Kranken unterstützt zu werden: die meisten Menschen geben an, dass sie eine Sterbebegleitung zu Hause vorziehen würden.
Zielsetzungen
Wir führten eine systematische Literaturrecherche durch um festzustellen, ob durch Sterbebegleitung zu Hause die Wahrscheinlichkeit, im Krankenhaus zu sterben, gesenkt wird und wie sich diese Möglichkeit auf die Zufriedenheit der Patienten und medizinischen Betreuer sowie auf die Kosten auswirkt im Vergleich zur Versorgung im Krankenhaus oder in einem Hospiz. Hierbei handelt es sich um die vierte Aktualisierung des ursprünglichen Reviews.
Studienmerkmale
Für diese Aktualisierung wurde eine Literaturrecherche bis April 2015 durchgeführt, bei der keine neuen Studien gefunden wurden. Bei den vorhergehenden Aktualisierungen wurden vier Studien gefunden.
Hauptergebnisse
In den Review wurden vier Studien eingeschlossen, aus denen hervorgeht, dass Menschen, die Sterbebegleitung zu Hause erhalten, mit höherer Wahrscheinlichkeit zu Hause sterben. Es ist unklar, ob die Wahrscheinlichkeit einer Krankenhauseinweisung durch Sterbebegleitung zu Hause steigt oder sinkt. Die Zahl der Krankenhauseinweisungen während einer Versorgung zu Hause am Lebensende war in den einzelnen Studien unterschiedlich. Menschen, die an ihrem Lebensende zu Hause medizinisch versorgt werden, sind nach einem Monat minimal zufriedener und nach sechs Monaten weniger zufrieden. Es ist nicht eindeutig, ob die Belastung für den medizinischen Betreuer durch Sterbebegleitung zu Hause sinkt oder steigt. Zu den Kosten für das Gesundheitssystem gibt es keine klaren Aussagen und die Kosten für die Teilnehmer und deren Familien waren nicht angegeben.
Schlussfolgerungen der Autoren
Menschen, die an ihrem Lebensende zu Hause versorgt werden, sterben mit höherer Wahrscheinlichkeit auch zu Hause. Es lagen nur wenige Daten zu den Auswirkungen von Sterbebegleitungsleistungen zu Hause auf Familienmitglieder und Laien‐Pflegekräfte vor.
Authors' conclusions
Summary of findings
| Participant outcomes for home‐based end‐of‐life care | ||||||
| Patient or population: terminally ill people Comparison: a combination of services that could include routine (not specialised) home care, acute inpatient care, primary care services, and hospice care | ||||||
| Outcomes | Illustrative comparative risks* (95% CI) | Relative effect | No of participants | Certainty of the evidence | Comments | |
| Assumed risk | Corresponding risk | |||||
| Control | Home‐based end‐of‐life care | |||||
| Place of death (home) | Study population | RR 1.33 | 652 | ⊕⊕⊕⊕ | In 1 trial, eligible participants were assigned treatment according to the district (cluster) in which they lived | |
| 444 per 1000 | 591 per 1000 | |||||
| Difference: 147 more (62 to 244 more) | ||||||
| Medium‐risk population | ||||||
| 510 per 1000 | 678 per 1000 | |||||
| Difference: 168 more (71 to 280 more) | ||||||
| Admission to hospital Follow‐up: 6 to 24 months | Estimates ranged from a relative increase in risk of admission to hospital of 2.61 to a relative reduction in risk of 0.62 | 823 (4 studies) | ⊕⊕⊕⊝ moderate1 | Data were not pooled due to the high degree of statistical heterogeneity for this outcome | ||
| Patient satisfaction Follow‐up: 1 to 6 months | A small increase in satisfaction for those receiving end‐of‐life care at home reported at 1 month, and reduced at 6 months | 199 (2 studies) | ⊕⊕⊝⊝2 low | Satisfaction measured using questions derived from the US National Hospice Study and the Reid‐Gundlach Satisfaction with Services instrument (minimum low score 1, high score 5) | ||
| Caregiver burden Follow‐up 6 months | One study demonstrated a reduction in psychological well‐being for caregivers of participants who had survived more than 30 days, and a second study reported little or no difference in caregiver response to bereavement | 155 (2 studies) | ⊕⊕⊝⊝2 low | Measured by the Philadelphia Geriatric Center Morale Scale and the Texas Revised Inventory of Grief | ||
| Health service cost | A reduction in total health service cost was reported for those participants receiving end‐of‐life care at home (range from a 18% to 30% reduction) | 2 studies | ⊕⊕⊝⊝3 low | |||
| *The basis for the assumed risk (e.g. the median control group risk across studies) is provided in footnotes. The corresponding risk (and its 95% confidence interval) is based on the assumed risk in the comparison group and the relative effect of the intervention (and its 95% CI). | ||||||
| GRADE Working Group grades of evidence | ||||||
| 1We downgraded the certainty of the evidence due to inconsistency of findings among studies. 2We downgraded the certainty of the evidence as different measures were used, and only two out of the four included studies reported data for these outcomes. 3We downgraded the certainty of evidence due to inconsistency of findings among studies, studies reporting different healthcare resources, and only two out of four included studies reporting data for this outcome. | ||||||
Background
Description of the condition
Surveys of the preferences of the general public and terminally ill people report a growing consensus that, given adequate support, most people would prefer to receive end‐of‐life care at home (Department of Health 2008; Gomes 2012; Higginson 2000). The preference of patients who do not have caregivers is less clear. While a policy supporting choice is broadly endorsed (Agelopoulos 2009; Department of Health 2008), it brings with it conceptual and methodological difficulties for those evaluating the effectiveness of these types of services, and further challenges to those responsible for implementing these interventions, due to patient and caregiver preference changing over time.
Description of the intervention
End‐of‐life care at home is the provision of a service that provides active treatment for continuous periods of time by healthcare professionals in the patient's home for patients who would otherwise require hospital or hospice inpatient end‐of‐life care.
How the intervention might work
The rationale for providing end‐of‐life care at home is complex as it reflects the policy objective of providing patients and their families with a choice of where and when they want care. One difficulty underpinning the concept of choice in this context is that while more people want to die at home, they also recognise the practical and emotional difficulties of exercising this choice. For example, terminally ill people express concern about being a 'burden' to family and friends and worry about their families seeing them in distress or having to get involved with intimate aspects of care (Gott 2004). Similarly, although caregivers of terminally ill people often prefer to care for their relatives at home (Woodman 2015), continuity of care may be difficult to achieve, and yet is essential to fulfil the choice of dying at home (Seamark 2014).
Why it is important to do this review
In some countries, namely the US and Canada, the number of people dying at home has increased (Decker 2006; Wilson 2009), whereas in others, for example Italy and Japan, it has decreased. A retrospective cohort study of Taiwanese patients who died of cancer reported a decrease in the proportion of patients dying at home from 36% to 32%, due to access to treatments that were only available in hospital palliative‐care settings (Tang 2010). Although recent data indicate a small increase in the number of people who have died at home in the UK, it was estimated that in 2008 18% of deaths were at home and 58% were in hospitals (Department of Health 2008), and in 2013 22% of people died at home, 22% died in care homes, 6% in hospices, and 48% in hospital (NEoLCIN 2014). The reduction in the proportion of people dying in hospital could be attributed, at least in part, to the improvements in care and services as a result of the 2008 National End of Life Care Strategy (Department of Health 2008). Explanations for the large proportion of people still dying in hospital include poorly co‐ordinated services with variable provision, making it difficult for people to be transferred between settings (National Audit Office 2008). Improved collaboration between health and social care, and acute and community services, could improve the quality of care, reduce emergency admissions, and allow more people to die in the place of their choosing (National Audit Office 2008). Importantly, although between 30% and 90% of people die in their preferred death place, the likelihood of doing so decreases if they had chosen home (Bell 2010). This is the fourth update of the original review.
Objectives
To determine if providing home‐based end‐of‐life care reduces the likelihood of dying in hospital and what effect this has on patients' symptoms, quality of life, health service costs, and caregivers compared with inpatient hospital or hospice care. We addressed the following questions:
-
Are people who receive end‐of‐life care at home more likely to die at home than those who are allocated to inpatient hospital or hospice care?
-
Do people receiving end‐of‐life care at home have an increased risk of unplanned or precipitous admission to hospital?
-
Do people who receive end‐of‐life care at home have better symptom control than those who are allocated to inpatient hospital or hospice care?
-
Does patient and caregiver satisfaction differ between end‐of‐life care at home and inpatient hospital care?
-
Does providing end‐of‐life care at home alter the costs to health services?
Methods
Criteria for considering studies for this review
Types of studies
We included the following types of studies:
-
Randomised controlled trials
-
Interrupted time series
-
Controlled before and after studies
The inclusion of study designs other than randomised controlled trials is supported by the small number of randomised trials conducted within this research topic, which in turn is explained by obstacles to recruitment and high attrition, amongst other factors (Higginson 2013). We excluded controlled before and after studies with fewer than two intervention sites and two control sites. We also excluded interrupted time series without a clearly defined point in time when the intervention occurred and at least three data points before and three after the intervention.
Types of participants
We included evaluations of end‐of‐life care at home for people, aged 18 years and over, who are at the end of life and require terminal care.
Types of interventions
We included studies comparing end‐of‐life care at home with inpatient hospital or hospice care. The end‐of‐life care at home (which may be referred to as terminal care at home, hospital at home, or hospice at home) studies could include people referred directly from the community who therefore have no physical contact with the hospital, or those referred from the emergency room or hospital inpatient services. We used the following definition to determine if studies should be included in the review: end‐of‐life care at home is a service that provides active treatment for continuous periods of time by healthcare professionals in the patient's home for patients who would otherwise require hospital or hospice inpatient end‐of‐life care.
Types of outcome measures
Main outcomes
-
Place of death
-
Unplanned/precipitous admission to or discharge from hospital
Other outcomes
-
Control of symptoms (pain, breathlessness, nausea and vomiting, constipation, terminal agitation)
-
Delay in care (medical, nursing, or domiciliary care) from point of referral to intervention (end‐of‐life home care/hospice at home or inpatient care)
-
Participant health outcomes, including patient‐reported outcomes such as functional status and patient satisfaction
-
Family‐ or caregiver‐reported symptoms, including stress and anxiety
-
Family or caregiver unable to continue caring
-
Participant's preferred place of death
-
Health service use, including system and caregiver costs
Search methods for identification of studies
Electronic searches
We searched the following databases until April 2015: the Cochrane Central Register of Controlled Trials (CENTRAL) (the Cochrane Library), Ovid MEDLINE(R) (from 1950), EMBASE (from 1980), CINAHL (from 1982), and EconLit (from 1969). We have provided full details of the search terms used in Appendix 1.
Searching other resources
We checked the reference lists of articles identified electronically for evaluations of end‐of‐life home‐based care and obtained potentially relevant articles. We searched clinical trials registries ClinicalTrials.gov and the World Health Organization International Clinical Trials Registry Platform (http://www.who.int/ictrp/en/) for potentially relevant ongoing trials under the headings 'palliative care' and 'hospital at home', respectively. We searched the online database PDQ‐Evidence to identify other systematic reviews and their primary studies. We handsearched palliative care journals indexed by ISI Web of Science for online first references and current issues (American Journal of Hospice and Palliative Medicine; BMC Palliative Care; BMJ Supportive & Palliative Care; Journal of Palliative Medicine; Palliative Medicine; Palliative & Supportive Care). We sought unpublished studies by contacting providers and researchers known to be involved in this field. We developed a list of contacts using the existing literature and following discussion with researchers in the area.
Data collection and analysis
Selection of studies
One review author (DCGB or SS) read all the abstracts in the records retrieved by the electronic searches in order to identify publications that appeared to be eligible for this review, screened the relevant trials retrieved by the clinical trials registry as well as the identified systematic review, and handsearched relevant publications in palliative care. Two review authors (DCGB and SS) independently read the publications that appeared to be eligible and selected studies for the review according to the prespecified inclusion criteria. We resolved any disagreements by discussion.
Data extraction and management
For the previous updates, two review authors (SS and BW or SS and SES) completed data extraction independently using a checklist developed by Effective Practice and Organisation of Care (EPOC), modified and amended for the purposes of this review (EPOC 2010). The current update did not identify any new trials.
Assessment of risk of bias in included studies
Two review authors (SS and BW or SS and SES) independently assessed risk of bias in included studies using the Cochrane 'Risk of bias' criteria (Higgins 2011).
Unit of analysis issues
The study by Jordhøy 2000 was a cluster‐randomised trial; this was taken into account in the published analysis for some of the outcomes by testing the significance of differences between treatment groups using bootstrap estimation to fit regression models, allowing for clustering (Jordhøy 2000). For the outcomes place of death and admission to hospital, Jordhøy 2000 reported no confidence intervals, therefore we adjusted the data entered into the meta‐analysis using an estimate of the intra‐correlation coefficient (ICC) of 0.02; we obtained this from the Aberdeen database of ICCs (http://www.abdn.ac.uk/hsru/research/research‐tools/study‐design). This was a post‐hoc decision. We contacted the authors of this study for an estimate of the ICC but have not received the data.
Assessment of heterogeneity
We quantified heterogeneity using Cochrane's Q and the I2 statistic, the latter quantifying the percentage of the total variation across studies that is due to heterogeneity rather than chance (Cochrane 1954; Higgins 2003); smaller percentages suggest less observed heterogeneity. Statistical significance throughout was taken at the two‐sided 5% level (P < 0.05) and data were presented as the estimated effect with 95% confidence intervals. When combining outcome data was not possible because of differences in the reporting of outcomes, we reported the findings of the individual studies.
Data synthesis
We combined the published data for dichotomous outcomes using fixed‐effect Mantel‐Haenszel meta‐analysis (Bradburn 2007). The pooled effect is expressed as a risk ratio for end‐of‐life home‐based care compared with usual hospital care; values greater than 1 indicate outcomes favouring end‐of‐life care at home, and less than 1 for other outcomes.
We created a summary of findings table using the following outcomes: place of death; hospital admission; patient satisfaction; and caregivers outcomes. We used the five GRADE considerations (study limitations, consistency of effect, imprecision, indirectness, and risk of bias) to assess the certainty of the evidence as it relates to the main outcomes (Guyatt 2008). We used methods and recommendations described in Section 8.5 and Chapter 12 of the Cochrane Handbook for Systematic Reviews of Interventions (Higgins 2011). We justified all decisions to down‐ or up‐grade the certainty of evidence using footnotes to aid readers' understanding of the review where necessary.
Subgroup analysis and investigation of heterogeneity
We did not plan a priori subgroup analysis and did not perform post hoc subgroup analysis.
Sensitivity analysis
We did not plan a priori sensitivity analysis and did not perform post hoc sensitivity analysis.
Results
Description of studies
Results of the search
For this update, we retrieved 2344 references, from which we identified 11 potentially relevant references. Full‐text assessment indicated that nine studies did not fulfil the inclusion criteria, and we excluded those references. The main reason for exclusion was that the intervention was not home‐based end‐of‐life care. The other two references are one ongoing trial (NCT01885637), and one trial that is currently awaiting classification (NTR2817). We did not identify any new studies (Figure 1).
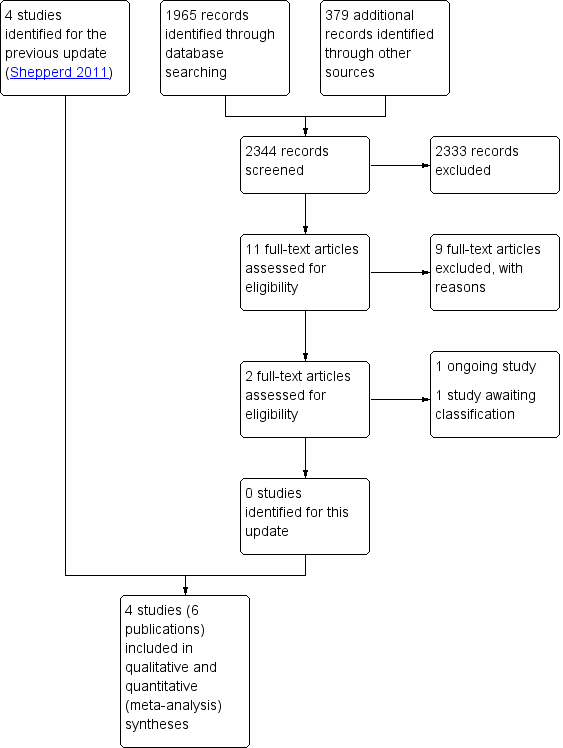
Study flow diagram.
Included studies
We identified four published trials (six publications), three trials where the participant was randomised and one cluster‐randomised trial, for inclusion in this review (Brumley 2007; Grande 2000; Hughes 1992; Jordhøy 2000). Two of the randomised controlled trials were conducted in the US (Brumley 2007; Hughes 1992), one in Norway (Jordhøy 2000), and one in the UK (Grande 2000).
The mean age of participants ranged from 63 years to 74 years, with similar proportions of male and female participants. Between 17% and 36% of participants lived alone (Brumley 2007; Grande 2000; Jordhøy 2000). The diagnosis of trial participants varied. In one trial, conducted in the US, 21% of participants had a diagnosis of late‐stage chronic obstructive pulmonary disease, 33% of heart failure, and 47% of cancer, with an estimated life expectancy of 12 months or less (Brumley 2007). The most common diagnosis in the second trial conducted in the US was cancer, with 73% in the intervention group and 80% in the control group having this diagnosis (Hughes 1992). In Grande 2000, conducted in the UK, 86% of participants had a diagnosis of cancer, and the survival from referral was a median of 11 days. The Jordhøy 2000 trial, conducted in Norway, recruited participants with incurable malignant diseases, excluding those with haematological malignant disease other than lymphoma.
The intervention in three trials was multidisciplinary care, which included specialist palliative‐care nurses, family physicians, palliative‐care consultants, physiotherapists, occupational therapists, nutritionists, and social care workers (Brumley 2007; Hughes 1992; Jordhøy 2000). In one trial the focus of the intervention was on nursing care, which was only available for the last two weeks of life (Grande 2000). In three trials, nursing care was available for 24 hours if required; in the trial conducted in Norway the smallest urban district did not have access to 24‐hour care. The intervention evaluated by Jordhøy 2000 was hospital‐based at the Palliative Medicine Unit, which provided community outreach. The intervention had four components:
-
all inpatient and outpatient hospital services were provided at the Palliative Medicine Unit unless care was required elsewhere for medical reasons;
-
the Palliative Medicine Unit served as a link to the community services, and the palliative‐care physician and community nurse were defined as the main caregivers;
-
predefined guidelines were used to keep optimal interaction between services; and
-
community professionals were offered an educational programme that included bedside training and six to 12 hours of lectures every six months. The lectures addressed the most frequent symptoms and difficulties in palliative care.
Follow‐up consultations were with the community staff. In one trial, the intervention group had access to input available to the control group (that is care was supplemented by general practitioner and other community care when less than 24‐hour hospital at home input was provided) (Grande 2000).
Participants received end‐of‐life care at home for a maximum of 14 days in the trial by Grande 2000 and for an average of 68 days in the trial by Hughes 1992. The other two trials did not report duration of care (Brumley 2007; Jordhøy 2000); although survival time was reported, it was not possible to link survival time to duration of the intervention as participants moved between care settings.
Two trials described an educational component. In one, this was for the participants and their families and included identifying goals of care and the expected course of the disease and outcomes, as well as the likelihood of success of various treatments (Brumley 2007). In the other trial, an educational programme was provided for community staff (Jordhøy 2000). In two trials, the service was co‐ordinated by a nurse (Grande 2000; Jordhøy 2000); one was physician‐led (Hughes 1992), and in one a core team of physician, specialist nurse, and social worker managed care across settings and provided assessment, evaluation, planning, care delivery, follow‐up, monitoring, and continuous reassessment of care (Brumley 2007).
The care that the control group received varied across trials and thus reflected differences in health systems and the way that standard care is delivered. In two trials, this was described as including home care (though not specialised end‐of‐life care), acute inpatient care, primary care services, and inpatient hospice care (Brumley 2007; Grande 2000). In one trial, the control group received inpatient care at a Veterans Administration (VA) hospital (Hughes 1992), and in another trial conventional care was shared among the hospital departments and the community, with no well‐defined practice (Jordhøy 2000) (see Characteristics of included studies).
Excluded studies
We excluded nine trials, five of which reported an intervention that did not provide home‐based end‐of‐life care or was not an alternative to inpatient hospital or hospice care (Brännström 2014; Brumley 2003; Holdsworth 2015; Hughes 1990; Hughes 2000), and three that did not fulfil the criterion for study design (Enguidanos 2005; McCusker 1987; McWhinney 1994). For one of the trials, we could not locate outcome data or details of the control group, as this information was only reported as an abstract; we contacted the authors for these details but did not receive a reply (Stern 2006) (see Characteristics of excluded studies).
Risk of bias in included studies
Allocation
Two trials clearly described the method of randomisation and allocation (Brumley 2007; Grande 2000).
Blinding
Blinding was not possible in any of the trials.
Incomplete outcome data
No trials reported loss of follow‐up data for place of death; there was up to 25% loss to follow‐up in trials assessing patient satisfaction.
Selective reporting
There was no evidence of selective reporting of outcome data in three of the trials (Grande 2000; Hughes 1992; Jordhøy 2000).
Other potential sources of bias
All four trials collected baseline data (Figure 2 and Figure 3).
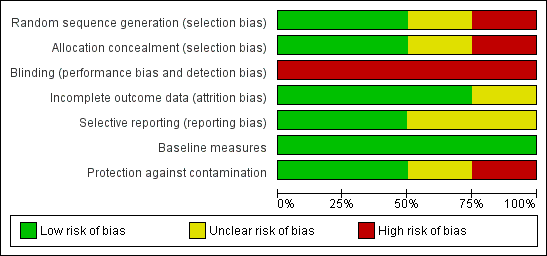
Risk of bias graph: review authors' judgements about each risk of bias item presented as percentages across all included studies.
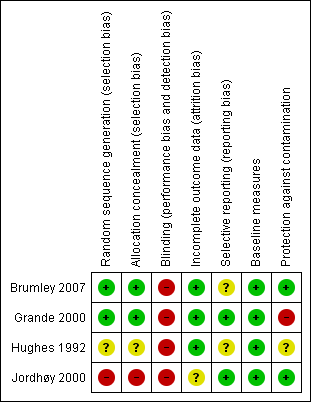
Risk of bias summary: review authors' judgements about each risk of bias item for each included study.
Effects of interventions
See: Summary of findings for the main comparison Summary of findings table for main outcomes
Place of death
We were able to combine data from three trials to assess the effectiveness of end‐of‐life home‐based care on dying at home. We found that home‐based end‐of‐life care increased the likelihood of dying at home compared with usual care, which included hospice care, inpatient care, and routinely available primary healthcare (risk ratio (RR) 1.33, 95% confidence interval (CI) 1.14 to 1.55, P = 0.0002; Chi2 = 1.72, df = 2, P = 0.42, I2 = 0%; 3 trials; N = 652; high quality evidence; Analysis 1.1). In one of the trials, 61% (n = 113/186) of participants allocated to end‐of‐life home‐based care actually received this form of care (Grande 2000); and 152/186 (82%) in the end‐of‐life home care group spent time at home in the last two weeks of life, compared with 34/44 (77%) in the usual care group (Analysis 1.2). One trial reported data on numbers dying in hospital (RR 1.12, 95% CI 0.82 to 1.52, P = 0.49; Analysis 1.3) and in a nursing home (RR 0.47, 95% CI 0.17 to 1.32, P = 0.15; Analysis 1.4; Analysis 1.5) (Jordhøy 2000).
Unplanned/precipitous admission to or discharge from hospital
Four trials assessed the effectiveness of end‐of‐life home‐based care on this outcome. We initially combined data from all four trials for this outcome (RR 0.93, 95% CI 0.82 to 1.05; Analysis 2.1); however, due to a high level of statistical heterogeneity (Chi2 = 25.63, df = 3, P < 0.0001, I2 = 88%), we have not retained this analysis. The RR ranged from RR 0.62 to RR 2.61 (4 trials; N = 823; moderate quality evidence).
Control of symptoms
One trial reported on control of symptoms. Grande 2000 obtained participant outcome data from general practitioners, district nurses, and informal caregivers, as previous attempts to obtain data directly from participants proved unsuccessful (Analysis 3.1; Analysis 3.2). Outcomes focused on the need for additional support with care and symptoms (pain, nausea/vomiting, constipation, diarrhoea, breathlessness, anxiety and depression), and assessments varied by assessor. For example, there was a small difference in caregivers' assessment of pain control (mean difference (MD) ‐0.48 points on a 4‐point scale, 95% CI ‐0.93 to ‐0.03), whereas general practitioners reported little or no difference (MD ‐0.32, 95% CI ‐0.68 to 0.04) (low quality evidence). The assessments of depression and anxiety also differed between general practitioners (depression MD on a 4‐point scale ‐0.6, 95% CI ‐0.90 to ‐0.20; anxiety MD on a 4‐point scale ‐0.40, 95% CI ‐0.80 to ‐0.02) and caregivers (depression MD 0.15, 95% CI ‐0.41 to 0.71; anxiety MD ‐0.05, 95% CI ‐0.62 to 0.52) (low quality evidence) (Grande 2000).
Delay in care
None of the studies reported on delay in care.
Participant health outcomes
Participant health outcomes included patient‐reported outcomes, such as functional status and well‐being; patient satisfaction; and mortality. Home‐based end‐of‐life care may make little difference to functional status (measured by the Barthel Index), psychological well‐being, or cognitive status (1 trial; N = 168; low quality evidence; Analysis 4.1, Analysis 4.2, Analysis 4.3) (Hughes 1992). Home‐based end‐of‐life care may slightly increase patient satisfaction (2 trials; low quality evidence; Analysis 4.4). Participants receiving end‐of‐life home‐based care reported greater satisfaction than those in the hospital group at one‐month follow‐up (Hughes 1992). This difference disappeared at six‐months follow‐up, which may reflect a reduced sample size due to the death of a number of these participants. Brumley 2007 reports similar findings, with greater satisfaction reported by those receiving end‐of‐life home‐based care at 30 days (odds ratio (OR) 3.37, 95% CI 1.42 to 8.10) and greater uncertainty at 60 days (OR 1.79, 95% CI 0.65 to 4.96) (Brumley 2007). It is unclear whether end‐of‐life home‐based care has an effect on six‐month mortality (MD 1.4, 95% CI ‐10.9 to 13.7; Analysis 4.5) (Hughes 1992). Home‐based end‐of‐life care may make little to no difference for survival time from referral (Analysis 4.6) (Brumley 2007; Grande 2000; Jordhøy 2000).
Caregiver‐reported outcomes
Two trials reported on caregiver outcomes (Grande 2004; Hughes 1992). In one trial caregivers of participants receiving end‐of‐life home‐based care reported higher satisfaction compared with caregivers in the control group at one‐month follow‐up (Analysis 5.1) (Hughes 1992). This difference disappeared at six months, which may reflect a reduced sample size. At six‐months follow‐up, caregivers of participants in the end‐of‐life home‐based care group who had survived more than 30 days reported a decrease in psychological well‐being compared with caregivers looking after participants in the control group (measured by the Philadelphia Geriatric Center Morale Scale). Grande 2004 found end‐of‐life care at home may make little or no difference for caregiver bereavement response six months following death (low quality evidence) (measured by the Texas Revised Inventory of Grief) (end‐of‐life care at home: mean 46.5 (standard deviation (SD) 12.9), control mean 46.8 (SD 11.8)). We are uncertain whether home‐based end‐of‐life care improves caregiver outcomes (2 trials; low quality evidence).
Family or caregiver unable to continue caring
No study reported on the caregiver's inability to continue caring.
Participant’s preferred place of death
No study reported on participant's preferred place of death.
Cost and use of other health services
Trials reported data for healthcare costs (Brumley 2007; Hughes 1992), health service use (Grande 2000; Hughes 1992), inpatient days (Hughes 1992; Jordhøy 2000), and number of inpatient days (Jordhøy 2000). Home‐based end‐of‐life care may slightly reduce healthcare cost (2 trials; low quality evidence; Analysis 6.1). One study reported total costs including VA hospital, private hospital, nursing home, outpatient clinic, home care, and community nursing (Hughes 1992); a second study reported costs including emergency department visits, physician office visits, hospital days, skilled nursing days, home health and palliative visits (including physician visits), and days in hospice (Brumley 2007). Hughes 1992 reported lower healthcare costs for those receiving end‐of‐life home care (mean cost USD 3479 versus mean cost USD 4248, P > 0.05); Brumley 2007 reported that the average cost per day incurred by those receiving end‐of‐life home‐based care was lower than for those receiving standard care (MD ‐117.50, P = 0.02), and that the overall mean cost (adjusted for survival, age, and severity of illness) to the health service was USD 12,670 (SD USD 12,523) compared with USD 20,222 (SD USD 30,026) for usual care. None of the studies reported costs incurred by the participants or the caregivers.
Hughes 1992 reported data on the use of healthcare services. Those receiving end‐of‐life home‐based care made fewer visits to outpatient clinics (difference 1.86, 95% CI ‐3.2 to ‐0.53, P = 0.01; Analysis 6.2), and the use of VA hospital beds was lower for participants allocated to end‐of‐life home‐based care compared with those allocated to hospital care (MD ‐5.9 days, 95% CI 0.78 to 11.00) (Hughes 1992). Jordhøy 2000 reported a small reduction in the number of inpatient days for participants receiving end‐of‐life home‐based care (MD ‐4.30, 95% CI ‐13.88 to 5.28) (Analysis 6.3; Analysis 6.4).
Staff views on the provision of services
Grande 2000 reported the views of general practitioners, district nurses, and informal caregivers in terms of the provision of services. District nurses reported that there should have been additional help for the caregivers looking after the participants (difference 0.45 on a 3‐point scale with lower scores indicating less of a problem, 95% CI 0.12 to 0.77), and that there should have been additional help with night nursing (difference ‐0.60 on a 3‐point scale with lower scores indicating less of a problem, 95% CI ‐0.86 to ‐0.34); this was an on‐treatment analysis (Analysis 7.1).
Discussion
Despite the widespread support for models of care that better serve the needs of patients at the end of their life, there is limited evidence supporting the effectiveness of home‐based end‐of‐life care. This is not surprising given the difficulties in conducting research in this area.
Summary of main results
Those participants receiving home‐based end‐of‐life care were more likely to die at home compared with those receiving usual care (high quality evidence); there was substantial variability among studies in admission to hospital during follow‐up (moderate quality evidence). The point in a participant's illness that end‐of‐life care at home was provided also varied between trials, as did the duration of care. For example, in one trial, median survival from recruitment was 11 days (Grande 2000), and in another it was 196 days (Brumley 2007). There was also considerable heterogeneity between trials regarding hospital admission while receiving home‐based end‐of‐life care. Home‐based end‐of‐life care may slightly increase patient satisfaction at one‐month follow‐up (low quality evidence). We are uncertain whether home‐based end‐of‐life care improves caregiver outcomes. Two of the four trials reported data on caregiver outcomes, with one of these trials reporting that caregivers of terminally ill people receiving home‐based end‐of‐life care experienced greater satisfaction than those receiving hospital care (low quality evidence) (Hughes 1992). However, caregivers experienced lower morale if the participant survived more than 30 days.
One trial (Hughes 1992), conducted in the US, examined cost in some detail and did not report differences in overall net health costs between end‐of‐life home‐based care and hospital care, although the use of VA hospital beds was lower for those receiving home‐based end‐of‐life care. A second trial (Brumley 2007), also conducted in the US, reported that the average cost per day incurred by those participants receiving home‐based care was lower than for those receiving standard care (low quality evidence). None of the studies reported on costs incurred by the participant or the caregiver.
Overall completeness and applicability of evidence
The included trials were conducted between 1992 and 2007; all were conducted in a high‐income country, with two in the US, one in the UK, and one in Norway. A total of 694 participants were recruited by three trials, and in one trial, three clusters were randomised (N = 434 participants). Around a quarter of participants lived alone. Participant survival times varied, indicating that they were recruited at different stages of their illness. In Grande 2000, participants had a median survival of 11 days from referral; participants recruited to the cluster trial in Norway had an estimated life expectancy of between two and nine months (Jordhøy 2000); and participants in the trial conducted in the US had a life expectancy of 12 months or less (Brumley 2007). Admissions to hospital also varied, which may be explained by the different healthcare systems, the configuration of existing community‐based services, and support provided to caregivers. Despite these differences, the evidence does support the implementation of home‐based end‐of‐life care programmes with access to 24‐hour care to support more people dying at home.
We do not anticipate the effects of the intervention to differ for disadvantaged populations (Dans 2007). Although all trials were conducted in high‐income countries, more than one‐third of the participants included in one trial, Brumley 2007, and about 10% of those recruited to another trial, Hughes 1992, belonged to an ethnic minority group. No subgroup analyses were reported for those participants.
Quality of the evidence
The quality, or certainty, of the evidence included in this review reflects the difficulties in conducting research in this area. Trials were unblinded, and participants crossed over between intervention and control groups. In addition, measuring symptoms and quality of life is difficult, and may have to be done by a proxy (for example a nurse, doctor, or caregiver). Each of these groups can form different impressions, which are then reflected in their assessments of the participant (Grande 2000). There is a risk that some of the results may have occurred by chance, as several of the studies conducted a large number of statistical tests. Finally, and most importantly, there are ethical concerns with randomising people at the end of their life rather than letting them exercise their choice of where they want to be cared for.
Potential biases in the review process
Only one review author reviewed the abstracts and applied the inclusion criteria to produce a long list of potentially eligible studies. Two review authors independently applied eligibility criteria and assessed these studies for inclusion, extracted data, and evaluated the scientific quality. We identified only one abstract of an ongoing trial (Stern 2006), and did not identify subsequent publication of these trial results. We did not identify any unpublished randomised data to include in this review, therefore there is a risk that we have excluded studies that could contribute to this review.
Agreements and disagreements with other studies or reviews
Previous systematic reviews include one published by Smeenk 1998, which compared home‐care programmes for people with incurable cancer to routinely available home care. This review excluded studies in which the control group received hospital care. In addition to noting the poor descriptions of the intervention and control groups' care, Smeenk 1998 reported that the evidence supporting home‐care programmes is inconclusive. Zimmermann 2008 published a systematic review of specialised palliative care across a range of settings. They also concluded that methodological limitations contribute to a weak evidence base. Luckett 2013 assessed to what extent home nursing increased the likelihood of dying at home, similarly concluding that the existing evidence precluded definitive recommendations.

Study flow diagram.

Risk of bias graph: review authors' judgements about each risk of bias item presented as percentages across all included studies.

Risk of bias summary: review authors' judgements about each risk of bias item for each included study.

Comparison 1 Place of death, Outcome 1 Dying at home.
| Study | |
| Grande 2000 | T= 152/186 (82%), C= 34/44 (77%), P = 0.46 |
Comparison 1 Place of death, Outcome 2 Time spent at home in the last 2 weeks of life.

Comparison 1 Place of death, Outcome 3 Dying in hospital.
| Study | |
| Jordhøy 2000 | T= 19/235 (9%), C= 36/199 (21%), P = 0.01 |
Comparison 1 Place of death, Outcome 4 Dying in a nursing home.
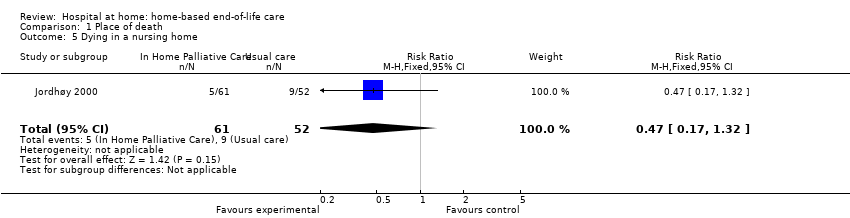
Comparison 1 Place of death, Outcome 5 Dying in a nursing home.

Comparison 2 Unplanned admissions, Outcome 1 Admitted to hospital.
| Study | Outcomes | Notes |
| Grande 2000 | Pain, mean SD T= 2.49 (0.92), C= 3.12 (1.05), P = 0.02 Nausea/vomiting, mean SD T= 1.91 (0.87), C= 2.47 (1.07), P = 0.06 Constipation, mean SD T= 2.32 (1.09), C= 2.50 (0.97), P = 0.51 Diarrhoea, mean SD T= 1.49 (0.88), C= 1.60 (0.98), P = 0.69 Breathlessness, mean SD T= 2.39 (1.17), C= 2.21 (1.19), P = 0.70 Anxiety, mean SD T= 2.45 (1.05), C= 2.50 (1.10), P = 0.10 Depression, mean SD T= 2.08 (0.97), C= 1.93 (1.14), P = 0.65 | 4‐point scale completed by the care giver. Lower score indicates less of a problem. |
Comparison 3 Control of symptoms, Outcome 1 Caregivers' ratings of symptoms.
| Study | Outcomes | Notes |
| Grande 2000 | Pain, mean SD T= 2.03 (0.73), C= 2.35 (0.95), P = 0.09 Nausea/vomiting, mean SD T= 1.78 (0.82), C= 2.00 (1.02), P = 0.28 Constipation, mean SD T= 1.81 (0.78), C= 1.97 (0.94), P = 0.45 Diarrhoea, mean SD T= 1.17 (0.49), C= 1.36 (0.73), P = 0.20 Breathlessness, mean SD T= 1.82 (1.01), C= 1.66 (0.93), P = 0.42 Anxiety, mean SD T= 2.10 (0.95), C= 2.50 (0.97), P = 0.05 Depression, mean SD T= 1.62 (0.76), C= 2.19 (1.08), P = 0.01 | Intention to treat 4‐point scale completed by the GP Lower score indicates less of a problem. No difference was detected for the ratings reported by district nurses and informal care givers |
Comparison 3 Control of symptoms, Outcome 2 GPs' ratings of symptoms.
| Study | Outcomes | Notes |
| Hughes 1992 | At 6 months, mean | High attrition in both groups due to death. The Barthel Self‐Care Index with modified scoring system was used. No P value given, insufficient data to calculate CI |
Comparison 4 Participant health outcomes, Outcome 1 Functional status.
| Study | Outcomes | Notes |
| Hughes 1992 | At 6 months, mean | High attrition in both groups due to death. Philadelphia Geriatric Morale Scale used (shortened version). No P value given, insufficient data to calculate CI |
Comparison 4 Participant health outcomes, Outcome 2 Psychological well‐being.
| Study | Outcomes | Notes |
| Hughes 1992 | At 6 months, mean | High attrition in both groups due to death. Short Portable Mental Status Questionnaire used (10 items). No P value given, insufficient data to calculate CI |
Comparison 4 Participant health outcomes, Outcome 3 Cognitive status.
| Study | Outcomes | Notes |
| Brumley 2007 | At 30 days OR = 3.37, 95% CI = 1.42‐8.10 (n=216) At 60 days OR= 1.79, 95% CI 0.65 to 4.96 (n=168) | Satisfaction measured by the Reid‐Gundlack Satisfaction with Service instrument |
| Hughes 1992 | At one month: P = .02 | 17 item questionnaire derived from the National Hospice Study No P value reported, insufficient data to calculate CI. |
Comparison 4 Participant health outcomes, Outcome 4 Patient satisfaction.
| Study | |
| Hughes 1992 | At 6 month, proportion (percentage) |
Comparison 4 Participant health outcomes, Outcome 5 Mortality.
| Study | |
| Brumley 2007 | Days, mean (SD) T= 196 (164), C= 242 (200), P = 0.03 |
| Grande 2000 | Treatment group (allocated and admitted to hospital at home): median 16 days |
| Jordhøy 2000 | Days, median (95% CI) T= 99 (79 to 119), C= 127 (88 to 166) |
Comparison 4 Participant health outcomes, Outcome 6 Survival time from referral to death.
| Study | Outcomes | Notes |
| Hughes 1992 | At 1 month: Carers in the treatment group reported a greater level of satisfaction | |
Comparison 5 Caregiver‐reported outcomes, Outcome 1 Caregiver satisfaction.
| Study | Outcomes | Notes |
| Brumley 2007 | Controlling for survival, age, severity of illness and primary disease, adjusted mean cost (SD) T= $12,670 ($12,523) C= $20,222 ($30,026) Average cost per day incurred by those on intervention arm ($95.30) was significantly lower than that of comparator group ($212.80) (t = ‐2.417; P = 0.02) | Service costs were calculated using actual costs for contracted medical services in Colorado and proxy cost estimates for all services provided within the HMO as services within the HMO are not billed separately. Costs were based on figures from 2002 Hospitalisation and emergency department cost estimates were calculated using aggregated data from more than 500,000 HMO patient records and include ancillary services such as laboratory and radiology. Costs of physician office visits included nurse and clerk expenses. Home health and palliative care visits were calculated using average time spent on each visit and multiplying that by the cost for each discipline’s reimbursement rate. Proxy costs generated for hospital days and emergency department visits were significantly lower than the actual costs received from contracted providers. Total cost variable was constructed by aggregating costs for physician visits, emergency department visits, hospital days, skilled nursing facility days and home health or palliative days accumulated from the point of study enrolment until the end of the study period or death |
| Hughes 1992 | 1986 prices (average costs) | |
Comparison 6 Resource use and cost, Outcome 1 Cost.
| Study | Outcomes | Notes |
| Grande 2000 | GP workload in penultimate week of life Evening home visits, mean (SD) Evening home visits, mean (SD) | |
| Hughes 1992 | VA services at 6 months | 95% CI not calculated as equal variances can not be assumed |
Comparison 6 Resource use and cost, Outcome 2 Health service use.
| Study | |
| Hughes 1992 | At 6 months T= 5.63 (10), C= 12.06 (15.2), mean difference 6.43 days (95% CI 2.55 to 10.3), P = 0.002 |
| Jordhøy 2000 | Nmber of inpatient days, mean (SD) T= 5.0 (17.3), C= 9.3 (31.4) |
Comparison 6 Resource use and cost, Outcome 3 Inpatient days.
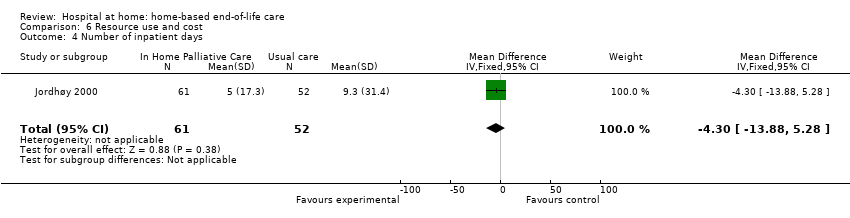
Comparison 6 Resource use and cost, Outcome 4 Number of inpatient days.
| Study | Outcomes | Notes |
| Grande 2000 | District nurse thought there should be additional help for the care giver, mean (SD) T= 1.81 (0.87) (n = 141), C= 1.36 (0.60) (n = 31), P = 0.005 District nurse thought there should be more help with night nursing T= 1.43 (0.64) (n = 143), C= 2.03 (0.84) (n = 33); P < 0.0001 | 3 point scale with lower scores indicating less of a problem A 3 point scale with lower scores indicating less of a problem |
Comparison 7 Staff views, Outcome 1 District nurse views.
| Participant outcomes for home‐based end‐of‐life care | ||||||
| Patient or population: terminally ill people Comparison: a combination of services that could include routine (not specialised) home care, acute inpatient care, primary care services, and hospice care | ||||||
| Outcomes | Illustrative comparative risks* (95% CI) | Relative effect | No of participants | Certainty of the evidence | Comments | |
| Assumed risk | Corresponding risk | |||||
| Control | Home‐based end‐of‐life care | |||||
| Place of death (home) | Study population | RR 1.33 | 652 | ⊕⊕⊕⊕ | In 1 trial, eligible participants were assigned treatment according to the district (cluster) in which they lived | |
| 444 per 1000 | 591 per 1000 | |||||
| Difference: 147 more (62 to 244 more) | ||||||
| Medium‐risk population | ||||||
| 510 per 1000 | 678 per 1000 | |||||
| Difference: 168 more (71 to 280 more) | ||||||
| Admission to hospital Follow‐up: 6 to 24 months | Estimates ranged from a relative increase in risk of admission to hospital of 2.61 to a relative reduction in risk of 0.62 | 823 (4 studies) | ⊕⊕⊕⊝ moderate1 | Data were not pooled due to the high degree of statistical heterogeneity for this outcome | ||
| Patient satisfaction Follow‐up: 1 to 6 months | A small increase in satisfaction for those receiving end‐of‐life care at home reported at 1 month, and reduced at 6 months | 199 (2 studies) | ⊕⊕⊝⊝2 low | Satisfaction measured using questions derived from the US National Hospice Study and the Reid‐Gundlach Satisfaction with Services instrument (minimum low score 1, high score 5) | ||
| Caregiver burden Follow‐up 6 months | One study demonstrated a reduction in psychological well‐being for caregivers of participants who had survived more than 30 days, and a second study reported little or no difference in caregiver response to bereavement | 155 (2 studies) | ⊕⊕⊝⊝2 low | Measured by the Philadelphia Geriatric Center Morale Scale and the Texas Revised Inventory of Grief | ||
| Health service cost | A reduction in total health service cost was reported for those participants receiving end‐of‐life care at home (range from a 18% to 30% reduction) | 2 studies | ⊕⊕⊝⊝3 low | |||
| *The basis for the assumed risk (e.g. the median control group risk across studies) is provided in footnotes. The corresponding risk (and its 95% confidence interval) is based on the assumed risk in the comparison group and the relative effect of the intervention (and its 95% CI). | ||||||
| GRADE Working Group grades of evidence | ||||||
| 1We downgraded the certainty of the evidence due to inconsistency of findings among studies. 2We downgraded the certainty of the evidence as different measures were used, and only two out of the four included studies reported data for these outcomes. 3We downgraded the certainty of evidence due to inconsistency of findings among studies, studies reporting different healthcare resources, and only two out of four included studies reporting data for this outcome. | ||||||
| Outcome or subgroup title | No. of studies | No. of participants | Statistical method | Effect size |
| 1 Dying at home Show forest plot | 3 | 652 | Risk Ratio (M‐H, Fixed, 95% CI) | 1.33 [1.14, 1.55] |
| 2 Time spent at home in the last 2 weeks of life Show forest plot | Other data | No numeric data | ||
| 3 Dying in hospital Show forest plot | 1 | 113 | Risk Ratio (M‐H, Fixed, 95% CI) | 1.12 [0.82, 1.52] |
| 4 Dying in a nursing home Show forest plot | Other data | No numeric data | ||
| 5 Dying in a nursing home Show forest plot | 1 | 113 | Risk Ratio (M‐H, Fixed, 95% CI) | 0.47 [0.17, 1.32] |
| Outcome or subgroup title | No. of studies | No. of participants | Statistical method | Effect size |
| 1 Admitted to hospital Show forest plot | 4 | 823 | Risk Ratio (M‐H, Fixed, 95% CI) | 0.93 [0.82, 1.05] |
| Outcome or subgroup title | No. of studies | No. of participants | Statistical method | Effect size |
| 1 Caregivers' ratings of symptoms Show forest plot | Other data | No numeric data | ||
| 2 GPs' ratings of symptoms Show forest plot | Other data | No numeric data | ||
| Outcome or subgroup title | No. of studies | No. of participants | Statistical method | Effect size |
| 1 Functional status Show forest plot | Other data | No numeric data | ||
| 2 Psychological well‐being Show forest plot | Other data | No numeric data | ||
| 3 Cognitive status Show forest plot | Other data | No numeric data | ||
| 4 Patient satisfaction Show forest plot | Other data | No numeric data | ||
| 5 Mortality Show forest plot | Other data | No numeric data | ||
| 6 Survival time from referral to death Show forest plot | Other data | No numeric data | ||
| Outcome or subgroup title | No. of studies | No. of participants | Statistical method | Effect size |
| 1 Caregiver satisfaction Show forest plot | Other data | No numeric data | ||
| Outcome or subgroup title | No. of studies | No. of participants | Statistical method | Effect size |
| 1 Cost Show forest plot | Other data | No numeric data | ||
| 2 Health service use Show forest plot | Other data | No numeric data | ||
| 3 Inpatient days Show forest plot | Other data | No numeric data | ||
| 4 Number of inpatient days Show forest plot | 1 | 113 | Mean Difference (IV, Fixed, 95% CI) | ‐4.30 [‐13.88, 5.28] |
| Outcome or subgroup title | No. of studies | No. of participants | Statistical method | Effect size |
| 1 District nurse views Show forest plot | Other data | No numeric data | ||