Liječenje lijekovima za kronični kognitivni poremećaj u traumatskoj ozljedi mozga
Referencias
References to studies included in this review
References to studies excluded from this review
References to ongoing studies
Additional references
References to other published versions of this review
Characteristics of studies
Characteristics of included studies [ordered by study ID]
| Methods | Twelve week (first phase) single centre randomised placebo‐controlled cross‐over trial. Recruitment conducted from November 2002 to March 2005. | |
| Participants | Fifty‐one males and females in the United States aged 16 to 65, at least one year post traumatic brain injury who required in‐patient rehabilitation. Experiencing fatigue or excessive daytime sleepiness, or both, which compromises optimal day time functioning. | |
| Interventions | Treatment: Modafinil 100 mg daily for three days, then 100 mg twice daily for 11 days, followed by 200 mg twice daily for eight weeks. Followed by a four‐week washout period and then cross‐over. Dose reduction to 200 mg daily if non‐tolerance of 400 mg daily. Placebo: Placebo tablets with the same timings as for the treatment arm. | |
| Outcomes | Medical Outcome Study 12‐Item Short Form Survey (SF‐12). Immediate Post Concussion Assessment Cognitive Testing (ImPACT): Computerised cognitive test battery assessing verbal memory, visual memory, visual motor speed and reaction time. Conners' Continuous Performance Test II (CPT‐II): Computerised test of vigilance developed for individuals with attention deficit hyperactivity disorder. Measures were administered at baseline, week four and week ten of treatment, repeated at week four and week ten following cross‐over. Attrition rates for each arm were reported. Number and type of adverse events for each arm were reported. | |
| Funding | The study was supported by the US Department of Education, Office of Special Education and Rehabilitation Services, National Institute on Disability and Rehabilitation Research and Cephalon Inc. | |
| Declarations of interest | None reported. | |
| Notes | Adverse event data for phase 1 were provided by the study author. | |
| Risk of bias | ||
| Bias | Authors' judgement | Support for judgement |
| Random sequence generation (selection bias) | Low risk | Computer generated randomisation sequence. |
| Allocation concealment (selection bias) | Low risk | Pharmacy department responsible for maintaining study blinding, who administered modafinil or placebo according to the randomisation sequence. |
| Blinding of participants and personnel (performance bias) | Low risk | Participants and personnel blinded to allocation. |
| Blinding of outcome assessment (detection bias) | Low risk | Investigators, study coordinator, data collectors, analysts blinded to allocation. |
| Incomplete outcome data (attrition bias) | High risk | Fifty‐one participants randomised, with only 49 included in the analysis. No reference to intention‐to‐treat analysis. |
| Selective reporting (reporting bias) | Low risk | Outcomes were reported as planned in the study protocol. |
| Other bias | Unclear risk | The primary outcome of the study investigated treatment of fatigue and not cognitive functioning. |
| Methods | Four week (first phase) single centre randomised placebo‐controlled cross‐over trial. Study dates not reported. | |
| Participants | Twelve male and female participants aged 30 to 65, recruited via a local newspaper in Sweden or from the Department of Neurology at Sahlgrenska University Hospital in Gothenburg, six who had suffered a TBI and six stroke at least 12 months earlier who had pathological mental fatigue and had recovered from neurological symptoms. | |
| Interventions | Treatment: Administered (−)‐OSU6162. Week 1: 30 mg daily; week 2: 60 mg daily; week 3 and 4: 90 mg daily in divided doses with individual variability. Followed by a four‐week cross‐over without a washout period. Placebo: Details of the administration of placebo were not described. | |
| Outcomes | Trail Making Test A, B, C, D. Wechsler Adult Intelligence Scale digit symbol coding. Wechsler Adult Intelligence Scale digit span. F‐A‐S verbal fluency test. | |
| Funding | The study was supported by the Arvid Carlsson Foundation and the Foundation for Neuropharmacological Research and Education. | |
| Declarations of interest | None reported. | |
| Notes | Data for TBI participants were provided by the study author. | |
| Risk of bias | ||
| Bias | Authors' judgement | Support for judgement |
| Random sequence generation (selection bias) | Unclear risk | An insufficient description of the randomisation process was provided, limited to "randomisation was done externally". |
| Allocation concealment (selection bias) | Low risk | Allocation was done "externally" to ensure blinded randomisation. |
| Blinding of participants and personnel (performance bias) | Low risk | Blinding was described as "both the participants and all study staff members were blinded. The code was broken only after all participants had terminated the study". |
| Blinding of outcome assessment (detection bias) | Low risk | Allocation was not known at the point of assessment. |
| Incomplete outcome data (attrition bias) | Low risk | The number of dropouts, and reasons, were reported. |
| Selective reporting (reporting bias) | Low risk | Outcomes were reported as planned in the study protocol. |
| Other bias | Unclear risk | The protocol planned for 25 participants compared to 12 in the study. The primary outcome of the study investigated treatment of fatigue and not cognitive functioning. |
| Methods | Two week (first phase) single centre randomised double‐blind placebo‐controlled cross‐over trial. Recruitment was completed in March 2014. | |
| Participants | Sixty males and females in the United States aged 18 to 65, who had received inpatient rehabilitation following a moderate to severe traumatic brain injury at least one year earlier. Participants were included if attention dysfunction was present, indicated by a score of 4 or higher on the Adult ADHD Self‐Report Scale, or a score of 0.35 or higher on the Cognitive Failures Questionnaire (CFQ), or a score of 0.42 or higher on the Other CFQ. | |
| Interventions | All participants received a two‐week placebo run‐in. Treatment: Atomoextine 40 mg twice daily for two weeks. Followed by a two‐week placebo washout period and then cross‐over. Placebo: Identical placebo tablets with the same timings as for the treatment arm. | |
| Outcomes | Cognitive Drug Research (CDR) Computerized Cognitive Assessment System. Study secondary outcomes:
| |
| Funding | The study was supported by the Rocky Mountain Regional Brain Injury System (Grant number H133A070022), funded by an award from the US Department of Education’s National Institute on Disability and Rehabilitation Research. The study received investigator‐initiated support from Lilly Research Laboratories, who provided the active drug and placebo. | |
| Declarations of interest | None reported. | |
| Notes | Phase 1 data were provided by the study authors. | |
| Risk of bias | ||
| Bias | Authors' judgement | Support for judgement |
| Random sequence generation (selection bias) | Low risk | Randomisation was performed “using a computer generated randomization sequence”. |
| Allocation concealment (selection bias) | Low risk | The “study physician and study coordinator enrolled participants and assigned study numbers sequentially as participants enrolled”. Pharmacy staff administered the randomisation protocol independently to study staff. |
| Blinding of participants and personnel (performance bias) | Low risk | The study was described as “double‐blind”. The “randomization sequence was given to the pharmacy and no study staff had access to it”. |
| Blinding of outcome assessment (detection bias) | Low risk | Allocation was not known at the point of assessment. |
| Incomplete outcome data (attrition bias) | Low risk | The number of dropouts, and reasons, were reported. There were no dropouts during the first treatment phase which is relevant to this review. |
| Selective reporting (reporting bias) | Low risk | Outcomes were reported as planned in the study protocol. |
| Other bias | Low risk | None identified. |
| Methods | Twelve‐week randomised placebo controlled study in 19 centres. Study dates not reported. | |
| Participants | One hundred and fifty‐seven males and females in the United States aged 18 to 50. At least one year post head injury meeting ICD‐9 criteria for non‐penetrating head injury and DSM‐IV TR criteria for cognitive disorder NOS, dementia due to TBI or amnesic disorder due to TBI. Discrepancy of at least one standard deviation between current estimated intelligence measured by the Wechsler Adult Intelligence Scale 3rd Edition (WAIS‐III) information and vocabulary subsets and current attention or verbal functioning as assessed by the Cambridge Neuropsychological Test Automated Battery (CANTAB) and Rapid Visual Information Processing (RVIP) A' subtest or the Hopkins Verbal Learning Test (HVLT) total Trials 1 through 3. | |
| Interventions | Treatment: Rivastigmine 3 mg to 6 mg for 12 weeks. Commenced rivastigmine 1.5 mg twice daily, increased to 3 mg twice daily after a minimum of four weeks. Reduced to 3 mg daily if adverse effects experienced at 6 mg daily. Placebo: Administered a matching placebo. | |
| Outcomes | Study primary outcomes (Administered at baseline, and weeks 4, 8 and 12): Cambridge Neuropsychological Test Automated Battery. Hopkins Verbal Learning Test, Rapid Visual Information Processing A' subtest. Study secondary outcomes (Administered at baseline and week 12): Controlled Oral Word Association. Wechsler Adult Intelligence Scale digit span. Wechsler Adult Intelligence Scale letter number sequencing. Trail Making tests Parts A and B. Neurobehavioral Functioning Inventory. Diener Satisfaction with Life Scale. Clinical Global Impression of Change. Attrition rates for each arm reported. Number and type of adverse event for each arm reported. | |
| Funding | The study was supported by Novartis Pharmaceuticals Corporation. | |
| Declarations of interest | Multiple authors listed as receiving honoraria from Novartis, two authors listed as employees of Novartis and one listed as a former employee of Novartis. | |
| Notes | ||
| Risk of bias | ||
| Bias | Authors' judgement | Support for judgement |
| Random sequence generation (selection bias) | Unclear risk | Randomisation was performed using "a validated system", however the system is not described. |
| Allocation concealment (selection bias) | Unclear risk | Method of allocation is not described. |
| Blinding of participants and personnel (performance bias) | Low risk | Described as "double‐blind" with a "matching placebo". |
| Blinding of outcome assessment (detection bias) | Low risk | "Raters were blinded to the participant's treatment allocation". |
| Incomplete outcome data (attrition bias) | Low risk | Intention‐to‐treat analysis with last observation carried forward. Ten of 80 withdrew from the treatment arm, five due to adverse events and five due to other reasons not stated. Thirteen of 77 withdrew from the placebo arm, seven due to adverse events and six due to other reasons not stated. |
| Selective reporting (reporting bias) | Low risk | Study inclusion criteria and outcome measurement time scales varied from the protocol. The protocol planned to include participants aged 18 to 65, compared to 18 to 50 years in the study. Different cognitive tests to those proposed in the protocol were used. The protocol planned for treatment for 20 weeks, as opposed to 12 weeks in the study. These discrepancies would likely be balanced across both arms of the study. |
| Other bias | Low risk | None identified. |
Characteristics of excluded studies [ordered by study ID]
| Study | Reason for exclusion |
| No placebo control group. | |
| The length of time post TBI was not clearly defined. | |
| The length of time post TBI was not clearly defined. | |
| The length of time post TBI was not clearly defined. | |
| Phase one data was not reported and was unavailable from the study author. | |
| Phase one data was not reported and was unavailable from the study author. |
Characteristics of ongoing studies [ordered by study ID]
| Trial name or title | Rivastigmine Patch in Veterans With Cognitive Impairment Following TBI (RIVET) |
| Methods | Multi‐centre, randomised placebo‐controlled study. |
| Participants | Estimated 256 male and female outpatient veterans aged between 19 to 50, with a history of closed head trauma at least 12 months prior to enrolment. TBI classified as mild, with verbal memory deficits and subjective memory impairment. |
| Interventions | Treatment: Rivastigmine transdermal patch for 12 weeks. Control: Placebo comparator for 12 weeks. |
| Outcomes | Primary: Efficacy defined by comparing the proportion of responders in each group, with treatment response defined as at least a 5‐word improvement from baseline to 12 weeks on the Hopkins Verbal Learning Test ‐ Revised (HVLT‐R) total learning for Trials 1‐3. Secondary: Assessment of functional capacity, cognitive functioning, mood, quality of life, and safety measures. |
| Starting date | September 2012 |
| Contact information | Rebekah Hardin, MHA (843) 740‐1592 ext 37 [email protected] |
| Notes |
Data and analyses
| Outcome or subgroup title | No. of studies | No. of participants | Statistical method | Effect size |
| 1 SF‐12 Physical Show forest plot | 1 | 51 | Mean Difference (IV, Fixed, 95% CI) | ‐2.18 [‐6.34, 1.98] |
| Analysis 1.1  Comparison 1 Modafinil vs placebo (4 weeks), Outcome 1 SF‐12 Physical. | ||||
| 2 SF‐12 Mental Show forest plot | 1 | 51 | Mean Difference (IV, Fixed, 95% CI) | 1.95 [‐2.84, 6.74] |
| Analysis 1.2  Comparison 1 Modafinil vs placebo (4 weeks), Outcome 2 SF‐12 Mental. | ||||
| 3 ImPACT verbal memory composite Show forest plot | 1 | 51 | Mean Difference (IV, Fixed, 95% CI) | 1.42 [‐4.42, 7.26] |
| Analysis 1.3  Comparison 1 Modafinil vs placebo (4 weeks), Outcome 3 ImPACT verbal memory composite. | ||||
| 4 ImPACT visual memory composite Show forest plot | 1 | 51 | Mean Difference (IV, Fixed, 95% CI) | 0.25 [‐6.52, 7.02] |
| Analysis 1.4  Comparison 1 Modafinil vs placebo (4 weeks), Outcome 4 ImPACT visual memory composite. | ||||
| 5 ImPACT visual motor speed composite Show forest plot | 1 | 51 | Mean Difference (IV, Fixed, 95% CI) | ‐3.45 [‐6.48, ‐0.42] |
| Analysis 1.5  Comparison 1 Modafinil vs placebo (4 weeks), Outcome 5 ImPACT visual motor speed composite. | ||||
| 6 ImPACT reaction time composite Show forest plot | 1 | 51 | Mean Difference (IV, Fixed, 95% CI) | 0.02 [‐0.04, 0.08] |
| Analysis 1.6  Comparison 1 Modafinil vs placebo (4 weeks), Outcome 6 ImPACT reaction time composite. | ||||
| 7 CCPT‐II No. of omissions Show forest plot | 1 | 51 | Mean Difference (IV, Fixed, 95% CI) | 16.57 [‐3.59, 36.73] |
| Analysis 1.7  Comparison 1 Modafinil vs placebo (4 weeks), Outcome 7 CCPT‐II No. of omissions. | ||||
| 8 CCPT‐II No. of commissions Show forest plot | 1 | 51 | Mean Difference (IV, Fixed, 95% CI) | 2.00 [‐1.75, 5.75] |
| Analysis 1.8  Comparison 1 Modafinil vs placebo (4 weeks), Outcome 8 CCPT‐II No. of commissions. | ||||
| Outcome or subgroup title | No. of studies | No. of participants | Statistical method | Effect size |
| 1 SF‐12 Physical Show forest plot | 1 | 51 | Mean Difference (IV, Fixed, 95% CI) | ‐0.53 [‐5.46, 4.40] |
| Analysis 2.1  Comparison 2 Modafinil vs placebo (10 weeks), Outcome 1 SF‐12 Physical. | ||||
| 2 SF‐12 Mental Show forest plot | 1 | 51 | Mean Difference (IV, Fixed, 95% CI) | 0.41 [‐4.28, 5.10] |
| Analysis 2.2  Comparison 2 Modafinil vs placebo (10 weeks), Outcome 2 SF‐12 Mental. | ||||
| 3 ImPACT verbal memory composite Show forest plot | 1 | 51 | Mean Difference (IV, Fixed, 95% CI) | 4.11 [‐1.37, 9.59] |
| Analysis 2.3 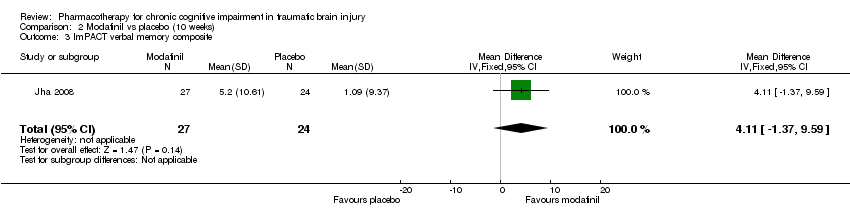 Comparison 2 Modafinil vs placebo (10 weeks), Outcome 3 ImPACT verbal memory composite. | ||||
| 4 ImPACT visual memory composite Show forest plot | 1 | 51 | Mean Difference (IV, Fixed, 95% CI) | ‐1.61 [‐8.97, 5.75] |
| Analysis 2.4  Comparison 2 Modafinil vs placebo (10 weeks), Outcome 4 ImPACT visual memory composite. | ||||
| 5 ImPACT visual motor speed composite Show forest plot | 1 | 51 | Mean Difference (IV, Fixed, 95% CI) | ‐1.44 [‐4.61, 1.73] |
| Analysis 2.5  Comparison 2 Modafinil vs placebo (10 weeks), Outcome 5 ImPACT visual motor speed composite. | ||||
| 6 ImPACT reaction time composite Show forest plot | 1 | 51 | Mean Difference (IV, Fixed, 95% CI) | ‐0.03 [‐0.08, 0.02] |
| Analysis 2.6  Comparison 2 Modafinil vs placebo (10 weeks), Outcome 6 ImPACT reaction time composite . | ||||
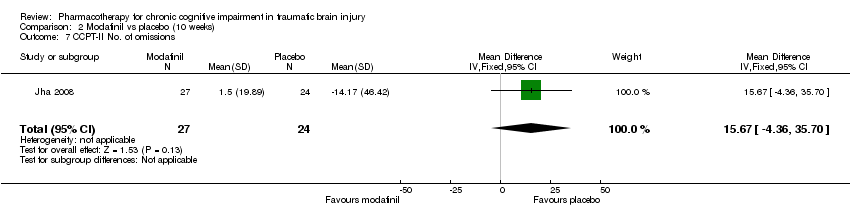
| 7 CCPT‐II No. of omissions Show forest plot | 1 | 51 | Mean Difference (IV, Fixed, 95% CI) | 15.67 [‐4.36, 35.70] |
| Analysis 2.7  Comparison 2 Modafinil vs placebo (10 weeks), Outcome 7 CCPT‐II No. of omissions. | ||||
| 8 CCPT‐II No. of commissions Show forest plot | 1 | 51 | Mean Difference (IV, Fixed, 95% CI) | 2.96 [‐0.47, 6.39] |
| Analysis 2.8  Comparison 2 Modafinil vs placebo (10 weeks), Outcome 8 CCPT‐II No. of commissions. | ||||
| Outcome or subgroup title | No. of studies | No. of participants | Statistical method | Effect size |
| 1 Trail Making Test A (seconds) Show forest plot | 1 | 6 | Mean Difference (IV, Fixed, 95% CI) | ‐9.20 [‐12.19, ‐6.21] |
| Analysis 3.1 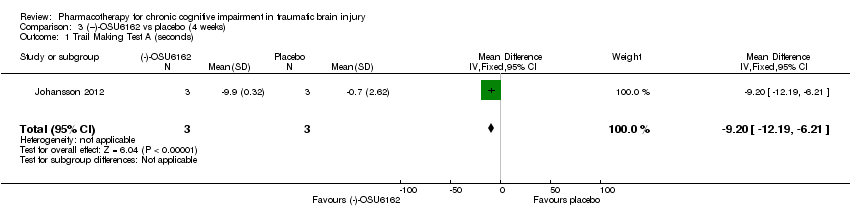 Comparison 3 (−)‐OSU6162 vs placebo (4 weeks), Outcome 1 Trail Making Test A (seconds). | ||||
| 2 Trail Making Test B (seconds) Show forest plot | 1 | 6 | Mean Difference (IV, Fixed, 95% CI) | ‐6.20 [‐7.81, ‐4.59] |
| Analysis 3.2  Comparison 3 (−)‐OSU6162 vs placebo (4 weeks), Outcome 2 Trail Making Test B (seconds). | ||||
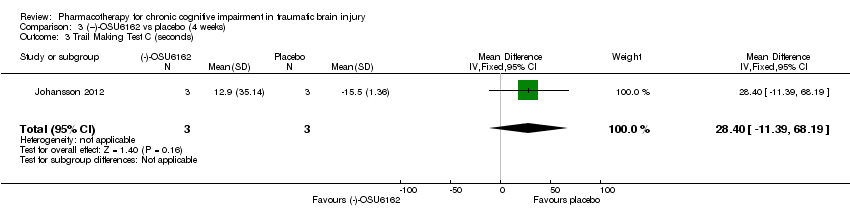
| 3 Trail Making Test C (seconds) Show forest plot | 1 | 6 | Mean Difference (IV, Fixed, 95% CI) | 28.4 [‐11.39, 68.19] |
| Analysis 3.3  Comparison 3 (−)‐OSU6162 vs placebo (4 weeks), Outcome 3 Trail Making Test C (seconds). | ||||
| 4 Trail Making Test D (seconds) Show forest plot | 1 | 6 | Mean Difference (IV, Fixed, 95% CI) | 53.5 [36.76, 70.24] |
| Analysis 3.4  Comparison 3 (−)‐OSU6162 vs placebo (4 weeks), Outcome 4 Trail Making Test D (seconds). | ||||
| 5 WAIS‐III Digit Symbol Coding Show forest plot | 1 | 6 | Mean Difference (IV, Fixed, 95% CI) | 8.6 [6.47, 10.73] |
| Analysis 3.5  Comparison 3 (−)‐OSU6162 vs placebo (4 weeks), Outcome 5 WAIS‐III Digit Symbol Coding. | ||||
| 6 WAIS‐III Digit‐Span Show forest plot | 1 | 6 | Mean Difference (IV, Fixed, 95% CI) | 1.30 [‐5.17, 7.77] |
| Analysis 3.6  Comparison 3 (−)‐OSU6162 vs placebo (4 weeks), Outcome 6 WAIS‐III Digit‐Span. | ||||
| 7 FAS Verbal Fluency (total words) Show forest plot | 1 | 6 | Mean Difference (IV, Fixed, 95% CI) | ‐10.63 [‐27.30, 6.04] |
| Analysis 3.7  Comparison 3 (−)‐OSU6162 vs placebo (4 weeks), Outcome 7 FAS Verbal Fluency (total words). | ||||
| Outcome or subgroup title | No. of studies | No. of participants | Statistical method | Effect size |
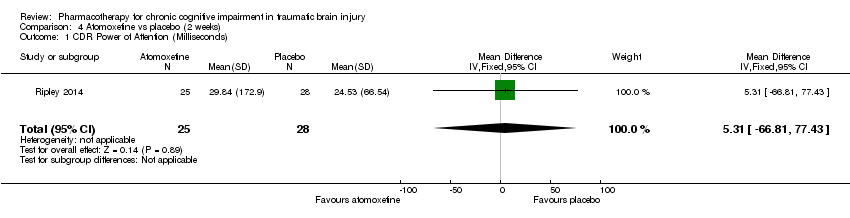
| 1 CDR Power of Attention (Milliseconds) Show forest plot | 1 | 53 | Mean Difference (IV, Fixed, 95% CI) | 5.31 [‐66.81, 77.43] |
| Analysis 4.1  Comparison 4 Atomoxetine vs placebo (2 weeks), Outcome 1 CDR Power of Attention (Milliseconds). | ||||
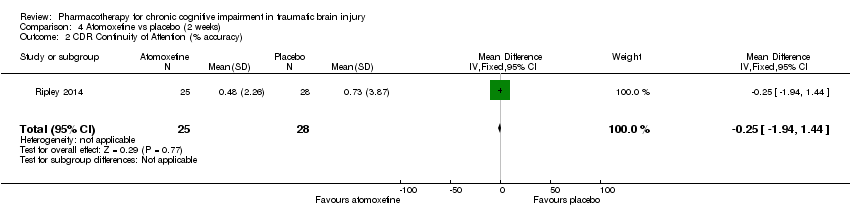
| 2 CDR Continuity of Attention (% accuracy) Show forest plot | 1 | 53 | Mean Difference (IV, Fixed, 95% CI) | ‐0.25 [‐1.94, 1.44] |
| Analysis 4.2  Comparison 4 Atomoxetine vs placebo (2 weeks), Outcome 2 CDR Continuity of Attention (% accuracy). | ||||
| 3 CDR Efficiency (COA/POA, % accuracy/millisecond) Show forest plot | 1 | 53 | Mean Difference (IV, Fixed, 95% CI) | 0.76 [‐3.10, 4.62] |
| Analysis 4.3  Comparison 4 Atomoxetine vs placebo (2 weeks), Outcome 3 CDR Efficiency (COA/POA, % accuracy/millisecond). | ||||
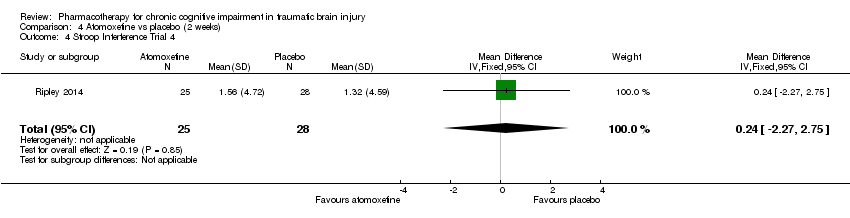
| 4 Stroop Interference Trial 4 Show forest plot | 1 | 53 | Mean Difference (IV, Fixed, 95% CI) | 0.24 [‐2.27, 2.75] |
| Analysis 4.4  Comparison 4 Atomoxetine vs placebo (2 weeks), Outcome 4 Stroop Interference Trial 4. | ||||
| 5 Adult ADHD Self‐Report Scale (ASRS‐v1.1.) Show forest plot | 1 | 53 | Mean Difference (IV, Fixed, 95% CI) | ‐1.19 [‐5.63, 3.25] |
| Analysis 4.5 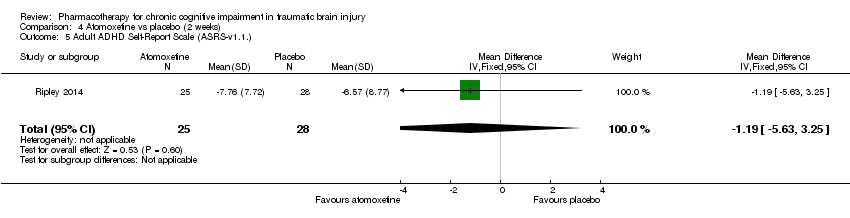 Comparison 4 Atomoxetine vs placebo (2 weeks), Outcome 5 Adult ADHD Self‐Report Scale (ASRS‐v1.1.). | ||||
| Outcome or subgroup title | No. of studies | No. of participants | Statistical method | Effect size |
| 1 HVLT‐total word recall Show forest plot | 1 | 157 | Mean Difference (IV, Fixed, 95% CI) | 0.21 [‐1.14, 1.56] |
| Analysis 5.1 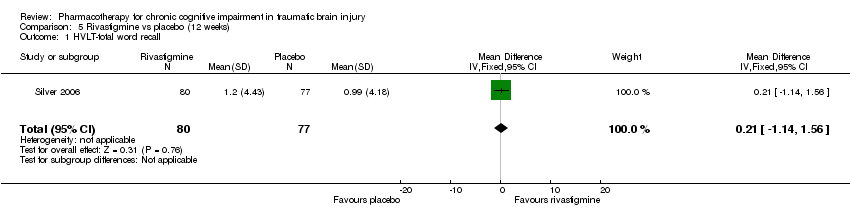 Comparison 5 Rivastigmine vs placebo (12 weeks), Outcome 1 HVLT‐total word recall. | ||||
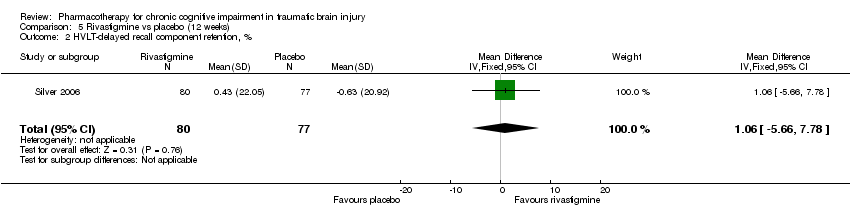
| 2 HVLT‐delayed recall component retention, % Show forest plot | 1 | 157 | Mean Difference (IV, Fixed, 95% CI) | 1.06 [‐5.66, 7.78] |
| Analysis 5.2  Comparison 5 Rivastigmine vs placebo (12 weeks), Outcome 2 HVLT‐delayed recall component retention, %. | ||||
| 3 HVLT–recognition discriminant index Show forest plot | 1 | 157 | Mean Difference (IV, Fixed, 95% CI) | ‐0.06 [‐0.78, 0.66] |
| Analysis 5.3  Comparison 5 Rivastigmine vs placebo (12 weeks), Outcome 3 HVLT–recognition discriminant index. | ||||
| 4 CANTAB RVIP’A Show forest plot | 1 | 157 | Mean Difference (IV, Fixed, 95% CI) | ‐0.01 [‐0.03, 0.00] |
| Analysis 5.4  Comparison 5 Rivastigmine vs placebo (12 weeks), Outcome 4 CANTAB RVIP’A. | ||||
| 5 CANTAB–SWM, total errors Show forest plot | 1 | 157 | Mean Difference (IV, Fixed, 95% CI) | 1.05 [‐5.85, 7.95] |
| Analysis 5.5  Comparison 5 Rivastigmine vs placebo (12 weeks), Outcome 5 CANTAB–SWM, total errors. | ||||
| 6 CANTAB RVIP, mean latency, ms Show forest plot | 1 | 157 | Mean Difference (IV, Fixed, 95% CI) | ‐44.54 [‐88.62, ‐0.46] |
| Analysis 5.6  Comparison 5 Rivastigmine vs placebo (12 weeks), Outcome 6 CANTAB RVIP, mean latency, ms. | ||||
| 7 CANTAB‐RT, simple reaction time, ms Show forest plot | 1 | 157 | Mean Difference (IV, Fixed, 95% CI) | ‐19.81 [‐59.23, 19.61] |
| Analysis 5.7  Comparison 5 Rivastigmine vs placebo (12 weeks), Outcome 7 CANTAB‐RT, simple reaction time, ms. | ||||
| 8 CANTAB‐PAL, total errors Show forest plot | 1 | 157 | Mean Difference (IV, Fixed, 95% CI) | ‐3.16 [‐10.75, 4.43] |
| Analysis 5.8  Comparison 5 Rivastigmine vs placebo (12 weeks), Outcome 8 CANTAB‐PAL, total errors. | ||||
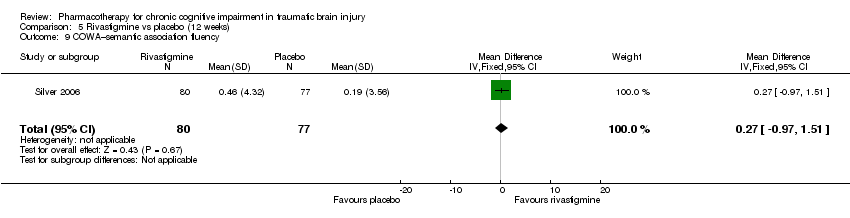
| 9 COWA–semantic association fluency Show forest plot | 1 | 157 | Mean Difference (IV, Fixed, 95% CI) | 0.27 [‐0.97, 1.51] |
| Analysis 5.9  Comparison 5 Rivastigmine vs placebo (12 weeks), Outcome 9 COWA–semantic association fluency. | ||||
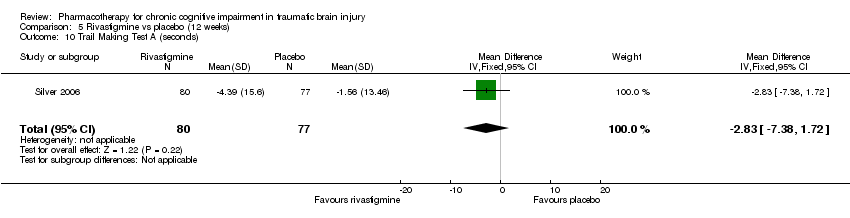
| 10 Trail Making Test A (seconds) Show forest plot | 1 | 157 | Mean Difference (IV, Fixed, 95% CI) | ‐2.83 [‐7.38, 1.72] |
| Analysis 5.10  Comparison 5 Rivastigmine vs placebo (12 weeks), Outcome 10 Trail Making Test A (seconds). | ||||
| 11 Trail Making Test B (seconds) Show forest plot | 1 | 157 | Mean Difference (IV, Fixed, 95% CI) | 3.48 [‐6.31, 13.27] |
| Analysis 5.11 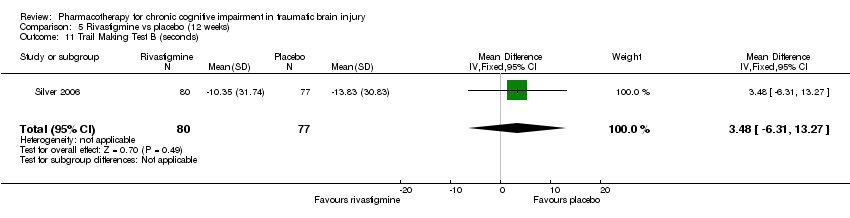 Comparison 5 Rivastigmine vs placebo (12 weeks), Outcome 11 Trail Making Test B (seconds). | ||||
| 12 WAIS‐III‐DS scaled score Show forest plot | 1 | 157 | Mean Difference (IV, Fixed, 95% CI) | 0.22 [‐0.33, 0.77] |
| Analysis 5.12  Comparison 5 Rivastigmine vs placebo (12 weeks), Outcome 12 WAIS‐III‐DS scaled score. | ||||
| Outcome or subgroup title | No. of studies | No. of participants | Statistical method | Effect size |
| 1 Modafinil vs placebo Show forest plot | 1 | 51 | Risk Ratio (M‐H, Fixed, 95% CI) | 4.46 [0.22, 88.61] |
| Analysis 6.1  Comparison 6 Acceptability of treatment, Outcome 1 Modafinil vs placebo. | ||||
| 2 Rivastigmine vs placebo Show forest plot | 1 | 157 | Risk Ratio (M‐H, Fixed, 95% CI) | 0.74 [0.35, 1.59] |
| Analysis 6.2  Comparison 6 Acceptability of treatment, Outcome 2 Rivastigmine vs placebo. | ||||
| 3 (‐)‐OSU6162 vs placebo Show forest plot | 1 | 6 | Odds Ratio (M‐H, Fixed, 95% CI) | 0.0 [0.0, 0.0] |
| Analysis 6.3 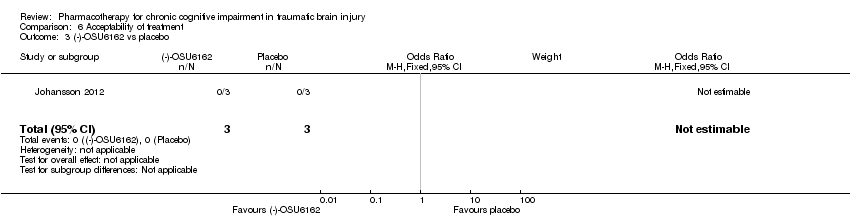 Comparison 6 Acceptability of treatment, Outcome 3 (‐)‐OSU6162 vs placebo. | ||||
| 4 Atomoxetine vs placebo Show forest plot | 1 | 56 | Odds Ratio (M‐H, Fixed, 95% CI) | 0.0 [0.0, 0.0] |
| Analysis 6.4  Comparison 6 Acceptability of treatment, Outcome 4 Atomoxetine vs placebo. | ||||
| Outcome or subgroup title | No. of studies | No. of participants | Statistical method | Effect size |
| 1 Dizziness Show forest plot | 1 | 51 | Risk Ratio (M‐H, Fixed, 95% CI) | 3.56 [0.43, 29.66] |
| Analysis 7.1 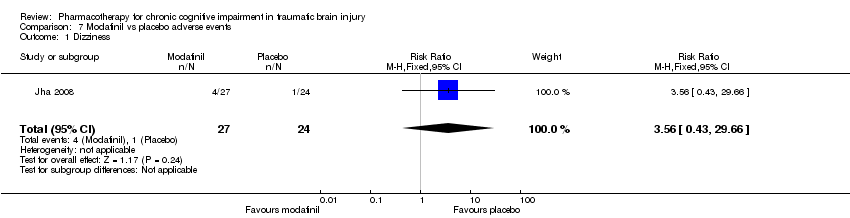 Comparison 7 Modafinil vs placebo adverse events, Outcome 1 Dizziness. | ||||
| 2 Dysgeusia Show forest plot | 1 | 51 | Risk Ratio (M‐H, Fixed, 95% CI) | 4.46 [0.22, 88.61] |
| Analysis 7.2  Comparison 7 Modafinil vs placebo adverse events, Outcome 2 Dysgeusia. | ||||
| 3 Dyspepsia Show forest plot | 1 | 51 | Risk Ratio (M‐H, Fixed, 95% CI) | 4.46 [0.22, 88.61] |
| Analysis 7.3  Comparison 7 Modafinil vs placebo adverse events, Outcome 3 Dyspepsia. | ||||
| 4 Fatigue Show forest plot | 1 | 51 | Risk Ratio (M‐H, Fixed, 95% CI) | 4.44 [0.56, 35.41] |
| Analysis 7.4  Comparison 7 Modafinil vs placebo adverse events, Outcome 4 Fatigue. | ||||
| 5 Insomnia Show forest plot | 1 | 51 | Risk Ratio (M‐H, Fixed, 95% CI) | 2.67 [0.59, 11.99] |
| Analysis 7.5  Comparison 7 Modafinil vs placebo adverse events, Outcome 5 Insomnia. | ||||
| 6 Memory impairment Show forest plot | 1 | 51 | Risk Ratio (M‐H, Fixed, 95% CI) | 4.46 [0.22, 88.61] |
| Analysis 7.6  Comparison 7 Modafinil vs placebo adverse events, Outcome 6 Memory impairment. | ||||
| 7 Nasopharyngitis Show forest plot | 1 | 51 | Odds Ratio (M‐H, Fixed, 95% CI) | 0.16 [0.01, 3.59] |
| Analysis 7.7 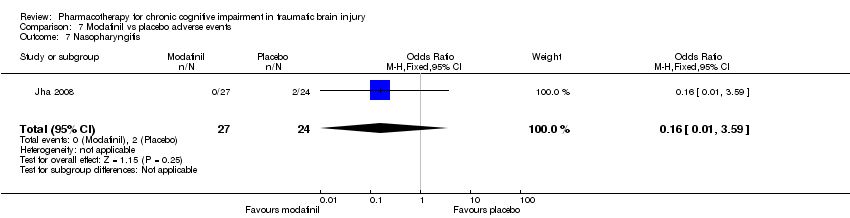 Comparison 7 Modafinil vs placebo adverse events, Outcome 7 Nasopharyngitis. | ||||
| 8 Nausea Show forest plot | 1 | 51 | Risk Ratio (M‐H, Fixed, 95% CI) | 2.67 [0.30, 23.96] |
| Analysis 7.8  Comparison 7 Modafinil vs placebo adverse events, Outcome 8 Nausea. | ||||
| 9 Weight loss Show forest plot | 1 | 51 | Risk Ratio (M‐H, Fixed, 95% CI) | 4.46 [0.22, 88.61] |
| Analysis 7.9  Comparison 7 Modafinil vs placebo adverse events, Outcome 9 Weight loss. | ||||
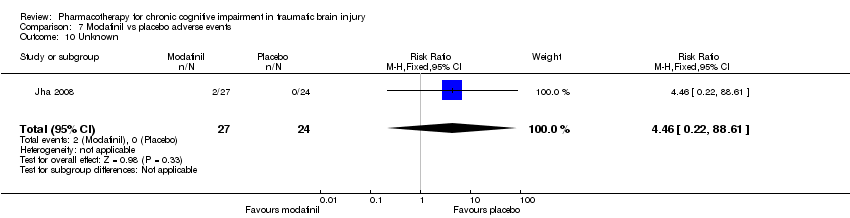
| 10 Unknown Show forest plot | 1 | 51 | Risk Ratio (M‐H, Fixed, 95% CI) | 4.46 [0.22, 88.61] |
| Analysis 7.10  Comparison 7 Modafinil vs placebo adverse events, Outcome 10 Unknown. | ||||
| Outcome or subgroup title | No. of studies | No. of participants | Statistical method | Effect size |
| 1 Nausea Show forest plot | 1 | 6 | Odds Ratio (M‐H, Fixed, 95% CI) | 0.24 [0.01, 8.62] |
| Analysis 8.1  Comparison 8 (−)‐OSU6162 vs placebo adverse events, Outcome 1 Nausea. | ||||
| Outcome or subgroup title | No. of studies | No. of participants | Statistical method | Effect size |
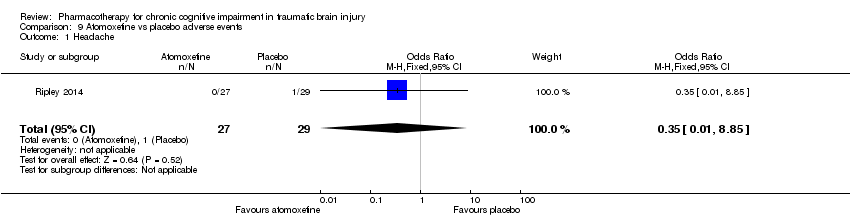
| 1 Headache Show forest plot | 1 | 56 | Odds Ratio (M‐H, Fixed, 95% CI) | 0.35 [0.01, 8.85] |
| Analysis 9.1  Comparison 9 Atomoxetine vs placebo adverse events, Outcome 1 Headache. | ||||
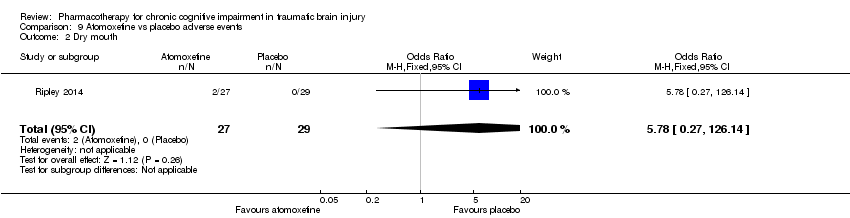
| 2 Dry mouth Show forest plot | 1 | 56 | Odds Ratio (M‐H, Fixed, 95% CI) | 5.78 [0.27, 126.14] |
| Analysis 9.2  Comparison 9 Atomoxetine vs placebo adverse events, Outcome 2 Dry mouth. | ||||
| 3 Globus pharyngeus Show forest plot | 1 | 56 | Odds Ratio (M‐H, Fixed, 95% CI) | 3.34 [0.13, 85.56] |
| Analysis 9.3  Comparison 9 Atomoxetine vs placebo adverse events, Outcome 3 Globus pharyngeus. | ||||
| 4 Hypertension Show forest plot | 1 | 56 | Odds Ratio (M‐H, Fixed, 95% CI) | 3.34 [0.13, 85.56] |
| Analysis 9.4  Comparison 9 Atomoxetine vs placebo adverse events, Outcome 4 Hypertension. | ||||
| 5 Insomnia Show forest plot | 1 | 56 | Odds Ratio (M‐H, Fixed, 95% CI) | 5.78 [0.27, 126.14] |
| Analysis 9.5  Comparison 9 Atomoxetine vs placebo adverse events, Outcome 5 Insomnia. | ||||
| 6 Irritable bowl Show forest plot | 1 | 56 | Odds Ratio (M‐H, Fixed, 95% CI) | 3.34 [0.13, 85.56] |
| Analysis 9.6 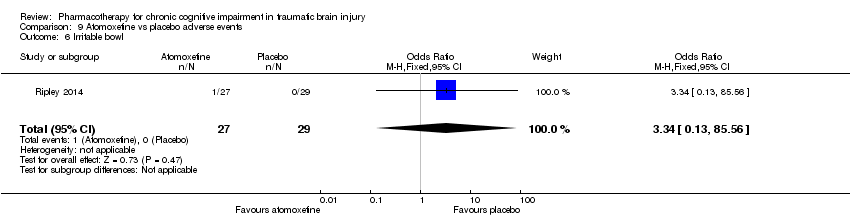 Comparison 9 Atomoxetine vs placebo adverse events, Outcome 6 Irritable bowl. | ||||
| 7 Loss of appetite Show forest plot | 1 | 56 | Odds Ratio (M‐H, Fixed, 95% CI) | 3.34 [0.13, 85.56] |
| Analysis 9.7  Comparison 9 Atomoxetine vs placebo adverse events, Outcome 7 Loss of appetite. | ||||
| 8 Nasal congestion Show forest plot | 1 | 56 | Odds Ratio (M‐H, Fixed, 95% CI) | 3.34 [0.13, 85.56] |
| Analysis 9.8 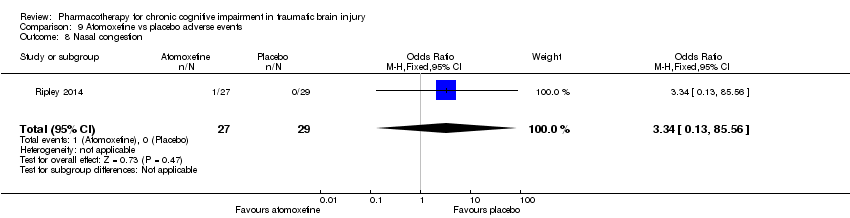 Comparison 9 Atomoxetine vs placebo adverse events, Outcome 8 Nasal congestion. | ||||
| 9 Shoulder pain Show forest plot | 1 | 56 | Odds Ratio (M‐H, Fixed, 95% CI) | 3.34 [0.13, 85.56] |
| Analysis 9.9  Comparison 9 Atomoxetine vs placebo adverse events, Outcome 9 Shoulder pain. | ||||
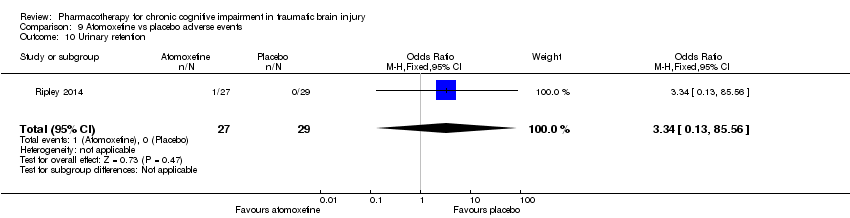
| 10 Urinary retention Show forest plot | 1 | 56 | Odds Ratio (M‐H, Fixed, 95% CI) | 3.34 [0.13, 85.56] |
| Analysis 9.10  Comparison 9 Atomoxetine vs placebo adverse events, Outcome 10 Urinary retention. | ||||
| Outcome or subgroup title | No. of studies | No. of participants | Statistical method | Effect size |
| 1 Anxiety Show forest plot | 1 | 157 | Risk Ratio (M‐H, Fixed, 95% CI) | 8.67 [0.47, 158.32] |
| Analysis 10.1  Comparison 10 Rivastigmine vs placebo adverse events, Outcome 1 Anxiety. | ||||
| 2 Arthralgia Show forest plot | 1 | 157 | Risk Ratio (M‐H, Fixed, 95% CI) | 1.93 [0.36, 10.21] |
| Analysis 10.2 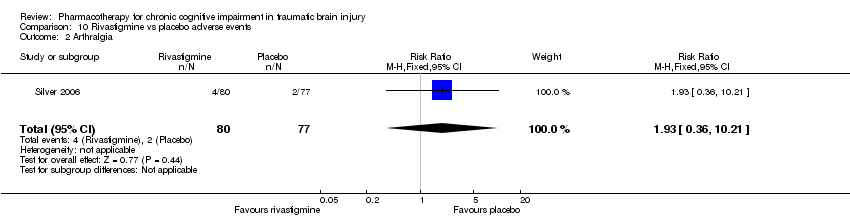 Comparison 10 Rivastigmine vs placebo adverse events, Outcome 2 Arthralgia. | ||||
| 3 Diarrhoea Show forest plot | 1 | 157 | Risk Ratio (M‐H, Fixed, 95% CI) | 2.41 [0.48, 12.03] |
| Analysis 10.3  Comparison 10 Rivastigmine vs placebo adverse events, Outcome 3 Diarrhoea. | ||||
| 4 Dizziness Show forest plot | 1 | 157 | Risk Ratio (M‐H, Fixed, 95% CI) | 7.7 [0.99, 60.12] |
| Analysis 10.4  Comparison 10 Rivastigmine vs placebo adverse events, Outcome 4 Dizziness. | ||||
| 5 Headache Show forest plot | 1 | 157 | Risk Ratio (M‐H, Fixed, 95% CI) | 0.86 [0.35, 2.10] |
| Analysis 10.5  Comparison 10 Rivastigmine vs placebo adverse events, Outcome 5 Headache. | ||||
| 6 Nausea Show forest plot | 1 | 157 | Risk Ratio (M‐H, Fixed, 95% CI) | 3.05 [1.29, 7.22] |
| Analysis 10.6  Comparison 10 Rivastigmine vs placebo adverse events, Outcome 6 Nausea. | ||||
| 7 Upper respiratory tract infection Show forest plot | 1 | 157 | Risk Ratio (M‐H, Fixed, 95% CI) | 2.17 [0.70, 6.74] |
| Analysis 10.7  Comparison 10 Rivastigmine vs placebo adverse events, Outcome 7 Upper respiratory tract infection. | ||||
| 8 Vomiting Show forest plot | 1 | 157 | Risk Ratio (M‐H, Fixed, 95% CI) | 7.7 [0.99, 60.12] |
| Analysis 10.8  Comparison 10 Rivastigmine vs placebo adverse events, Outcome 8 Vomiting. | ||||

Study flow diagram.

Risk of bias summary: review authors' judgements about each risk of bias item for each included study.
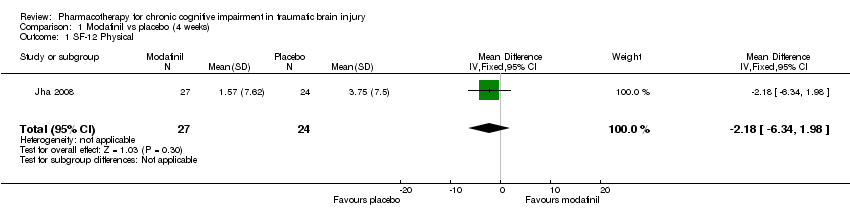
Comparison 1 Modafinil vs placebo (4 weeks), Outcome 1 SF‐12 Physical.

Comparison 1 Modafinil vs placebo (4 weeks), Outcome 2 SF‐12 Mental.

Comparison 1 Modafinil vs placebo (4 weeks), Outcome 3 ImPACT verbal memory composite.
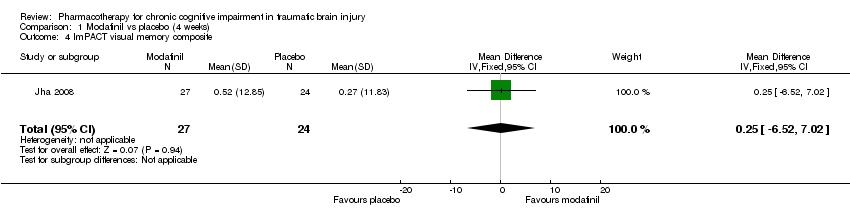
Comparison 1 Modafinil vs placebo (4 weeks), Outcome 4 ImPACT visual memory composite.

Comparison 1 Modafinil vs placebo (4 weeks), Outcome 5 ImPACT visual motor speed composite.
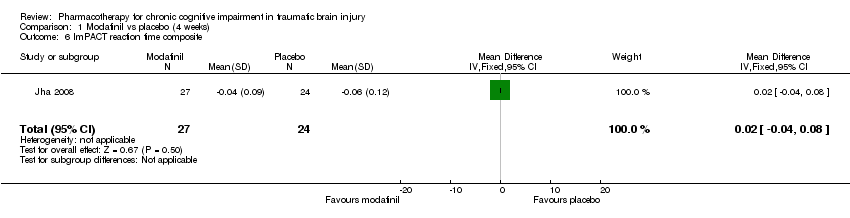
Comparison 1 Modafinil vs placebo (4 weeks), Outcome 6 ImPACT reaction time composite.

Comparison 1 Modafinil vs placebo (4 weeks), Outcome 7 CCPT‐II No. of omissions.
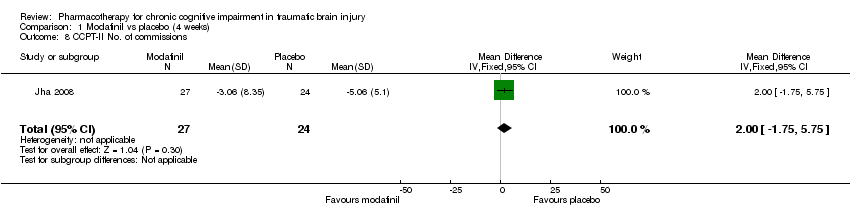
Comparison 1 Modafinil vs placebo (4 weeks), Outcome 8 CCPT‐II No. of commissions.

Comparison 2 Modafinil vs placebo (10 weeks), Outcome 1 SF‐12 Physical.

Comparison 2 Modafinil vs placebo (10 weeks), Outcome 2 SF‐12 Mental.

Comparison 2 Modafinil vs placebo (10 weeks), Outcome 3 ImPACT verbal memory composite.
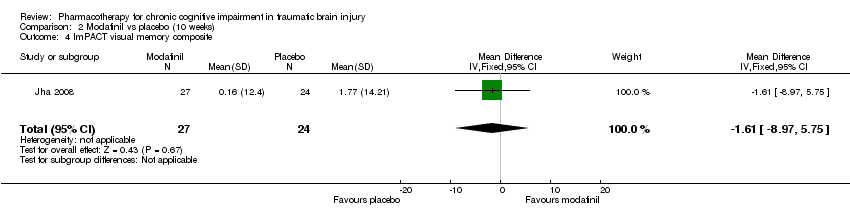
Comparison 2 Modafinil vs placebo (10 weeks), Outcome 4 ImPACT visual memory composite.

Comparison 2 Modafinil vs placebo (10 weeks), Outcome 5 ImPACT visual motor speed composite.

Comparison 2 Modafinil vs placebo (10 weeks), Outcome 6 ImPACT reaction time composite .
Comparison 2 Modafinil vs placebo (10 weeks), Outcome 7 CCPT‐II No. of omissions.

Comparison 2 Modafinil vs placebo (10 weeks), Outcome 8 CCPT‐II No. of commissions.

Comparison 3 (−)‐OSU6162 vs placebo (4 weeks), Outcome 1 Trail Making Test A (seconds).

Comparison 3 (−)‐OSU6162 vs placebo (4 weeks), Outcome 2 Trail Making Test B (seconds).
Comparison 3 (−)‐OSU6162 vs placebo (4 weeks), Outcome 3 Trail Making Test C (seconds).

Comparison 3 (−)‐OSU6162 vs placebo (4 weeks), Outcome 4 Trail Making Test D (seconds).

Comparison 3 (−)‐OSU6162 vs placebo (4 weeks), Outcome 5 WAIS‐III Digit Symbol Coding.

Comparison 3 (−)‐OSU6162 vs placebo (4 weeks), Outcome 6 WAIS‐III Digit‐Span.

Comparison 3 (−)‐OSU6162 vs placebo (4 weeks), Outcome 7 FAS Verbal Fluency (total words).
Comparison 4 Atomoxetine vs placebo (2 weeks), Outcome 1 CDR Power of Attention (Milliseconds).
Comparison 4 Atomoxetine vs placebo (2 weeks), Outcome 2 CDR Continuity of Attention (% accuracy).

Comparison 4 Atomoxetine vs placebo (2 weeks), Outcome 3 CDR Efficiency (COA/POA, % accuracy/millisecond).
Comparison 4 Atomoxetine vs placebo (2 weeks), Outcome 4 Stroop Interference Trial 4.

Comparison 4 Atomoxetine vs placebo (2 weeks), Outcome 5 Adult ADHD Self‐Report Scale (ASRS‐v1.1.).

Comparison 5 Rivastigmine vs placebo (12 weeks), Outcome 1 HVLT‐total word recall.
Comparison 5 Rivastigmine vs placebo (12 weeks), Outcome 2 HVLT‐delayed recall component retention, %.

Comparison 5 Rivastigmine vs placebo (12 weeks), Outcome 3 HVLT–recognition discriminant index.

Comparison 5 Rivastigmine vs placebo (12 weeks), Outcome 4 CANTAB RVIP’A.

Comparison 5 Rivastigmine vs placebo (12 weeks), Outcome 5 CANTAB–SWM, total errors.

Comparison 5 Rivastigmine vs placebo (12 weeks), Outcome 6 CANTAB RVIP, mean latency, ms.

Comparison 5 Rivastigmine vs placebo (12 weeks), Outcome 7 CANTAB‐RT, simple reaction time, ms.

Comparison 5 Rivastigmine vs placebo (12 weeks), Outcome 8 CANTAB‐PAL, total errors.
Comparison 5 Rivastigmine vs placebo (12 weeks), Outcome 9 COWA–semantic association fluency.
Comparison 5 Rivastigmine vs placebo (12 weeks), Outcome 10 Trail Making Test A (seconds).

Comparison 5 Rivastigmine vs placebo (12 weeks), Outcome 11 Trail Making Test B (seconds).

Comparison 5 Rivastigmine vs placebo (12 weeks), Outcome 12 WAIS‐III‐DS scaled score.

Comparison 6 Acceptability of treatment, Outcome 1 Modafinil vs placebo.

Comparison 6 Acceptability of treatment, Outcome 2 Rivastigmine vs placebo.

Comparison 6 Acceptability of treatment, Outcome 3 (‐)‐OSU6162 vs placebo.

Comparison 6 Acceptability of treatment, Outcome 4 Atomoxetine vs placebo.

Comparison 7 Modafinil vs placebo adverse events, Outcome 1 Dizziness.

Comparison 7 Modafinil vs placebo adverse events, Outcome 2 Dysgeusia.

Comparison 7 Modafinil vs placebo adverse events, Outcome 3 Dyspepsia.

Comparison 7 Modafinil vs placebo adverse events, Outcome 4 Fatigue.

Comparison 7 Modafinil vs placebo adverse events, Outcome 5 Insomnia.

Comparison 7 Modafinil vs placebo adverse events, Outcome 6 Memory impairment.

Comparison 7 Modafinil vs placebo adverse events, Outcome 7 Nasopharyngitis.

Comparison 7 Modafinil vs placebo adverse events, Outcome 8 Nausea.

Comparison 7 Modafinil vs placebo adverse events, Outcome 9 Weight loss.
Comparison 7 Modafinil vs placebo adverse events, Outcome 10 Unknown.

Comparison 8 (−)‐OSU6162 vs placebo adverse events, Outcome 1 Nausea.
Comparison 9 Atomoxetine vs placebo adverse events, Outcome 1 Headache.
Comparison 9 Atomoxetine vs placebo adverse events, Outcome 2 Dry mouth.

Comparison 9 Atomoxetine vs placebo adverse events, Outcome 3 Globus pharyngeus.

Comparison 9 Atomoxetine vs placebo adverse events, Outcome 4 Hypertension.

Comparison 9 Atomoxetine vs placebo adverse events, Outcome 5 Insomnia.

Comparison 9 Atomoxetine vs placebo adverse events, Outcome 6 Irritable bowl.

Comparison 9 Atomoxetine vs placebo adverse events, Outcome 7 Loss of appetite.

Comparison 9 Atomoxetine vs placebo adverse events, Outcome 8 Nasal congestion.

Comparison 9 Atomoxetine vs placebo adverse events, Outcome 9 Shoulder pain.
Comparison 9 Atomoxetine vs placebo adverse events, Outcome 10 Urinary retention.

Comparison 10 Rivastigmine vs placebo adverse events, Outcome 1 Anxiety.

Comparison 10 Rivastigmine vs placebo adverse events, Outcome 2 Arthralgia.
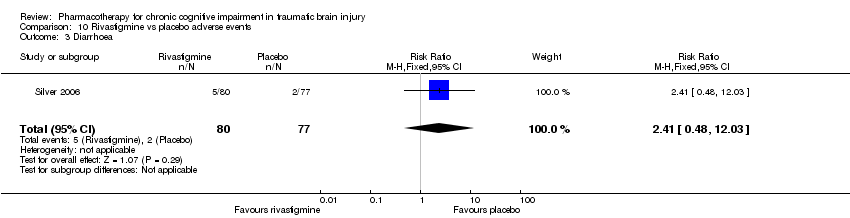
Comparison 10 Rivastigmine vs placebo adverse events, Outcome 3 Diarrhoea.

Comparison 10 Rivastigmine vs placebo adverse events, Outcome 4 Dizziness.

Comparison 10 Rivastigmine vs placebo adverse events, Outcome 5 Headache.

Comparison 10 Rivastigmine vs placebo adverse events, Outcome 6 Nausea.

Comparison 10 Rivastigmine vs placebo adverse events, Outcome 7 Upper respiratory tract infection.
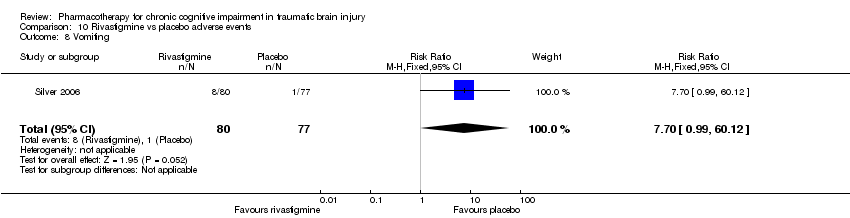
Comparison 10 Rivastigmine vs placebo adverse events, Outcome 8 Vomiting.
| Modafanil, (−)‐OSU6162, atomoxetine or rivastigmine compared to placebo for chronic cognitive impairment in traumatic brain injury | |||||
| Patient or population: Participants with chronic cognitive impairment in traumatic brain injury | |||||
| Outcomes | Effect of drug treatment for people with cognitive impairment in traumatic brain injury | Relative effect | No of Participants | Quality of the evidence | Comments |
| Cognitive performance on psychometric tests | The majority of sub‐tests showed no difference between treatment and placebo. Superiority over placebo was shown in one measure in Silver 2006 and several measures in Johansson 2012 and Johansson 2015. However, interpretation of these findings are cautioned. | See comment. | 274 (4 studies) | ⊕⊝⊝⊝ very low1,2,3 | Data synthesis was not possible due to the heterogeneity of studies. |
| Clinical global improvement | A single study reported no difference between treatment and placebo. | See comment. | 51 (1 study) | ⊕⊕⊝⊝ low1,3 | Data synthesis was not possible as only one study reported a measure on clinical global improvement. |
| Acceptability | No differences between treatment and placebo were found. | See comment. | 274(4 studies) | ⊕⊝⊝⊝ very low1,2,3 | Data synthesis was not possible due to the heterogeneity of studies. |
| Safety | More nausea was reported in participants receiving rivastigmine than placebo (Silver 2006). No other differences were found. | See comment. | 274 (4 studies) | ⊕⊝⊝⊝ very low1,2,3 | Data synthesis was not possible due to the heterogeneity of studies. |
| Mortality | No deaths were reported by any study. | Not estimable. | 274 (4 studies) | ‐ | |
| GRADE Working Group grades of evidence | |||||
| 1 downgraded one level due to serious indirectness, as two of four studies did not investigate cognitive impairment as a primary outcome 2 downgraded one level due to serious inconsistency, due to wide variance of point estimates. 3 downgraded one level due to serious imprecision, as the total population size was less than 400. | |||||
| Outcome or subgroup title | No. of studies | No. of participants | Statistical method | Effect size |
| 1 SF‐12 Physical Show forest plot | 1 | 51 | Mean Difference (IV, Fixed, 95% CI) | ‐2.18 [‐6.34, 1.98] |
| 2 SF‐12 Mental Show forest plot | 1 | 51 | Mean Difference (IV, Fixed, 95% CI) | 1.95 [‐2.84, 6.74] |
| 3 ImPACT verbal memory composite Show forest plot | 1 | 51 | Mean Difference (IV, Fixed, 95% CI) | 1.42 [‐4.42, 7.26] |
| 4 ImPACT visual memory composite Show forest plot | 1 | 51 | Mean Difference (IV, Fixed, 95% CI) | 0.25 [‐6.52, 7.02] |
| 5 ImPACT visual motor speed composite Show forest plot | 1 | 51 | Mean Difference (IV, Fixed, 95% CI) | ‐3.45 [‐6.48, ‐0.42] |
| 6 ImPACT reaction time composite Show forest plot | 1 | 51 | Mean Difference (IV, Fixed, 95% CI) | 0.02 [‐0.04, 0.08] |
| 7 CCPT‐II No. of omissions Show forest plot | 1 | 51 | Mean Difference (IV, Fixed, 95% CI) | 16.57 [‐3.59, 36.73] |
| 8 CCPT‐II No. of commissions Show forest plot | 1 | 51 | Mean Difference (IV, Fixed, 95% CI) | 2.00 [‐1.75, 5.75] |
| Outcome or subgroup title | No. of studies | No. of participants | Statistical method | Effect size |
| 1 SF‐12 Physical Show forest plot | 1 | 51 | Mean Difference (IV, Fixed, 95% CI) | ‐0.53 [‐5.46, 4.40] |
| 2 SF‐12 Mental Show forest plot | 1 | 51 | Mean Difference (IV, Fixed, 95% CI) | 0.41 [‐4.28, 5.10] |
| 3 ImPACT verbal memory composite Show forest plot | 1 | 51 | Mean Difference (IV, Fixed, 95% CI) | 4.11 [‐1.37, 9.59] |
| 4 ImPACT visual memory composite Show forest plot | 1 | 51 | Mean Difference (IV, Fixed, 95% CI) | ‐1.61 [‐8.97, 5.75] |
| 5 ImPACT visual motor speed composite Show forest plot | 1 | 51 | Mean Difference (IV, Fixed, 95% CI) | ‐1.44 [‐4.61, 1.73] |
| 6 ImPACT reaction time composite Show forest plot | 1 | 51 | Mean Difference (IV, Fixed, 95% CI) | ‐0.03 [‐0.08, 0.02] |
| 7 CCPT‐II No. of omissions Show forest plot | 1 | 51 | Mean Difference (IV, Fixed, 95% CI) | 15.67 [‐4.36, 35.70] |
| 8 CCPT‐II No. of commissions Show forest plot | 1 | 51 | Mean Difference (IV, Fixed, 95% CI) | 2.96 [‐0.47, 6.39] |
| Outcome or subgroup title | No. of studies | No. of participants | Statistical method | Effect size |
| 1 Trail Making Test A (seconds) Show forest plot | 1 | 6 | Mean Difference (IV, Fixed, 95% CI) | ‐9.20 [‐12.19, ‐6.21] |
| 2 Trail Making Test B (seconds) Show forest plot | 1 | 6 | Mean Difference (IV, Fixed, 95% CI) | ‐6.20 [‐7.81, ‐4.59] |
| 3 Trail Making Test C (seconds) Show forest plot | 1 | 6 | Mean Difference (IV, Fixed, 95% CI) | 28.4 [‐11.39, 68.19] |
| 4 Trail Making Test D (seconds) Show forest plot | 1 | 6 | Mean Difference (IV, Fixed, 95% CI) | 53.5 [36.76, 70.24] |
| 5 WAIS‐III Digit Symbol Coding Show forest plot | 1 | 6 | Mean Difference (IV, Fixed, 95% CI) | 8.6 [6.47, 10.73] |
| 6 WAIS‐III Digit‐Span Show forest plot | 1 | 6 | Mean Difference (IV, Fixed, 95% CI) | 1.30 [‐5.17, 7.77] |
| 7 FAS Verbal Fluency (total words) Show forest plot | 1 | 6 | Mean Difference (IV, Fixed, 95% CI) | ‐10.63 [‐27.30, 6.04] |
| Outcome or subgroup title | No. of studies | No. of participants | Statistical method | Effect size |
| 1 CDR Power of Attention (Milliseconds) Show forest plot | 1 | 53 | Mean Difference (IV, Fixed, 95% CI) | 5.31 [‐66.81, 77.43] |
| 2 CDR Continuity of Attention (% accuracy) Show forest plot | 1 | 53 | Mean Difference (IV, Fixed, 95% CI) | ‐0.25 [‐1.94, 1.44] |
| 3 CDR Efficiency (COA/POA, % accuracy/millisecond) Show forest plot | 1 | 53 | Mean Difference (IV, Fixed, 95% CI) | 0.76 [‐3.10, 4.62] |
| 4 Stroop Interference Trial 4 Show forest plot | 1 | 53 | Mean Difference (IV, Fixed, 95% CI) | 0.24 [‐2.27, 2.75] |
| 5 Adult ADHD Self‐Report Scale (ASRS‐v1.1.) Show forest plot | 1 | 53 | Mean Difference (IV, Fixed, 95% CI) | ‐1.19 [‐5.63, 3.25] |
| Outcome or subgroup title | No. of studies | No. of participants | Statistical method | Effect size |
| 1 HVLT‐total word recall Show forest plot | 1 | 157 | Mean Difference (IV, Fixed, 95% CI) | 0.21 [‐1.14, 1.56] |
| 2 HVLT‐delayed recall component retention, % Show forest plot | 1 | 157 | Mean Difference (IV, Fixed, 95% CI) | 1.06 [‐5.66, 7.78] |
| 3 HVLT–recognition discriminant index Show forest plot | 1 | 157 | Mean Difference (IV, Fixed, 95% CI) | ‐0.06 [‐0.78, 0.66] |
| 4 CANTAB RVIP’A Show forest plot | 1 | 157 | Mean Difference (IV, Fixed, 95% CI) | ‐0.01 [‐0.03, 0.00] |
| 5 CANTAB–SWM, total errors Show forest plot | 1 | 157 | Mean Difference (IV, Fixed, 95% CI) | 1.05 [‐5.85, 7.95] |
| 6 CANTAB RVIP, mean latency, ms Show forest plot | 1 | 157 | Mean Difference (IV, Fixed, 95% CI) | ‐44.54 [‐88.62, ‐0.46] |
| 7 CANTAB‐RT, simple reaction time, ms Show forest plot | 1 | 157 | Mean Difference (IV, Fixed, 95% CI) | ‐19.81 [‐59.23, 19.61] |
| 8 CANTAB‐PAL, total errors Show forest plot | 1 | 157 | Mean Difference (IV, Fixed, 95% CI) | ‐3.16 [‐10.75, 4.43] |
| 9 COWA–semantic association fluency Show forest plot | 1 | 157 | Mean Difference (IV, Fixed, 95% CI) | 0.27 [‐0.97, 1.51] |
| 10 Trail Making Test A (seconds) Show forest plot | 1 | 157 | Mean Difference (IV, Fixed, 95% CI) | ‐2.83 [‐7.38, 1.72] |
| 11 Trail Making Test B (seconds) Show forest plot | 1 | 157 | Mean Difference (IV, Fixed, 95% CI) | 3.48 [‐6.31, 13.27] |
| 12 WAIS‐III‐DS scaled score Show forest plot | 1 | 157 | Mean Difference (IV, Fixed, 95% CI) | 0.22 [‐0.33, 0.77] |
| Outcome or subgroup title | No. of studies | No. of participants | Statistical method | Effect size |
| 1 Modafinil vs placebo Show forest plot | 1 | 51 | Risk Ratio (M‐H, Fixed, 95% CI) | 4.46 [0.22, 88.61] |
| 2 Rivastigmine vs placebo Show forest plot | 1 | 157 | Risk Ratio (M‐H, Fixed, 95% CI) | 0.74 [0.35, 1.59] |
| 3 (‐)‐OSU6162 vs placebo Show forest plot | 1 | 6 | Odds Ratio (M‐H, Fixed, 95% CI) | 0.0 [0.0, 0.0] |
| 4 Atomoxetine vs placebo Show forest plot | 1 | 56 | Odds Ratio (M‐H, Fixed, 95% CI) | 0.0 [0.0, 0.0] |
| Outcome or subgroup title | No. of studies | No. of participants | Statistical method | Effect size |
| 1 Dizziness Show forest plot | 1 | 51 | Risk Ratio (M‐H, Fixed, 95% CI) | 3.56 [0.43, 29.66] |
| 2 Dysgeusia Show forest plot | 1 | 51 | Risk Ratio (M‐H, Fixed, 95% CI) | 4.46 [0.22, 88.61] |
| 3 Dyspepsia Show forest plot | 1 | 51 | Risk Ratio (M‐H, Fixed, 95% CI) | 4.46 [0.22, 88.61] |
| 4 Fatigue Show forest plot | 1 | 51 | Risk Ratio (M‐H, Fixed, 95% CI) | 4.44 [0.56, 35.41] |
| 5 Insomnia Show forest plot | 1 | 51 | Risk Ratio (M‐H, Fixed, 95% CI) | 2.67 [0.59, 11.99] |
| 6 Memory impairment Show forest plot | 1 | 51 | Risk Ratio (M‐H, Fixed, 95% CI) | 4.46 [0.22, 88.61] |
| 7 Nasopharyngitis Show forest plot | 1 | 51 | Odds Ratio (M‐H, Fixed, 95% CI) | 0.16 [0.01, 3.59] |
| 8 Nausea Show forest plot | 1 | 51 | Risk Ratio (M‐H, Fixed, 95% CI) | 2.67 [0.30, 23.96] |
| 9 Weight loss Show forest plot | 1 | 51 | Risk Ratio (M‐H, Fixed, 95% CI) | 4.46 [0.22, 88.61] |
| 10 Unknown Show forest plot | 1 | 51 | Risk Ratio (M‐H, Fixed, 95% CI) | 4.46 [0.22, 88.61] |
| Outcome or subgroup title | No. of studies | No. of participants | Statistical method | Effect size |
| 1 Nausea Show forest plot | 1 | 6 | Odds Ratio (M‐H, Fixed, 95% CI) | 0.24 [0.01, 8.62] |
| Outcome or subgroup title | No. of studies | No. of participants | Statistical method | Effect size |
| 1 Headache Show forest plot | 1 | 56 | Odds Ratio (M‐H, Fixed, 95% CI) | 0.35 [0.01, 8.85] |
| 2 Dry mouth Show forest plot | 1 | 56 | Odds Ratio (M‐H, Fixed, 95% CI) | 5.78 [0.27, 126.14] |
| 3 Globus pharyngeus Show forest plot | 1 | 56 | Odds Ratio (M‐H, Fixed, 95% CI) | 3.34 [0.13, 85.56] |
| 4 Hypertension Show forest plot | 1 | 56 | Odds Ratio (M‐H, Fixed, 95% CI) | 3.34 [0.13, 85.56] |
| 5 Insomnia Show forest plot | 1 | 56 | Odds Ratio (M‐H, Fixed, 95% CI) | 5.78 [0.27, 126.14] |
| 6 Irritable bowl Show forest plot | 1 | 56 | Odds Ratio (M‐H, Fixed, 95% CI) | 3.34 [0.13, 85.56] |
| 7 Loss of appetite Show forest plot | 1 | 56 | Odds Ratio (M‐H, Fixed, 95% CI) | 3.34 [0.13, 85.56] |
| 8 Nasal congestion Show forest plot | 1 | 56 | Odds Ratio (M‐H, Fixed, 95% CI) | 3.34 [0.13, 85.56] |
| 9 Shoulder pain Show forest plot | 1 | 56 | Odds Ratio (M‐H, Fixed, 95% CI) | 3.34 [0.13, 85.56] |
| 10 Urinary retention Show forest plot | 1 | 56 | Odds Ratio (M‐H, Fixed, 95% CI) | 3.34 [0.13, 85.56] |
| Outcome or subgroup title | No. of studies | No. of participants | Statistical method | Effect size |
| 1 Anxiety Show forest plot | 1 | 157 | Risk Ratio (M‐H, Fixed, 95% CI) | 8.67 [0.47, 158.32] |
| 2 Arthralgia Show forest plot | 1 | 157 | Risk Ratio (M‐H, Fixed, 95% CI) | 1.93 [0.36, 10.21] |
| 3 Diarrhoea Show forest plot | 1 | 157 | Risk Ratio (M‐H, Fixed, 95% CI) | 2.41 [0.48, 12.03] |
| 4 Dizziness Show forest plot | 1 | 157 | Risk Ratio (M‐H, Fixed, 95% CI) | 7.7 [0.99, 60.12] |
| 5 Headache Show forest plot | 1 | 157 | Risk Ratio (M‐H, Fixed, 95% CI) | 0.86 [0.35, 2.10] |
| 6 Nausea Show forest plot | 1 | 157 | Risk Ratio (M‐H, Fixed, 95% CI) | 3.05 [1.29, 7.22] |
| 7 Upper respiratory tract infection Show forest plot | 1 | 157 | Risk Ratio (M‐H, Fixed, 95% CI) | 2.17 [0.70, 6.74] |
| 8 Vomiting Show forest plot | 1 | 157 | Risk Ratio (M‐H, Fixed, 95% CI) | 7.7 [0.99, 60.12] |