Scolaris Content Display Scolaris Content Display

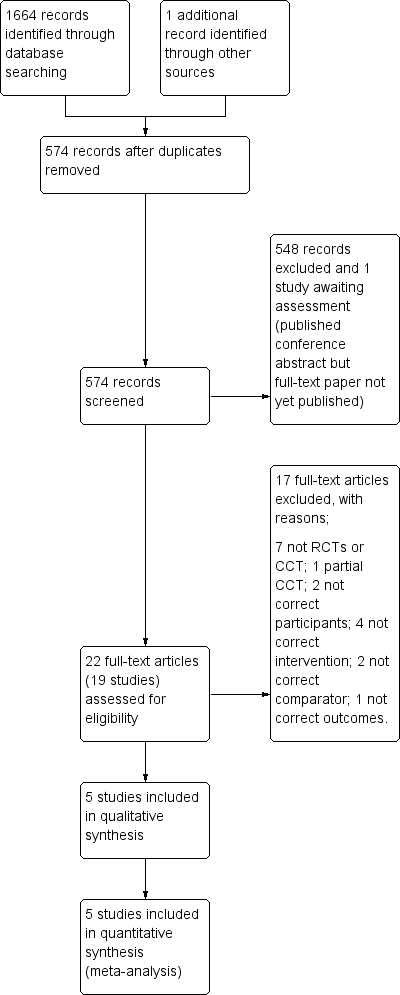
Study flow diagram.
Figuras y tablas -
Figure 1

Study flow diagram.

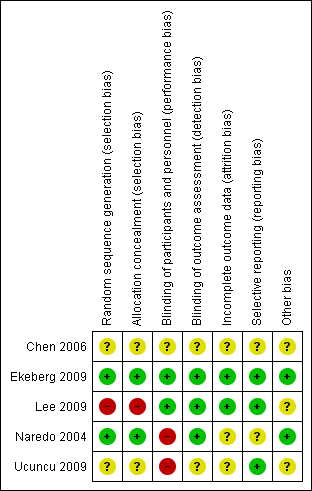
Risk of bias summary: review authors' judgements about each risk of bias item for each included study.
Figuras y tablas -
Figure 2

Risk of bias summary: review authors' judgements about each risk of bias item for each included study.

Comparison 1 Ultrasound‐guided injection versus landmark or systemic injection, Outcome 1 Overall pain (or daytime, activity‐related or unspecified).
Figuras y tablas -
Analysis 1.1

Comparison 1 Ultrasound‐guided injection versus landmark or systemic injection, Outcome 1 Overall pain (or daytime, activity‐related or unspecified).

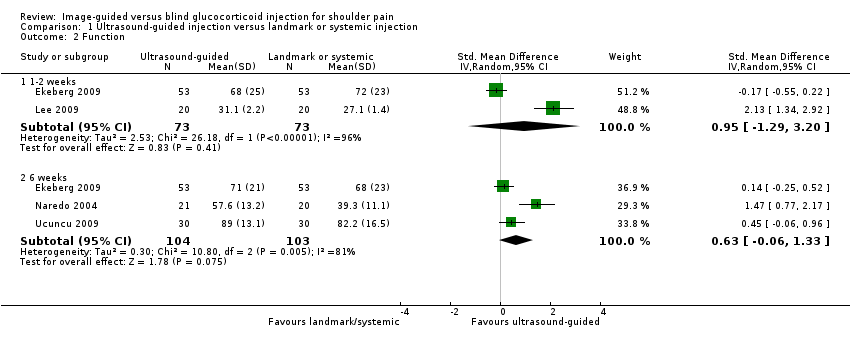
Comparison 1 Ultrasound‐guided injection versus landmark or systemic injection, Outcome 2 Function.
Figuras y tablas -
Analysis 1.2

Comparison 1 Ultrasound‐guided injection versus landmark or systemic injection, Outcome 2 Function.

Comparison 1 Ultrasound‐guided injection versus landmark or systemic injection, Outcome 3 Proportion of patients showing 50% improvement at 6 weeks.
Figuras y tablas -
Analysis 1.3

Comparison 1 Ultrasound‐guided injection versus landmark or systemic injection, Outcome 3 Proportion of patients showing 50% improvement at 6 weeks.

Comparison 1 Ultrasound‐guided injection versus landmark or systemic injection, Outcome 4 Range of abduction.
Figuras y tablas -
Analysis 1.4

Comparison 1 Ultrasound‐guided injection versus landmark or systemic injection, Outcome 4 Range of abduction.

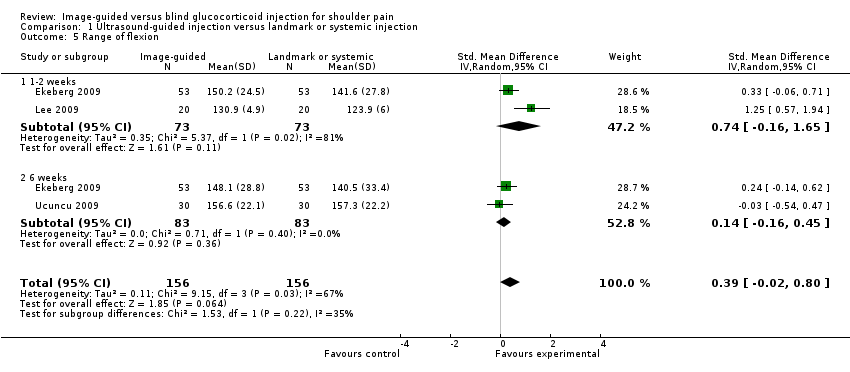
Comparison 1 Ultrasound‐guided injection versus landmark or systemic injection, Outcome 5 Range of flexion.
Figuras y tablas -
Analysis 1.5

Comparison 1 Ultrasound‐guided injection versus landmark or systemic injection, Outcome 5 Range of flexion.

Comparison 1 Ultrasound‐guided injection versus landmark or systemic injection, Outcome 6 Number of adverse events.
Figuras y tablas -
Analysis 1.6

Comparison 1 Ultrasound‐guided injection versus landmark or systemic injection, Outcome 6 Number of adverse events.

Comparison 2 Sensitivity analysis (adequate treatment allocation concealment, and blinding), Outcome 1 Overall Pain.
Figuras y tablas -
Analysis 2.1

Comparison 2 Sensitivity analysis (adequate treatment allocation concealment, and blinding), Outcome 1 Overall Pain.

Comparison 2 Sensitivity analysis (adequate treatment allocation concealment, and blinding), Outcome 2 Function.
Figuras y tablas -
Analysis 2.2

Comparison 2 Sensitivity analysis (adequate treatment allocation concealment, and blinding), Outcome 2 Function.

Summary of findings for the main comparison. Ultrasound‐guided injection compared to landmark or systemic injection for shoulder pain

Ultrasound‐guided injection compared to landmark or intramuscular injection for shoulder pain

Patient or population: Patients with shoulder pain
Settings: International; clinic/hospital
Intervention: Ultrasound‐guided injection
Comparison: Landmark or intramuscular injection

Outcomes

Illustrative comparative risks* (95% CI)

Relative effect
(95% CI)

No of Participants
(studies)

Quality of the evidence
(GRADE)

Comments

Assumed risk

Corresponding risk

Landmark or intramuscular injection

Ultrasound‐guided injection

Overall Pain ‐ 1 to 2 weeks (adequate allocation concealment, and blinding)
visual analogue scale; 1 to 9 points (higher indicates worse pain)

4.5 points

Mean pain

0.20 points lower
(1.04 points lower to 0.64 points higher)

106
(1 study)

⊕⊕⊕⊝
moderate2

Absolute risk difference ‐2% (‐12 to 7%); relative percent change ‐3% (‐16 to 10%); NNT n/a1

Overall Pain ‐ 6 weeks (adequate allocation concealment, and blinding)
visual analogue scale; 1 to 9 points (higher indicates worse pain)

4.6 points

Mean pain
0.60 points lower
(1.44 lower to 0.24 higher)

106
(1 study)

⊕⊕⊕⊝
moderate2

Absolute risk difference ‐7% (‐16 to 3%); relative percent change ‐10% (‐23 to 4%); NNT n/a1

Function ‐ 1 to 2 weeks (adequate allocation concealment, and blinding)

Disability of Arm, Shoulder, Hand (DASH) scale; 0 to 100 points (lower score indicates better function)

28 points

Mean function
4 points higher
(5.15 lower to 13.15 higher)

106
(1 study)

⊕⊕⊕⊝
moderate2

Absolute risk difference 4% (‐13 to 5%); relative percent change 8% (‐27 to 11%); NNT n/a1

Function ‐ 6 weeks (adequate allocation concealment, and blinding)

DASH scale; 0 to 100 points (lower score indicates better function)

32 points

Mean function
3 points lower
(11.38 lower to 5.38 higher)

147
(2 studies)

⊕⊕⊕⊝
moderate3

Absolute risk difference ‐3% (‐11 to 5%); relative percent change ‐6% (‐22 to 11%), NNT n/a1

Participant‐assessed success ‐ not measured

See comment

See comment

Not estimable

See comment

This outcome was not measured in the trials

Number of adverse events ‐ 6 weeks
Follow‐up: 6 weeks

Study population

RR 0.55
(0.17 to 1.85)

207
(3 studies)

⊕⊕⊕⊝
moderate4

Absolute risk difference 7% fewer events in the image‐guided group (16% fewer to 2% more); relative percent change ‐45% (‐83 to 85%); NNT n/a1,3

155 per 1000

85 per 1000
(26 to 287)

Medium risk population

170 per 1000

94 per 1000
(29 to 315)

Serious adverse events ‐ not reported

See comment

See comment

Not estimable

See comment

One trial (Ekeberg) reported that there were no serious side effects. The remaining trials did not report the incidence of serious adverse events

*The basis for the assumed risk (e.g. the median control group risk across studies) is provided in footnotes. The corresponding risk (and its 95% confidence interval) is based on the assumed risk in the comparison group and the relative effect of the intervention (and its 95% CI).
CI: Confidence interval; RR: Risk ratio;

GRADE Working Group grades of evidence
High quality: Further research is very unlikely to change our confidence in the estimate of effect.
Moderate quality: Further research is likely to have an important impact on our confidence in the estimate of effect and may change the estimate.
Low quality: Further research is very likely to have an important impact on our confidence in the estimate of effect and is likely to change the estimate.
Very low quality: We are very uncertain about the estimate.

1 Number needed to treat (NNT)=not applicable (n/a) when result is not statistically significant. NNT for dichotomous outcomes calculated using Cates NNT calculator (http://www.nntonline.net/visualrx/). NNT for continuous outcomes calculated using Wells Calculator (CMSG editorial office)

2 Potential imprecision due to availability of only 1 trial of 106 participants, and possibility of publication bias
3 Two trials did not adequately conceal treatment allocation, and two did not blind participants
4 Three trials reported adverse events; one trial (Chen 2006) did not report this outcome

Figuras y tablas -
Summary of findings for the main comparison. Ultrasound‐guided injection compared to landmark or systemic injection for shoulder pain
Table 1. Characteristics of included trials


N

Study population

Ultrasound‐guided injection

Landmark‐guided injection

Content of injection

Outcomes

Chen 2006

(Taiwan)

CCT

40

Ultrasound‐confirmed subacromial bursitis

Subacromial bursa by one physician experienced using ultrasound probes

Subacromial bursa by one physician experienced in peripheral joint and soft‐tissue injections

Both groups received 1ml betamethasone and 1ml 1% lignocaine

1. Range of abduction

Ekeberg 2009 (Norway)

RCT

106

Rotator cuff disease

Subacromial bursa by single physician

Intramuscular injection upper gluteal region by same physician

‘Local’ group: 2ml (20mg) triamcinolone and 5ml (10mg/ml) lidocaine to subacromial bursa and 4ml (10mg/ml) lidocaine to gluteal

‘Systemic’ group: 5ml (10mg/ml) lidocaine to subacromial bursa and 2ml (20mg) triamcinolone and 2ml (10mg/ml) lidocaine to gluteal

1. SPADI
2. Western Ontario Rotator Cuff Index

3. Active abduction and flexion

4. Self‐assessment of change in main complaint

5. Pain at rest

6. Pain with activity

7. Adverse events

Lee 2009

(South Korea)

CCT

43

Adhesive capsulitis

Intraarticular injection into the glenohumeral joint by one physician with two years experience in ultrasound‐guided shoulder injections

Intraarticular injection by one physician with 7 years experience in anatomic landmark‐guided shoulder injections

Both groups received 0.5ml (20mg) triamcinolone and 1.5ml 2% lidocaine and 3ml normal saline

1. Pain in daytime

2. Pain just before sleep

3. Passive abduction, flexion, extension, internal and external rotation

4. Functional activities of the shoulder

Naredo 2004 (Spain)

RCT

41

‘Periarticular disorders’ (impingement syndrome rotator cuff lesions, subacromial‐subdeltoid bursitis and/or biceps tendon abnormalities)

Either subacromial‐subdeltoid bursa, biceps tendon sheath or rotator cuff calcifications according to ultrasound findings by single rheumatologists experienced in ultrasound

Subacromial space by same rheumatologist

Bother groups received 20mg triamcinolone

1. Pain in previous week

2. Shoulder Function Assessment (SFA) scale

3. Presence of nocturnal pain

4. Intake of NSAIDs

5. Number of participants 50% improvement in pain

6. Number of participants 50% improvement in SFA score

7. Active and passive abduction, flexion, internal and external rotation

8. Adverse effects

Ucuncu 2009

(Turkey)

RCT

60

‘Soft‐tissue lesions’ (acromioclavicular degeneration, rotator cuff lesions (rupture, partial rupture, tendinosis, impingement, calcification), fluid accumulation or partial rupture of biceps tendon and bursitis (subdeltoid, subacromial)

‘Perilesionally’ and ‘intralesionally’; personnel not specified

Subacromial region; personnel not specified

Both groups received 1ml (40mg) triamcinolone and 1ml 1% lidocaine

1. Pain

2. Constant score

3. Active and passive abduction and flexion

4. Adverse events

Figuras y tablas -
Table 1. Characteristics of included trials
Comparison 1. Ultrasound‐guided injection versus landmark or systemic injection

Outcome or subgroup title

No. of studies

No. of participants

Statistical method

Effect size

1 Overall pain (or daytime, activity‐related or unspecified) Show forest plot

4

Std. Mean Difference (IV, Random, 95% CI)

Subtotals only

1.1 1‐2 weeks

2

146

Std. Mean Difference (IV, Random, 95% CI)

‐1.44 [‐4.14, 1.26]

1.2 6 weeks

3

207

Std. Mean Difference (IV, Random, 95% CI)

‐0.80 [‐1.46, ‐0.14]

2 Function Show forest plot

4

Std. Mean Difference (IV, Random, 95% CI)

Subtotals only

2.1 1‐2 weeks

2

146

Std. Mean Difference (IV, Random, 95% CI)

0.95 [‐1.29, 3.20]

2.2 6 weeks

3

207

Std. Mean Difference (IV, Random, 95% CI)

0.63 [‐0.06, 1.33]

3 Proportion of patients showing 50% improvement at 6 weeks Show forest plot

1

Risk Ratio (M‐H, Fixed, 95% CI)

Totals not selected

3.1 Pain

1

Risk Ratio (M‐H, Fixed, 95% CI)

0.0 [0.0, 0.0]

3.2 Function

1

Risk Ratio (M‐H, Fixed, 95% CI)

0.0 [0.0, 0.0]

4 Range of abduction Show forest plot

4

Mean Difference (IV, Random, 95% CI)

Subtotals only

4.1 1‐2 weeks

3

186

Mean Difference (IV, Random, 95% CI)

19.77 [4.29, 35.26]

4.2 6 weeks

2

166

Mean Difference (IV, Random, 95% CI)

6.45 [‐3.24, 16.15]

5 Range of flexion Show forest plot

3

312

Std. Mean Difference (IV, Random, 95% CI)

0.39 [‐0.02, 0.80]

5.1 1‐2 weeks

2

146

Std. Mean Difference (IV, Random, 95% CI)

0.74 [‐0.16, 1.65]

5.2 6 weeks

2

166

Std. Mean Difference (IV, Random, 95% CI)

0.14 [‐0.16, 0.45]

6 Number of adverse events Show forest plot

3

Risk Ratio (M‐H, Random, 95% CI)

Subtotals only

6.1 6 weeks

3

207

Risk Ratio (M‐H, Random, 95% CI)

0.55 [0.17, 1.85]

Figuras y tablas -
Comparison 1. Ultrasound‐guided injection versus landmark or systemic injection
Comparison 2. Sensitivity analysis (adequate treatment allocation concealment, and blinding)

Outcome or subgroup title

No. of studies

No. of participants

Statistical method

Effect size

1 Overall Pain Show forest plot

1

Mean Difference (IV, Random, 95% CI)

Totals not selected

1.1 1‐2 weeks

1

Mean Difference (IV, Random, 95% CI)

0.0 [0.0, 0.0]

1.2 6 weeks

1

Mean Difference (IV, Random, 95% CI)

0.0 [0.0, 0.0]

2 Function Show forest plot

1

Mean Difference (IV, Random, 95% CI)

Totals not selected

2.1 1‐2 weeks

1

Mean Difference (IV, Random, 95% CI)

0.0 [0.0, 0.0]

2.2 6 weeks

1

Mean Difference (IV, Random, 95% CI)

0.0 [0.0, 0.0]

Figuras y tablas -
Comparison 2. Sensitivity analysis (adequate treatment allocation concealment, and blinding)